Nucleic Acids Structures 1-Discovery of DNA structure 2- A, B and Z conformations of dsDNA/dsRNA • Not treated: - DNA topology - DNA Sequencing Principles of DNA Recognition by quence-specific DNA binding proteins Principles of Nucleic Acids naturation 3- DNA tertiary Structures Nucleosome, G-quadruplex 4- Secondary and tertiary Structure of RNA
Transcript
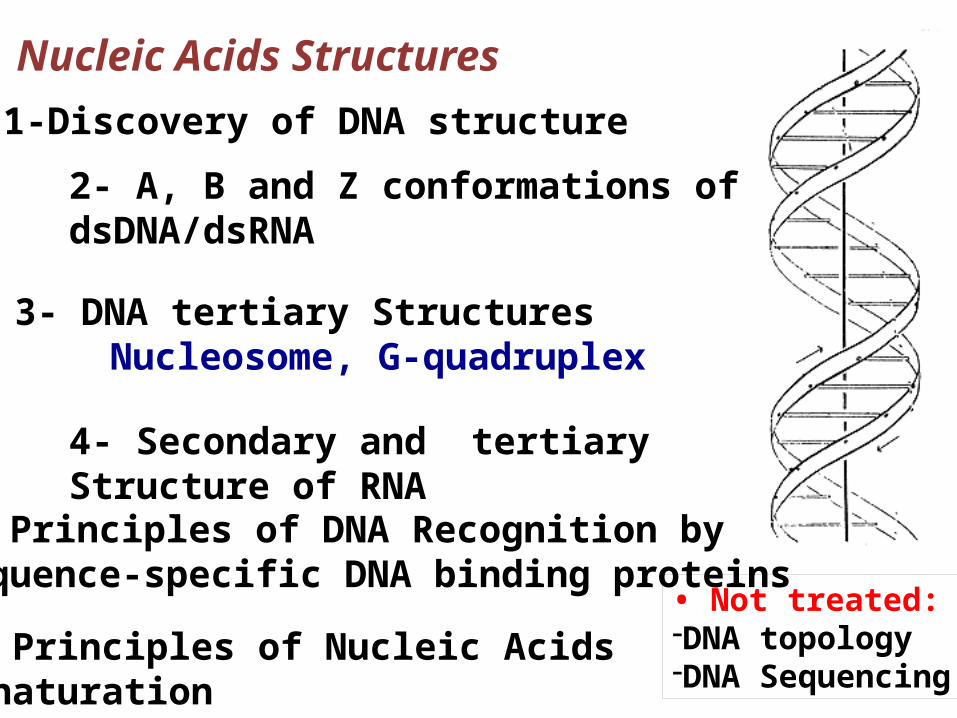
Nucleic Acids Structures1-Discovery of DNA structure
2- A, B and Z conformations of dsDNA/dsRNA
• Not treated:-DNA topology-DNA Sequencing
5- Principles of DNA Recognition by sequence-specific DNA binding proteins
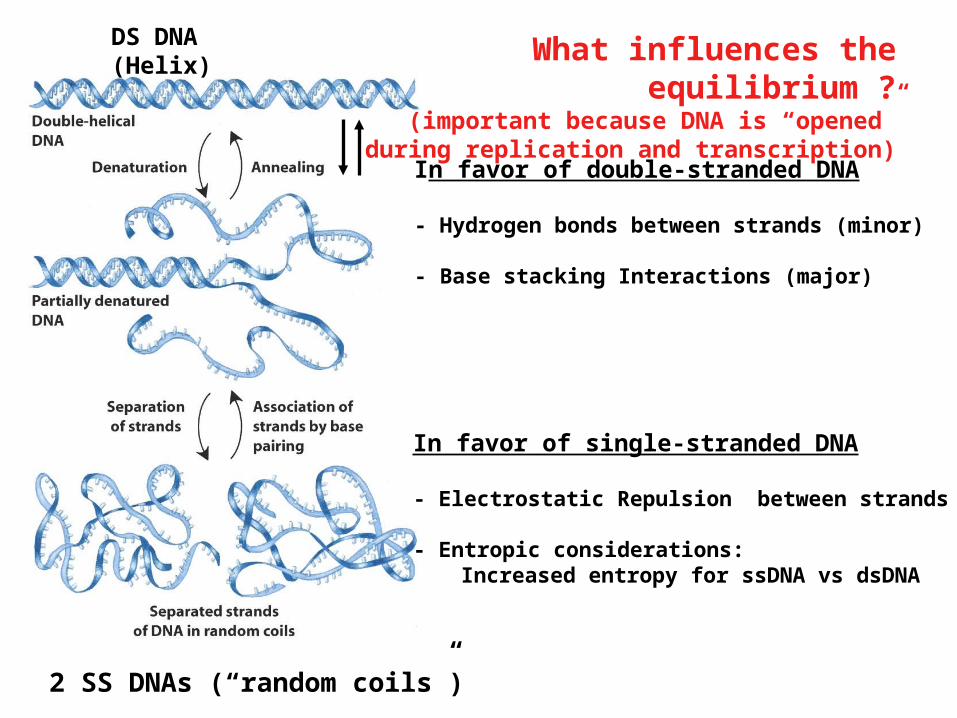
6- Principles of Nucleic Acids Denaturation
3- DNA tertiary StructuresNucleosome, G-quadruplex
4- Secondary and tertiary Structure of RNA
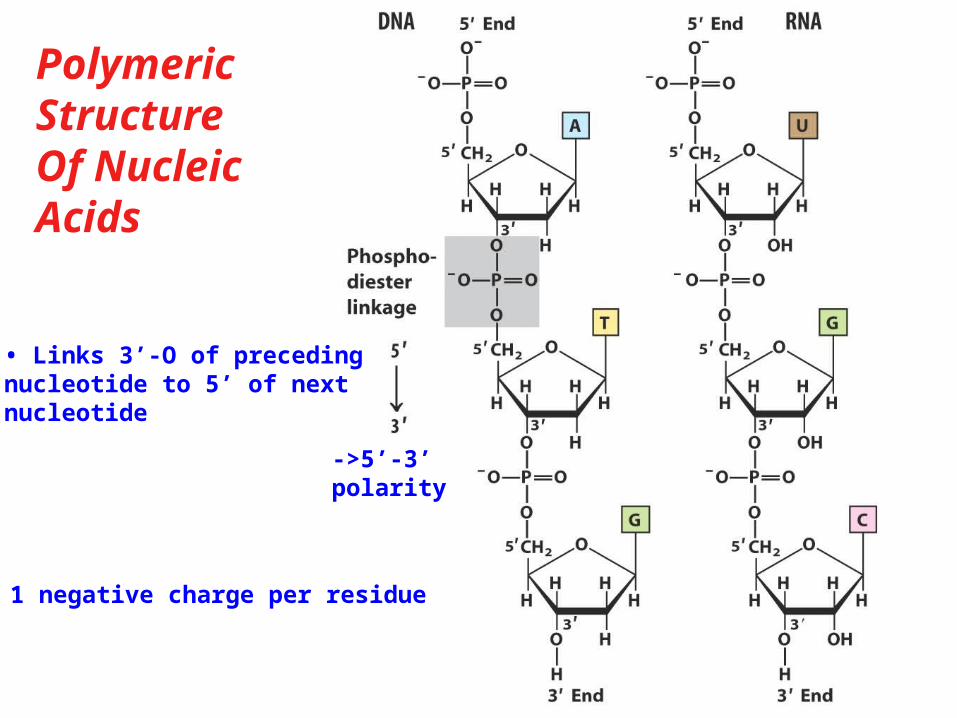
Polymeric StructureOf Nucleic Acids
• Links 3’-O of precedingnucleotide to 5’ of nextnucleotide
• 1 negative charge per residue
->5’-3’polarity
Watson and Crick (1953)
Rosalind Franklin(1950 or 1951)Chargaff. 1950: “It is, however, noteworthy
-whether this is more than accidental, cannot yet be said-that in all deoxypentose nucleic acids examined thus far the molar ratios of total purines to total pyrimidines,and also of adenine to thymine and of guanine to cytosine, were not far from 1”.
Watson and Crick (1953): “It has not escaped our notice that the specific pairing we have postulated immediately suggests a possible copying mechanism for the genetic material”.
2) bases are in the keto conformation1) R. Franklin DNA fibers X-ray diffraction data
Spacing between
Phosphates = 3.4A
Helical Pitch = 34A
Maltese CrossIndicates an
Helical pattern
3) Chargaff’s rules:(G+C)/(A+T) can vary But (G+A)/(C+T) = G/C = A/T =1
4) Density measurements:~2 polymers/helix
5) C2’ endo sugar puckerconformation
Information that Watson and Crick used to propose the double helix model:
keto enol
Bragg’s Law: 2dsin Q = nl used to interpret X-ray diffraction pictures
Bragg's Law
Bragg’s law indicates an inverse relationship between diffraction angle and actual distances between repeated features in crystal/fiber
= repeated atomic features in the crystal or fiber
Rise/residue= 3.4 A
HelicalPitch= 34 A(10
residues/turn)
Essential features of the model thatproved correct:
1) Antiparallel right-handed double helix
2) Strands are linked by complementary sets ofdonors and acceptor groupson bases
The original model for DNA structureWatson and Crick (1953)
Nature 171, 964-967
complementary sets of donors and acceptor groups on bases
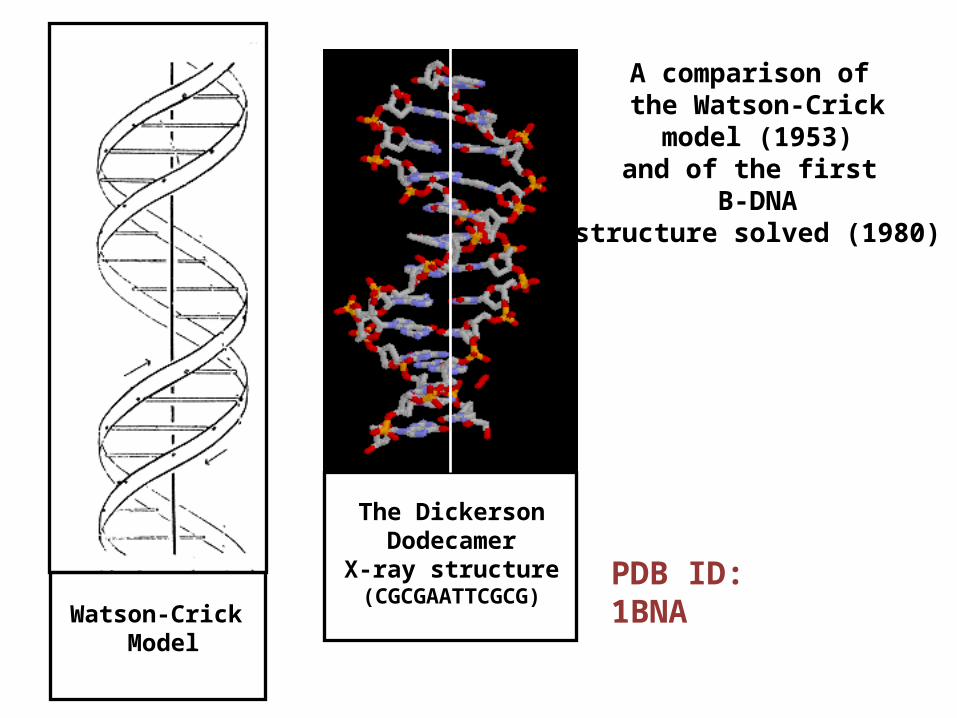
Watson-Crick Model
The DickersonDodecamer
X-ray structure(CGCGAATTCGCG)
A comparison of the Watson-Crick
model (1953)and of the first
B-DNA structure solved (1980)
PDB ID:1BNA
DNA Double HelixDefinitions
Bases Orientation
Pseudo Dyad Axis
Base pairs seenfrom above the helix(helical projection)
N3
N1
N
OdR
H
H
N3
N1
N7
N9
dR
O
H
N H
H
Major Groove>180°
Minor Groove<180°
Helical Axis
HN
N3
N1
N7
N9
dR
H
CH3
N1
N3
O
H
OdR
TA
N1
N3
N H
OdR
N3
N1
N7
N9
dR
O
N
H
H
H
H
GC
N3
N1
N
OdR
H
H
N3
N1
N7
N9
dR
O
H
N H
H
G C
CH3
N1
N3
O
H
OdR
H N
N3
N1
N7
N9
dR
H
AT
CH3
N1
N3
O
H
O
T
N3
N1
N7
N9
O
H
N H
H
G
dR
dR
N3
N1
N
OdR
H
H
N3
N1
N7
N9
dR
O
H
N H
H
G C
Isostericity of Watson-Crick Base Pairs (and non isostericity of non WC base pairs)
Example of a G-T non WC base pair
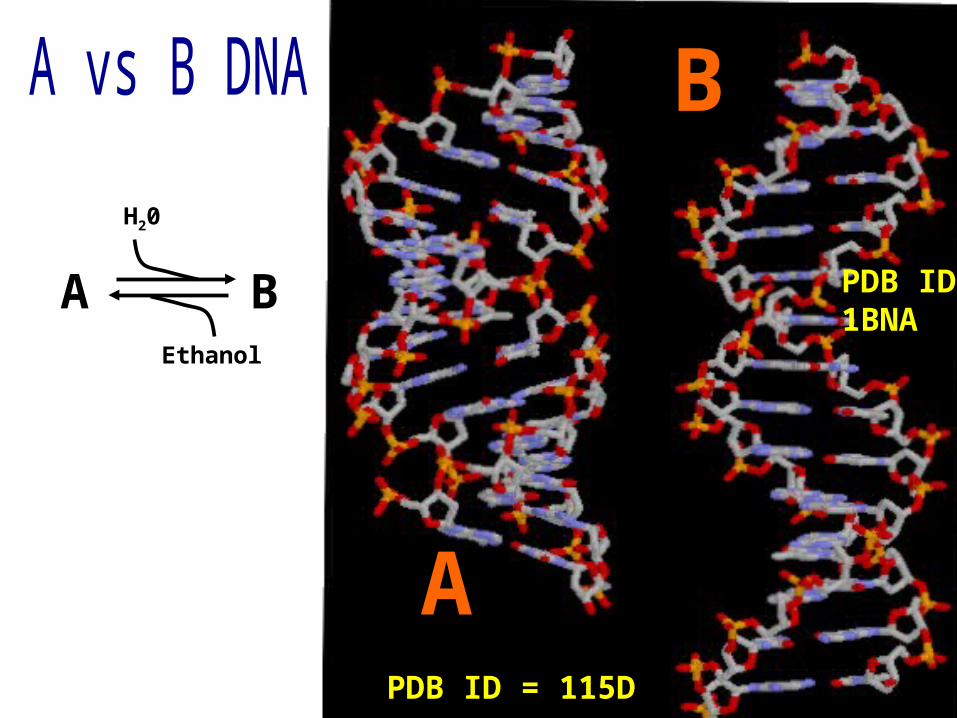
A
B
A B
H20
Ethanol
PDB ID = 115D
PDB ID:1BNA
Major differences : - A DNA is shorter than B DNA: 1 helix turn is 28.6A vs 34 A for B DNA. This is due to the 3’ endo sugar pucker in A
- The Bases of A-DNA are shifted away from the helical axis. This results in a deep major groove and in a shallow minor groove. There is a 6 A hole in a helical projection.
Sugar Pucker
C3’endo
C2’endo
Planar
BA
helical projection
B- DNA A- DNA
Sugar pucker C2'-endo C3'-endo
Rise/residue 3.4 Å 2.6 Å
Residues/turn 10.5 11
Helical twist 34˚ 33˚
Diameter 20 Å 26 Å
Tilt 6˚ 20˚
Propellor twist 12 ̊ 15 ̊
Exact values need not to be remembered…
Sugar puckering: C2’ endo or C3’ endo
7 Å 5.9 Å
Distance between Consecutive Phosphates:
dsRNA or A-DNA : C3’ endoB-DNA: C2’ endo
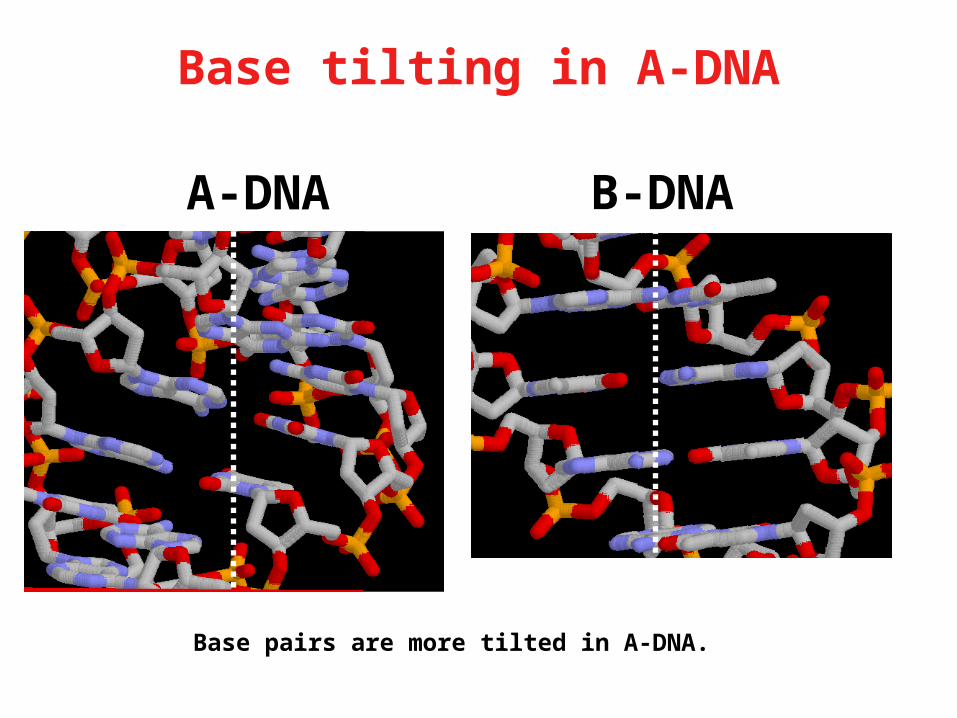
A-DNA B-DNA
Base tilting in A-DNA
Base pairs are more tilted in A-DNA.
A water spine (green dots)has been proposed to exist
in the minor groove of B-DNA that would stabilize the B-form
H20 is essentialin the transition
A <--> B DNA
A B
H20
This concept is controversialand will not be detailed further
Z-DNALeft handed Helix
jagged backbone
Occurs in DNAsequences with stretches of consecutiveG-C base pairs
Requires high saltin vitro
G nucleotides:Switch C2’endo -> C3’ endoanti -> Syn
C nucleotides:No change
www.mun.ca/biology/scarr/A_B_Z_DNA.html
PDB ID:1DCG
Nucleotides flipping and grooves in Z-DNA
Major
Minor
Major
Minor
Z-DNA
B-DNA Note: this simplified diagram only summarizes the conformationchanges during the B->Z transition – it does not accurately shows the Z structure
Glycosidic bond Anti /Syn conformationsAnti and Syn conformations are defined based on the torsion angle of the glycosidic bond
4'1'
94
The sequence of atoms chosen to define the torsion angle to define anti/syn conformation is: O4'-C1'-N9-C4 for purines - O4'-C1'-N1-C2 for pyrimidines.
4'1'
9 4
4'1'
1 2
Anti A/G: C1’-O4’ and N9-C4 are pointing away from each other
Anti C/T: C1’-O4’ and N1-C2 are
pointing away from each other
Syn A/G: C1’-O4’ and N9-C4 are
pointing in same direction
Syn- A
4'1'
9
4 4'
1'9
4
4'1'
94 4'
1'9
4
Anti A/G: C1’-O4’ and N9-C4 are pointing
away from each other
Syn A/G: C1’-O4’ and N9-C4 are
pointing in same direction
Anti /Syn conformations in pseudo-3D
A B Z
B ZABZ-DNAs
BackboneProfiles
HelicalProjections
A B Z
www.mun.ca/biology/scarr/A_B_Z_DNA.html
• There are conformations other than A/B/Z e.g.: conformations intermediate between A and B
Also Tertiary conformation of DNA
Why Study DNA Structure ?
• Structure and Sequence Recognition by DNA binding proteins
• Some non B-DNA structures are biologically relevant - dehydrated living forms- dsRNA is A form (see PDB: 2KYD)- DNA/RNA duplex (replication, transcription) is A form- Z-DNA might be associated with promoter elements, regulatory sequences
Binding of histones to DNA through electrostatic interactions:Histones are + charged, DNA is - charged
Double-Stranded DNA is wrapped around nucleosomes in eukaryotic cells
http://www.bio.miami.edu/dana/104/nucleosome.jpg
Consequences for: DNA Replication,DNA RepairTranscription
Double-Stranded DNA is wrapped around nucleosomes in eukaryotic cells