72
Nufarm Strategy Overview April, 2016 Investor briefing
| Date post: | 09-Apr-2018 |
| Category: |
Documents |
| Upload: | truongtuong |
| View: | 214 times |
| Download: | 0 times |

Nufarm Strategy
Overview
April, 2016
Investor briefing

Investor Day
Time Activity / Event Presenter
09:30 Introduction Mark Keating
09:35 Group strategy Greg Hunt
10:00 Supply chain excellence Elbert Prado
10:15 Portfolio (inc. phenoxy business overview) Niels Pörksen
10:30 Customer excellence Michelle Monteiro
10:45 Morning tea
11:00 Australia / New Zealand Lachie McKinnon
11:15 Latin America Marcos Gaio
11:30 Nuseed Brent Zacharias
11:45 Question time Leadership team
12:30 Lunch
13:30 Plant tour (optional)
14:00 Close
Agenda

Disclaimer
General
This presentation has been prepared by Nufarm Limited. The information contained in this presentation is for informational purposes only.
The information contained in this presentation is not investment or financial product advice and is not intended to be used as the basis for
making an investment decision. The presentation is not intended (nor does it) constitute an offer or invitation by or on behalf of Nufarm
Limited, its subsidiaries, or any other person to subscribe for, purchase or otherwise deal in any securities, nor are they intended to be used
for the purpose of or in connection with offers or invitations to subscribe for, purchase or otherwise deal in any securities. This presentation
has been prepared without taking into account the investment objectives, financial situation or particular needs of any particular person.
Forward looking statements
No representation or warranty, express or implied, is made as to the fairness, accuracy, completeness or correctness of the information,
opinions and conclusions contained in this presentation. To the maximum extent permitted by law, none of Nufarm Limited, its directors,
employees or agents, nor any other person accepts any liability, including, without limitation, any liability arising out of fault or negligence, for
any loss arising from the use of the information contained in this presentation.
This presentation includes certain forecasts, prospects or returns, and other forward looking statements that are based on information and
assumptions known to date and are subject to various risks and uncertainties. Actual results, performance or achievements could be
significantly different from those expressed in, or implied by, these forecasts, prospects or returns, and other forward looking statements.
Such forecasts, prospects or returns, and other forward looking statements are not guarantees of future performance and involve known and
unknown risks, uncertainties and other factors, many of which are beyond the control of Nufarm Limited, which may cause actual results to
differ materially from those expressed in the statements contained in this presentation. Accordingly, no representation or warranty, express or
implied, is given as to the accuracy, completeness or correctness, likelihood of achievement or reasonableness of any forecasts, prospects or
returns, or other forward looking statements contained in this presentation.
Before making an investment decision, you should consider, with or without the assistance of a financial adviser, whether an investment is
appropriate in light of your particular investment needs, objectives and financial circumstances. Past performance is no guarantee of future
performance.
Non-IFRS information
Nufarm Limited results are reported under International Financial Reporting Standards (IFRS) including Underlying EBIT and Underlying
EBITDA which are used to measure segment performance. This presentation also includes certain non-IFRS measures including Underlying
net profit after tax and Gross profit margin. These measures are used internally by management to assess the performance of our business,
make decisions on the allocation of our resources and assess operational management. Non-IFRS measures have not been subject to audit
or review. Certain figures may be subject to rounding differences. Refer to “Supplementary information” for the definition and calculation of
non-IFRS information. All market share information in this presentation is based on management estimates based on internally available
information unless otherwise indicated. All amounts are in Australian Dollars unless otherwise stated.
3

Greg Hunt
Chief Executive Officer
Overview
4

The safety of our
people
• We are committed to a goal of zero injuries
• Safety performance is an important part of
Nufarm's business improvement and
transformation
• We have put significant resources into our
safety capability and our management team is
ensuring safety is very visible and the first
priority
• Our focus is on encouraging a culture of
reporting, learning from incidents and
continuous safety improvement
5

The evolution of
Nufarm
Achieved group
sales $200m
1984 Nufarm Australia
incorporated in Melbourne, Australia
1957
Initial expansion into SE Asia
Acquisitions in Europe
Acquisition of Riverdale Chemical Co., Chicago
1990’s
Achieved group
sales $1b
1998
Launch of revised strategy focused on key
crops and geographies
Achieved group
sales $2.7b
Leads consolidation of Australian industry
Crop Care acquisition
Expands into South America via
Agripec (Brazil) and Agrogen (Colombia)
Initial expansion into Eastern Europe
Establishes seeds platform - Nuseed
2000's
2015
2016
Asia and
NA Expansion
Europe and
LATAM
Expansion
Nuseed
Growth
Strategy
review
Nufarm
Business improvement program
2015 Improvement
program
Achieved group
sales $2b
2008
The New Zealand Farmers Fertilizer
Company Limited (Fernz) founded in NZ
1916
Beginning
6

Nufarm's strengths
• Global manufacturing, marketing and
distribution platform
• Diversified business across geographies and
product segments
• Established position and recognised brand in
target markets and segments
• Established specialty seeds platform
• Well positioned in growing industry – driven
by global population growth and decreasing
available land for agriculture
7

ROFE in FY14 at 9.1% put Nufarm in the
bottom quartile
ROFE of Nufarm vs. Competitors FY 2014
Case for change
Source – Gresham analysis October 2014 8

Case for change
Rolling EBIT to July 2014
Net Sales Underlying EBIT
2012 2013 2014
9

One Nufarm
Improvements in these areas and investment into a better
customer experience will drive sustainable growth.
CUSTOMER EXPERIENCE
SUPEOPLE | VALUES | CULTURE
10

Performance improvement program –
examples of cost savings and benefits*
11
Description of Area Specific Examples Est. gross savings
Low High
Manufacturing
footprint
• Optimising plant utilisation
• Lowering fixed cost base
• Ensuring capacity to meet new growth
• Protecting Nufarm’s unique positions
(Phenoxies, Granulation)
• Consolidation of Australian manufacturing
footprint (6 plants to 3) $16M
• In Europe, closure of Botlek (The Netherlands) $24M
Manufacturing
efficiencies
• Improving productivity
• Reducing waste, duplication and rework
• Lowering manufacturing overhead
• Review complete at Wyke (UK) $5M**
• Review complete at Laverton (AUS) $6M**
• Reviews at other production facilities $10M $15M
Procurement
• Centralising to leverage global scale
• Investing in better systems and
increased capabilities
• Establishing a global procurement hub
in Shanghai
• Various initiatives that will deliver a 2-4% saving
on our annual raw material spend of $1.6B
• Indirect procurement
$45M** $65M**
Supply chain &
logistics
• Establishing a globally integrated supply
chain which will deliver benefits in areas
such as inventory management, lower
logistics costs and improved supply
reliability
• Consolidation of warehousing
• Establishment of one center-led global supply
chain operating with standardised systems and
processes across all inbound and outbound
markets
$10M $15M
Selling,
General &
Administrative
• Removing duplication and implementing
an operating model that best serves the
needs of a global business
• Ongoing vigilance on discretionary
spend
• Lowering head office costs via a more
streamlined management structure $5M**
• Moving to a shared service model to reduce
overhead within regions $15M $20M
Product
Portfolio
• Developing a product portfolio that
better meets the needs of our
customers – the farmers, and thus
allows for stronger margins
• Removing low margin and slow moving products
• Focusing product development in countries and
product and crop specialties where Nufarm has
distinct competitive advantage to win share
$5M $10M
TOTAL: $141M** $181M
* Work continues on the validation of estimated cost savings and the identification of additional cost saving opportunities
** Updated April 2016 11

Performance improvement program –
examples of cost savings and benefits*
12
Description of Area Specific Examples
Est. gross
savings
Low High
Manufacturing
footprint
• Optimising plant utilisation
• Lowering fixed cost base
• Ensuring capacity to meet new
growth
• Protecting Nufarm’s unique
positions (Phenoxies, Granulation)
• Consolidation of Australian manufacturing
footprint (6 plants to 3) $16M
• In Europe, closure of Botlek (The
Netherlands) $24M
Manufacturing
efficiencies
• Improving productivity
• Reducing waste, duplication and
rework
• Lowering manufacturing overhead
• Review complete at Wyke (UK) $5M**
• Review complete at Laverton (AUS) $6M**
• Reviews at other production facilities $10M $15M
* Work continues on the validation of estimated cost savings and the identification of additional cost saving opportunities
• The rationalisation of our footprint is complete
• Our manufacturing excellence program is well progressed
12 ** Updated April 2016

Performance improvement program –
examples of cost savings and benefits*
13
Description of Area Specific Examples
Est. gross
savings
Low High
Procurement
• Centralising to leverage global scale
• Investing in better systems and
increased capabilities
• Establishing a global procurement
hub in Shanghai
• Various initiatives that will deliver a 2-4%
saving on our annual raw material spend of
$1.6B
• Indirect procurement
$45M* $65M**
Supply chain
& logistics
• Establishing a globally integrated
supply chain which will deliver
benefits in areas such as inventory
management, lower logistics costs
and improved supply reliability
• Consolidation of warehousing
• Establishment of one center-led global
supply chain operating with standardised
systems and processes across all inbound
and outbound markets
$10M $15M
* Work continues on the validation of estimated cost savings and the identification of additional cost saving opportunities
• Leveraging our global strength, we have changed the way we manage
procurement
• We are investing $ 24 million into the creation of a globally integrated
supply chain
** Updated April 2016 13

Performance improvement program –
examples of cost savings and benefits*
14
Description of Area Specific Examples
Est. gross
savings
Low High
Selling,
General &
Administrative
• Removing duplication and
implementing an operating model
that best serves the needs of a
global business
• Ongoing vigilance on discretionary
spend
• Lowering head office costs via a more
streamlined management structure $5M**
• Moving to a shared service model to reduce
overhead within regions $15M $20M
* Work continues on the validation of estimated cost savings and the identification of additional cost saving opportunities
• Head office cost reduction complete
• The Australian back-office rationalisation is complete and we are
validating opportunities in other regions
** Updated April 2016 14

Performance improvement program –
examples of cost savings and benefits*
15 * Work continues on the validation of estimated cost savings and the identification of additional cost saving opportunities
** Updated April 2016
Description of Area Specific Examples
Est. gross
savings
Low High
Product
Portfolio
• Developing a product portfolio that
better meets the needs of our
customers – the farmers, and thus
allows for stronger margins
• Removing low margin and slow moving
products
• Focusing product development in countries
and product and crop specialties where
Nufarm has distinct competitive advantage
to win share
$5M $10M
• Completed review of product portfolio
• We simplified our broad portfolio (approximately 8000 SKUs) by removing low value
products so that we can focus on our core crops
• Annualised benefits include – reduced registrations, packaging and warehouse costs,
lower working capital and a focus on higher margin products. These are estimated to
be $5-10m
• We completed a reassessment of the useful life of our remaining product portfolio and
revised our amortisation schedule. Additional annual cost of $13-16m. We are
developing a product portfolio that better meets the needs of our customers
15

Crop
Org structures & roles
Performance
Branded sales
Geographic
Our strategy
Focus
Deliver great
customer experience 16

Crop protection by country: size
and projected growth rates
Note: Regulated markets defined by time and cost of market entry
Source: Phillips McDougall; Euromonitor; Bain Analysis
>10% 7-10% 3-7% <3% Forecast
growth (’12-’20)
17

40% increase in global supply
required to meet future demand
for key staple grains
Source: FAPRI; SAGE; FAOStat; Bain Analysis
Total =
18

x x Crop share in country >25% Crop share in country 10 to 25%
Legend
x Crop share in country 5 to 10% Market exist but size n/a
Market important for Nufarm Market not important for Nufarm
Recommend core based on
relevant intersections of four
geographies and nine crops
Source: Phillips McDougall; Expert interviews; Global Product Portfolio Team
Country Soybean Corn Cereals Pasture
TNVV
Potato and
tomato Citrus Pome Fruit Vine Nuts
Brazil 46% 10% 2% n/a 1% n/a 0% 0% n/a
USA 17% 29% 9% n/a 2% n/a 2% 2% n/a
Australia 0% 0% 49% n/a 1% n/a 1% 5% n/a
Central Europe (France, Germany,
Poland)
0% 12% 41% n/a 4% n/a 3% 8% n/a
19

Our core geographies
& crops
CEREAL CORN PASTURE,
TURF &
ORNAMENTALS
SOYBEAN TREES, NUTS,
VINES &
VEGETABLES 20

One Nufarm
Improvements in these areas and investment into a better
customer experience will drive sustainable growth.
CUSTOMER EXPERIENCE
SUPEOPLE | VALUES | CULTURE
21

Elbert Prado
Group Executive – Supply Chain Operations
Supply Chain
excellence
22

23
Supply Chain vision
Deliver quality
product on time at
competitive cost

What is supply chain and what
changes have we made
• Right size manufacturing footprint
• Principles of manufacturing excellence -> improving operational efficiency
• Applying procurement principles to improve purchasing of inputs
• Optimising global indirect spend
• Optimising inbound and outbound logistics
• Building supply chain planning capability – skills, processes and technology
• Establishing one integrated global business system
• Industrial sales optimise plant throughput and reduce branded business cost
• Safety, health, environment and social responsibility risk reduction
• Building a quality management system
Manufacturing
Procurement
Logistics
Supply Chain
Planning
Industrial
Sales
Safety &
Sustainability
Org Design &
Culture
• Creating the right organisation structure and culture to enable our
employees to thrive and to enable Nufarm’s business to continuously
improve
24

Manufacturing
• Manufacturing rationalisation effectively Expected savings – $40m
completed
• Manufacturing Excellence programs Expected savings – $21-26m
- Wyke Phase 1 complete, Phase 2 to start
- Laverton review completed
- Linz/Gaillon sites in implementation
- the program is being rolled out at
remaining sites
• Our insecticide and fungicide Investment – ($14m )
manufacturing site at Laverton is
close to completion
25

The closure of 5 plants
enables $40M of the
savings
16 plants
NA
3 plants
EUR
4 plants
LATAM
1 plant
ANZ
6 plants
ASIA
2 plants
11 plants
Calgary to close
In FY17
Botlek closed
Lytton
Welshpool
Otahuhu
closed
NA
3 → 2 plants
EUR
4 → 3 plants
LATAM
1 plant
ANZ
6 → 3 plants
ASIA
2 plants
Tollers Strategy to minimise use
and leverage our own assets
• Synthesis of Phenoxies at Laverton, Linz and Wyke
• Formulation facilities in key markets close to the customer
26

Transforming our
procurement function
• Moved to a strategic procurement model
• Strategic - understand the global requirements and negotiate
for products as 'One Nufarm'
• Established a centre of excellence in China where we
negotiate for products directly with producers
• Recruited sophisticated procurement skills
• Dedicated category managers to address indirect spend
• > 120 procurement projects across the business
27

Direct Spend
Materials
$1.5B
Direct Spend
Tracking
>120 Projects
Procurement
transformation benefits
COGS
$2.0B
Indirect
Spend
$0.5B (50%
addressable)
SG&A
$0.5B
Nufarm
Total
Spend
$2.5B
Labour
$0.4B
Logistics
$0.1B
5-10% Reduction
$15-25m
2-3% Reduction
$30-$40m
Indirect Spend
Regional Review
28

29
From To
Every country (30+) made their own
supply chain planning decisions Regional decision making
Supply Chain had low levels of
capability
Increased depth of
supply chain planning capability
Each country with its own inventory
stockpile
Optimisation of inventory within and
across regions
Disparate technology platforms
preventing aggregation of data
One technology platform to optimise
supply planning decisions
Nufarm not seen as agile in the eyes of
customers
Improved agility to
respond to customer needs
Each country used its own processes
for demand and supply planning The same processes globally
We could not promise product with any
degree of certainty
We will be able to promise with
certainty and honour our promises
Impact of LINK
Reduction in
net working
capital
Supply chain
equipped to
meet the needs
of channel
partners
Common
processes,
structure and
technology
Transforming our
Supply Chain planning

Portfolio Solutions
Dr Niels Pörksen
Group Executive Portfolio Solutions
30

Our ambition
Deliver a focused and optimised
portfolio of solutions which
progressively strengthens
Nufarm's branded position in
core crops and geographies
31

What are we changing?
• Strategy: Focus on core crops
• Structure: Portfolio pool to become a centre led function as
part of a matrix model
−Key leadership positions in the centre and the regions
−Dedicated portfolio resources focused on strategy, development
and registration
−Marketing execution to remain in the regions
• One Nufarm processes: A central approach to capital
allocation
−Crop strategy formulated in the regions and optimised centrally
for execution
−A global approach to strategic alliances
• Accountability: Global team accountable for the investment
choices in portfolio and future portfolio health
32
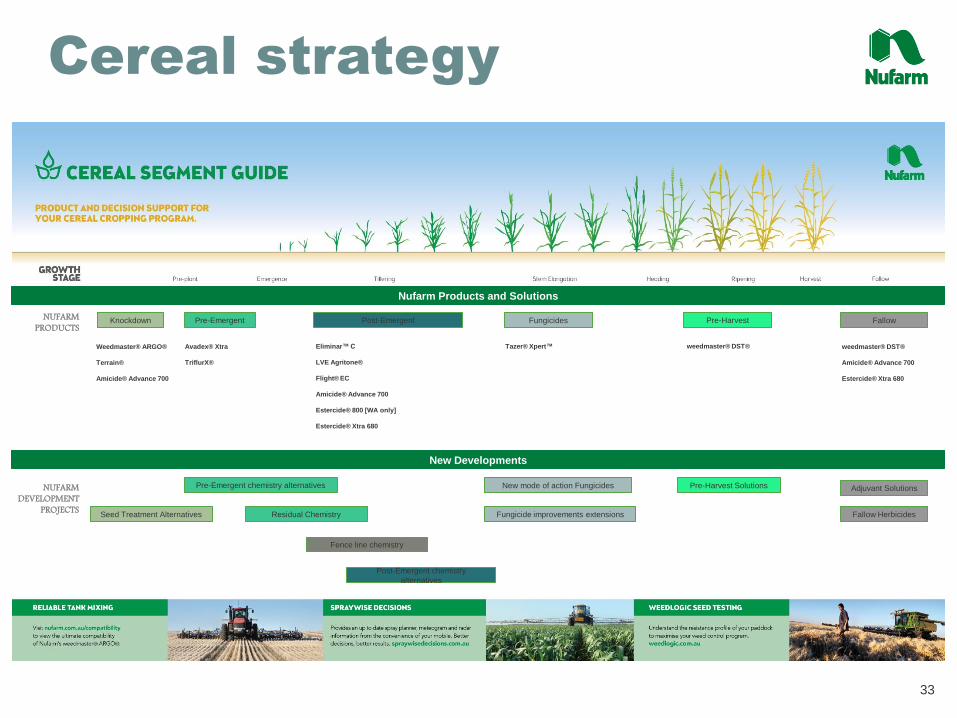
Cereal strategy
Knockdown Pre-Emergent Post-Emergent Fungicides Pre-Harvest Fallow
Weedmaster® ARGO®
Terrain®
Amicide® Advance 700
Avadex® Xtra
TriflurX®
Eliminar™ C
LVE Agritone®
Flight® EC
Amicide® Advance 700
Estercide® 800 [WA only]
Estercide® Xtra 680
Tazer® Xpert™
weedmaster® DST®
weedmaster® DST®
Amicide® Advance 700
Estercide® Xtra 680
New Developments
Nufarm Products and Solutions
Adjuvant Solutions Pre-Harvest Solutions New mode of action Fungicides Pre-Emergent chemistry alternatives NUFARM DEVELOPMENT
PROJECTS
NUFARM PRODUCTS
Fallow Herbicides Residual Chemistry Seed Treatment Alternatives
Fence line chemistry
Fungicide improvements extensions
Post-Emergent chemistry
alternatives
33

Growth from the core –
phenoxy
• One of the first selective herbicide classes developed for broadleaf
weed control, phenoxies have remained a corner stone in modern day
weed management
• Phenoxy herbicides generate approximately 20% of Nufarm's global
crop protection sales
• The fully integrated position begins with world competitive
manufacturing synthesis, a substantial body of global regulatory data,
supported by well known brands and strong access to all key crops
and markets
• Phenoxy herbicides will increase in importance in our core crops and
geographies as resistance management platforms build and valuable
segmentation opportunities are created
• Burndown and post harvest weed control an existing strength, and a
significant growth opportunity
34
Summary
• Deep understanding of growers future needs
and economics in core crops and
geographies
• Less projects, yet globally leveraged to
deliver on depth in core crops and countries
• Strengthened core positions and globally
optimised approach to portfolio gaps
• Meaningful strategic alliances leveraged
globally
35

Customer
excellence
Michelle Monteiro
Director - REACH
36
How are we
improving the
customer
experience?
• Nufarm has the opportunity to differentiate against its competitors by adopting customer centric principles, and:
• Improving our supply chain and portfolio at a global level to allow the regions to focus on our customers and provide the foundations of a great customer experience
• Giving customers a way to tell us how we perform
• Listening to feedback and embedding improvement into processes, products and services
• Using metrics to measure and reward customer-centric behaviour for all employees
37

Who is our customer?
Channel Partner
Access to market
Farmer
User of our products
• Both Channel partners and farmers or end users are Nufarm’s customers
• Understanding our channel partners and our customers will enable us to design products
and services that meet their needs and keep our revenue as well as help grow it.
• Design our portfolio solutions through the eyes of the end user
38

Customer experience
Our immediate priority will be our channel partners
and how we deliver a great experience to them in
each of our core markets
Align our business
around the customer
A One Nufarm Approach
Get the basics right
Marketing
Sales
Pricing
Customer Service
Develop a monitoring,
listening, action loop
Measurement – whole of
business systems solution
Customer Salesforce.com in all core
markets
Customer Relationship
Management (CRM)
Common systems
driving efficiencies
39

Nufarm is implementing
NPS with our channel
partners
What is NPS?
• NPS or Net Promoter
Score is a global brand
benchmarking model of
customer advocacy
• It will be embedded into
the customer service
operations of Nufarm
• Enables continuous
feedback from customers
to improve our service
strategy and delivery
• Used to measure our
Progress
Net Promoter Score % Promoters % Detractors
0 1 3 2 4 5 6 7 8 9 10
DETRACTORS PASSIVES PROMOTERS
40

How will we use NPS?
We are building a visible customer
measurement system
How would you
describe your most recent
interaction with Nufarm's
products or services?
Functional
Improvement Actions
Ops IT Finance HR
Channel
Partner
Farmer/
End User
NPS
SCORE Detractors
X%
Promoters
X%
Passives
X%
How likely is it that you would
recommend Nufarm’s
products and services to a
friend or colleague?
NLT Product Sales
41

We are committed to
establishing an engine for
customer centered growth
1. Identify most attractive target
segments; understand
needs better than
competitors
5. Earn greater
share of wallet
2. Design
differentially better
value propositions
4. Deliver
superior
customer
experience
3. Acquire
more
new
target customers
6. Earn
emotional
loyalty/
retention
More profit
per customer;
out-invest
competitors
Source: Bain & Company 42

Australia /
New Zealand
Lachie McKinnon
Regional General Manager - ANZ
43

Nufarm, Crop Care,
Croplands & Nuseed ANZ
footprint
44
Nufarm Australia / New Zealand
Crop Care
Croplands
Nuseed Australia
Nufarm Manufacturing facility
Head office
NZ Head office
Australia Head office
Head office
15/04/2015
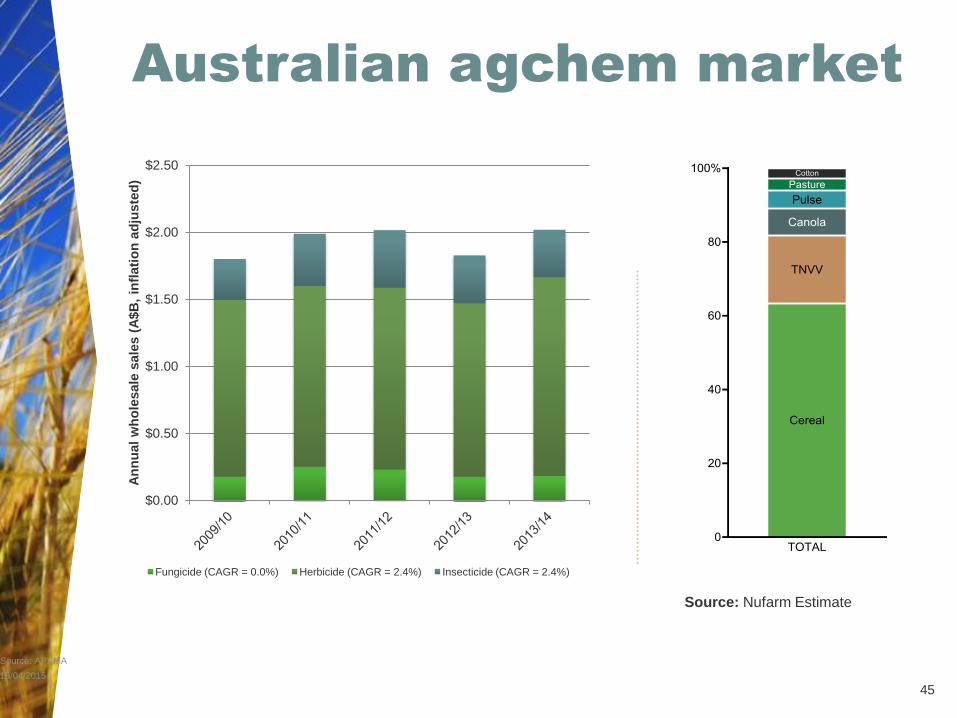
Source: APVMA
Australian agchem market
$0.00
$0.50
$1.00
$1.50
$2.00
$2.50
An
nu
al
wh
ole
sale
sale
s (
A$B
, in
flati
on
ad
jus
ted
)
Fungicide (CAGR = 0.0%) Herbicide (CAGR = 2.4%) Insecticide (CAGR = 2.4%)
Source: Nufarm Estimate
45

New Zealand agchem
market
0
50
100
150
200
250
300
2011 2012 2013 2014 2015
Reven
ue N
Z$M
Herbicides Insecticides Fungicides Others
Source: Nufarm Estimate
46

Australia/New Zealand
sales & EBIT
5 year revenue & profit growth
675 701
604 606 582 94.7
106.0
35.4 33.9
52.7
0
40
80
120
0
100
200
300
400
500
600
700
800
2011 2012 2013 2014 2015
Revenue (A$m)
Underlying
EBIT (A$m)
47

ANZ strategy – customer
lens
Each of our strategic pillars contribute to achieving our ambition of being
known for providing our customers with innovative solutions and a superior
experience.
Deliver best in class
customer experience
Identify and act upon
growth and market
opportunities
Deliver quality
product on time at
competitive cost
CUSTOMER
EXPERIENCE
SUPEOPLE | VALUES | CULTURE
48

SUPPLY CHAIN
EXCELLENCE
• Completion of the manufacturing rationalisation program
commenced in March 2014.
• Manufacturing excellence program completed at Pipe Road facility
• Completion of a freight and logistics overhaul.
• Continued progress in the LINK company-wide (major supply
chain and demand forecasting) project.
PORTFOLIO
EXCELLENCE
• Development of Pipe Road R&D Centre of Excellence.
• Major portfolio rationalisation review.
• Restructure of our portfolio and marketing teams to focus on long-
term horizons for three core crops reiterating our depth not
breadth strategy.
• Local tactical marketing teams to drive customer excellence
through working closely with Commercial teams.
CUSTOMER
EXCELLENCE
• Implementation of the Salesforce CRM system.
• Introduction of the Net Promoter Score to assist feedback
initiatives.
• Major review commenced of Order to Cash processes.
High-level overview of major ANZ
performance improvement
initiatives
49

Cereal strategy
Knockdown Pre-Emergent Post-Emergent Fungicides Pre-Harvest Fallow
Weedmaster® ARGO®
Terrain®
Amicide® Advance 700
Avadex® Xtra
TriflurX®
Eliminar™ C
LVE Agritone®
Flight® EC
Amicide® Advance 700
Estercide® 800 [WA only]
Estercide® Xtra 680
Tazer® Xpert™
weedmaster® DST®
weedmaster® DST®
Amicide® Advance 700
Estercide® Xtra 680
New Developments
Nufarm Products and Solutions
Adjuvant Solutions Pre-Harvest Solutions New mode of action Fungicides Pre-Emergent chemistry alternatives NUFARM DEVELOPMENT
PROJECTS
NUFARM PRODUCTS
Fallow Herbicides Residual Chemistry Seed Treatment Alternatives
Fence line chemistry
Fungicide improvements extensions
Post-Emergent chemistry
alternatives
50

Full year outlook
• Continued earnings recovery driven by lower cost base
and improved quality of sales.
• Completion of major performance improvement
initiatives to contribute to EBIT benefit.
• Challenging climatic conditions in February and March.
Rain needed now for Eastern Seaboard.
51

Latin America
Marcos Gaio
Regional General Manager – Latin America
52

53
LATAM By Countries 2015 (Market Value - Calendar Year )
LATAM - Market Overview
• Market U$S 2.750 mill
• NUF U$S 108 Mill
• MS 3,9%
• Market U$S 400 mill
• NUF U$S 10,6 Mill
• MS 2.7%
• Market U$S 500 mill
• NUF U$S 18.07 Mill
• MS 3,6%
• Market U$S 1.275 mill
• NUF U$S 6.3 Mill
• MS 0.4%
Mexico
Brazil
Argentina
Chile
Colombia
• Market U$S 9.600 mill
• NUF U$S 392.3 Mill
• MS 4.1%
• Total Market - US$ 17.100 mill
• Nufarm Presence – US$ 14.525 mill (85%)
• Others - U$S 2.575 mill
Source: Nufarm BI

6,600 7,200
8,300
9,500
11,300
12,100
9,600 9,800 10,300
10,900 11,500
0
2,000
4,000
6,000
8,000
10,000
12,000
14,000
2009 2010 2011 2012 2013 2014 2015 2016 fcst 2017 fcst 2018 fcst 2019 fcst
U$S
Mill
15-19 CAGR 3,68%
Brazil market value
evolution & projection
Assumptions

LATAM sales & EBIT
55
325 333
431
662 706
4.1 17.5
40.6
71.6 76.7
0
40
80
120
0
100
200
300
400
500
600
700
800
2011 2012 2013 2014 2015
5 year revenue & profit growth
Revenue (A$m)
Underlying
EBIT (A$m)

LATAM strategy –
customer lens
Each of our strategic pillars contribute to achieving our ambition of being
known for providing our customers with innovative solutions and a superior
experience.
Deliver best in class
customer experience
Identify and act upon
growth and market
opportunities
Deliver quality
product on time for
the lowest cost
CUSTOMER
EXPERIENCE
SUPEOPLE | VALUES | CULTURE
56

SUPPLY CHAIN
EXCELLENCE
• ISO 9001 Certification at Fortaleza plant
• Sales and demand forecast processes enhancement
• Global procurement project
• Discipline on execution
• New logistics project in progress
PORTFOLIO
EXCELLENCE
• New portfolio solutions platform
• Focus on strategic AI’s: Crucial®, Phenoxy Family & Flumioxazin
• New products registration: Zethamax®, Maestro &Tibet
• Strategic alliance with Sumitomo: access to new AI’s
• Project management improvement
• Product rationalisation program
CUSTOMER
EXCELLENCE
• Well established channel partners loyalty programs
• Salesforce.com introduced and fully active
• Net Promoter Score functionality
• Alliance with national distributors
• Direct sales structure in place
• Financial tools available for key customers (CRA, barter)
High-level overview of major
LATAM performance
improvement initiatives
57

LATAM Market Trends
2016
Brazil
• Modest growth expected for 2016 (calendar year)
• Soybean & corn area growth
• Price recovery of devaluation impact
• Dealers stocks consumption is a must
Argentina
• New government moving agribusiness very positively
• Expected soybean, corn and wheat area growth
• Ag chem market expected to grow 6% to 8%
MCC
• Chile – expected to keep market value flat
• Mexico – market expected to grow around 3%
• Colombia – expected slightly market drop due to El Niño effect

Nufarm dealer stocks &
POG analysis
Brazil
59

Outlook
60
• FY 2016 on track to deliver growth in local currency
• POG growing and channel inventories at historical
levels
• Focused on collections
• New product registrations and launches on plan
• Sumitomo alliance delivering benefits
• Performance improvement program contributing to
results
• Positive market trends for LATAM
12/03/2014

Brent Zacharias
Group Executive - Nuseed
Nuseed
61

62
Beyond Yield™
• Use novel seed technology
to solve problems
• 'Output' vs. 'Input' emphasis
• Fundamentally improve crop value in
canola, sunflower and sorghum
• Innovation and partnership through the
value chain

Sequenced Strategic Effort
Value + Influence
Small stand alone companies Consolidate, enhance pipelines, sophistication Beyond Yield platforms
Va
lue
Gen
era
ted
Influence & sustainability
Infrastructure
Products &
Production
Combined
Genetics &
Med. size Opn’s
Knowledge
Market access
Regional positions
NA, SA, EU
Pipelines &
Local brands
8
4-
Global
supply chain
and R&D
Agronomic
trait access
Global
process and
capability
Beyond
Yield
Output
Traits Molecular
assisted
breeding &
traits
Native Trait
Discovery
Beyond Yield
Downstream
Platforms Beyond
Yield
Intellectual
Property
Estate
Beyond Yield
Downstream
Positions &
Brands
Discovery
science
partnerships
2006 2022
Pipeline
optimized
2016
Nuseed
creation
AUS
63

Seeds sales & EBIT
87 121 132 144 160
26.3
30.6 32.4
37.2
31.8
0
40
0
20
40
60
80
100
120
140
160
180
2011 2012 2013 2014 2015
5 year revenue & profit growth
Revenue (A$m)
Underlying
EBIT (A$m)
64

Strong positions
& medium term outlook
Canola
• #1 position in Australia, top 5 position globally
• Potential for Australia market to double value (hybrids)
• Leverage to Canada, Europe and LAS
Sunflower
• Global leader, food ingredient segment (highest value)
• Top 5 position globally
• Growth path in Europe with unique segments
• Position in oil types strengthening with stacked traits
Sorghum
• Top 3 position globally
• Leading differentiated forage segment (BMR)
• Strength in food types (Wholis), but niche
• New generation grain sorghum pipeline, next 2 years
Short term
challenges
•2 years drought
•China deterioration
•Global grain over-
supply
•Commodity price,
margins
65

Pipeline highlights:
Concept Target Launch
2017 2018 2019 2020-22
Canola:
Monola Gen2
Canola Gen3 hybrid
+ gen2 HT
Sunflower:
High Oleic Gen2, Early
Black type food
ingredient
White type food
ingredient
Novel oil
Sorghum:
AUS grain sorghum
LAS Gen2 grain
sorghum
Novel HT
Omega 3:
Concept 1: DHA Rich
66

-900,000
-800,000
-700,000
-600,000
-500,000
-400,000
-300,000
-200,000
-100,000
0
Omega 3 Supply:
Scarcity unresolved
2014 2015 2016 2017 2018 2019 2020 2021 2022 2023 2024 2025 2026 2027 2028
Projected Fish Oil Deficit (Feedstock) Volume MT
Sources: Holtermann, Kontaii,
Nuseed Analysis
• Historic Aquafeed CAGR +7-9% for Salmon + Trout and +5% for other species
• US Supplement market relatively mature
• Asia + India Supplement market expansion / growth
• Pharma 03 expansion
• Fish catch supply capped ~ 900,000 MT due to quotas and social pressure
820,000
840,000
860,000
880,000
900,000
920,000
940,000
960,000 Fish Oil Static ~900,000 MT Supply
67

Divergence of pricing:
Plant-based 0mega3 opportunity
US$ per MT
Source: Oil World
Impact of
scarcity in
2020+?
68

Greg Hunt
Chief Executive Officer
Summary
69

70
Summary
• Performance improvements plan on track to deliver $116 million by
FY2018
• Good progress towards 40% average net working capital target
• Increasing our gross margin
Meeting our targets
• Clear strategic growth plan with a focus on core geographies and
core crops
• Growth opportunities through commercial relationships
Growth platforms identified

Trading update
• Australia Earnings recovery expected, driven by lower cost base
and disciplined pricing, however, dependent on seasonal
rainfall
• North America Business to benefit from expanded portfolio and stronger
channel support
• Latin America Market conditions still challenging but larger Safrinha
(second corn season) expected
• Europe Continued growth expected, aided by new product
introductions and a lower cost base
• Seeds Very challenging second half with reduced canola plantings
in Australia, low sorghum pricing and sunflower over supply
in USA
• Group We remain confident of delivering another solid increase in
underlying EBIT growth, however, a stronger Australian dollar
(~0.77) will put pressure on full year underlying net profit after
tax.
71