Nuisance Nuisance Cladophora Cladophora Blooms in Lake Blooms in Lake Michigan: Michigan: Possible Causes and Management Options Possible Causes and Management Options Harvey Bootsma Harvey Bootsma Erica Young Erica Young John Berges John Berges
Transcript
Nuisance Nuisance CladophoraCladophora Blooms in Lake Michigan: Blooms in Lake Michigan:
Possible Causes and Management OptionsPossible Causes and Management Options
Is there enough phosphorus coming in from rivers to support the Cladophora growth that we observe?
10 km
Milw
aukee R
.
Kinnickinnic R.
Menomonee R.
Milwaukee River = 250 kg/day
P Sources in the nearshore zone (0 – 10 m)
Mussel recycling = 1,700 kg/daygg
Cladophora demand ~ 2,000 kg/day
June July Aug Sep Oct0
0.5
1
1.5
2
0
50
100
150
200
m3 s
-1
May June July Aug Sep Oct
2004
2005
2006
Milwaukee River discharge
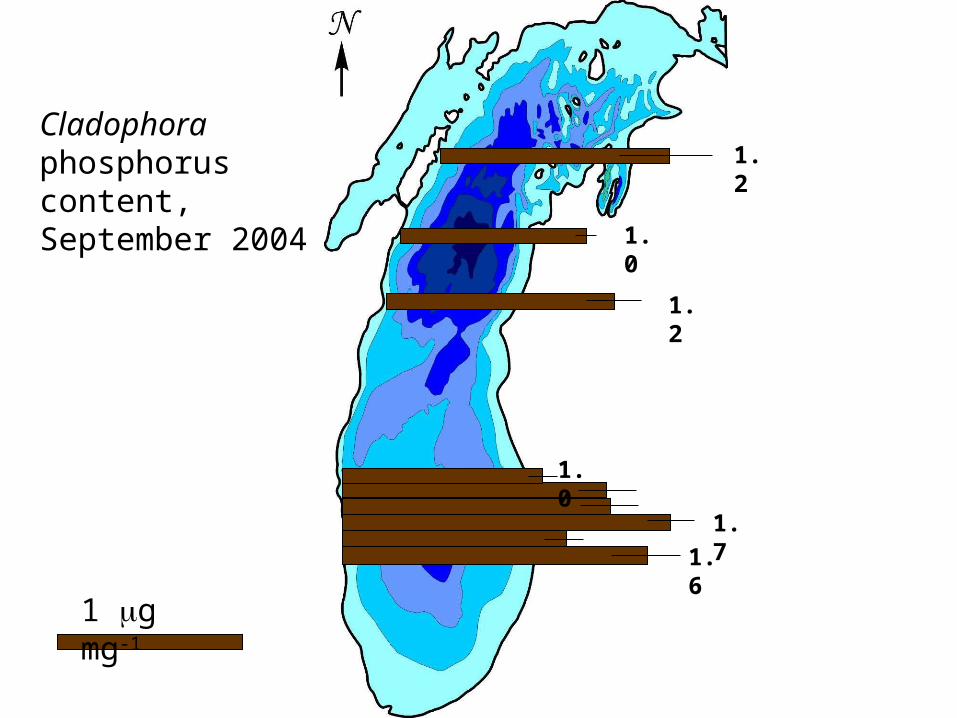
3-Year Comparison of Cladophora phosphorus contentLake Michigan
Cladophora P content
g P
mg
-1
2004
2005
2006
P limitedgrowth
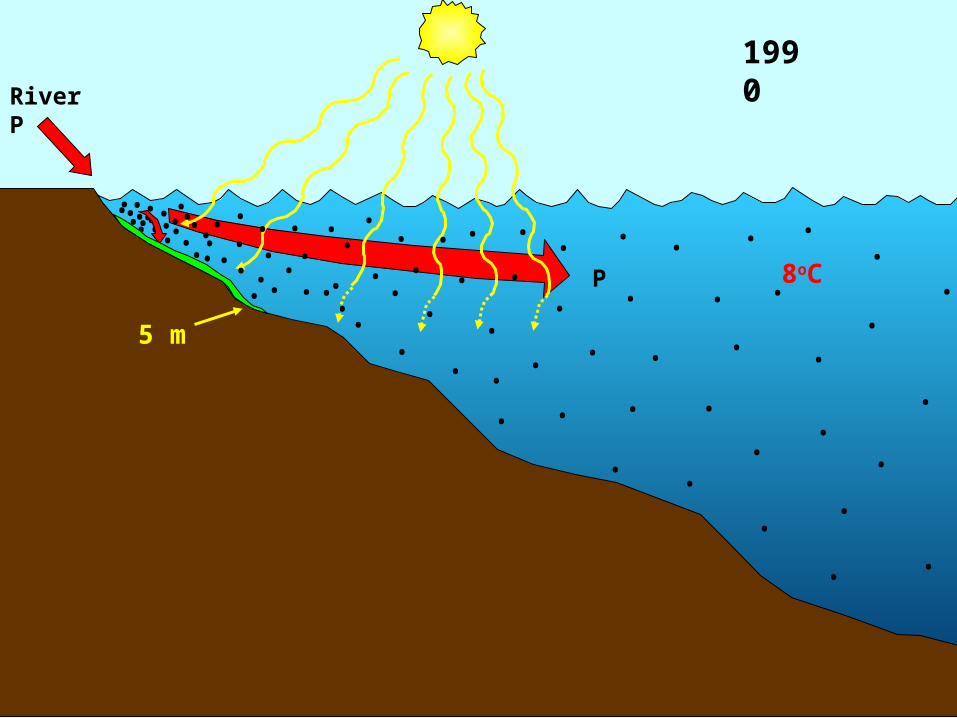
8oC
River P
•• • ••••
••
•
•
•
•
•
•
•
••
• ••
• ••••
• •
•• •
• • •• •
• •• • ••
•
•
•• • •••• ••
•
• •••
• • • •••
••
•
•
•
•
•
••
•
• •
•
•
•
•
•
•
•
•
•
•
•
•
•
•
•
P
1990
5 m
12oC
River P
••••
•
•
•
••
•• ••• •• ••
•••••••••
•
• ••••
•
• ••
•
•
•
•
• •••
•• •
••
• •
•
•
•
• •
•
• •
•
•
•
••
•
•
P
2005
10 m
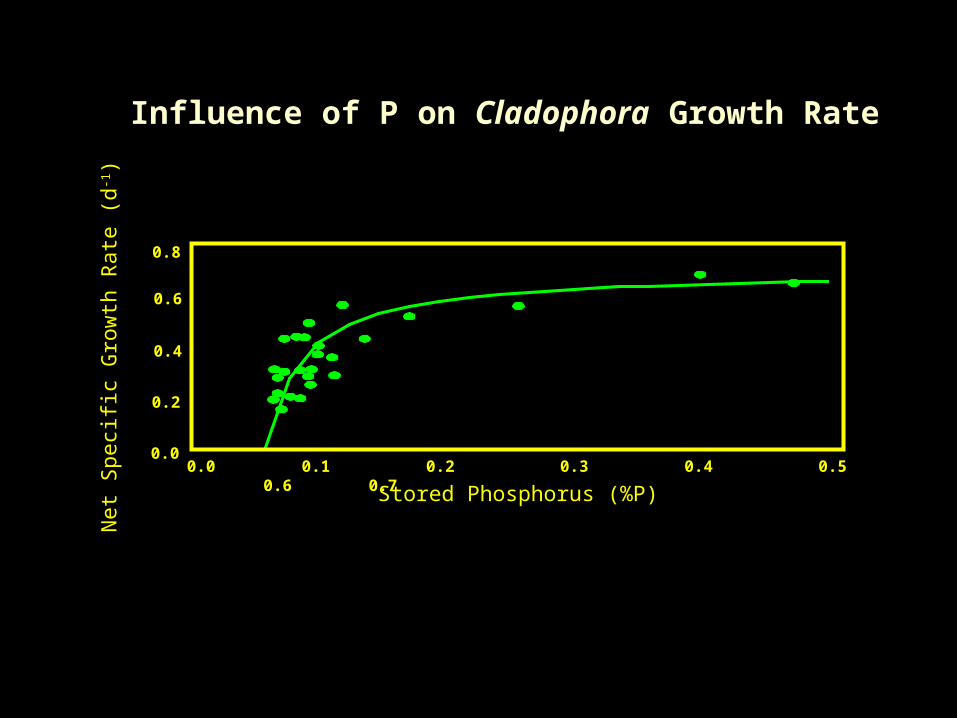
Net
Speci
fic
Gro
wth
Rate
(d
-1)
0.6
0.00.0 0.1 0.2 0.3 0.4 0.5 0.6 0.7
0.4
0.2
Stored Phosphorus (%P)
0.8
Influence of P on Cladophora Growth Rate
Conclusions
The recent increase in Cladophora growth is likely due to:
- Increased water clarity (more light at lake bottom)
- Warmer water temperatures in summer
- increased phosphorus inputs
Although P input from rivers has increased, there must also be an internal source of P in the lake that is promoting Cladophora growth. We suspect dreissenid mussels.
Future work must focus on the fate of river-borne phosphorus, and the importance of mussels as a phosphorus source.
An important question to answer: If we lower P input from rivers, will there be less Cladophora?