Numerical Analyses of the Effects of Mixture Quality on the Controlled Autoignition in Gasoline Engines *Sebastian Hensel, Werner Sauter, Fatih Sarikoc, Heiko Kubach and Ulrich Spicher Institut für Kolbenmaschinen (Institute of Reciprocating Engines), University of Karlsruhe (TH) Alexander Schubert, Robert Schießl and Ulrich Maas Institut für Technische Thermodynamik, University of Karlsruhe (TH) Key Words: HCCI, CAI, Autoignition, Modeling, CFD ABSTRACT Controlled autoignition in gasoline engines is a promising concept to simultaneously reduce both emissions and fuel consumption of internal combustion engines. To describe the spatial progress of the chemical reactions in three- dimensional simulations of CAI engine cycles an efficient combustion chemistry model was developed. To analyze the effects of mixture homogeneity on the progress of the reactions, thermodynamic analyses and numerical simulations of engine operation in HCCI mode have been performed based on experimental investigations with an optically-accessible single-cylinder engine. The numerical simulations were used to interpret the experimental observations in terms of mixing and reaction progress. Both experimental investigations and simulations show that injection timing is a feasible control parameter for the optimization of operating points because autoignition is influenced by the start of injection and the therewith connected temperature and mixture distribution. Furthermore spark assisted HCCI combustion at high load was investigated by thermodynamic analyses and com- bustion visualization. The results of the combustion visualization and heat release analyses suggest a superposition of flame front propagation and autoignition. Therefore the kinetic model to describe autoignition was coupled with a model to describe the turbulent flame propagation and three averaged cycles at different load were simulated. In all cases a good accordance between simulation and experiment can be stated. Like the results of the combustion visualiza- tion the simulations show a propagating flame front near the spark plug followed by sequential autoignition in the outer regions of the combustion chamber. INTRODUCTION Autoignition of gasoline is realized by compressing a fuel/air mixture until autoignition occurs. The high tem- peratures required for autoignition are obtained by trap- ping hot residual gas in the combustion chamber. In contrast, combustion in conventional gasoline engines, induced by spark ignition, leads to a propagating flame front and the subsequent combustion of the homogene- ous fuel/air mixture. Since conventional combustion of gasoline/air mixtures requires low dilution or near stoichiometric mixtures to guarantee low cycle-to-cycle fluctuations, high temperatures in the flame front and high NO x emissions cannot be avoided. In HCCI com- bustion, fuel conversion with high dilution and very lean mixtures is feasible. Therefore, peak temperatures in the combustion chamber are reduced and NO x formation due to high temperatures can be avoided. With HCCI short combustion duration and high efficiency are accom- plished [1],[2]. In [3] Kaufmann observed an influence of the spark ignition on the combustion timing which enables an extension of the operating map in HCCI mode. At low load the development of a flame front near the spark plug is avoided by high amounts of residual gas [4]. Hence it can be suggested that the HCCI combustion cannot be influenced by spark ignition at operating points with high EGR. Contra wise a superposition of flame front and HCCI combustion in operating points with low EGR is conceivable. In this work thermodynamic and numerical analyses of the engine operation in HCCI and spark assisted HCCI mode have been carried out, based on experimen- tal investigations using a single cylinder engine with optical access. The adaptation of a three-dimensional visualization system enabled an insight on the actual process inside the engine. For treating the chemical reac- tions an efficient model was developed and coupled with a commercial CFD-Code to describe the spatial progress of the reactions. To analyze the effects of mixture homo- geneity on the progress of the reactions, thermodynamic and numeric simulations of the engine operation in CAI mode with different injection timing have been per- formed. To clarify the influence of spark assistance on autoignition in gasoline engines, combustion visualiza- tion, heat release analyses and numerical simulations have been carried out at different operating points. Therefore the kinetic model to describe the autoignition was coupled with a model to describe the turbulent flame propagation and three averaged engine cycles at different load were simulated. In all cases a good accordance between simulation and experiment can be stated.
Transcript
Numerical Analyses of the Effects of Mixture Quality on the Controlled Autoignition in Gasoline Engines
*Sebastian Hensel, Werner Sauter, Fatih Sarikoc, Heiko Kubach and Ulrich Spicher Institut für Kolbenmaschinen (Institute of Reciprocating Engines), University of Karlsruhe (TH)
Alexander Schubert, Robert Schießl and Ulrich Maas Institut für Technische Thermodynamik, University of Karlsruhe (TH)
Key Words: HCCI, CAI, Autoignition, Modeling, CFD
ABSTRACT Controlled autoignition in gasoline engines is a promising concept to simultaneously reduce both emissions and fuel
consumption of internal combustion engines. To describe the spatial progress of the chemical reactions in three-dimensional simulations of CAI engine cycles an efficient combustion chemistry model was developed. To analyze the effects of mixture homogeneity on the progress of the reactions, thermodynamic analyses and numerical simulations of engine operation in HCCI mode have been performed based on experimental investigations with an optically-accessible single-cylinder engine. The numerical simulations were used to interpret the experimental observations in terms of mixing and reaction progress. Both experimental investigations and simulations show that injection timing is a feasible control parameter for the optimization of operating points because autoignition is influenced by the start of injection and the therewith connected temperature and mixture distribution.
Furthermore spark assisted HCCI combustion at high load was investigated by thermodynamic analyses and com-bustion visualization. The results of the combustion visualization and heat release analyses suggest a superposition of flame front propagation and autoignition. Therefore the kinetic model to describe autoignition was coupled with a model to describe the turbulent flame propagation and three averaged cycles at different load were simulated. In all cases a good accordance between simulation and experiment can be stated. Like the results of the combustion visualiza-tion the simulations show a propagating flame front near the spark plug followed by sequential autoignition in the outer regions of the combustion chamber.
INTRODUCTION Autoignition of gasoline is realized by compressing a
fuel/air mixture until autoignition occurs. The high tem-peratures required for autoignition are obtained by trap-ping hot residual gas in the combustion chamber. In contrast, combustion in conventional gasoline engines, induced by spark ignition, leads to a propagating flame front and the subsequent combustion of the homogene-ous fuel/air mixture. Since conventional combustion of gasoline/air mixtures requires low dilution or near stoichiometric mixtures to guarantee low cycle-to-cycle fluctuations, high temperatures in the flame front and high NOx emissions cannot be avoided. In HCCI com-bustion, fuel conversion with high dilution and very lean mixtures is feasible. Therefore, peak temperatures in the combustion chamber are reduced and NOx formation due to high temperatures can be avoided. With HCCI short combustion duration and high efficiency are accom-plished [1],[2].
In [3] Kaufmann observed an influence of the spark ignition on the combustion timing which enables an extension of the operating map in HCCI mode. At low load the development of a flame front near the spark plug is avoided by high amounts of residual gas [4]. Hence it can be suggested that the HCCI combustion cannot be influenced by spark ignition at operating points with high EGR. Contra wise a superposition of flame front and
HCCI combustion in operating points with low EGR is conceivable.
In this work thermodynamic and numerical analyses of the engine operation in HCCI and spark assisted HCCI mode have been carried out, based on experimen-tal investigations using a single cylinder engine with optical access. The adaptation of a three-dimensional visualization system enabled an insight on the actual process inside the engine. For treating the chemical reac-tions an efficient model was developed and coupled with a commercial CFD-Code to describe the spatial progress of the reactions. To analyze the effects of mixture homo-geneity on the progress of the reactions, thermodynamic and numeric simulations of the engine operation in CAI mode with different injection timing have been per-formed. To clarify the influence of spark assistance on autoignition in gasoline engines, combustion visualiza-tion, heat release analyses and numerical simulations have been carried out at different operating points. Therefore the kinetic model to describe the autoignition was coupled with a model to describe the turbulent flame propagation and three averaged engine cycles at different load were simulated. In all cases a good accordance between simulation and experiment can be stated.
EXPERIMENTAL SETUP The single-cylinder engine used for this study (see
Table 1) is a modified BMW/Rotax F650 four-stroke motorcycle engine. Engine modifications include the addition of vane-type cam phasers and direct fuel injec-tion. Autoignition is achieved via symmetric negative valve overlap [11]. The investigations have been carried out with a synthetic fuel consisting of different compo-nents with the main species iso-octane, iso-dodecane and cyclo-hexane so that it matches the characteristics of 4-star petrol.
Basic engine BMW / Rotax F650 Engine Type Single-cylinder,four-valve Compression ratio 11.5 Displacement 652 cm3 Bore x Stroke 100 mm x 84 mm
Mixture formation Swirl injector Injection pressure 125 bar Maximum lift, IV / EV 2 mm / 1.5 mm Opening duration, IV / EV 120 CAD / 100 CAD Intake valve closing 182 – 140 CAD BTDC Exhaust valve closing 272 – 324 CAD ATDC
Table 1: Technical specifications of the test engine
The three-dimensional visualization system [5] con-sists of three fiber optical endoscopes and three cameras. The camera system used is characterized by a high sensi-tivity for ultraviolet radiation. The high temporal resolu-tion of the measurement system allows the recording of ten pictures each crank angle degree at a speed of 2000 rpm.
CHEMICAL MODEL In this work an efficient model for treating the
chemical reactions in a CFD-Code was developed. The model is based on a detailed reaction mechanism which was generated for the investigated fuel by an automatic mechanism generator [6]. To link the detailed chemical mechanism with the CFD-code the influence of chemis-try is modeled by one additional governing equation for the progress variable χ. This progress variable describes the progress of the chemical reaction. The chemical rate of the progress variable (dχ/dt)chem is calculated and tabu-lated as a function of the physical conditions:
(dχ/dt)chem = f(χ, λ, T0, p, ξ)
The conditions are the actual value of the progress variable χ, the air/fuel ratio λ, the oxidizer temperature T0, the pressure p and the mixture fraction ξ of the ex-haust gas. Fig. 1 shows the schematic implementation of the progress variable model in the CFD-code. For given values of the pressure, air/fuel ratio, enthalpy of the mix-ture and EGR rate, the rate of the chemical progress (dχ/dt)chem and the derivatives of the mass fractions of the species dYi/dχ are passed to the CFD-code.
CFD time stepChemical kineticmodelFortschritts-variablenmodellTabelle (ITT)(dχχχχ/dt)chem, dYi/dχχχχ
CFD Zeitschritt
λλλλ, h, p, χ,χ,χ,χ,
ξξξξ
dλλλλ/dt, ΣΣΣΣYihi, dp/dt, (dχχχχ////dt)chem
CFD time stepChemical kineticmodel
Fig. 1: Schematic implementation of the progress vari-
able model in the CFD-code
The scaled arc length of the reaction trajectory in the state space was identified as adequate progress variable χ. Fig. 2 shows an example for a reaction trajectory. The development of the ignition and the combustion are shown in the CO2, CO and CH2O mass fraction sub-space. The values of the progress variable are between 0 (fresh mixture of fuel and air before start on any reac-tions) and 1 (chemical equilibrium after combustion). The color of the reaction trajectory represents the tem-perature during the combustion process.
χχχχ = 0
χχχχ = 1
Fig. 2: Reaction trajectory in the CO2, CO and CH2O mass fraction subspace
The arc length of the reaction trajectory is calculated by the following equation:
tdwY
tdwY
)t(n
i i
i
t n
i i
i
′
′
=
∫ ∑
∫ ∑
∞
=
=
0 1
2
0 1
2
D
D
χ
iYD describes the temporal derivation of the mass frac-tion of the species i and n is the number of all species. To represent all phases of the combustion realistically by the progress variable, weighting factors wi are used for the different species.
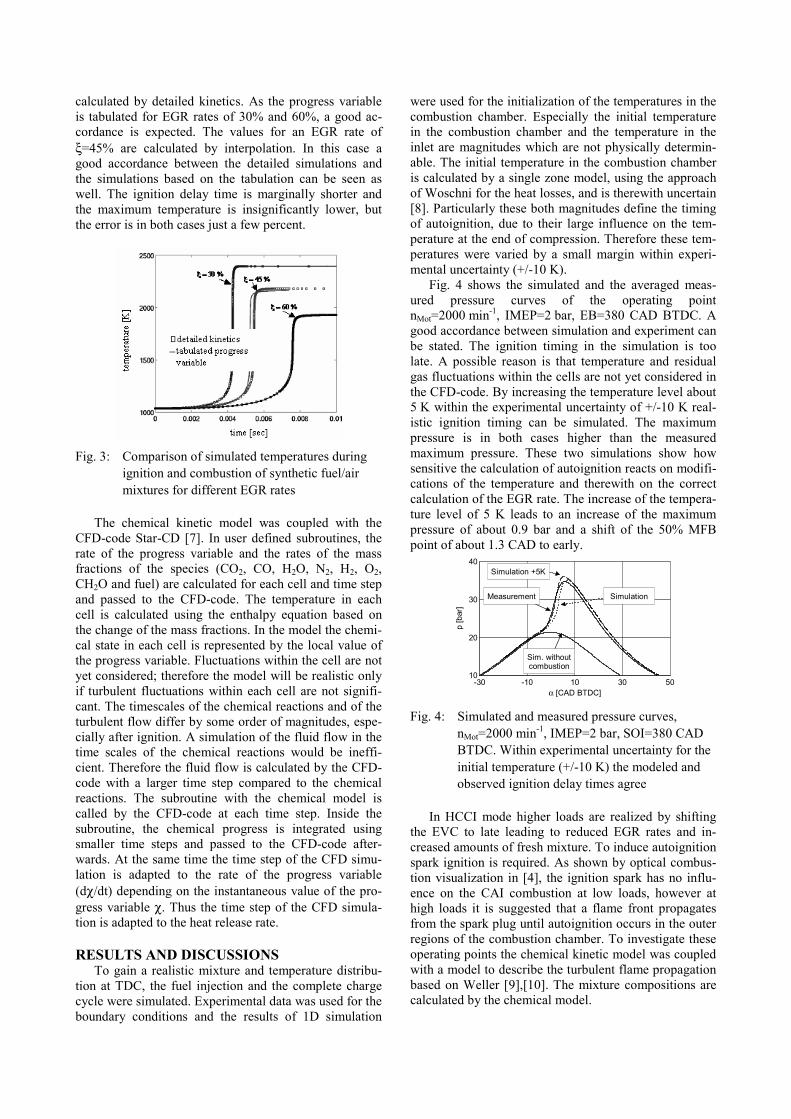
Fig. 3 shows, for a simple homogeneous reactor model, a comparison of numerical simulations based on detailed kinetics and simulations based on the progress variable model. The initial conditions of both simulations are identical. The temperature traces of the detailed and the tabulated simulations for EGR rates of ξ=30% and ξ=60% show a good accordance. The ignition delay time and the maximum temperatures correspond to the ones
calculated by detailed kinetics. As the progress variable is tabulated for EGR rates of 30% and 60%, a good ac-cordance is expected. The values for an EGR rate of ξ=45% are calculated by interpolation. In this case a good accordance between the detailed simulations and the simulations based on the tabulation can be seen as well. The ignition delay time is marginally shorter and the maximum temperature is insignificantly lower, but the error is in both cases just a few percent.
Fig. 3: Comparison of simulated temperatures during
ignition and combustion of synthetic fuel/air mixtures for different EGR rates
The chemical kinetic model was coupled with the CFD-code Star-CD [7]. In user defined subroutines, the rate of the progress variable and the rates of the mass fractions of the species (CO2, CO, H2O, N2, H2, O2, CH2O and fuel) are calculated for each cell and time step and passed to the CFD-code. The temperature in each cell is calculated using the enthalpy equation based on the change of the mass fractions. In the model the chemi-cal state in each cell is represented by the local value of the progress variable. Fluctuations within the cell are not yet considered; therefore the model will be realistic only if turbulent fluctuations within each cell are not signifi-cant. The timescales of the chemical reactions and of the turbulent flow differ by some order of magnitudes, espe-cially after ignition. A simulation of the fluid flow in the time scales of the chemical reactions would be ineffi-cient. Therefore the fluid flow is calculated by the CFD-code with a larger time step compared to the chemical reactions. The subroutine with the chemical model is called by the CFD-code at each time step. Inside the subroutine, the chemical progress is integrated using smaller time steps and passed to the CFD-code after-wards. At the same time the time step of the CFD simu-lation is adapted to the rate of the progress variable (dχ/dt) depending on the instantaneous value of the pro-gress variable χ. Thus the time step of the CFD simula-tion is adapted to the heat release rate.
RESULTS AND DISCUSSIONS To gain a realistic mixture and temperature distribu-
tion at TDC, the fuel injection and the complete charge cycle were simulated. Experimental data was used for the boundary conditions and the results of 1D simulation
were used for the initialization of the temperatures in the combustion chamber. Especially the initial temperature in the combustion chamber and the temperature in the inlet are magnitudes which are not physically determin-able. The initial temperature in the combustion chamber is calculated by a single zone model, using the approach of Woschni for the heat losses, and is therewith uncertain [8]. Particularly these both magnitudes define the timing of autoignition, due to their large influence on the tem-perature at the end of compression. Therefore these tem-peratures were varied by a small margin within experi-mental uncertainty (+/-10 K).
Fig. 4 shows the simulated and the averaged meas-ured pressure curves of the operating point nMot=2000 min-1, IMEP=2 bar, EB=380 CAD BTDC. A good accordance between simulation and experiment can be stated. The ignition timing in the simulation is too late. A possible reason is that temperature and residual gas fluctuations within the cells are not yet considered in the CFD-code. By increasing the temperature level about 5 K within the experimental uncertainty of +/-10 K real-istic ignition timing can be simulated. The maximum pressure is in both cases higher than the measured maximum pressure. These two simulations show how sensitive the calculation of autoignition reacts on modifi-cations of the temperature and therewith on the correct calculation of the EGR rate. The increase of the tempera-ture level of 5 K leads to an increase of the maximum pressure of about 0.9 bar and a shift of the 50% MFB point of about 1.3 CAD to early.
p [b
ar]
10
20
30
40
α [CAD BTDC]-30 -10 10 30 50
Measurement Simulation
Sim. withoutcombustion
Simulation +5K
Fig. 4: Simulated and measured pressure curves,
nMot=2000 min-1, IMEP=2 bar, SOI=380 CAD BTDC. Within experimental uncertainty for the initial temperature (+/-10 K) the modeled and observed ignition delay times agree
In HCCI mode higher loads are realized by shifting the EVC to late leading to reduced EGR rates and in-creased amounts of fresh mixture. To induce autoignition spark ignition is required. As shown by optical combus-tion visualization in [4], the ignition spark has no influ-ence on the CAI combustion at low loads, however at high loads it is suggested that a flame front propagates from the spark plug until autoignition occurs in the outer regions of the combustion chamber. To investigate these operating points the chemical kinetic model was coupled with a model to describe the turbulent flame propagation based on Weller [9],[10]. The mixture compositions are calculated by the chemical model.
Fig. 5 shows the simulated and the averaged meas-ured pressure curves at a spark assisted operating point nMot=2000 min-1, IMEP=5 bar. A good accordance be-tween simulation and experiment can be stated. The pressure rise is a bit too steep and the maximum pressure is about 1 bar higher than the measured maximum pres-sure. As mentioned before, possible reasons are that temperature and residual gas fluctuations within the cells are not yet considered in the CFD-code and inaccuracies in the simulation of the mixture preparation and the charge cycle as well as the wall heat transfer.
p [b
ar]
10
20
30
40
50
α [CAD ATDC]-30 -10 10 30 50
MeasurementSimulation
Fig. 5: Simulated and measured pressure curves,
nMot=2000 min-1, IMEP=5 bar
The adaptation of the three dimensional visualization system and the CFD simulation provide an insight into the temporal and spatial progress of the reactions. It could be shown that the progress variable model can be used for phenomenological analyses of the influence of mixture quality and homogeneity on the combustion. With this model qualitative prediction of the ignition timing, the distribution of the ignition spots, the burn duration and the pressure gradients can be made.
EFFECT OF INJECTION TIMING In [11] it was illustrated by experimental investiga-
tions that the start of injection has a major effect on the operating behavior in HCCI mode. By varying the start of injection, the 50% mass fraction burned point can be adjusted and a minimization of the maximum pressure rise (dp/dα) is feasible. To determine the influence of the mixture homogeneity on the progress of autoignition the local and temporal progress of autoignition was analyzed by CFD simulation for three different injection timings (SOI=380, 320, 260 CAD BTDC) at the operating point nMot=2000 min-1, IMEP=2 bar. In all cases the EVC was adapted to adjust an air/fuel ratio of λ=1.15. In Table 2 the operating data for the experimental investigations are given.
Fig. 6 shows a comparison of the measured and simu-lated pressure curves. A good comparison is achieved by using the chemical kinetic model developed in this work. Retarding the start of injection leads to later 50% mass fraction burned points and lower heat release rates.
In Table 3 the experimental and simulated maximum pressure gradients (dp/dα), the 10% and 50% mass frac-tion burned points, the indicated hydrocarbons (HCi) and carbon monoxides (COi) are given. The experimental and simulated results show the known effects of the injection
timing on the combustion. An early start of injection leads to an early 50% mass fraction burned point and therefore to a slightly higher indicated fuel consumption. The early combustion leads to high mass fractions burned and to low indicated hydrocarbons.
Table 2: Operating data with early, middle and late injec-
tion timing
p cyl
,exp
[bar
]
14
20
26
32
38
α [CAD BTDC]-20 -10 0 10 20 30 40
380 CAD BTDC
320 CAD BTDC
260 CAD BTDC
p cyl
,sim
[bar
]
14
20
26
32
38
α [CAD BTDC]-20 -10 0 10 20 30 40
380 CAD BTDC320 CAD BTDC
260 CAD BTDC
Fig. 6: Comparison of measured (left) and simulated
(right) pressure curves.
Shifting the start of injection from 380 CAD to 320 CAD BTDC leads to a higher mass flow of fresh air. To keep the air/fuel ratio constant the EVC was shifted to early. The 50% mass fraction burned point is shifted to late which allows a reduction of the injected fuel mass. The operating stability changes slightly from σIMEP=2% to 2.2%. The hydrocarbons and CO-emissions increase, while the mass fraction burned decreases.
Table 3: Experimental and simulated characteristic data of the combustion
Shifting the injection timing to late (SOI=260 CAD BTDC) leads to a decreasing mass fraction burned and to increasing CO- and HC-emissions. To keep the load constant more fuel is required and to keep the air/fuel ratio constant the exhaust valve closing is shifted to late.
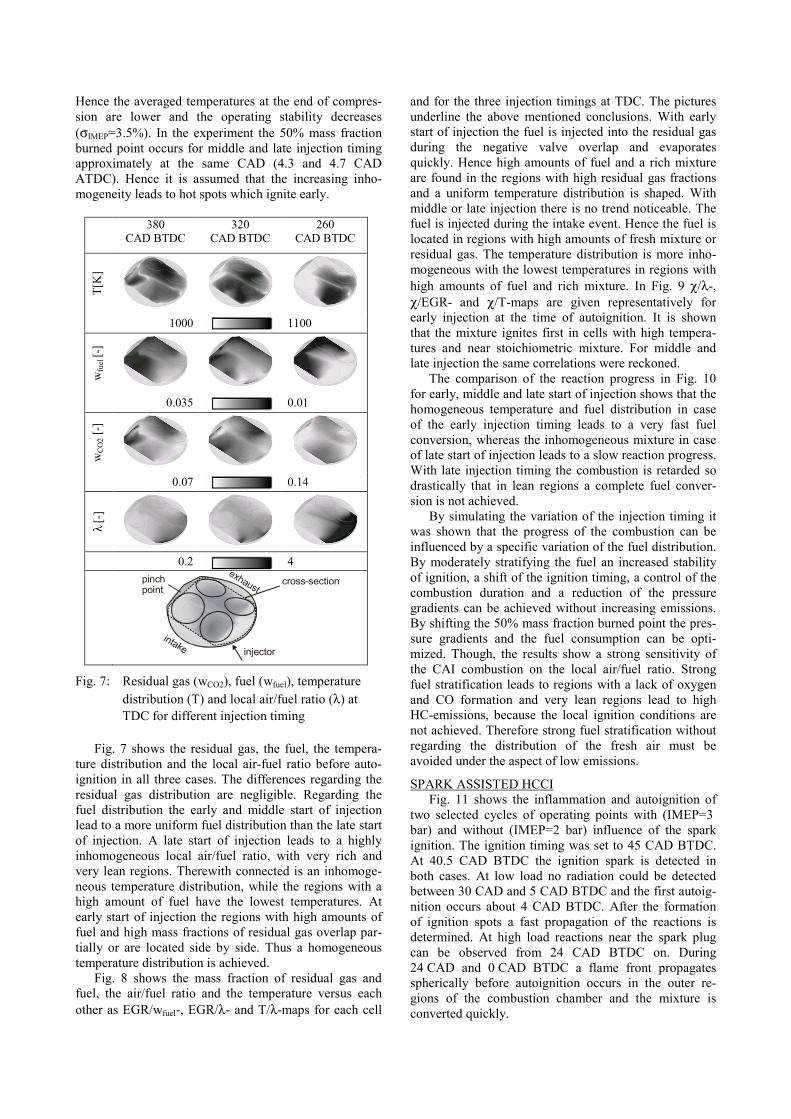
Hence the averaged temperatures at the end of compres-sion are lower and the operating stability decreases (σIMEP=3.5%). In the experiment the 50% mass fraction burned point occurs for middle and late injection timing approximately at the same CAD (4.3 and 4.7 CAD ATDC). Hence it is assumed that the increasing inho-mogeneity leads to hot spots which ignite early.
380 CAD BTDC
320 CAD BTDC
260 CAD BTDC
T[K
]
1000 1100
wfu
el [-
]
0.035 0.01
wC
O2 [
-]
0.07 0.14
λ [-
]
0.2 4
intake
exhaustpinch point
cross-sectiont
injector
Fig. 7: Residual gas (wCO2), fuel (wfuel), temperature distribution (T) and local air/fuel ratio (λ) at TDC for different injection timing
Fig. 7 shows the residual gas, the fuel, the tempera-ture distribution and the local air-fuel ratio before auto-ignition in all three cases. The differences regarding the residual gas distribution are negligible. Regarding the fuel distribution the early and middle start of injection lead to a more uniform fuel distribution than the late start of injection. A late start of injection leads to a highly inhomogeneous local air/fuel ratio, with very rich and very lean regions. Therewith connected is an inhomoge-neous temperature distribution, while the regions with a high amount of fuel have the lowest temperatures. At early start of injection the regions with high amounts of fuel and high mass fractions of residual gas overlap par-tially or are located side by side. Thus a homogeneous temperature distribution is achieved.
Fig. 8 shows the mass fraction of residual gas and fuel, the air/fuel ratio and the temperature versus each other as EGR/wfuel-, EGR/λ- and T/λ-maps for each cell
and for the three injection timings at TDC. The pictures underline the above mentioned conclusions. With early start of injection the fuel is injected into the residual gas during the negative valve overlap and evaporates quickly. Hence high amounts of fuel and a rich mixture are found in the regions with high residual gas fractions and a uniform temperature distribution is shaped. With middle or late injection there is no trend noticeable. The fuel is injected during the intake event. Hence the fuel is located in regions with high amounts of fresh mixture or residual gas. The temperature distribution is more inho-mogeneous with the lowest temperatures in regions with high amounts of fuel and rich mixture. In Fig. 9 χ/λ-, χ/EGR- and χ/T-maps are given representatively for early injection at the time of autoignition. It is shown that the mixture ignites first in cells with high tempera-tures and near stoichiometric mixture. For middle and late injection the same correlations were reckoned.
The comparison of the reaction progress in Fig. 10 for early, middle and late start of injection shows that the homogeneous temperature and fuel distribution in case of the early injection timing leads to a very fast fuel conversion, whereas the inhomogeneous mixture in case of late start of injection leads to a slow reaction progress. With late injection timing the combustion is retarded so drastically that in lean regions a complete fuel conver-sion is not achieved.
By simulating the variation of the injection timing it was shown that the progress of the combustion can be influenced by a specific variation of the fuel distribution. By moderately stratifying the fuel an increased stability of ignition, a shift of the ignition timing, a control of the combustion duration and a reduction of the pressure gradients can be achieved without increasing emissions. By shifting the 50% mass fraction burned point the pres-sure gradients and the fuel consumption can be opti-mized. Though, the results show a strong sensitivity of the CAI combustion on the local air/fuel ratio. Strong fuel stratification leads to regions with a lack of oxygen and CO formation and very lean regions lead to high HC-emissions, because the local ignition conditions are not achieved. Therefore strong fuel stratification without regarding the distribution of the fresh air must be avoided under the aspect of low emissions.
SPARK ASSISTED HCCI Fig. 11 shows the inflammation and autoignition of
two selected cycles of operating points with (IMEP=3 bar) and without (IMEP=2 bar) influence of the spark ignition. The ignition timing was set to 45 CAD BTDC. At 40.5 CAD BTDC the ignition spark is detected in both cases. At low load no radiation could be detected between 30 CAD and 5 CAD BTDC and the first autoig-nition occurs about 4 CAD BTDC. After the formation of ignition spots a fast propagation of the reactions is determined. At high load reactions near the spark plug can be observed from 24 CAD BTDC on. During 24 CAD and 0 CAD BTDC a flame front propagates spherically before autoignition occurs in the outer re-gions of the combustion chamber and the mixture is converted quickly.
380
CA
D B
TDC
32
0 C
AD
BTD
C
260
CA
D B
TDC
Fig. 8: Residual gas, fuel mass fraction, air/fuel ratio and temperature at TDC
Fig. 9: Chemical progress variable χ
vs. λ, EGR and temperature for each cell at ignition, EB= 380 CAD BTDC
Fig. 10: Progress of the reactions in case of early, middle and late start of injection; CO mass fraction (wCO) and fuel concentration (wfuel) after combustion.
In Fig. 12 the heat release rates are shown. At IMEP=3 bar the heat release rates increase consistently at the beginning of the combustion during the flame front propagation. The fast conversion after TDC which was determined by the combustion visualization is observed by the sudden increase of the heat release rate as well. Before TDC less than 20% of the mass fraction is burned while 80% of the mass fraction is converted during the next 10 CAD. Hence this operating point still shows the typical behavior of controlled autoignition. Due to the minor load the heat release rate at IMEP=2 bar is smaller and shows a sudden increase as combustion starts.
Three different operating points were simulated at IMEP=2.7 bar, 4 bar and 5 bar, and nMot=2000 min-1. The ignition timing was set to 30 CAD BTDC at 2.7 bar and to 15 CAD BTDC at 4 and 5 bar. The pressure curves of the measurement and simulation are given in Fig. 13. For IMEP=2.7 bar and 5 bar measured and simulated heat release rates are shown in Fig. 14. At low load the com-bustion starts in the simulation at about 3 CAD ATDC with a sudden increase of the HRR. Before TDC nearly no heat is released. At high load the heat release rate increases consistently at the beginning of the combustion during the flame front propagation as determined in the experiment. At about 6 CAD ATDC the heat release rate
increases quickly as autoignition occurs in the outer regions of the combustion chamber.
Z
ugan
g141° 40,5° 40° 39° 35° 34° 30° 27° 24° 21°
18° 15° 12° 9° 4° 2° 1° 0° -1° -4°
IMEP
=2 b
ar
Zug
ang1
41° 40,5° 40° 39° 35° 34° 30° 27° 24° 21°
18° 15° 12° 9° 4° 2° 1° 0° -1° -4°
IMEP
=2 b
ar
Zug
ang1
41° 40,5° 40° 39° 35° 34° 30° 27° 24° 21 °
18° 15° 12° 9° 6° 3° 0° -3° -3,5° -4 °
IMEP
=3 b
ar
Zug
ang1
41° 40,5° 40° 39° 35° 34° 30° 27° 24° 21 °
18° 15° 12° 9° 6° 3° 0° -3° -3,5° -4 °
IMEP
=3 b
ar
Fig. 11: Combustion visualization of operating points with (bottom) and without (top) influence of the ignition spark;
ignition at 45 CAD BTDC
HR
R [J
/°KW
]
0
25
50
75
100
α [CAD BTDC]-10010203040
IMEP=3 bar
IMEP=2 bar
Fig. 12: Measured HRR of selected cycles with spark
assisted autoignition (IMEP=3 bar) and homo-geneous autoignition (IMEP=2 bar)
Fig. 15 shows the progress of the reactions for the three different loads. At IMEP=2.7 bar the reactions start after 2 CAD ATDC in a decentral region. During the next 6 CAD the mixture converts in large parts of the combustion chamber. The ignition spark has no influence on the inflammation. At IMEP=4 bar a propagating flame front near the spark plug is observed. After 4 CAD ATDC autoignition occurs in the outer regions of the combustion chamber. Starting at different hot spots the reaction fronts propagate through the unburned regions with up to 60 m/s. The remaining mixture converts in between 6 CAD which is characteristic for CAI combus-tion. At IMEP=5 bar flame front propagation is observed until 6 CAD ATDC as well. Afterwards autoignition occurs and the reaction fronts propagate radial into the outer regions of the combustion chamber with velocities about 80 m/s.
p cyl
,exp
[bar
]
24
30
36
42
48
α [CAD ATDC]-20 -10 0 10 20 30 40
5 bar
4 bar
2.7 bar
p cyl
,sim
[bar
]24
30
36
42
48
α [CAD ATDC]-20 -10 0 10 20 30 40
5 bar
4 bar
2.7 bar
Fig. 13: Averaged measured (left) and simulated (right)
pressure curves at IMEP=2.7 bar, IMEP=4 bar, IMEP=5 bar and nMot=2000 min-1
HR
R [J
/°KW
]
0
40
80
120
160
α [CAD ATDC]-20 -10 0 10 20 30 40
2.7 bar
5 bar
HR
R [J
/°KW
]
0
40
80
120
160
α [CAD ATDC]-20 -10 0 10 20 30 40
2.7 bar
5 bar
Fig. 14: Averaged measured (left) and simulated (right)
HRR at IMEP=2.7 bar and 5 bar
The contexts observed by experimental investigations are well reflected by the simulations using quite simple and efficient models. At low load the spark ignition has no influence on the HCCI combustion, due to the high amount of residual gas. At higher load the mixture is inflamed near the spark plug and flame fronts propagate spherically in radial direction until autoignition and CAI specific combustion occurs in the decentral regions of the combustion chamber.
2.7 bar 4 bar 5 bar
-5°
0°
2°
4°
6°
8°
10°
Fig. 15: Progress of the reactions for IMEP=2.7 bar, IMEP=4 bar and IMEP=5 bar
CONCLUSIONS Within this work the process of autoignition was in-
vestigated in a combined project of engine experiments and simulation. The development of a chemical kinetic model to describe the spatial progress of the reactions enabled the analysis of the engine behavior in CAI op-eration by three-dimensional simulations. To clarify the influence of spark assistance on autoignition in gasoline engines, the kinetic model to describe the autoignition was coupled with a model to describe the turbulent flame front propagation. In all cases a good accordance be-tween simulation and experiment can be stated, despite the simplification that the small scale turbulent fluctua-tions are not yet considered, which renders the model efficient. In future work the model will be extended by coupling statistical models with the progress variable model.
To analyze the effects of mixture homogeneity on the progress of the reactions, experimental investigations and numeric simulations of the engine operation in CAI mode with different injection timing have been per-formed. The direct injection of gasoline is an important control parameter for the optimization of operating points, since the combustion timing is influenced by the start of injection.
As well as the injection timing the spark assistance is a feasible control parameter for the adjustment of the 50% mass fraction burned point. The influence of the ignition spark on the combustion timing and on the pos-
sible operating map increases with decreased residual gas rates. With increasing load, a superposition of flame front propagation at the spark plug followed by sequen-tial autoignition was determined in experimental investi-gations as well as in simulations.
ACKNOWLEDGEMENT The helpful support of the Forschungsvereinigung
Verbrennungskraftmaschinen (FVV) is gratefully ac-knowledged. Furthermore the authors wish to express their thanks to Deutsche Forschungsgemeinschaft (DFG) for funding parts of the research activities presented in this paper.
REFERENCES
[1] Lavy, J.; Dabadie, J.-C.; Angelberger, C.; Duret, P.; Juretzka, A.; Schäflein, J.; Ma, T. H.; Lendres-se, Y.; Satre, A.; Schulz, C.; Krämer, H.; Zhao, H.; Damiano, L.: Innovative Ultralow NOx Controlled Auto-Ignition Combustion Process for Gasoline Engines: the 4-Space Project, SAE Technical Paper 2000-01-1837, 2000
[2] Najit, P. M.; Foster, D. E.: Compression-Ignited Homogeneous Charge Combustion, SAE Techni-cal Paper 830264, 1983
[3] Kaufmann, M.: Thermodynamische Analyse des kompressionsgezündeten Benzinmotors, Disserta-tion, Technische Universität Graz, 2005
[4] Sauter, W.; Hensel, S.; Spicher, U.; Schubert, A.; Schießl, R.; Maas, U.: Experimentelle und nume-rische Untersuchung der Selbstzündungsmecha-nismen für einen HCCI-Benzinbetrieb, 16. Aa-chener Kolloquium Fahrzeug- und Motorentech-nik, 08.-10. Okt. 2007, Aachen
[5] Han, K.-M.; Velji, A.; Spicher U.: A New Ap-proach for Three-Dimensional High-Speed Com-bustion Diagnostics in Internal Combustion En-gines, SAE Technical Paper 2006-01-3315
T.-W.; Najt, P.; Rask, R.: New Heat Transfer Cor-relation for an HCCI Engine Derived from Meas-urements of Instantaneous Surface Heat Flux, SAE Powetrain & Fluid Systems Conference & Exhibition, Tampa, Florida USA, October 25.28, 2004
[10] Weller, H.G.: Development of a New Flame Area Combustion Model Using Conditional Averaging, TF/9307, Department of Mechanical Engineering, Imperial College, 1993
[11] Sauter, W.: Untersuchungen zur homogen kom-pressionsgezündeten Verbrennung mit Ventilun-terschneidung und Benzin-Direkteinspritzung, Dissertation, Universität Karlsruhe (TH), 2007