American Institute of Aeronautics and Astronautics 1 Numerical Analysis of a Pulse Detonation Cross Flow Heat Load Experiment Daniel E. Paxson * NASA Glenn Research Center, Cleveland, Ohio, 44130 Andrew G. Naples † and John L. Hoke ‡ Innovative Scientific Solutions Inc., Dayton, OH, 45440 Fred Schauer § Air Force Research Laboratory, Propulsion Directorate, Wright-Patterson AFB, OH, 45433 A comparison between experimentally measured and numerically simulated, time- averaged, point heat transfer rates in a pulse detonation (PDE) engine is presented. The comparison includes measurements and calculations for heat transfer to a cylinder in cross- flow and to the tube wall itself using a novel spool design. Measurements are obtained at several locations and under several operating conditions. The measured and computed results are shown to be in substantial agreement, thereby validating the modeling approach. The model, which is based in computational fluid dynamics (CFD) is then used to interpret the results. A preheating of the incoming fuel charge is predicted, which results in increased volumetric flow and subsequent overfilling. The effect is validated with additional measurements. Nomenclature A = area a/f = air –to-fuel ratio c p = specific heat at constant pressure c wa = specific heat of water D = main tube diameter d = cross-flow tube diameter d H = hydraulic diameter obst = obstacle pitch = ratio of specific heats H f = fuel lower heating value h = heat transfer coefficient viscosity k = thermal conductivity k eq = equivalent thermal conductivity for a composite material L = length m = mass flow rate Nu = Nusselt number, hd/k p = pressure Pr = Prandtl number, c p /k Q = heat transfer rate R = real gas constant * Aerospace Research Engineer, 21000 Brookpark Road/MS 77-1,Cleveland, OH, 44135, AIAA Associate Fellow † Research Engineer, 2766 Indian Ripple Rd., Dayton, OH 45440, AIAA Member ‡ Senior Engineer, 2766 Indian Ripple Rd., Dayton, OH 45440, AIAA Senior Member § Research Engineer, 1790 Loop Rd., Dayton, OH 45433, AIAA Senior Member https://ntrs.nasa.gov/search.jsp?R=20120004155 2018-06-02T10:07:44+00:00Z
Transcript
American Institute of Aeronautics and Astronautics
1
Numerical Analysis of a Pulse Detonation Cross Flow Heat
Load Experiment
Daniel E. Paxson*
NASA Glenn Research Center, Cleveland, Ohio, 44130
results from long duration tests run to thermal equilibrium. Analysis of the numerical results showed that the
reduction was largely due to heat transfer effects, which can be summarized as follows: a) relatively hot walls
preheat the incoming fresh charge resulting in spillage of detonable fluid (overfilling from increased volumetric
flow); b) the preheated charge in the tube is less dense and therefore results in a lower post-detonative, thrust
producing pressure; c) relatively cold walls cool the hot, post-detonative gas thereby reducing useful work
extraction. It is noted however that, although the effects just mentioned were indicated by the simulation results,
and although the simulation correctly predicted thrust, there was no definitive proof that the heat transfer rates were
correct, or that any of the effects mentioned were actually occurring.
In 2009 however, an experiment was conducted at the Air Force Research Laboratory in which time averaged
heat transfer was measured on a cross-flow tube placed within, but near the exit of, the main tube of a PDE9. The
setup was then reconfigured such that the cross-flow tube was exposed to steady, deflagrative combustion products,
at the same overall equivalence ratio and averaged flow rates as the PDE. This was done by effectively removing
the controlling valves of the PDE, and installing a flameholding device upstream of the cross-flow tube.
The surprising result of this experiment was that the detonative heat loads were less than those from deflagration.
The logical conclusion drawn was that, while heat transfer rates are substantial during the actual detonation process,
the detonation is of such short duration that the total heat transferred with each cycle is relatively small.
From the perspectives of analysis, simulation, and prediction of PDE heat transfer rates, this experiment
represented an excellent opportunity to validate the model approach just mentioned8. This paper describes such an
effort. The experiment and simulation will first be described, albeit briefly since they have been detailed in previous
publications. The assumed heat transfer path of the crossflow tube will be presented next, along with the
correlations used to obtain heat transfer coefficients. Predicted heat flux will then be compared to measured values.
P
American Institute of Aeronautics and Astronautics
3
The initial validation effort led to further experimental testing and simulation work, which will also be presented.
The crossflow tube was replaced with a spool piece capable of measuring main tube wall heat transfer rates, which
are more relevant to PDE performance. Modification details will be shown. Simulated and measured results will
then be compared.
The results will show that the correlated heat transfer coefficient approach to modeling heat transfer effects is
reasonably accurate. Furthermore, it will show that heat transfer can substantially alter the operation of a PDE by
preheating the incoming flow, subsequently causing spillage, reducing thrust, and reducing total heat transferred.
II. Experimental Rig Description
The experimental results are obtained from the PDE at the Air Force Research Laboratory‟s Pulsed Detonation
Research Facility10-11
. This PDE uses the head and valves of an automotive engine to control the airflow into the
detonation tube. The PDE cycle consists of equal time allotted for: i) filling the detonation tube with pre-mixed
ethylene and air at an equivalence ratio of one, ii) ignition, detonation, and blow-down, and iii) purging of the
detonation tube with air. The pressure upstream of the automotive poppet valves is controlled such that, during the
fill cycle, the mass flow of pre-mixed fuel and air is equal to that required to fill the tube to a specified fraction (the
fill fraction) of its volume, at the upstream gas temperature and atmospheric pressure. Purge air (unfueled air which
buffers incoming fresh charge from the residual hot gases of the previous cycle) is controlled in a similar fashion,
and is quantified with a similar purge fraction. The fuel-air mixture is ignited with a 115 mJ spark at the valved end.
Up to four tubes can be sequentially fired on the rig. The frequency of operation, the fill fraction, and the purge
fraction can all be varied, along with fuel to air ratio, the fuel type, and the spark delay. Numerous measurements
are available from the rig, including thrust, and average flow rate. Additionally, the rig can accommodate tubes of
varying length and diameter. For this work, measurements were made on only one tube, and thrust was not
measured.
The experimental setup is shown schematically in Fig. 1. Water was run through the 0.25 in. o.d. cross-flow
tube at a known rate during PDE operation. The temperature change across the cross-flow tube was measured.
With the known specific heat of water, the cycle averaged heat transfer rate into the tube could be calculated from
the following equation.
inoutwawa TTcmQ (1)
The measured heat transfer rate changed (increased) from the start to the finish of each test run. The values used
for the present study were those obtained at the end of runs lasting 7.5 minutes, when thermal equilibrium had nearly
been reached, and heat transfer rate readings were nearly steady.
III. Simulation Description
Details of the simulation used in this study are given in Ref. 8. As such, only a brief description is presented
here. The simulation (a.k.a. model or code) uses a high-resolution, time-accurate, single progress variable, reactive,
quasi-one-dimensional (Q1D) computational fluid dynamics (CFD) code which integrates differential equations of
motion for a calorically perfect gas, thereby capturing the detailed gasdynamic phenomena occurring inside a tube of
specified cross sectional area distribution.
D=0.25
D=2.0
Figure 1 Schematic of the experimental setup. Dimensions are inches.
American Institute of Aeronautics and Astronautics
4
Losses from viscous wall shear forces and heat transfer at the walls are incorporated as source terms with
associated friction and heat transfer coefficient correlations that depend on local fluid velocity, density, and
temperature. Separate correlations are employed for regions with and without DDT obstacles (e.g. the Schelkin
spiral shown in Fig. 1). Heat transfer is assumed to occur between the working fluid and the passage walls only (i.e.
no axial conduction along the tube, and negligible heat transfer on the outside of the tube). Each wall section
corresponding to a numerical cell is assumed to maintain a fixed temperature over the course of one detonative
cycle. The net heat transferred to or from the wall is monitored over the course of the cycle. When each cycle is
complete, the wall temperature is updated via simple Euler integration. The detonative cycle is then repeated with
the updated wall temperature. This process continues until the net heat transfer from each numerical wall section is
zero.
The one-step reaction mechanism of the code is relatively simple. As long as there is reactant present, a
prescribed temperature threshold has been reached, and the non-dimensional reaction rate constant is high enough,
detonation will occur. Initiation and deflagration to detonation details cannot be captured with this mechanism;
however, this is not considered a drawback for the present work.
Boundary conditions are supplied to the code as total conditions at the inlet, and static conditions at the exit. The
conditions are used, along with characteristic equations, to determine appropriate states for “ghost” numerical cells
which lie just outside the computing domain at each end of the tube. Ambient static pressure is imposed at the exit;
however, a logic structure exists within the code such that when the exit flow is supersonic (and cannot sustain a
normal shock), the imposed pressure is neglected and exit conditions are appropriately extrapolated from the
interior. A logic structure also exists such that if the imposed static pressure cannot support outflow, the pressure is
treated as a total value and, together with a supplied total temperature, is used to determine an appropriate inflow
state.
A permanently open boundary condition is maintained at the head end of the tube; however, the pressure and
temperature for this boundary are supplied by a coupled, lumped-volume, well-stirred reactor sub-model of the
cylinder head which comprises the actual head end of the engine. Inflow rates of premixed detonable mixture, or
purge air are prescribed (temporally and quantitatively) to match those of the rig. Outflow from the sub-model at
any given instant of time is equal to the inflow predicted by the head-end numerical cell of the CFD code. Thus, the
state in the sub–model depends on flow quantities from the CFD code, while the flow into the CFD code depends on
states predicted by Euler integrated lumped volume sub-model. Hence, they are coupled
In order to crudely mimic the initiation process which follows spark ignition in the actual rig, the head-end
reaction rate is set several orders of magnitude lower than the value used by the CFD code in the tube.
Generally, the reaction is not allowed to proceed unless the temperature is above a prescribed threshold value.
However, in order to initiate the reaction at a desired „spark‟ time, the threshold criterion is temporarily removed.
For all of the results to be presented, 200 numerical cells were used. The time step was approximately 3 sec.
Other relevant simulation parameters are listed in Table 1.
A. Cross-Flow Tube Model
The posited paths of heat transfer in the cross-flow tube are illustrated in Fig. 2. The code just described was
used to compute the fluid state and velocity, as a function of time, at the axial location corresponding to the cross
flow tube. This data was in turn used to estimate a (time dependent) heat transfer coefficient for the outer wall of
the cross flow tube. The estimate was based on a standard correlation, and may be written as12
8.0g
6.0g_dg_d PrRe25.0Nu (2)
Here, the Nusselt number and Reynolds number are defined
respectively as g
wg
dk
dhNu
, and
g
gg
d
duRe
, where hg-w is the
gas-to wall heat transfer coefficient, kg is the gas thermal conductivity,
d is the diameter of the cross flow tube and ρg, ug, and g are the gas
density, velocity, and viscosity. Values for kg and g were curve fit as
functions of Tg using available gas property tables13
. The term Prg in
Eq. 1 refers to the gas Prandtl number, and was fixed at a value of 0.7.
The cycle-averaged heat transfer rate from the gas to the wall of the
cross flow tube is then written as
Table 1 Simulation Parameters
Rg, ft-lbf/lbm·R 53.6
1.31
Hf, BTU/lbm 20,250
a/f)stoichiometric 14.8
p*, psia 14.7
T*, R 520
g , lbm / ft ·s 2.5E-5
gk , ft-lbf/ft·s·R 0.008
Prg 0.70
American Institute of Aeronautics and Astronautics
5
wgg_dggg_dcwg TkNuTkNuLQ (3)
In this equation Lc is the cross flow tube length and Tg and Tw are the gas and wall temperatures.
A steady heat transfer coefficient for the inner cross flow tube wall surface may also be found in Ref. 12 as
4.0wa
8.0wa_dwa_d PrRe023.0Nu (4)
The subscript wa in this equation refers to the properties of the water. Values of kwa and wa (as well as Cwa in Eq. 1)
are assumed constant. This correlation can be used to find the average heat transfer rate from the cross flow tube
wall to the water.
)TT(LkNuQ wawcwawa_dwaw (5)
Referring to Fig. 2, the average water temperature is
2
TTT inout
wa
.
Given a known cooling water entry temperature of Tin=520 R.,
and noting that Q = wawQ = wgQ
, Eqns. 1, 3, and 5 provide three
equations which can be solved simultaneously for the three
unknowns, Tw, Q , and Tout.
IV. Initial Results
Two test points were compared. Both had the following run
parameters in common: fill fraction=0.78; purge fraction=0.24. In
one case the operational frequency was 10 Hz. In the other, it was 8
Hz. The fill fraction was chosen such that, at ambient conditions, the
leading edge of the detonable slug would just reach the cross-flow
tube when the fill process ended. The computed limit-cycle for the
10 Hz. case is shown in Fig. 3. The plot shows color contours of
normalized pressure, temperature, Mach number and reactant
fraction (mass fraction of detonable mixture) inside the main tube
over the course of one cycle. The reference conditions used for
normalization are listed in Table 1. Next to each contoured variable
the highest and lowest value within the x-t space are listed. The
location of the cross-flow tube is shown as a white vertical line in the temperature and reactant fraction contours.
Figure 3 illustrates several features relevant to the discussion to follow. It can be seen in the reactant fraction
contour that the tube is substantially overfilling. This is caused by preheating from the hot tube walls, which can be
observed in the temperature contours (note the axial gradient) during the filling stage of the cycle. It is noted, but
not shown that when the computation is run adiabatically, the tube fills as prescribed. The result of this overfilling
is that the cross-flow tube never encounters a significant fraction of the chemical energy entering the tube.
A final relevant feature of the flowfield shown in Fig. 3 can be seen in the temperature and Mach number
contours. Here it is seen that there is a significant inflow period at the exhaust end of the PDE tube after the
detonation occurs. During this period, cooler air is drawn past the cross-flow tube and may reduce the total heat
transferred to the tube during the course of a cycle. Such flow reversals actually occur in many laboratory PDE‟s
and have been measured14
. They are not desirable, as they result from operating a device at low frequencies
compared to the theoretical optimum. As such, they are not expected in practical PDE‟s.
pg
Tg
ug
gas
Tw
Tin
Tout
d=0.25 in.
main tube
hw-wa
hg-w
Figure 2. Heat flow paths for cross flow
tube.
American Institute of Aeronautics and Astronautics
6
The instantaneous heat transfer rate to the cross-flow tube, computed from the simulated data and Eq. 3, is
shown in Fig. 4 over the course of one cycle. The vertical scale has been expanded such that the heat transfer rate
during fill and purge portion of the cycle can be seen; however, doing so cuts off visibility of the peak rates
occurring during detonation. As such, the figure contains an insert showing the heat transfer rate during this period.
Also shown in Fig. 4 are the computed and
measured time-average heat transfer rates.
It is worth noting that the peak heat transfer
rates are more than two orders of magnitude
above the average rate. The agreement
between measured and computed averages is
quite good. This is remarkable considering
the simplicity of the model.
Results from the 8 and 10 Hz. cases
examined are summarized in Table 2. It is
seen that for both cases, the simulated and
measured heat transfer rates agree to within
6%. Also shown in the table are estimated
heat transfer rates for steady deflagrative
combustion at the same overall equivalence
ratio and flow rates (and in the same
geometry) as the PDE cases. These
estimates were made using the same Eqns.
1, 3, and 5 but with gas properties
corresponding to steady, post-deflagrative
x/L x/L x/L x/L
Log(p/p*) Log(T/T*) Mach #ReactantFraction
time
High
Low
1.19
-0.50
1.16
-0.02
1.34
-0.68
1.00
0.00Fill
Fire
Purge
detonation
Spill
Figure 3. Computed limit cycle contours of normalized pressure, temperature, Mach number, and reactant
fraction in the tube, over one period of the experimental rig operating at 10 Hz. The white vertical line in the
temperature and reactant fraction contour shows the location of the cross flow tube.
-200
-100
0
100
200
300
400
500
600
700
800
0 20 40 60 80 100
Hea
t T
ran
sfer
Rat
e, W
atts
Time, msec.
computed
computed-avg.
measured-avg.
0
50
100
150
200
250
36 37 38 39
Q, k
Watt
s
Time, msec.
.
Figure 4. Computed heat transfer rate to the cross-flow tube as a
function of time over the course of one 10 Hz. cycle.
American Institute of Aeronautics and Astronautics
7
combustion products. It is not
meaningful to list the measured steady
deflagrative heat transfer rates of the Ref.
9 experiment since the experimental rig
exceeded acceptable metal temperature
limits before thermal equilibrium was
achieved. The estimates appear in Table
2 to emphasize the point that simulation
of the experiment leads to the same result
as the experiment itself, namely,
detonative heat loads at this axial location
are less than those during deflagration. However, the simulation indicates that the effect is due largely to spillage,
and not to the short duration of detonation event. In fact, the simulated results of the 10Hz. case indicate that
approximately 37% of the flow passing the cross-flow tube is fueled. In terms of fuel utilized, this is roughly the
equivalent of running with an overall equivalence ratio of 0.4 (the actual value is 0.76). If a steady, deflagrative
equivalent to this run condition is calculated, the estimated heat transfer rate drops from 991 Watts to 376 Watts
which is below the detonative heat load. Alternatively, though less realistically, if the detonative simulation is run
with adiabatic PDE tube walls for the 10 Hz. case, the average heat transfer rate to the cross-flow tube rises to 804
Watts. This is only 19% below the estimated load from deflagration. If 40 Hz., adiabatic operation is simulated,
along with more performance optimized valve timing, the disparity drops to only 9%. If other, more practical cycle
modifications were examined, it is quite possible that the disparity would vanish altogether. Considerably more
investigation is required however before any conclusions can be drawn.
V. Additional Testing and Simulation
Although the cross-flow tube provided a convenient means of assessing heat loads, it was not clear that a
cylinder in a cross-flow was representative of the
true area of interest, the PDE tube wall. Moreover,
since the simulated spillage and pre-heating
described earlier were caused by heat transfer at
the walls, it was important to assess the validity of
the heat transfer correlations used. As such, a new
test piece was constructed which operated on the
same principle as the cross-flow tube, but had a
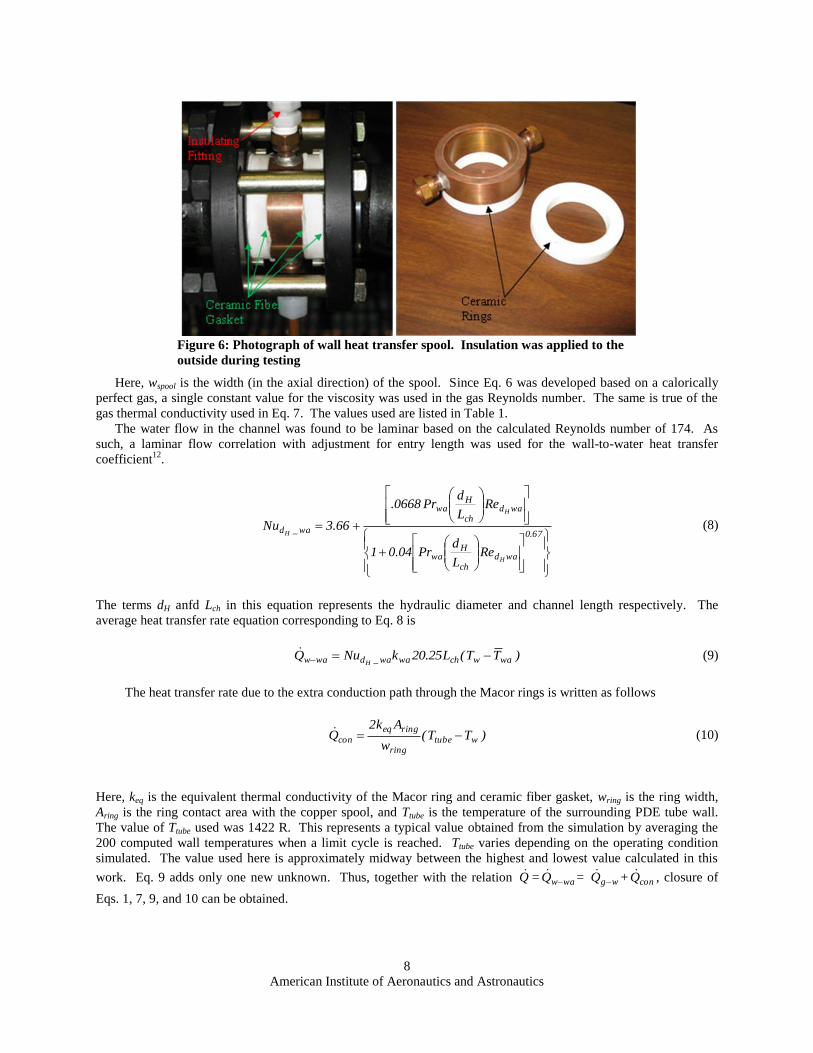
decidedly different geometry. The piece is shown
schematically in Fig. 5. A photograph of the piece
is shown in Fig. 6. Referring to Fig. 5, it is seen
that the analysis of this piece, heretofore called the
spool, is similar to the cross-flow tube. However,
different dimensions and correlations must be used,
and a new heat transfer path has been added via
conduction through the Macor rings.
A. Spool Modeling
For the gas-to-wall heat transfer path, the
correlation developed for the simulation was used8.
33.0g
80.0g_D
352.0
g_D PrReL
D121.0Nu
(6)
The equation for the average heat transfer rate thus becomes
wgg_Dggg_Dspoolwg TkNuTkNuwQ (7)
pg
Tg
ug
gas
Tw
Tin
Tout
hw-wahg-w
Tin
Toutcopper Macor
gasket
conQ Ttube
D=2.0
0.1
1.0
0.8
Figure 5. Schematic and heat flow path of the wall heat
transfer spool. Dimensions are inches.
Table 2 Measured and simulated heat transfer rates.
Frequency
Hz.
Tw
R
measuredQ
Watts
simulatedQ
Watts
Difference
%
ondeflagratiQ
(estimated)
Watts
8 798 490 461 -5.9 887
10 858 585† 562 -3.9 991
†This test was only run for 2 minutes (not 7.5 minutes). The value listed in the
table is extrapolated based on temporal trends of the longer 8 Hz. run which
show an approximately 30% increase in heat transfer rate from 2 to 7.5 minutes.
American Institute of Aeronautics and Astronautics
8
Here, wspool is the width (in the axial direction) of the spool. Since Eq. 6 was developed based on a calorically
perfect gas, a single constant value for the viscosity was used in the gas Reynolds number. The same is true of the
gas thermal conductivity used in Eq. 7. The values used are listed in Table 1.
The water flow in the channel was found to be laminar based on the calculated Reynolds number of 174. As
such, a laminar flow correlation with adjustment for entry length was used for the wall-to-water heat transfer
coefficient12
.
67.0
wadch
Hwa
wadch
Hwa
wa_d
H
H
H
ReL
dPr04.01
ReL
dPr0668.
66.3Nu (8)
The terms dH anfd Lch in this equation represents the hydraulic diameter and channel length respectively. The
average heat transfer rate equation corresponding to Eq. 8 is
)TT(L25.20kNuQ wawchwawa_dwaw H
(9)
The heat transfer rate due to the extra conduction path through the Macor rings is written as follows
)TT(w
Ak2Q wtube
ring
ringeq
con (10)
Here, keq is the equivalent thermal conductivity of the Macor ring and ceramic fiber gasket, wring is the ring width,
Aring is the ring contact area with the copper spool, and Ttube is the temperature of the surrounding PDE tube wall.
The value of Ttube used was 1422 R. This represents a typical value obtained from the simulation by averaging the
200 computed wall temperatures when a limit cycle is reached. Ttube varies depending on the operating condition
simulated. The value used here is approximately midway between the highest and lowest value calculated in this
work. Eq. 9 adds only one new unknown. Thus, together with the relation Q = wawQ = wgQ
+ conQ , closure of
Eqs. 1, 7, 9, and 10 can be obtained.
Figure 6: Photograph of wall heat transfer spool. Insulation was applied to the
outside during testing
American Institute of Aeronautics and Astronautics
9
VI. Additional Results
The spool was installed on the PDE at approximately the same location as the original cross-flow tube. The
layout is shown schematically in Fig. 7. Also shown in this schematic are the locations of several ion gages which
can be used to detect detonation. This will become relevant in the discussion to follow. The PDE was operated at 8
Hz., with a purge fraction of 0.23. The fuel was again ethylene, and the equivalence ratio was again set to 1.0. Four
6.0 minute runs were made which maintained fill fractions of 0.75, 0.60, 0.45, and 0.34. The simulation was run to
limit cycle operation for these same four test conditions.
The measured and computed average total heat transfer rates are shown in Fig. 8 as functions of the fill fraction.
The computed results also show contributions to the total heat transfer rate from conduction and convection. From a
fill fraction of 0.45 to 0.75, the agreement between computed and measured heat transfer is quite good. Below the
0.45 fill fraction, the computation appears to over-predict. It should be born in mind however, that the disparity at
this point is 31%, which is within the stated accuracy band of many heat transfer correlations12
. Taken as a whole,
these results seem to validate the heat transfer coefficient used in the simulation.
It is interesting to note that the computed convection heat transfer rate at a fill fraction of 0.75 is less than the
461 W. value calculated for the cross-flow tube under the same PDE conditions. Given the relative surface areas of
the two measuring systems, this result may seem at first surprising. However, cylinders in cross flow, with
associated stagnation points, and regions of
massive separation, generally have
significantly higher heat transfer coefficients
than surfaces aligned with the flow such as
the spool.
The fact that the average heat transfer
rate is non-linear with fill fraction suggests
that pre-heating and overfilling is occurring.
The simulation results indicate that even at
the lowest fill fraction of 0.34, the tube is
actually volumetrically fully filled.
Experimentally, the ion gages were
monitored (though not recorded) during the
entire run at this fill fraction. Initially, with
cold tube walls, none of them registered a
detonation. This would be expected since
no preheating could occur and since the fill
fraction was such that a detonation never
passed an ion gage. As time progressed
however, ion gages registered regular
Figure 7 Schematic of the experimental setup for wall heat transfer testing. Dimensions are inches.
0
100
200
300
400
500
600
700
0.3 0.4 0.5 0.6 0.7 0.8
Av
g.
Hea
t T
ran
sfer
Rat
e, W
atts
Fill Fraction
measured computed
computed-conduction computed-convection
Figure 8. Measured and computed average wall heat transfer
rates at x/L = 0.75 as functions of fill fraction for 8 Hz. operation.
American Institute of Aeronautics and Astronautics
10
detonations further and further down the tube. At the conclusion of the test, the ion gage located 70% of the way
down the tube was registering detonations. Even the gage at the 80% mark was registering a combustion event.
This observation seems to validate the
behavior predicted by the simulation
(overfilling due to preheating), although
clearly not to the same level.
Computed heat flux to the wall during
the detonation phase of the fill
fraction=0.75, 8 Hz. limit cycle is plotted in
Fig. 9. The peak value of 16 MW/m2 is of
the same order as the 32 MW/m2 peak value
reported from a high frequency response
heat flux gage located near the exit of a
single shot hydrogen/air PDE experiment7.
Given the differences in the two
experiments, the simplicity of the model,
and the difficulty in obtaining such high and
short-lived heat flux levels, this is
considered acceptable agreement.
A. Alternate Location
As a final comparison test between
simulation and experiment, the spool was moved to a location further upstream in the PDE. The setup is shown in
Fig. 10. This measurement location is somewhat problematic from a simulation standpoint because a different wall
heat transfer coefficient correlation from Eq. 6 is employed for regions where DDT obstacles exist. The formula is
as follows8.
33.0gg_D
obst
obstg_D PrRe
y121.0Nu
(11)
Here, yobst and obst are the obstacle height (or spiral diameter) and pitch respectively. This formula generally
produces much higher heat transfer coefficients than Eq. 6, which is appropriate given the elevated turbulence levels
and coherent flow structures produced by DDT obstacles. The problem with the location shown is that it is just 1.5
tube diameters downstream from end of the DDT obstacles. It would be expected therefore that the heat transfer
rate would fall somewhere between the extremes predicted by Eqs. 6 and 11.
Beyond this ambiguity issue, there is also the observation that in this region of the tube the detonation may still
Figure 10 Schematic of the experimental setup for the upstream spool location. Dimensions are inches.
0
2
4
6
8
10
12
14
16
18
46 48 50 52 54H
eat
Flu
x, M
Wat
ts/m
2
Time, msec. Figure 9. Computed wall heat flux at x/L = 0.75 during the
detonation period of an 8 Hz., fill fraction=0.75 cycle.
American Institute of Aeronautics and Astronautics
11
be in the over-driven phase of development which would result in higher heat transfer rates. Such a phase is not
modeled in the simulation.
Two runs were made in the Fig. 10 configuration. Both were made at 8 Hz. operation. One utilized a fill
fraction of 0.79, the other utilized 0.4. The
measured and computed average heat
transfer rates are shown in Fig. 11. For the
computed rates, the results from using both
Eq. 6 and Eq. 10 are shown. As expected,
the measured results fall between the
computed extremes. It is re-emphasized
however, that the elevation of the measured
results over the computed results using Eq.
6 may also be partially explained by the
presence of an over-driven detonation
(although the same axial location for the
over-driven phase at two vastly different fill
fractions is somewhat surprising).
Ultimately resolving the cause will require,
at the very least, heat transfer rate
measurements at different locations and in
different configurations. Nevertheless, it is
encouraging that the simulation at least
bounded the results.
VII. Concluding Remarks
A comparison between experimentally measured and numerically simulated (computed), time-averaged, point
heat transfer rates in a pulse detonation (PDE) engine was presented. The comparison included measurements and
calculations for heat transfer to a cylinder in cross-flow and to the tube wall itself, using a novel spool design.
Measurements were obtained at several locations and under several operating conditions. The measured and
computed results were found to be in substantial agreement. The agreement served to validated the computational
modeling approach. This suggests that such an approach can be used for the critical task of assessing the heat loads
and thermal management requirements of for practical PDE applications. Validation of the computational modeling
also provided a measure of confidence in the use of computational fluid dynamics (CFD) codes for interrogating
experimental results to provide insight where instrumentation cannot. To this end, it was shown that, for the
particular rig simulated, the operational impact of heat transfer is substantial. It was predicted, and later verified that
the walls of the PDE tube, which are heated substantially during operation, in turn pre-heat the incoming detonable
mixture. This results in increased volumetric flow rates during tube filling, which leads in turn to overfilling and
fuel spillage. Knowledge of the degree to which this is occurring is invaluable in interpreting performance results
(e.g. specific impulse) obtained during long duration operation.
References 1Hoke, J., R. Bradley, and F. Schauer. Heat Transfer and Thermal Management in a Pulsed Detonation Engine. in 41st AIAA
Aerospace Sciences Meeting and Exhibit. AIAA 2003-852. Reno, NV.
2Eidelman, S., D. Sharov, and D. Book. Aerothermodynamics of Pulsed Detonation Engines. in 36th JANNAF Meeting.
Cocoa Beach, FL. 3Ajmani, K. and K.J. Breisacher. Qualitative Study of Cooling Methods for a Pulsed-Detonation Engine. in 51st JANNAF
Propulsion Meeting. Lake Buena Vista, Florida. 4Kasahara, J., K. Takazawa, and T. Arai. Experimental Study of Impulse and Heat Transfer on Pulse Detonation Engines. in
38th AIAA/ASME/SAE/ASEE Joint Propulsion Conference and Exhibit. AIAA 2002-4071. Indianapolis, IN. 5Bykovskii, F.A., Thermal Fluxes in Combustion Chamber Walls in the Detonation and Turbulent Combustion Modes. Fizika
Goreniya i Vzryva, 1991. 27(1): p. 70-75. 6Ajmani, K., et al. Numerical and Experimental Studies of a Film Cooled Pulsed Detonation Tube. in 41st
AIAA/ASME/SAE/ASEE Joint Propulsion Conference & Exhibit. AIAA 2005-3509. Tucson, AZ. 7Paxson, D.E., Perkins, H. D., “Thermal Load Considerations for Detonative Combustion-Based Gas Turbine Engines,”
AIAA-2004-3396, July, 2004.
0
200
400
600
800
1000
1200
1400
1600
1800
0.3 0.4 0.5 0.6 0.7 0.8
Av
g.
Hea
t T
ran
sfer
Rat
e, W
atts
Fill Fraction
measured
computed-Eq. 6
computed-Eq. 10
Figure 11. Measured and computed average wall heat transfer
rates at x/L = 0.53 as functions of fill fraction for 8 Hz. operation.
American Institute of Aeronautics and Astronautics
12
8Paxson, D. E., Schauer, F. R., and Hopper, D. R., “Performance Impact of Deflagration to Detonation Transition Enhancing
Obstacles,” AIAA paper 2009-502, January, 2009. 9Naples, A. G., Hoke, J. L., Schauer, F. R., “Study of Heat Loads from Steady Deflagration and Pulsed Detonation
Combustion,” AIAA paper 2010-956, January, 2010. 10Schauer, F., J. Stutrud, and R. Bradley. “Detonation Initiation Studies and Performance Results for Pulsed Detonation
Engine Applications,” AIAA Paper 2001-1129, Jan., 2001 11Schauer, F.R., Bradley, R. P. and Hoke, J. L., “Detonation Initiation of Hydrocarbon-Air in a Pulsed Detonation Engine,”
AIAA-2005-1343, Jan., 2005. 12Holman, J. P., Heat Transfer, 5th edition, McGraw-Hill, 1981, pp. 226-244. 13Gordon, S. and McBride, B., “Computer Program for Calculation of Complex Chemical Equilibrium Compositions and
Applications,” NASA RP-1311, Oct, 1994. 14Opalski, A. B., Paxson, D.E., Wernet, M. P., “Detonation Driven Ejector Exhaust Flow Characterization Using Planar