COMPDYN 2017 6 th ECCOMAS Thematic Conference on Computational Methods in Structural Dynamics and Earthquake Engineering M. Papadrakakis, M. Fragiadakis (eds.) Rhodes Island, Greece, 15–17 June, 2017 NUMERICAL ANALYSIS OF SOIL LIQUEFACTION INDUCED FAILURE OF EMBANKMENTS Stefania Gobbi 1 , Fernando Lopez-Caballero 2 , Davide Forcellini 1 1 Universit di San Marino Via Salita alla rocca 44 stefania.gobbi,[email protected]2 Laboratoire MSS-Mat CNRS UMR 8579, Centrale Supelec Grande Voie desVignes 92295, Chatenay-Malabry, France [email protected]Keywords: Earthquake engineering, Liquefaction, Numerical modelling, Embankment. Abstract. Soil structures such as river dikes, highway embankments, and earth dams have been frequently damaged during past major earthquakes. In most cases, large deformations occurred due to liquefaction of the supporting loose cohesionless foundation soil, resulting in cracks, set- tlement, lateral spreading, and slumping. Some researchers showed that river levees resting on non-liquefiable foundation soil have been damaged. In this regard, the base of such levees sub- sided in a bowl shape due to foundation consolidation that was shown to have the principal contribution to liquefaction as an underlying mechanism. This paper aims at describing the global dynamic response of a thin Loose Sand layer located buried in deep (10m) stratum of Clay (less permeable), situated at the foundation of a levee, due to liquefaction phenomenon. This study purpose is to reproduce such behavior by applying numerical simulations, adopting the open-source computational platform OpenSees. In particular, this study considers a 2D soil model of a levee subjected to earthquakes in order to investigate the failure of embankments induced by non-liquefiable soil foundation with a thin sand layer with partially drained condi- tion. A parametric analysis using ground motions at multiple levels of intensity was performed to highlight the influence of parameters such as, the thickness of saturated zone, the permeabil- ity ratio between saturated zone and non-liquefiable soil (i.e. drain condition) on the obtained crest settlement and on the induced damage level of the embankment. 1
Transcript
COMPDYN 20176th ECCOMAS Thematic Conference on
Computational Methods in Structural Dynamics and Earthquake EngineeringM. Papadrakakis, M. Fragiadakis (eds.)
Rhodes Island, Greece, 15–17 June, 2017
NUMERICAL ANALYSIS OF SOIL LIQUEFACTION INDUCEDFAILURE OF EMBANKMENTS
Stefania Gobbi1, Fernando Lopez-Caballero2, Davide Forcellini1
Abstract. Soil structures such as river dikes, highway embankments, and earth dams have beenfrequently damaged during past major earthquakes. In most cases, large deformations occurreddue to liquefaction of the supporting loose cohesionless foundation soil, resulting in cracks, set-tlement, lateral spreading, and slumping. Some researchers showed that river levees resting onnon-liquefiable foundation soil have been damaged. In this regard, the base of such levees sub-sided in a bowl shape due to foundation consolidation that was shown to have the principalcontribution to liquefaction as an underlying mechanism. This paper aims at describing theglobal dynamic response of a thin Loose Sand layer located buried in deep (10m) stratum ofClay (less permeable), situated at the foundation of a levee, due to liquefaction phenomenon.This study purpose is to reproduce such behavior by applying numerical simulations, adoptingthe open-source computational platform OpenSees. In particular, this study considers a 2D soilmodel of a levee subjected to earthquakes in order to investigate the failure of embankmentsinduced by non-liquefiable soil foundation with a thin sand layer with partially drained condi-tion. A parametric analysis using ground motions at multiple levels of intensity was performedto highlight the influence of parameters such as, the thickness of saturated zone, the permeabil-ity ratio between saturated zone and non-liquefiable soil (i.e. drain condition) on the obtainedcrest settlement and on the induced damage level of the embankment.
1
Stefania Gobbi, Fernando Lopez-Caballero, Davide Forcellini
1 Introduction
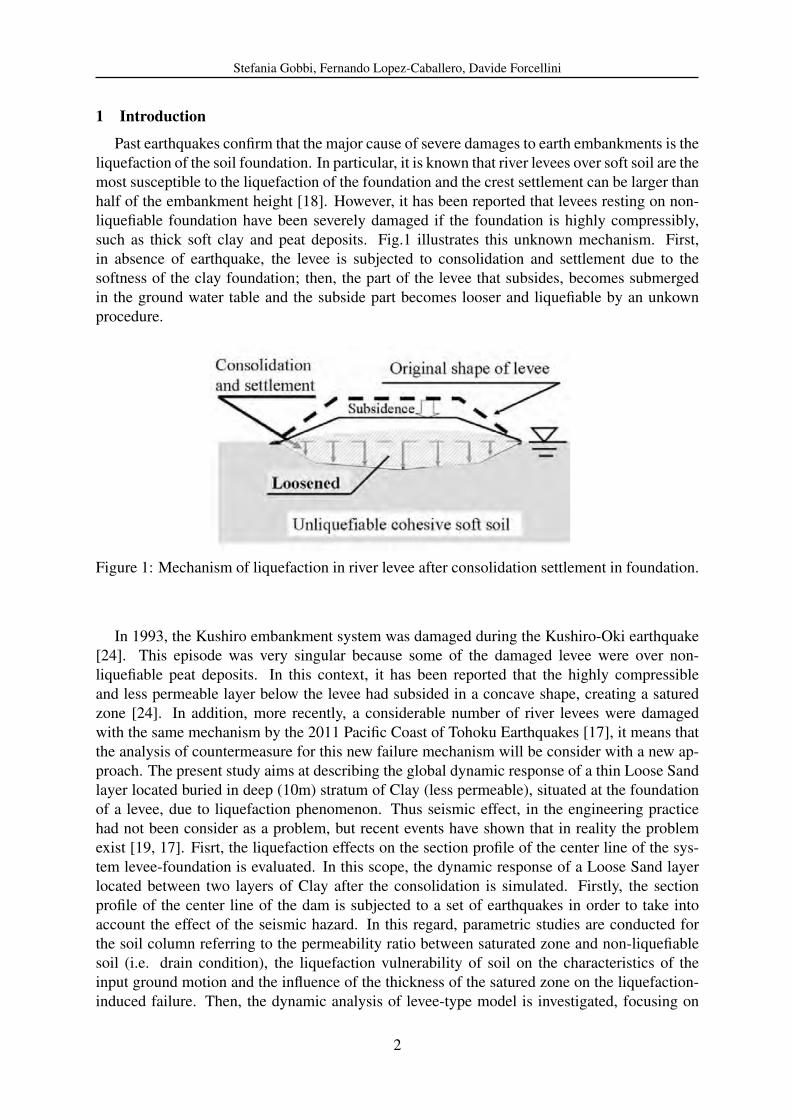
Past earthquakes confirm that the major cause of severe damages to earth embankments is theliquefaction of the soil foundation. In particular, it is known that river levees over soft soil are themost susceptible to the liquefaction of the foundation and the crest settlement can be larger thanhalf of the embankment height [18]. However, it has been reported that levees resting on non-liquefiable foundation have been severely damaged if the foundation is highly compressibly,such as thick soft clay and peat deposits. Fig.1 illustrates this unknown mechanism. First,in absence of earthquake, the levee is subjected to consolidation and settlement due to thesoftness of the clay foundation; then, the part of the levee that subsides, becomes submergedin the ground water table and the subside part becomes looser and liquefiable by an unkownprocedure.
Figure 1: Mechanism of liquefaction in river levee after consolidation settlement in foundation.
In 1993, the Kushiro embankment system was damaged during the Kushiro-Oki earthquake[24]. This episode was very singular because some of the damaged levee were over non-liquefiable peat deposits. In this context, it has been reported that the highly compressibleand less permeable layer below the levee had subsided in a concave shape, creating a saturedzone [24]. In addition, more recently, a considerable number of river levees were damagedwith the same mechanism by the 2011 Pacific Coast of Tohoku Earthquakes [17], it means thatthe analysis of countermeasure for this new failure mechanism will be consider with a new ap-proach. The present study aims at describing the global dynamic response of a thin Loose Sandlayer located buried in deep (10m) stratum of Clay (less permeable), situated at the foundationof a levee, due to liquefaction phenomenon. Thus seismic effect, in the engineering practicehad not been consider as a problem, but recent events have shown that in reality the problemexist [19, 17]. Fisrt, the liquefaction effects on the section profile of the center line of the sys-tem levee-foundation is evaluated. In this scope, the dynamic response of a Loose Sand layerlocated between two layers of Clay after the consolidation is simulated. Firstly, the sectionprofile of the center line of the dam is subjected to a set of earthquakes in order to take intoaccount the effect of the seismic hazard. In this regard, parametric studies are conducted forthe soil column referring to the permeability ratio between saturated zone and non-liquefiablesoil (i.e. drain condition), the liquefaction vulnerability of soil on the characteristics of theinput ground motion and the influence of the thickness of the satured zone on the liquefaction-induced failure. Then, the dynamic analysis of levee-type model is investigated, focusing on
2
Stefania Gobbi, Fernando Lopez-Caballero, Davide Forcellini
the earthquake induced failure response and the influence of drainage conditions and the lique-fiable layer thickness on the collapse path is examined. The levee has been modeled with 9-4node plane-strain finite elements (FE) with the OpenSees (Open System for Earthquake Engi-neering Simulation, Mazzoni et al. [16]) framework, GiD (version 13.0, [23]) has been usedfor pre and post processing. Numerical analyses have been performed with non-linear materialmodels, in particular, PressureDependMultiYield02 and PressureIndependMultiYield materials[22, 21, 28] were implemented in order to simulate the soil behavior. In the first section, thenumerical model is presented. Thereafter, the dynamic analysis and the effect of liquefactionis presented for the section profile of the center of the dam and then of the entire system of theembankment.
2 Numerical Model
2.1 Geometry
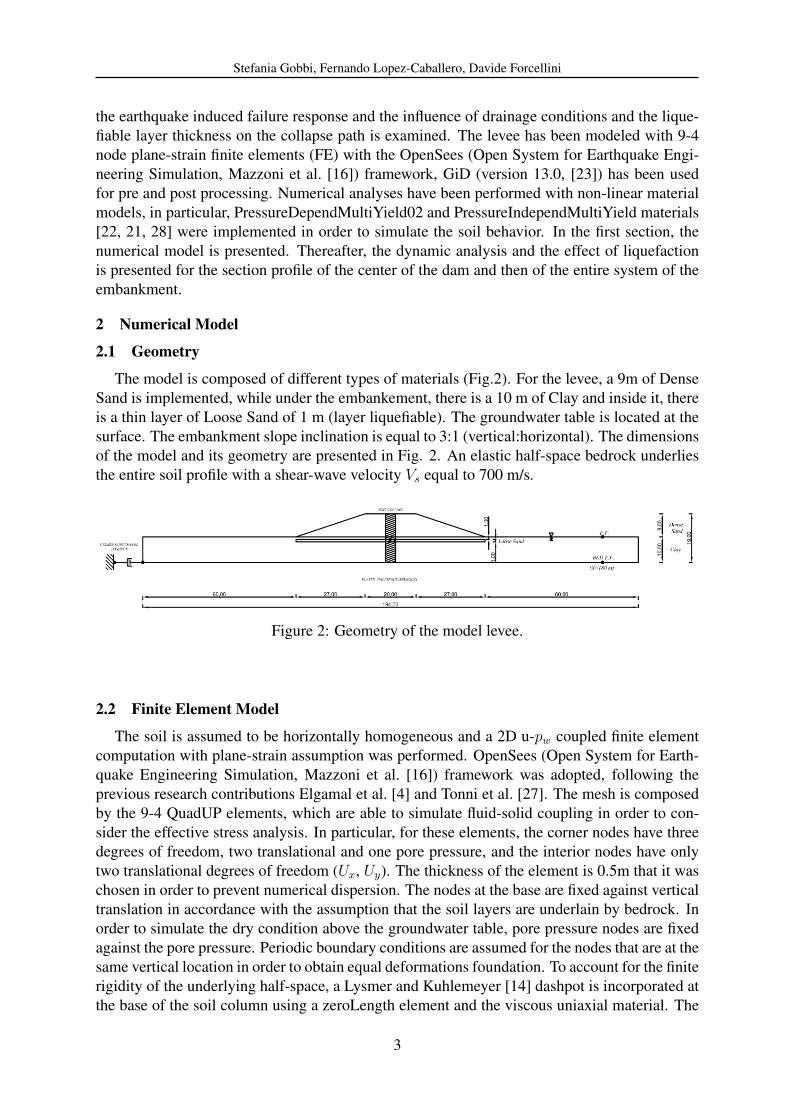
The model is composed of different types of materials (Fig.2). For the levee, a 9m of DenseSand is implemented, while under the embankement, there is a 10 m of Clay and inside it, thereis a thin layer of Loose Sand of 1 m (layer liquefiable). The groundwater table is located at thesurface. The embankment slope inclination is equal to 3:1 (vertical:horizontal). The dimensionsof the model and its geometry are presented in Fig. 2. An elastic half-space bedrock underliesthe entire soil profile with a shear-wave velocity Vs equal to 700 m/s.
Figure 2: Geometry of the model levee.
2.2 Finite Element Model
The soil is assumed to be horizontally homogeneous and a 2D u-pw coupled finite elementcomputation with plane-strain assumption was performed. OpenSees (Open System for Earth-quake Engineering Simulation, Mazzoni et al. [16]) framework was adopted, following theprevious research contributions Elgamal et al. [4] and Tonni et al. [27]. The mesh is composedby the 9-4 QuadUP elements, which are able to simulate fluid-solid coupling in order to con-sider the effective stress analysis. In particular, for these elements, the corner nodes have threedegrees of freedom, two translational and one pore pressure, and the interior nodes have onlytwo translational degrees of freedom (Ux, Uy). The thickness of the element is 0.5m that it waschosen in order to prevent numerical dispersion. The nodes at the base are fixed against verticaltranslation in accordance with the assumption that the soil layers are underlain by bedrock. Inorder to simulate the dry condition above the groundwater table, pore pressure nodes are fixedagainst the pore pressure. Periodic boundary conditions are assumed for the nodes that are at thesame vertical location in order to obtain equal deformations foundation. To account for the finiterigidity of the underlying half-space, a Lysmer and Kuhlemeyer [14] dashpot is incorporated atthe base of the soil column using a zeroLength element and the viscous uniaxial material. The
3
Stefania Gobbi, Fernando Lopez-Caballero, Davide Forcellini
system is excited at the base by a horizontal force time history which is proportional to theknown velocity time history of the ground motion. The saturated soil system is based upon theBiot theory for porous media. A simplified numerical formulation of this theory, known as u-pwformulation (Zienkiewicz and Shiomi [29]), was implemented numerically [22, 21, 28]. Theso-called u-pw formulation, consists of neglecting fluid acceleration terms and its convectiveterms of this acceleration so that the unknown variables remain the displacement of the solid uand the pressure of the water pw.An implicit Newmark numerical integration scheme is used in the dynamic analysis for thediscretization in time with a time step equal to ∆t = 10-3 s with a numerical damping equalto ξ = 0.2%. In fact, since the model consider elastoplastic soil behavior, there is inherenthysteretic damping which occurs, however, a small amount of Rayleigh damping is used sothere is still some damping at low strain values. In addition, a non-dissipative set of Newmarkparameters is also used, with γ = 0.5 and β = 0.25.
2.3 Soil Constituve Model
The soil constitutive model (Figure3) implemented in OpenSees ([21], [5]) is based on themultisurface-plasticity theory for cyclic hysteretic response proposed by Prevost [22]. In thiscontext, the phenomenological interaction between shear and volumetric response (contrac-tion or dilation) is typically handled by specifying an appropriate non-associative flow rule(e.g.Prevost [22], Dafalias [3]).Figure 3 shows the response behaviour of a saturated undrained cohesionless soil. Dependingon the relative location of the stress state with respect to the phase transformation (PT) surface[10, 12], different expressions for the volumetric component P” were specified [21]. The mainmodelling parameters include typical dynamic soil properties such as low-strain shear modulusand friction angle, as well as calibration constants to control pore-pressure buildup rate, dilationtendency, and the level of liquefaction-induced cyclic shear strain.
(a) (b)
Figure 3: a)Schematic of constitutive model response showing shear stress, effective confine-ment, and shear strain relationship, b)Conical yield surface in principal stress space and devia-toric plane (after Prevost [22], Parra [21], Yang and Elgamal [28]).
4
Stefania Gobbi, Fernando Lopez-Caballero, Davide Forcellini
2.4 Material Properties
The soil constitutive behavior is modeled using the PressureDependMultiYield02 Materialand the PressureIndependMultiYield Material. The saturated sand layers are based on theNevada sand properties [6]. The main modeling parameters are summarized in Table1.
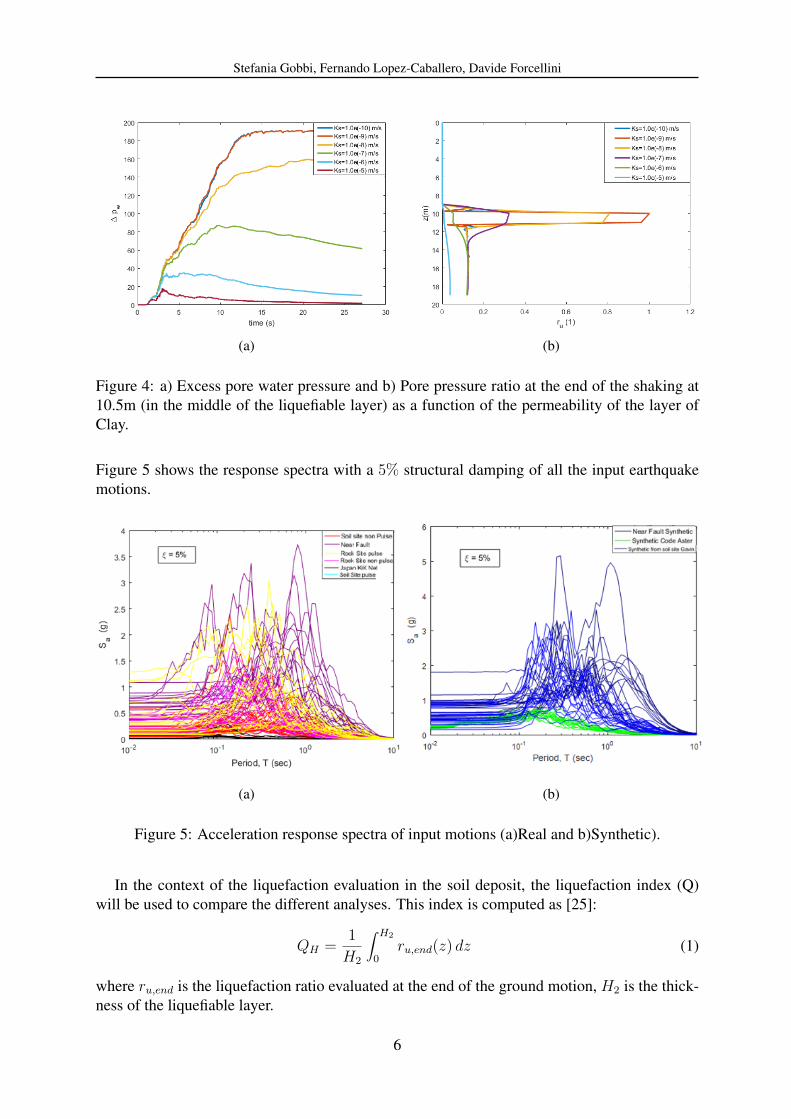
Liquefaction is related to soil permeability as permeable soils can dissipate rapidly the excesspore water and liquefaction phenomenon may be less extended or prevented. In this section,five differents values of permebility of the Clay layer, are used for the parametric analysis.In particular, the value of Ks varies from 1.0·10−10 to 1.0·10−5 m/s. Figure 4 illustrates thetime evolution of pore water pressure for the different values of permeability at 10.5m belowthe surface (in the middle of the Loose Sand layer), it shows that the build up of excess porewater pressure depends of the permeability ratio between saturated zone and non-liquefiablesoil and the dissipation is produced more rapidly when soil permeability is greater. In the Fig.4 is reported the pore pressure ratio ru (i.e. computed as the ratio of excess pore pressure toinitial effective vertical stress) at the end of the shaking in function of the soil permeability. Itis interesting to note that only when the ru reaches a value greater than 0.8, the liquefactionoccurs.
3.2 Influence of the earthquake’s characteristics
The buildup of excess pore pressure depends on many factors concerning the soil as well asthe input motion. Several studies have underlined the importance of the choise of the seismicsignal in case of non linear soil behaviour of soil model. In this study, a wide range of inputmotion (real and synthetic) has been selected to study the liquefaction vulnerability of soilof the input ground motion. The earthquake signals were proposed by Iervolino and Cornell[8], Sorrentino et al. [26]. Thus, 183 unscaled records were chosen from the Pacific EarthquakeEngineering Research Center (PEER) database. Their magnitude range between 4.9 and 7.9 andtheir site-to-source distance from 1 to 200 km. All these earthquake were chosen with a greatvariety in their characteristics in order to analyse their influence on the liquefaction triggering.
5
Stefania Gobbi, Fernando Lopez-Caballero, Davide Forcellini
(a) (b)
Figure 4: a) Excess pore water pressure and b) Pore pressure ratio at the end of the shaking at10.5m (in the middle of the liquefiable layer) as a function of the permeability of the layer ofClay.
Figure 5 shows the response spectra with a 5% structural damping of all the input earthquakemotions.
(a) (b)
Figure 5: Acceleration response spectra of input motions (a)Real and b)Synthetic).
In the context of the liquefaction evaluation in the soil deposit, the liquefaction index (Q)will be used to compare the different analyses. This index is computed as [25]:
QH =1
H2
∫ H2
0ru,end(z) dz (1)
where ru,end is the liquefaction ratio evaluated at the end of the ground motion, H2 is the thick-ness of the liquefiable layer.
6
Stefania Gobbi, Fernando Lopez-Caballero, Davide Forcellini
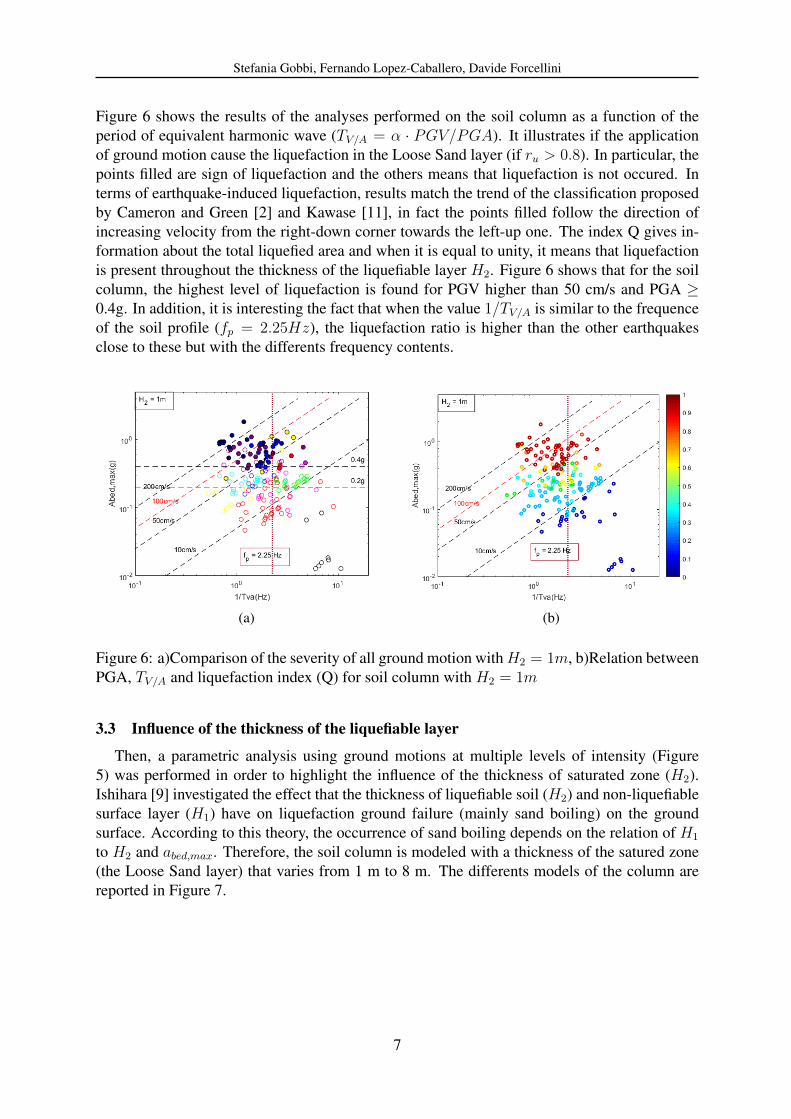
Figure 6 shows the results of the analyses performed on the soil column as a function of theperiod of equivalent harmonic wave (TV/A = α · PGV/PGA). It illustrates if the applicationof ground motion cause the liquefaction in the Loose Sand layer (if ru > 0.8). In particular, thepoints filled are sign of liquefaction and the others means that liquefaction is not occured. Interms of earthquake-induced liquefaction, results match the trend of the classification proposedby Cameron and Green [2] and Kawase [11], in fact the points filled follow the direction ofincreasing velocity from the right-down corner towards the left-up one. The index Q gives in-formation about the total liquefied area and when it is equal to unity, it means that liquefactionis present throughout the thickness of the liquefiable layer H2. Figure 6 shows that for the soilcolumn, the highest level of liquefaction is found for PGV higher than 50 cm/s and PGA ≥0.4g. In addition, it is interesting the fact that when the value 1/TV/A is similar to the frequenceof the soil profile (fp = 2.25Hz), the liquefaction ratio is higher than the other earthquakesclose to these but with the differents frequency contents.
(a) (b)
Figure 6: a)Comparison of the severity of all ground motion withH2 = 1m, b)Relation betweenPGA, TV/A and liquefaction index (Q) for soil column with H2 = 1m
3.3 Influence of the thickness of the liquefiable layer
Then, a parametric analysis using ground motions at multiple levels of intensity (Figure5) was performed in order to highlight the influence of the thickness of saturated zone (H2).Ishihara [9] investigated the effect that the thickness of liquefiable soil (H2) and non-liquefiablesurface layer (H1) have on liquefaction ground failure (mainly sand boiling) on the groundsurface. According to this theory, the occurrence of sand boiling depends on the relation of H1
to H2 and abed,max. Therefore, the soil column is modeled with a thickness of the satured zone(the Loose Sand layer) that varies from 1 m to 8 m. The differents models of the column arereported in Figure 7.
7
Stefania Gobbi, Fernando Lopez-Caballero, Davide Forcellini
Figure 7: Models of the soil column with a thickness of the liquefied layer that varies from 1 mto 8 m.
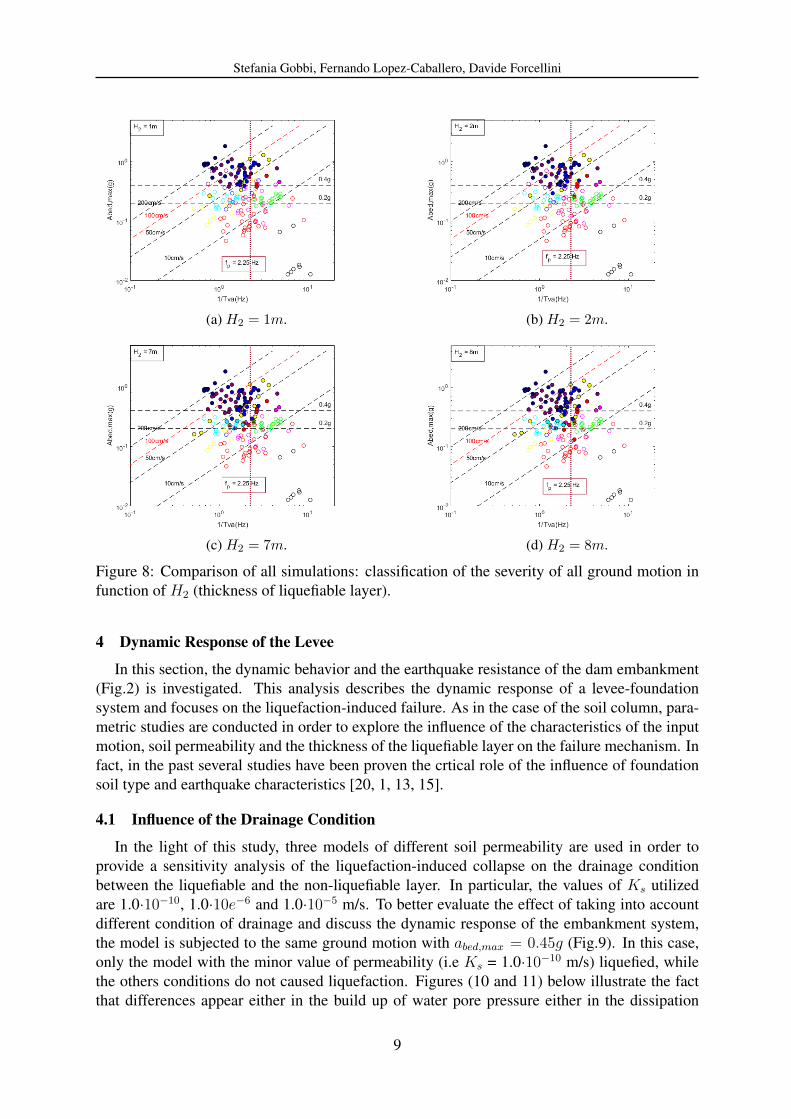
Results reported in Fig. 8 confirm the trend proposed before, according to which the severityof the motions follows the direction of increasing velocity from the right-down corner towardsthe left-up one. Following this, increasing the thickness of the liquefiable soil layer, the numberof motions in the upper left part of the diagram, that are caused of liquefaction-induced grounddamages, increases.In addition, in the Figures 8, horizontal dashed lines indicate a costant acceleration of 0.2g and0.4g in order to compare the results obtained with the guidelines curves of Ishihara [9]. In thisregard, most of the motions with amax < 0.4g do not have ru > 0.8 in the Loose Sand layerand increasing the thickness of this layer, results confirm that the number of the motions, underthese lines, are more dangerous in terms of liquefaction-induced ground failure. In additionresults show that earthquakes with an equivalent period TV/A similar to the fundamental periodof the soil column, are more dangerous in terms of liquefaction-induced ground damages thanothers. In fact increasing the thickness H2, Figure 8 shows that the number of earthquakes thatcaused liquefaction in this zone is greater.
8
Stefania Gobbi, Fernando Lopez-Caballero, Davide Forcellini
(a) H2 = 1m. (b) H2 = 2m.
(c) H2 = 7m. (d) H2 = 8m.
Figure 8: Comparison of all simulations: classification of the severity of all ground motion infunction of H2 (thickness of liquefiable layer).
4 Dynamic Response of the Levee
In this section, the dynamic behavior and the earthquake resistance of the dam embankment(Fig.2) is investigated. This analysis describes the dynamic response of a levee-foundationsystem and focuses on the liquefaction-induced failure. As in the case of the soil column, para-metric studies are conducted in order to explore the influence of the characteristics of the inputmotion, soil permeability and the thickness of the liquefiable layer on the failure mechanism. Infact, in the past several studies have been proven the crtical role of the influence of foundationsoil type and earthquake characteristics [20, 1, 13, 15].
4.1 Influence of the Drainage Condition
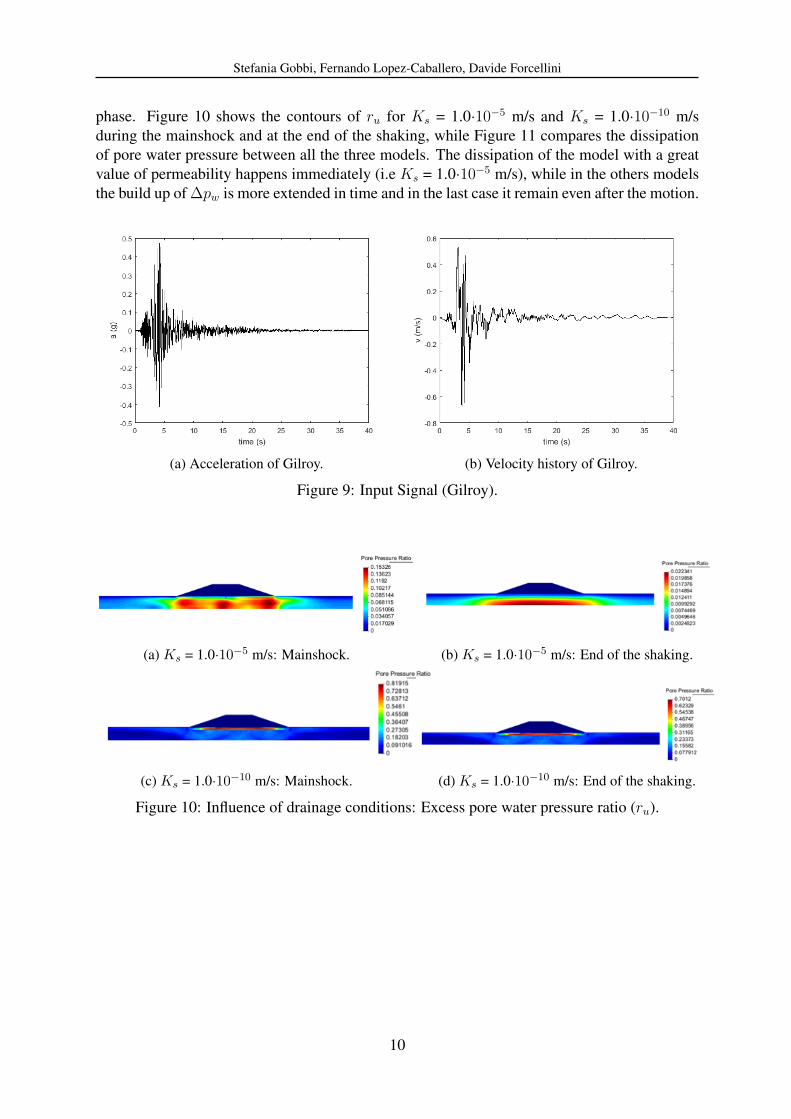
In the light of this study, three models of different soil permeability are used in order toprovide a sensitivity analysis of the liquefaction-induced collapse on the drainage conditionbetween the liquefiable and the non-liquefiable layer. In particular, the values of Ks utilizedare 1.0·10−10, 1.0·10e−6 and 1.0·10−5 m/s. To better evaluate the effect of taking into accountdifferent condition of drainage and discuss the dynamic response of the embankment system,the model is subjected to the same ground motion with abed,max = 0.45g (Fig.9). In this case,only the model with the minor value of permeability (i.e Ks = 1.0·10−10 m/s) liquefied, whilethe others conditions do not caused liquefaction. Figures (10 and 11) below illustrate the factthat differences appear either in the build up of water pore pressure either in the dissipation
9
Stefania Gobbi, Fernando Lopez-Caballero, Davide Forcellini
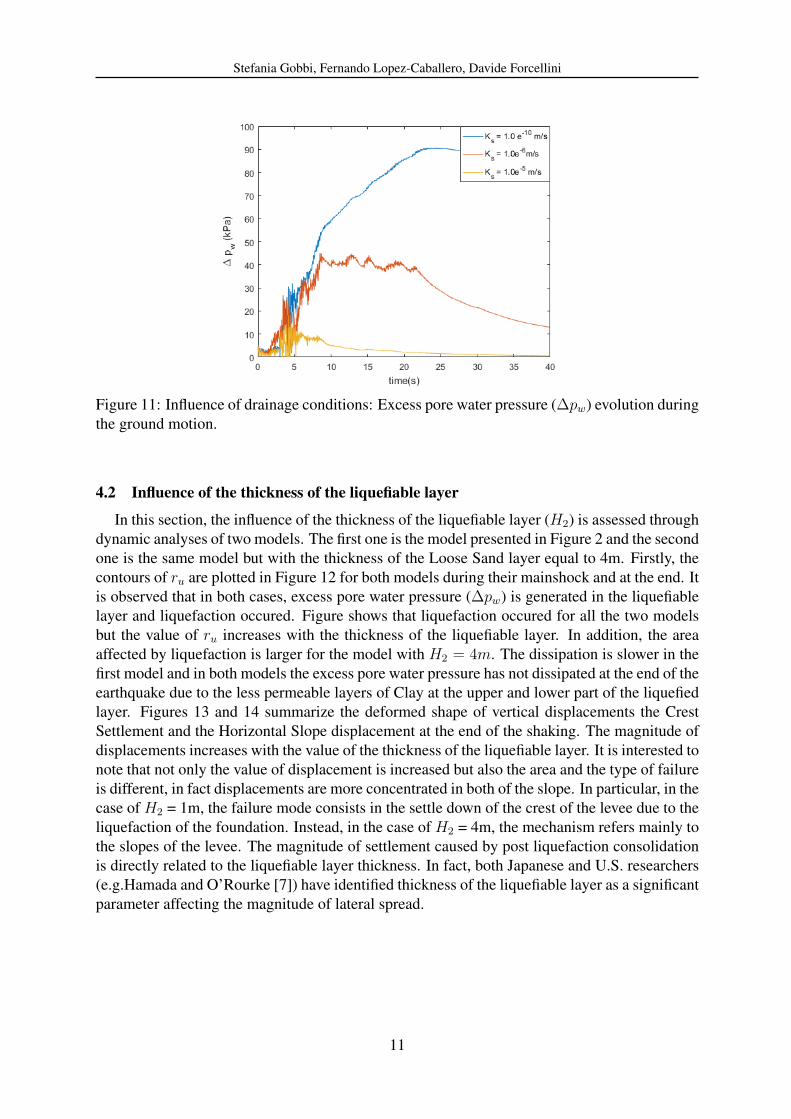
phase. Figure 10 shows the contours of ru for Ks = 1.0·10−5 m/s and Ks = 1.0·10−10 m/sduring the mainshock and at the end of the shaking, while Figure 11 compares the dissipationof pore water pressure between all the three models. The dissipation of the model with a greatvalue of permeability happens immediately (i.e Ks = 1.0·10−5 m/s), while in the others modelsthe build up of ∆pw is more extended in time and in the last case it remain even after the motion.
(a) Acceleration of Gilroy. (b) Velocity history of Gilroy.
Figure 9: Input Signal (Gilroy).
(a) Ks = 1.0·10−5 m/s: Mainshock. (b) Ks = 1.0·10−5 m/s: End of the shaking.
(c) Ks = 1.0·10−10 m/s: Mainshock. (d) Ks = 1.0·10−10 m/s: End of the shaking.
Figure 10: Influence of drainage conditions: Excess pore water pressure ratio (ru).
10
Stefania Gobbi, Fernando Lopez-Caballero, Davide Forcellini
Figure 11: Influence of drainage conditions: Excess pore water pressure (∆pw) evolution duringthe ground motion.
4.2 Influence of the thickness of the liquefiable layer
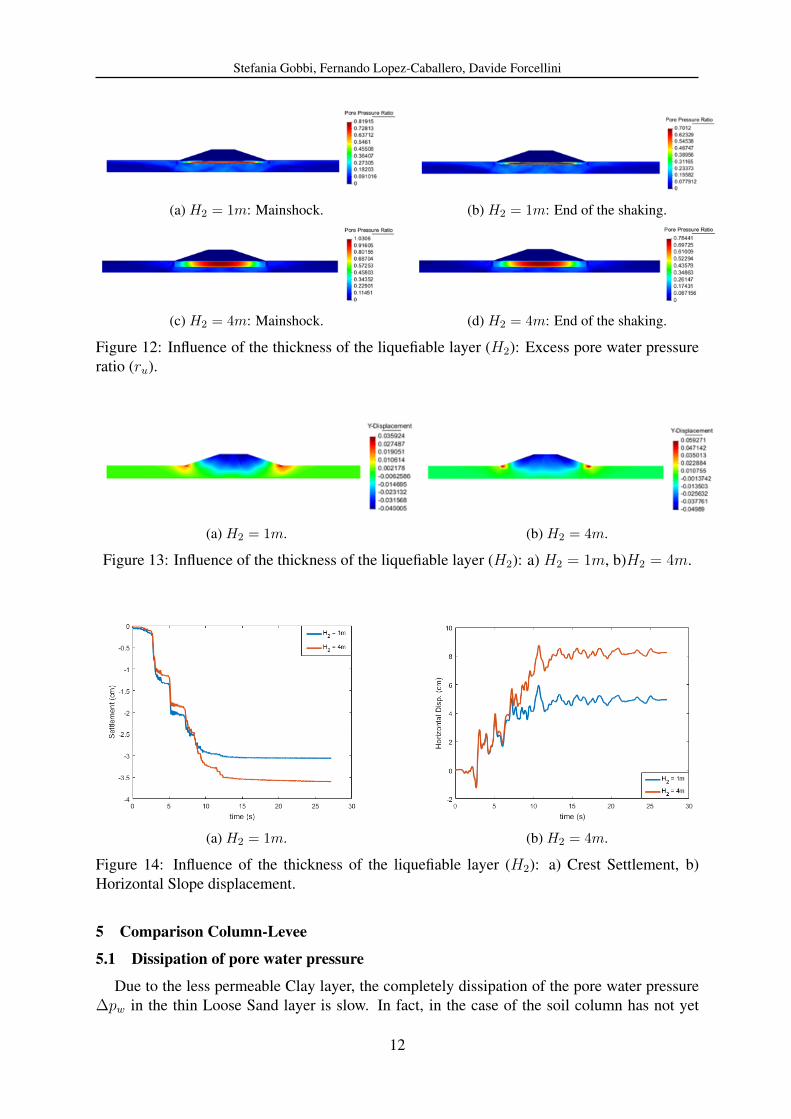
In this section, the influence of the thickness of the liquefiable layer (H2) is assessed throughdynamic analyses of two models. The first one is the model presented in Figure 2 and the secondone is the same model but with the thickness of the Loose Sand layer equal to 4m. Firstly, thecontours of ru are plotted in Figure 12 for both models during their mainshock and at the end. Itis observed that in both cases, excess pore water pressure (∆pw) is generated in the liquefiablelayer and liquefaction occured. Figure shows that liquefaction occured for all the two modelsbut the value of ru increases with the thickness of the liquefiable layer. In addition, the areaaffected by liquefaction is larger for the model with H2 = 4m. The dissipation is slower in thefirst model and in both models the excess pore water pressure has not dissipated at the end of theearthquake due to the less permeable layers of Clay at the upper and lower part of the liquefiedlayer. Figures 13 and 14 summarize the deformed shape of vertical displacements the CrestSettlement and the Horizontal Slope displacement at the end of the shaking. The magnitude ofdisplacements increases with the value of the thickness of the liquefiable layer. It is interested tonote that not only the value of displacement is increased but also the area and the type of failureis different, in fact displacements are more concentrated in both of the slope. In particular, in thecase of H2 = 1m, the failure mode consists in the settle down of the crest of the levee due to theliquefaction of the foundation. Instead, in the case of H2 = 4m, the mechanism refers mainly tothe slopes of the levee. The magnitude of settlement caused by post liquefaction consolidationis directly related to the liquefiable layer thickness. In fact, both Japanese and U.S. researchers(e.g.Hamada and O’Rourke [7]) have identified thickness of the liquefiable layer as a significantparameter affecting the magnitude of lateral spread.
11
Stefania Gobbi, Fernando Lopez-Caballero, Davide Forcellini
(a) H2 = 1m: Mainshock. (b) H2 = 1m: End of the shaking.
(c) H2 = 4m: Mainshock. (d) H2 = 4m: End of the shaking.
Figure 12: Influence of the thickness of the liquefiable layer (H2): Excess pore water pressureratio (ru).
(a) H2 = 1m. (b) H2 = 4m.
Figure 13: Influence of the thickness of the liquefiable layer (H2): a) H2 = 1m, b)H2 = 4m.
(a) H2 = 1m. (b) H2 = 4m.
Figure 14: Influence of the thickness of the liquefiable layer (H2): a) Crest Settlement, b)Horizontal Slope displacement.
5 Comparison Column-Levee
5.1 Dissipation of pore water pressure
Due to the less permeable Clay layer, the completely dissipation of the pore water pressure∆pw in the thin Loose Sand layer is slow. In fact, in the case of the soil column has not yet
12
Stefania Gobbi, Fernando Lopez-Caballero, Davide Forcellini
occured at the end of the input motion, while in the case of the levee-foundation, ∆pw hasalready begin to dissipate. For this reason, the hydraulic head hw is investigated in order tounderstand the direction of the dissipation in both cases and figure out what the reasoning is forthis.To determine the direction of water dissipation, the hydraulic head hw is calculated, using theBernouilli equation (2), where water is supposed to move at velocity uw. However, as in mostsoil flow problems, the term (uw)2
2·g is neglected, because uwi is much smaller compared to thepressure and elevation head (smaller than 1m/s).
hw =(uw)2
2 · g+pwγw
+ z (2)
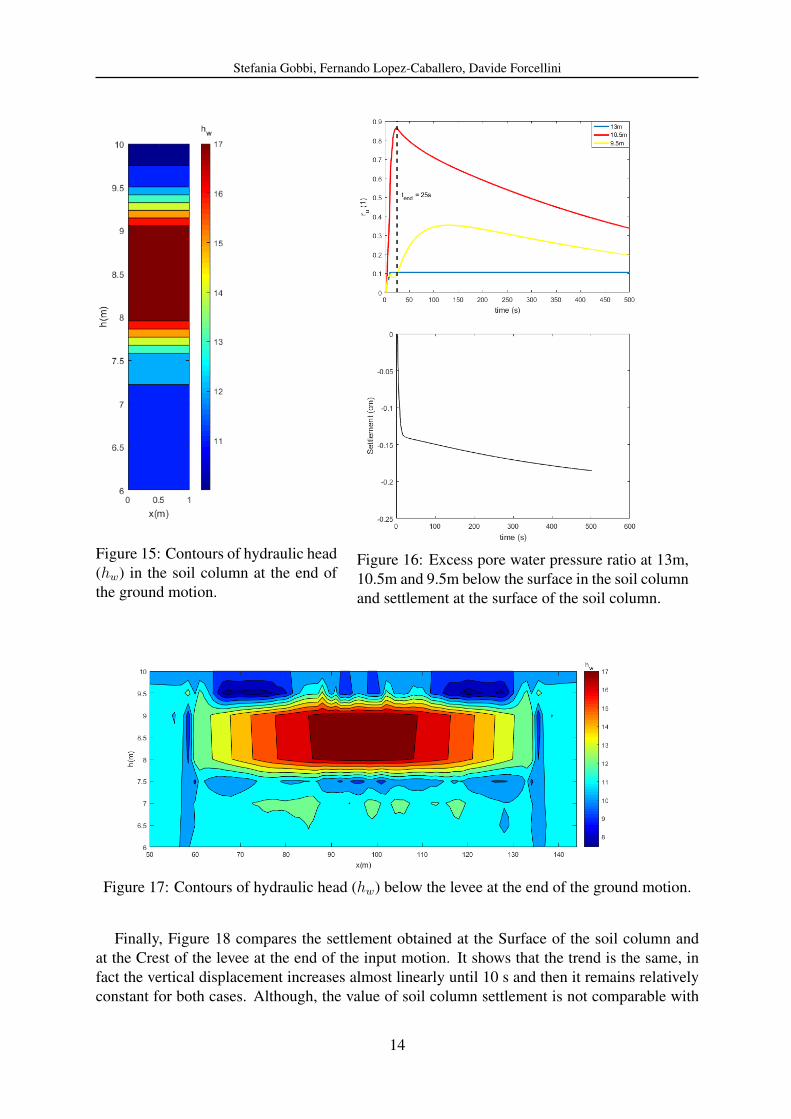
where pw is the pore water pressure, γw = ρw · g is the water unit weight, g is the gravityacceleration, z is the elevation above a given point.In order to compare the soil behaviour and the evolution of the pore pressure (∆pw) in the soilcolumn and in the levee-system foundation, both cases are subjected to the same input motion.Intending to evaluate the soil behavior during the dissipation phase (after the end of the groundmotion), in the case of the soil column, a dynamic analysis with zero input velocity history(vbed = 0) follows the end of the earthquake.Figures 15 and 17 illustrate the contours of hydraulic head (hw) in the soil column and in thelevee-foundation system, respectively, at the end of the ground motion. As shown in Figure 15,a great part of water dissipates towards the upper part of the column and then, travels to thebase of the column. Figure 16 confirms this fact, in fact, it shows that at the end of the groundmotion (tend = 25s), the pore pressure in the middle of the Loose Sand layer (i.e. 10.5m belowthe surface) begin to dissipate. Simultaneously with the dissipation in the liquefiable layer, aslow increase of ∆pw is observed in the layer of Clay (i.e. 9.5m below the surface), whichimplies that the water tries to dissipate towards the upper part of the column, while at the base(i.e. 13m below thw surface) they remain constant. It means that the dissipation is slow asthe lower part consists of a less permeable deep Clay layer, hence the dissipation occurs afterthe shaking. Finally, in Figure 16 the evolution of ground surface settlement is plotted and itis noticed that post-liquefaction settlements continue to increase slowly during the dissipationphase.Instead, Figure 17 reports the contours of hydraulic head (hw) in the case of the levee-foundationsystem. It illustrates the evolution of hw of the thin Loose Sand located buried in the deepstratum of Clay (less permeable) below the levee at the end of the shaking. It shows that asopposed to the soil column, the disspation of the ∆pw has already started before the end of theshaking. This is due to the fact that, in this case the dissipation of pore water pressure is possiblenot only towards the upper part but also in the lateral part of the Sand layer as shown in Fig.17.
13
Stefania Gobbi, Fernando Lopez-Caballero, Davide Forcellini
Figure 15: Contours of hydraulic head(hw) in the soil column at the end ofthe ground motion.
Figure 16: Excess pore water pressure ratio at 13m,10.5m and 9.5m below the surface in the soil columnand settlement at the surface of the soil column.
Figure 17: Contours of hydraulic head (hw) below the levee at the end of the ground motion.
Finally, Figure 18 compares the settlement obtained at the Surface of the soil column andat the Crest of the levee at the end of the input motion. It shows that the trend is the same, infact the vertical displacement increases almost linearly until 10 s and then it remains relativelyconstant for both cases. Although, the value of soil column settlement is not comparable with
14
Stefania Gobbi, Fernando Lopez-Caballero, Davide Forcellini
the crest settlement obtained in the embankment system. This is explained by the fact that inthe 2D embankment model, the settlement is greater because of the total weigth of the leveeabove the thin layer of Loose Sand that it is not present in the model of the soil column.
(a) (b)
Figure 18: Comparison of the: a) Soil Column surface settlement and b) Crest settlement of thelevee-foundation system at the end of the input motion (Rb7).
6 Conclusion
In the past analyses, embankments resting on non-liquefiable foundation soils have not beeninvestigated because it has been supposed that they are rarely damaged during earthquakes.However, more recently it has been reported that several river levees underlain by peat depositswere severely damaged during recents earthquakes. In this study, the behavior of an earth damfounded on a non-liquefiable clay deposit under earthquake loading is evaluated by nonlineardynamic time history. Through a series of finite element parametric analyses, several aspectswere investigated in order to take into account the effects of the liquefaction-induced damageon the dynamic behaviour of the embankment. The main conclusions of this study are thefollowing:
• the drainage conditions at the boundary between the liquefiable and the non-liquefiablelayer have a significant influence on the liquefaction behavior of the embankement. Forthe current levee model, its vulnerability is strongly related to both liquefaction apparitionand dissipation of excess pore water pressure. It is showed that maintaining constantthe permeability of the liquefiable layer, the lower the permeability value of the non-liquefiable deposit, the higher the induced damage.
• the characteristics of the earthquake and the importance of the seismic hazard are crucialaspects on the dynamic response of the system. It has been showed that the intensity mea-sures of the peak ground acceleration (PGA), peak ground velocity (PGV), mean period(Tm), predominant period (Tp), have an important role on the liquefaction triggering.
• the thickness of the saturated zone influence the generation of the excess pore pressure,the liquefaction apparition and the area of failure. But also a thin saturated layer with athickness of 1 m can liquefy during strong base shaking.
15
Stefania Gobbi, Fernando Lopez-Caballero, Davide Forcellini
These results are in agreement to the conclusions drawn by Okamura and Yamamoto [19] aftercentrifuge tests of earth embankments founded on non-liquefiable foundations.
References
[1] Adalier, K. and Sharp, M. (2004). Embankment dam on liquefiable foundation?dynamicbehavior and densification remediation. Journal of geotechnical and geoenvironmental en-gineering, 130(11):1214–1224.
[2] Cameron, W. and Green, R. (2004). Soil nonlinearity versus frequency effects. In Inter-national Workshop on the Uncertainties in Nonlinear Soil Properties and their Impact onModeling Dynamic Response.
[3] Dafalias, Y. (1986). Bounding surface plasticity. i: Mathematical foundation and hypoplas-ticity. Journal of Engineering Mechanics, 112(9):966–987.
[4] Elgamal, A., Lu, J., and Forcellini, D. (2009). Mitigation of liquefaction-induced lateral de-formation in a sloping stratum: three-dimensional numerical simulation. Journal of geotech-nical and geoenvironmental engineering, 135(11):1672–1682.
[5] Elgamal, A., Yang, Z., and Parra, E. (2002). Computational modeling of cyclic mobility andpost-liquefaction site response. Soil Dynamics and Earthquake Engineering, 22(4):259–271.
[6] Elgamal, A., Y. Z. and Parra, E., R. A. (2003). Modeling of cyclic mobility in saturatedcohesionless soils. International Journal of Plasticity, 19(6):883–905.
[7] Hamada, M. and O’Rourke, T. (1992). Case studies of liquefaction and lifeline performanceduring past earthquakes, volume 1 japanese case studies. National Center for EarthquakeEngineering Research. SUNY at Buffalo, Red Jacket Quadrangle, Buffalo, NY, 14261.
[8] Iervolino, I. and Cornell, C. (2005). Record selection for nonlinear seismic analysis ofstructures. Earthquake Spectra, 21(3):685–713.
[9] Ishihara, K. (1985). Stability of natural deposits during earthquakes. In Proceedings, 11thInternational Conference on Soil Mechanics and Foundation Engineering, volume 1, pages321–376.
[10] Ishihara, K. (1993). Thirty-third rankine lecture: Liquefaction and flow failure duringearthquakes. Geotechnique, 43:349–416.
[11] Kawase, H. (2011). Strong motion characteristics and their damage impact to structuresduring the off pacific coast of tohoku earthquake of march 11, 2011: How extraordinary wasthis m 9. 0 earthquake. In Proceedings, 4th IASPEI/IAEE International Symposium.
[12] Kramer, S. (1996). Geotechnical earthquake engineering. Pearson Education India.
[13] Lanzo, G. and Pagliaroli, A. (2012). Seismic site effects at near-fault strong-motion sta-tions along the aterno river valley during the m w= 6.3 2009 l’aquila earthquake. Soil Dy-namics and Earthquake Engineering, 40:1–14.
[14] Lysmer, J. and Kuhlemeyer, R. (1969). Finite dynamic model for infinite media. Journalof the Engineering Mechanics Division, 95(4):859–878.
16
Stefania Gobbi, Fernando Lopez-Caballero, Davide Forcellini
[15] Maharjan, M. and Takahashi, A. (2014). Liquefaction-induced deformation of earthenembankments on non-homogeneous soil deposits under sequential ground motions. SoilDynamics and Earthquake Engineering, 66:113–124.
[16] Mazzoni, S., M. F. S. M. F. G. et al. (2009). Open system for earthquake engineering simu-lation user manual version 2.1. 0. Berkeley, CA, University of California, Pacific EarthquakeEngineering Center, USA.
[17] Okamura, M. and Hayashi, S. (2014). Damage to river levees by the 2011 off the pacificcoast tohoku earthquake and prediction of liquefaction in levees. Safety and Reliability:Methodology and Applications, page 57.
[18] Okamura, M. and Matsuo, O. (2002). Effects of remedial measures for mitigating embank-ment settlement due to foundation liquefaction. International Journal of Physical Modellingin Geotechnics, 2(2):01–12.
[19] Okamura, M., T. S. and Yamamoto, R. (2013). Seismic stability of embankments subjectedto pre-deformation due to foundation consolidation. Soils and Foundations, 53(1):11–22.
[20] Ozutsumi, O., S. S. I. S. T. Y. S. W. and Shimazu, T. (2002). Effective stress analyses ofliquefaction-induced deformation in river dikes. Soil Dynamics and Earthquake Engineer-ing, 22(9):1075–1082.
[21] Parra, E. (1996). Numerical modeling of liquefaction and lateral ground deformationincluding cyclic mobility and dilation response in soil systems. PhD thesis, [Sl: sn].
[22] Prevost, J. (1985). A simple plasticity theory for frictional cohesionless soils. Interna-tional Journal of Soil Dynamics and Earthquake Engineering, 4(1):9–17.
[23] Ribo, R., P. M., Escolano, E., R. J. G. L., and Rosa, E. (1999). Gid user manual. CIMNE,Barcelona.
[24] Sasaki, Y. (2009). River dike failures during the 1993 kushiro-oki earthquake and the2003 tokachi-oki earthquake. Earthquake geotechnical case histories for performance-baseddesign-Kokusho (ed), pages 131–157.
[25] Shinozuka, M. and Ohtomo, K. (1989). Spatial severity of liquefaction. In Proceedings ofthe second US-Japan workshop in liquefaction, large ground deformation and their effectson lifelines, pages 193–206.
[26] Sorrentino, L., Kunnath, S., Monti, G., and Scalora, G. (2008). Seismically inducedone-sided rocking response of unreinforced masonry facades. Engineering Structures,30(8):2140–2153.
[27] Tonni, L., Forcellini, D., Osti, C., and Gottardi, G. (2015). Modelling liquefaction phe-nomena during the may 2012 emilia-romagna (italy) earthquake.
[28] Yang, Z. and Elgamal, A. (2000). Numerical modeling of earthquake site response includ-ing dilation and liquefaction. PhD thesis, Columbia University NY, New York.
[29] Zienkiewicz, O. and Shiomi, T. (1984). Dynamic behaviour of saturated porous media; thegeneralized biot formulation and its numerical solution. International journal for numericaland analytical methods in geomechanics, 8(1):71–96.