24th ABCM International Congress of Mechanical Engineering December 3-8, 2017, Curitiba, PR, Brazil COBEM-2017-0844 NUMERICAL AND EXPERIMENTAL ANALYSIS OF THE INFLUENCE OF PIPE FITTINGS ON THE TURBULENCE-INDUCED VIBRATION Thiago Ferreira Bernardes Bento Daniel Pontes Lannes Roger Matsumoto Moreira Antonio Lopes Gama School of Engineering / Fluminense Federal University Rua Passo da Pátria, 156, Niterói, RJ, 24210-240, Brazil. [email protected]; [email protected]; [email protected]; [email protected]. Abstract. Dynamic forces induced by turbulent flow are one of the most common sources of piping vibration. Excessive vibration can lead to pipe failure and immoderate noise. Piping fittings tend to cause disturbances in the flow profiles, increasing the turbulence and hence the pipe vibration. This paper compares the influence of pipe fittings (e.g. long and short radius elbows and orifice plates) on the turbulence in single-phase fluid flows and its effects on pipe vibration, using both numerical and experimental approaches. Results from CFD analysis using the k-ε model and experiments with different pipe fittings are presented. Keywords: Turbulence induced vibration, turbulence modeling, pipe fittings. 1. INTRODUCTION Flow induced vibration is the term denoting the vibration response of any structure subject to an internal or external flow (Chen, 1985). Piping systems are used in many different applications hence they can be under various mechanisms of excitation which are responsible for generating vibration and dynamic strains in pipes. Blevins (2001) identified the excitation mechanisms according to the flow characteristics on which turbulence is shown as a random-excitation source of vibration due to its unsteady behavior. Pipe fittings are used to facilitate the construction of pipping systems and to control the process. However most of pipe fittings increase the turbulence at regions in close proximity to them, hence increasing the level of pipe vibration. Sudo et al. (1998) identified a great increase of the turbulence at the bend outlet. The turbulence levels are strongly influenced by bend geometry increasing as the curvature ratio (R/D) decreases (Dutta and Nandi, 2015), where R is the mean curvature radius and D is the pipe diameter. The flow structures in pipe bends are also influenced by geometry and Reynolds number. In pipe bends with R/D<1,5 the adverse pressure gradient is responsible for the flow separation upstream of bend outlet, whereas a reattachment point occurs downstream (Munson et al., 2013). The reattachment point was identified as the region of largest pressure fluctuation by Shiraishi et al. (2006) with a secondary flow being formed. Orifice plates are common component in several industrial segments used as flow control elements in piping systems. They are responsible, however, for creating large disturbances in the flow, generating structural excitation (Mao Qing and Zhang Jinghui, 2007). Failures caused by orifice-induced vibrations have been reported in the literature and studied by several researchers, especially in nuclear power plants (Qing et al., 2003; Caillaud et al., 2006 and Bai et al., 2016). Two main consequences of excitation mechanisms observed during this process are cavitation and the increase of pressure fluctuation due to turbulence (Qing and Jinghui, 2007; Qing et al., 2003). 2. TURBULENT FLOW Turbulent flows are characterized by their chaotic and random behavior where pressure and velocity, beside other quantities, vary in the same way (Versteeg and Malalasekera, 1995). Tennekes and Lumley (1972) however emphasize the difficult to define the turbulent flow and determine it through some other characteristics such as high diffusivity, high Reynolds number (Re), three-dimensional vorticity and dissipation. Turbulent flows are always dissipative and require a continuous supply of energy to keep the turbulence, which has a quick decay if this does not occur. Stretching caused by the mean flow provides to the large eddies the energy required to maintain the turbulence (Versteeg and
Transcript
24th ABCM International Congress of Mechanical Engineering December 3-8, 2017, Curitiba, PR, Brazil
COBEM-2017-0844 NUMERICAL AND EXPERIMENTAL ANALYSIS OF THE INFLUENCE OF
PIPE FITTINGS ON THE TURBULENCE-INDUCED VIBRATION
Thiago Ferreira Bernardes Bento Daniel Pontes Lannes Roger Matsumoto Moreira Antonio Lopes Gama School of Engineering / Fluminense Federal University Rua Passo da Pátria, 156, Niterói, RJ, 24210-240, Brazil. [email protected]; [email protected]; [email protected]; [email protected]. Abstract. Dynamic forces induced by turbulent flow are one of the most common sources of piping vibration. Excessive vibration can lead to pipe failure and immoderate noise. Piping fittings tend to cause disturbances in the flow profiles, increasing the turbulence and hence the pipe vibration. This paper compares the influence of pipe fittings (e.g. long and short radius elbows and orifice plates) on the turbulence in single-phase fluid flows and its effects on pipe vibration, using both numerical and experimental approaches. Results from CFD analysis using the k-ε model and experiments with different pipe fittings are presented. Keywords: Turbulence induced vibration, turbulence modeling, pipe fittings.
1. INTRODUCTION
Flow induced vibration is the term denoting the vibration response of any structure subject to an internal or external flow (Chen, 1985). Piping systems are used in many different applications hence they can be under various mechanisms of excitation which are responsible for generating vibration and dynamic strains in pipes. Blevins (2001) identified the excitation mechanisms according to the flow characteristics on which turbulence is shown as a random-excitation source of vibration due to its unsteady behavior.
Pipe fittings are used to facilitate the construction of pipping systems and to control the process. However most of pipe fittings increase the turbulence at regions in close proximity to them, hence increasing the level of pipe vibration. Sudo et al. (1998) identified a great increase of the turbulence at the bend outlet. The turbulence levels are strongly influenced by bend geometry increasing as the curvature ratio (R/D) decreases (Dutta and Nandi, 2015), where R is the mean curvature radius and D is the pipe diameter.
The flow structures in pipe bends are also influenced by geometry and Reynolds number. In pipe bends with R/D<1,5 the adverse pressure gradient is responsible for the flow separation upstream of bend outlet, whereas a reattachment point occurs downstream (Munson et al., 2013). The reattachment point was identified as the region of largest pressure fluctuation by Shiraishi et al. (2006) with a secondary flow being formed.
Orifice plates are common component in several industrial segments used as flow control elements in piping systems. They are responsible, however, for creating large disturbances in the flow, generating structural excitation (Mao Qing and Zhang Jinghui, 2007). Failures caused by orifice-induced vibrations have been reported in the literature and studied by several researchers, especially in nuclear power plants (Qing et al., 2003; Caillaud et al., 2006 and Bai et al., 2016). Two main consequences of excitation mechanisms observed during this process are cavitation and the increase of pressure fluctuation due to turbulence (Qing and Jinghui, 2007; Qing et al., 2003).
2. TURBULENT FLOW
Turbulent flows are characterized by their chaotic and random behavior where pressure and velocity, beside other quantities, vary in the same way (Versteeg and Malalasekera, 1995). Tennekes and Lumley (1972) however emphasize the difficult to define the turbulent flow and determine it through some other characteristics such as high diffusivity, high Reynolds number (Re), three-dimensional vorticity and dissipation. Turbulent flows are always dissipative and require a continuous supply of energy to keep the turbulence, which has a quick decay if this does not occur. Stretching caused by the mean flow provides to the large eddies the energy required to maintain the turbulence (Versteeg and
T. Bento, D. Lannes, R. Moreira and A. Gama Numerical and Experimental Analysis of the Influence of Pipe Fittings on Turbulence-Induced Vibration in Single-Phase Flows
Malalasekera, 1995) and this energy is dissipated in the form of heat close to the surface due to the viscous effects (Souza et al., 2011). Pittard and Blotter (2003) however considered that part of this energy is converted into potential energy in the form of pressure fluctuation, which is the main responsible for the pipe vibration. This process of energy transfer is known as cascade energy.
2.1 Analysis of turbulent flow
Since turbulent flows present random behavior, the use of deterministic approaches for studying them is fruitless.
Consequently, statistical methods are usually employed for such analysis. Turbulent flows present instantaneous fluctuations in velocity, temperature, pressure, and other quantities (Souza et al., 2011) and can be represented in terms of the sum of mean and fluctuating values. This method is known as Reynolds decomposition (Bird et al., 2002). Equation (1) shows the Reynolds decomposition for velocity, where v, v and v’ are respectively the instantaneous, mean and fluctuating velocity.
�� = ��� + ��� (1) The subscript, i=1, 2, 3, indicates the directions of an orthogonal axes system used to describe the flow direction. The time-averages of fluctuations are equal to zero and the magnitude of turbulence can be determined by the
turbulent kinetic energy:
� = ���
���� + �� ���� + � � ����� (2)
where �� is the characteristic mixing length.
Equations (3) and (4) show respectively the Reynolds decomposition applied to Navier-Stokes and continuity equations for incompressible fluid with constant viscosity, where � is the dynamic viscosity and � is the density:
� ������ + � ���������
��� = − ��̅��� +
���� ��
������� − ������������� (3)
!"����������� = !$���� = 0; (4) !$��� � = 0 Equation (3) is called Reynolds Averaged Navier-Stokes and introduces new terms in the Navier-Stokes equations
called Reynolds Stress or turbulent stress (�������������) which represent the convective momentum transfer due to velocity fluctuations (Versteeg and Malalasekera, 1995).
2.2 Turbulence-induced vibration
Turbulent flows are present in most of industrial processes, being one of the most important excitation mechanisms
in piping systems (MTD, 1999). However systems are frequently designed to maximize this turbulence aiming for an increase in heat and mass transfer efficiency (Weaver et al., 2000). According to Pittard et al. (2004) pressure fluctuations at regions close to the pipe wall are responsible for exciting vibrations in the pipes. This conclusion is further corroborated by previous studies by other researchers such as Kim (1989), Durant and Robert (1999).
In a research that aims to develop a non-invasive flow meter using accelerometers, Evans (2004) presents a theory relating the pressure fluctuation generated by the turbulent flow with the dynamic response of the pipe in the form of acceleration, being the pipe considered as a beam. Evans (2004) first proposes that pressure fluctuations are proportional to the turbulent shear stress as shown in Eq. (5):
)� ∝ +��������� (5)
+� and �� represent the velocity fluctuations in axial and normal flow directions and )� the pressure fluctuation. Evans (2004) also considered the pressure fluctuation as a distributed load. Applying this concept to the flexure
equation and relating this with the equation of motion for transverse vibration gives:
�,-��, = −
./ )�(0) (6)
where w is the transverse displacement, t is the time, x is the direction along the pipe axis and A is the cross sectional area of the pipe wall.
24th ABCM International Congress of Mechanical Engineering December 3-8, 2017, Curitiba, PR, Brazil
3. EXPERIMENTAL PROCEDURE AND APPARATUS The water system of the test bench consists basically of a closed circuit with a reservoir of 300 liters of capacity, a
horizontal centrifugal pump with a nominal capacity of 16 m³/h maintained in a fixed rotation of 3600 RPM, two rotameters with different scales, one ranging from 0.1 m³/h to 1 m³/h and the other ranging from 1 m³/h to 10 m³/h and an test section, as shown in Fig. 1. Additionally, the test bench has an entrance length which guarantees the fully developed flow in the test sections.
.
Figure 1. Diagram of test bench. The dynamic response of the pipe test sections was measured with high sensitivity accelerometers model 333B50 by
PCB Pizotronics, installed on the outer surface of the pipes and fittings. Data acquisition was performed with the Spider 8 from HBM using a sample rate of 1600 Hz during a period 20 s. The data post-processing was performed with the software Catman®.
The operation of the water circuit consists in regulating the flow by opening and closing the control valves installed
downstream of the pump. The data were acquired for a flow rate ranging from 0.2 m³/h to 9 m³/h that represents a Re varying from 3.19 5 10 to 1.96 5 107 depending on the test section. In order to verify the replicability of the results, three measurements were performed for each flow.
3.1 Test sections
The test section is the region of the test bench where the instruments are installed and are capable of supporting
various piping arrangements. Four different sections were used in the experiments aiming to compare the influence of each one on the turbulence and hence on the vibration levels. The test sections consist of a straight pipe, used as a reference of a non-disturbed flow, a long radius elbow, short radius elbow and a straight pipe with an orifice plate.
Almost all tested flow rates are characterized as turbulent flows in the used test sections except very low flow rate (0.2 m³/h or less) in the test section with internal diameter of 25.4 mm which was transient.
a) Straight pipe
The straight section was made of acrylic to allow for the flow visualization, with 25.4 and 19 mm external and
internal diameter, respectively. The properties considered for the acrylic are E=3200 MPa and γ=1200 kg/m³, where E is the Young’s modulus and γ is the specific mass.
The tests were carried out in a straight section anchored in both ends with a span of 650 mm. Accelerometers were installed in the midpoint between the anchorages.
b) Short radius elbow
The short radius elbow is made of polyvinyl chloride (PVC), with curvature ratio of R/D=0.5 and sharp inner corner.
PVC properties are E=3000 MPa and γ=1400 kg/m³. Straight acrylic pipe sections were welded to the elbow with PVC plastic adhesive and the set was anchored in the
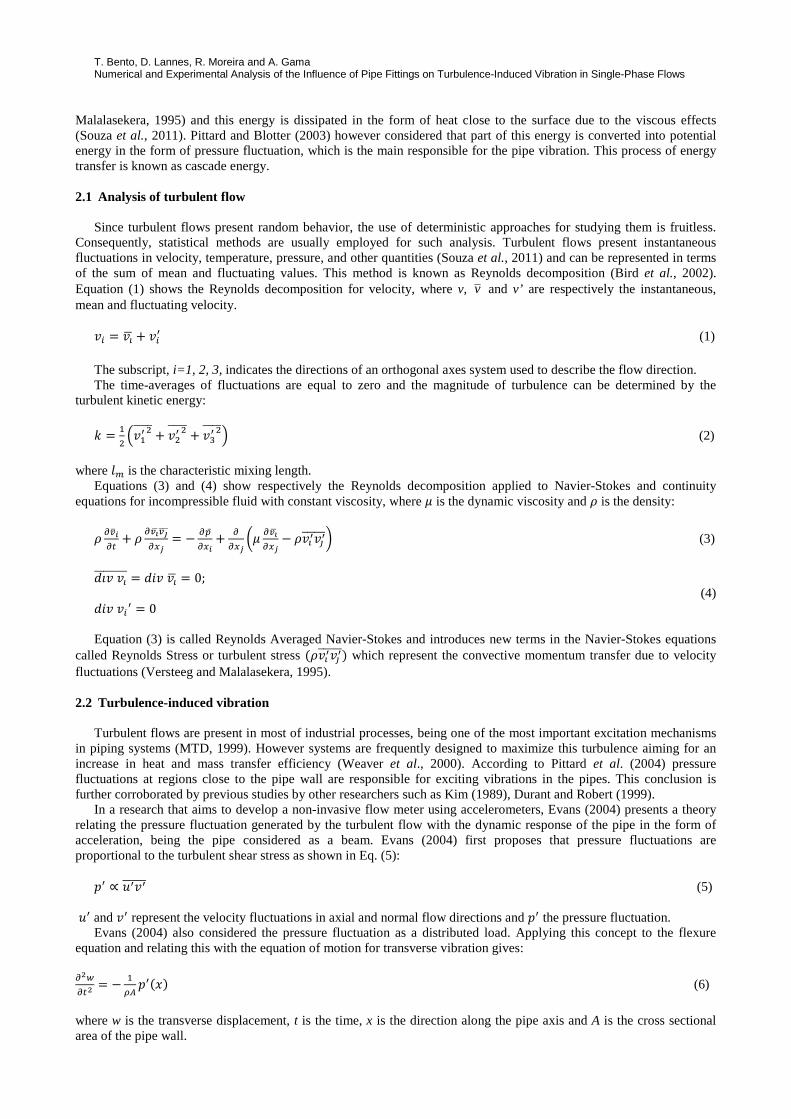
two supports forming an "L" arrangement. The accelerometers were mounted close to the elbow as shown in Fig. 2a.
c) Long radius elbow The test section of long radius elbow (R/D=2) with the accelerometers is depicted in the Fig. 2b.
T. Bento, D. Lannes, R. Moreira and A. Gama Numerical and Experimental Analysis of the Influence of Pipe Fittings on Turbulence-Induced Vibration in Single-Phase Flows
(a) (b)
Figure 2. (a) Short-radius elbow; (b) long-radius elbow test sections.
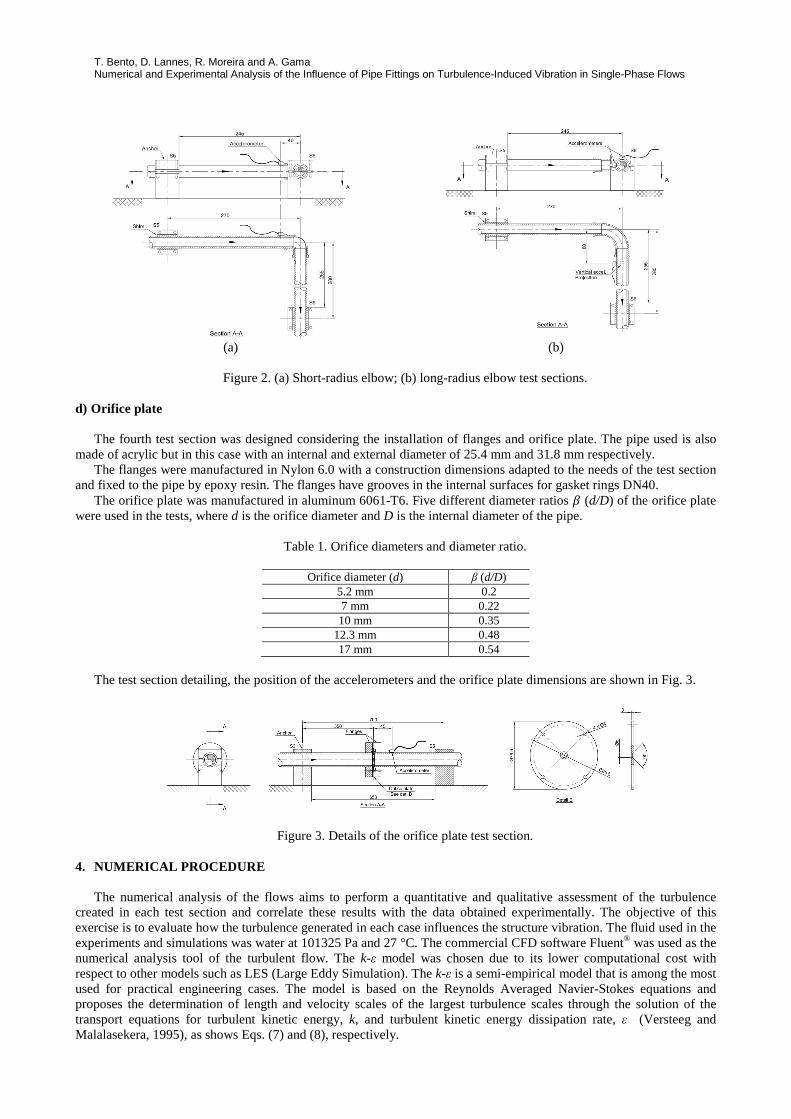
d) Orifice plate
The fourth test section was designed considering the installation of flanges and orifice plate. The pipe used is also
made of acrylic but in this case with an internal and external diameter of 25.4 mm and 31.8 mm respectively. The flanges were manufactured in Nylon 6.0 with a construction dimensions adapted to the needs of the test section
and fixed to the pipe by epoxy resin. The flanges have grooves in the internal surfaces for gasket rings DN40. The orifice plate was manufactured in aluminum 6061-T6. Five different diameter ratios 8 (d/D) of the orifice plate
were used in the tests, where d is the orifice diameter and D is the internal diameter of the pipe.
Table 1. Orifice diameters and diameter ratio.
Orifice diameter (d) β (d/D) 5.2 mm 0.2 7 mm 0.22 10 mm 0.35
12.3 mm 0.48 17 mm 0.54
The test section detailing, the position of the accelerometers and the orifice plate dimensions are shown in Fig. 3.
Figure 3. Details of the orifice plate test section.
4. NUMERICAL PROCEDURE
The numerical analysis of the flows aims to perform a quantitative and qualitative assessment of the turbulence created in each test section and correlate these results with the data obtained experimentally. The objective of this exercise is to evaluate how the turbulence generated in each case influences the structure vibration. The fluid used in the experiments and simulations was water at 101325 Pa and 27 °C. The commercial CFD software Fluent® was used as the numerical analysis tool of the turbulent flow. The k-ε model was chosen due to its lower computational cost with respect to other models such as LES (Large Eddy Simulation). The k-ε is a semi-empirical model that is among the most used for practical engineering cases. The model is based on the Reynolds Averaged Navier-Stokes equations and proposes the determination of length and velocity scales of the largest turbulence scales through the solution of the transport equations for turbulent kinetic energy, k, and turbulent kinetic energy dissipation rate, ε (Versteeg and Malalasekera, 1995), as shows Eqs. (7) and (8), respectively.
24th ABCM International Congress of Mechanical Engineering December 3-8, 2017, Curitiba, PR, Brazil
�(.9)�� + �(.9��� )
��� = ���� �
:;<=
�9���� + 2�?@�A . @�A − �B (7)
�(.C)�� + �(.C��� )
��� = ���� �
:;<D
�C���� + 2�?EC C
9 @�A . @�A − �EC C,9 (8)
where, @�A is the mean component of the rate of deformation of a fluid element and �? is the turbulent dynamic viscosity.
Equations (7) and (8) have dimensionless constants of adjustment based on experimental observations for a wide variety of flows, whose values are: E: = 0.09;F9 = 1;FC = 1.30;EC = 1.44;EC = 1.92
In order to compare the variation of the flow structures and their properties as a function of the Reynolds number, simulations for 1, 3, 6 and 8 m³/h were performed for the straight pipe and curved test sections. For the section with orifice plate, flows of 1.3, 4, 8 and 10.7 m³/h were simulated with orifice diameters of 5, 10 and 17 mm. The Reynolds numbers of the simulated flows for the section with orifice plate were the same as those simulated for the other sections. Simulations were performed in straight pipe sections to obtain the fully developed velocity profile and it was then imported as the velocity inlet for the other geometries. The meshes created for discretization of the models were hybrid, with hexahedral elements close to the wall and tetrahedral elements in the internal regions.
4.1 Validation
The validation was done by comparing the kinematic analysis obtained numerically in this study and the
experimental and numerical analyzes obtained by Sudo et al. (1998) and Kim et al. (2014) respectively. Sudo et al. (1998) carried out experiments aiming to investigate the characteristics of flows through 90° circular
bends with a curvature ratio of 2 and HI = 6 5 10J, with similar conditions carried out in the present study. Kim et al. (2014) performed numerical simulations to characterize the secondary flow in 90° pipe bends and made a comparative study using Sudo et al. (1998) experiments data and conditions to select the ideal turbulence model. Figure 4 shows the normalized axial velocity profile (K/K�MNO�) at the horizontal symmetry plane of the outlet surface of the bend, with curvature ratio of 2, namely long radius elbow, as a function of the dimensionless distance P/H. K is the axial velocity, K�MNO� is the inlet mean velocity, P and H are the inner radius and the curvature radius of the elbow, respectively. In the graph, -0.25 represent the inner corner of the elbow and 0.25 its outer corner. A good agreement is found, especially at the outer corner, whereas discrepancies are greater in the inner region due to adverse pressure gradients, according to Kim et al. (2014).
Figure 4. Comparison between normalized axial velocity of present and previous studies.
5. RESULTS AND DISCUSSIONS
5.1 Experimental results
Figure 5 shows the power spectrum density (PSD) of all test sections for a specific Reynolds number, where it was
observed that the highest peak occurs at the first natural frequency of flexural vibration of the test section. Turbulence is characterized for its random behavior and its energy is concentrated at low frequencies so that the first mode shapes of
T. Bento, D. Lannes, R. Moreira and A. Gama Numerical and Experimental Analysis of the Influence of Pipe Fittings on Turbulence-Induced Vibration in Single-Phase Flows
the structure are primarily excited. Despite the peaks at the natural frequencies, it can be seen the decay trend as the frequency increases indicating that the turbulence is the main source of vibration.
Figure 5. Power spectrum density for all test section at a specific Reynolds number. Apart from the effect on signal amplitude, variation of the Reynolds number does not appear to generate relevant
shifts on signal behavior in the frequency domain. In order to evaluate the pipe response to a turbulent flow, the standard deviation of the accelerometer signals for
increasing Reynolds number was considered. Figure 6 presents a comparison between the vibration of all the test sections studied and their variation as a function
of the Reynolds number.
Figure 6. Variation of vibration levels as a function of Reynolds number for the test sections. It can be seen that piping vibration is influenced by the Reynolds number for all test sections, but for the orifice
plate and short radius elbow this dependency is specially larger, and responsible for generating the highest vibration amplitudes.
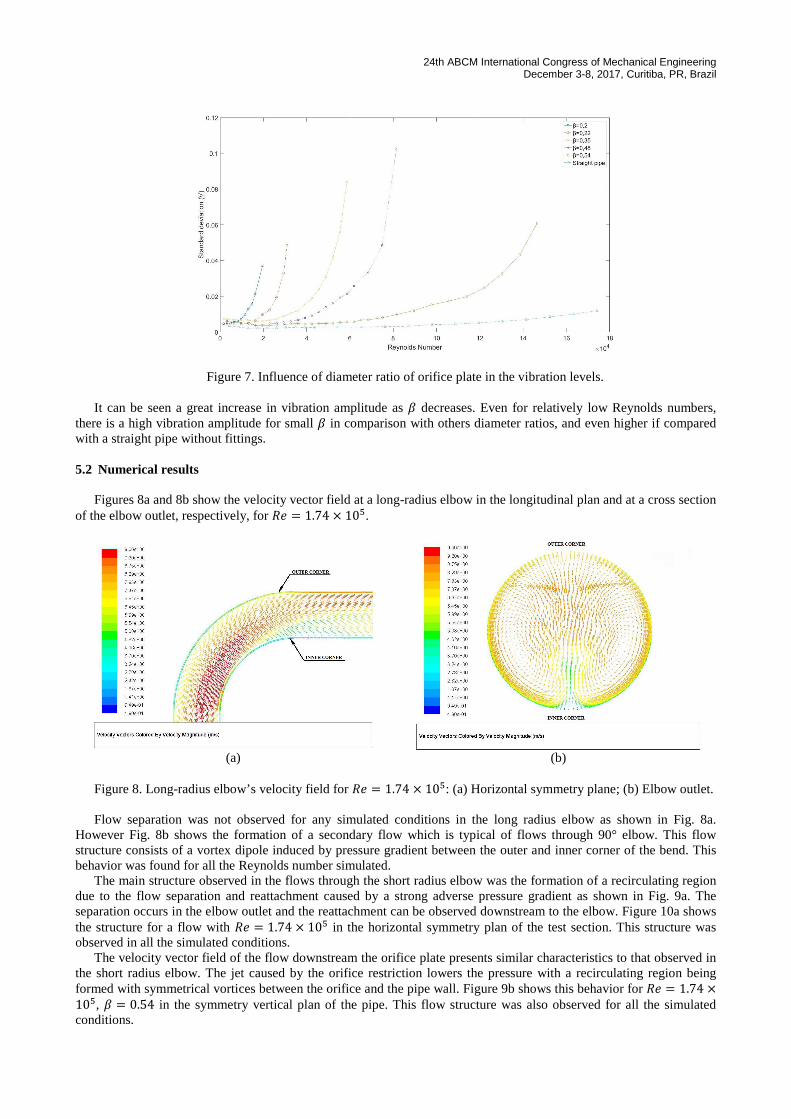
For the orifice plate, a parameter that greatly influence the vibration levels is the diameter ratio 8. Large pressure loss and consequently a large decrease in the pump capacity are observed for small diameter ratio 8. Figure 7 shows the influence of 8 on the piping vibration.
24th ABCM International Congress of Mechanical Engineering December 3-8, 2017, Curitiba, PR, Brazil
Figure 7. Influence of diameter ratio of orifice plate in the vibration levels.
It can be seen a great increase in vibration amplitude as 8 decreases. Even for relatively low Reynolds numbers, there is a high vibration amplitude for small 8 in comparison with others diameter ratios, and even higher if compared with a straight pipe without fittings.
5.2 Numerical results
Figures 8a and 8b show the velocity vector field at a long-radius elbow in the longitudinal plan and at a cross section
of the elbow outlet, respectively, for HI = 1.74 5 107.
(a) (b)
Figure 8. Long-radius elbow’s velocity field for HI = 1.74 5 107: (a) Horizontal symmetry plane; (b) Elbow outlet. Flow separation was not observed for any simulated conditions in the long radius elbow as shown in Fig. 8a.
However Fig. 8b shows the formation of a secondary flow which is typical of flows through 90° elbow. This flow structure consists of a vortex dipole induced by pressure gradient between the outer and inner corner of the bend. This behavior was found for all the Reynolds number simulated.
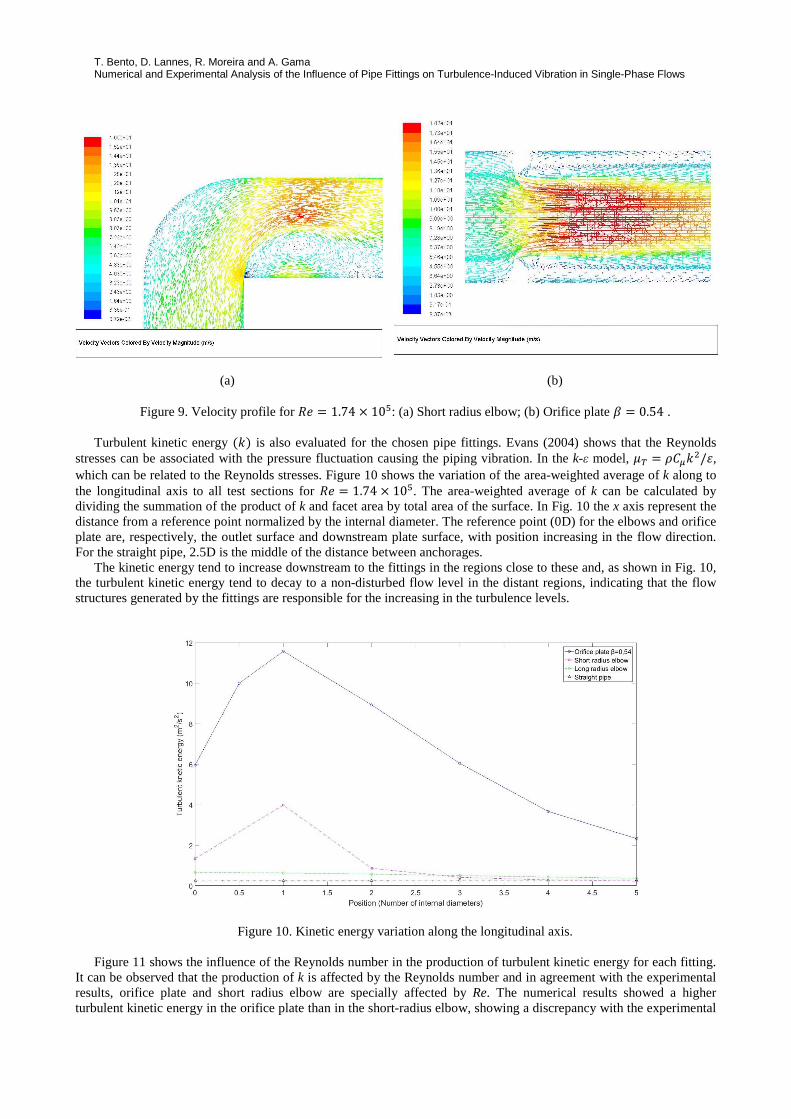
The main structure observed in the flows through the short radius elbow was the formation of a recirculating region due to the flow separation and reattachment caused by a strong adverse pressure gradient as shown in Fig. 9a. The separation occurs in the elbow outlet and the reattachment can be observed downstream to the elbow. Figure 10a shows the structure for a flow with HI = 1.74 5 107 in the horizontal symmetry plan of the test section. This structure was observed in all the simulated conditions.
The velocity vector field of the flow downstream the orifice plate presents similar characteristics to that observed in the short radius elbow. The jet caused by the orifice restriction lowers the pressure with a recirculating region being formed with symmetrical vortices between the orifice and the pipe wall. Figure 9b shows this behavior for HI = 1.74 5107, 8 = 0.54 in the symmetry vertical plan of the pipe. This flow structure was also observed for all the simulated conditions.
T. Bento, D. Lannes, R. Moreira and A. Gama Numerical and Experimental Analysis of the Influence of Pipe Fittings on Turbulence-Induced Vibration in Single-Phase Flows
(a) (b)
Figure 9. Velocity profile for HI = 1.74 5 107: (a) Short radius elbow; (b) Orifice plate 8 = 0.54 . Turbulent kinetic energy (�) is also evaluated for the chosen pipe fittings. Evans (2004) shows that the Reynolds
stresses can be associated with the pressure fluctuation causing the piping vibration. In the k-ε model, �? = �E:�/B, which can be related to the Reynolds stresses. Figure 10 shows the variation of the area-weighted average of k along to the longitudinal axis to all test sections for HI = 1.74 5 107. The area-weighted average of k can be calculated by dividing the summation of the product of k and facet area by total area of the surface. In Fig. 10 the x axis represent the distance from a reference point normalized by the internal diameter. The reference point (0D) for the elbows and orifice plate are, respectively, the outlet surface and downstream plate surface, with position increasing in the flow direction. For the straight pipe, 2.5D is the middle of the distance between anchorages.
The kinetic energy tend to increase downstream to the fittings in the regions close to these and, as shown in Fig. 10, the turbulent kinetic energy tend to decay to a non-disturbed flow level in the distant regions, indicating that the flow structures generated by the fittings are responsible for the increasing in the turbulence levels.
Figure 10. Kinetic energy variation along the longitudinal axis.
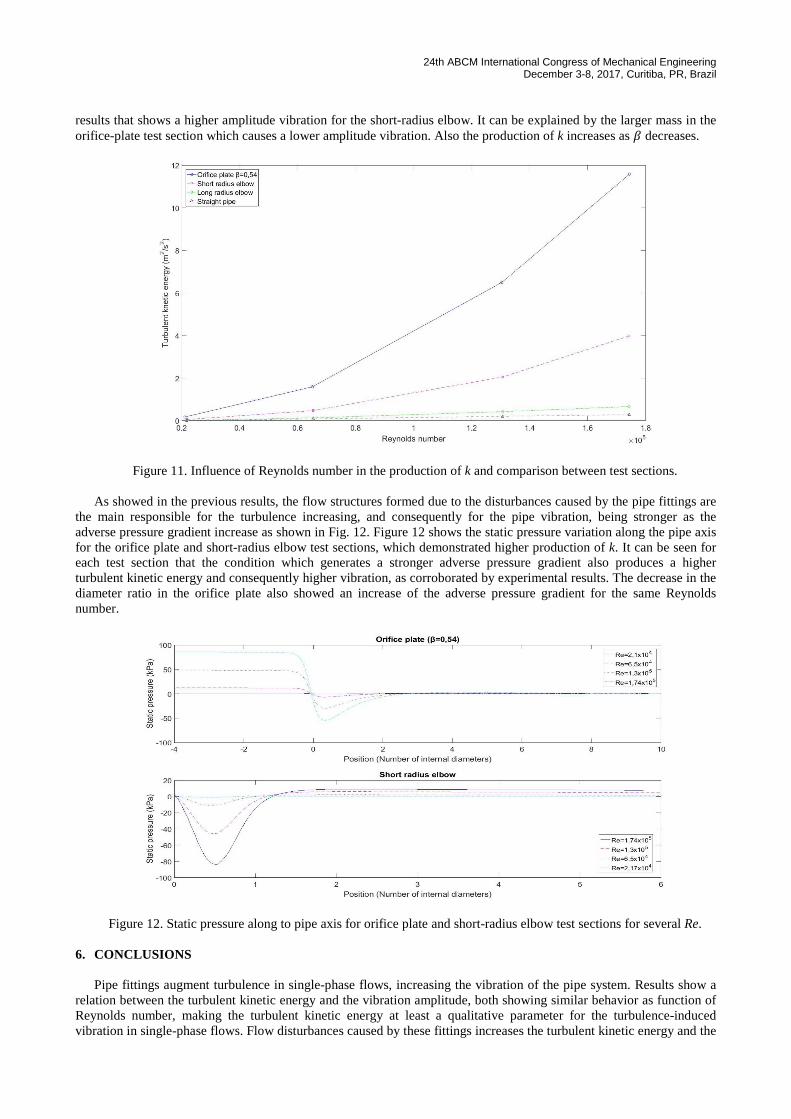
Figure 11 shows the influence of the Reynolds number in the production of turbulent kinetic energy for each fitting. It can be observed that the production of k is affected by the Reynolds number and in agreement with the experimental results, orifice plate and short radius elbow are specially affected by Re. The numerical results showed a higher turbulent kinetic energy in the orifice plate than in the short-radius elbow, showing a discrepancy with the experimental
24th ABCM International Congress of Mechanical Engineering December 3-8, 2017, Curitiba, PR, Brazil
results that shows a higher amplitude vibration for the short-radius elbow. It can be explained by the larger mass in the orifice-plate test section which causes a lower amplitude vibration. Also the production of k increases as 8 decreases.
Figure 11. Influence of Reynolds number in the production of k and comparison between test sections.
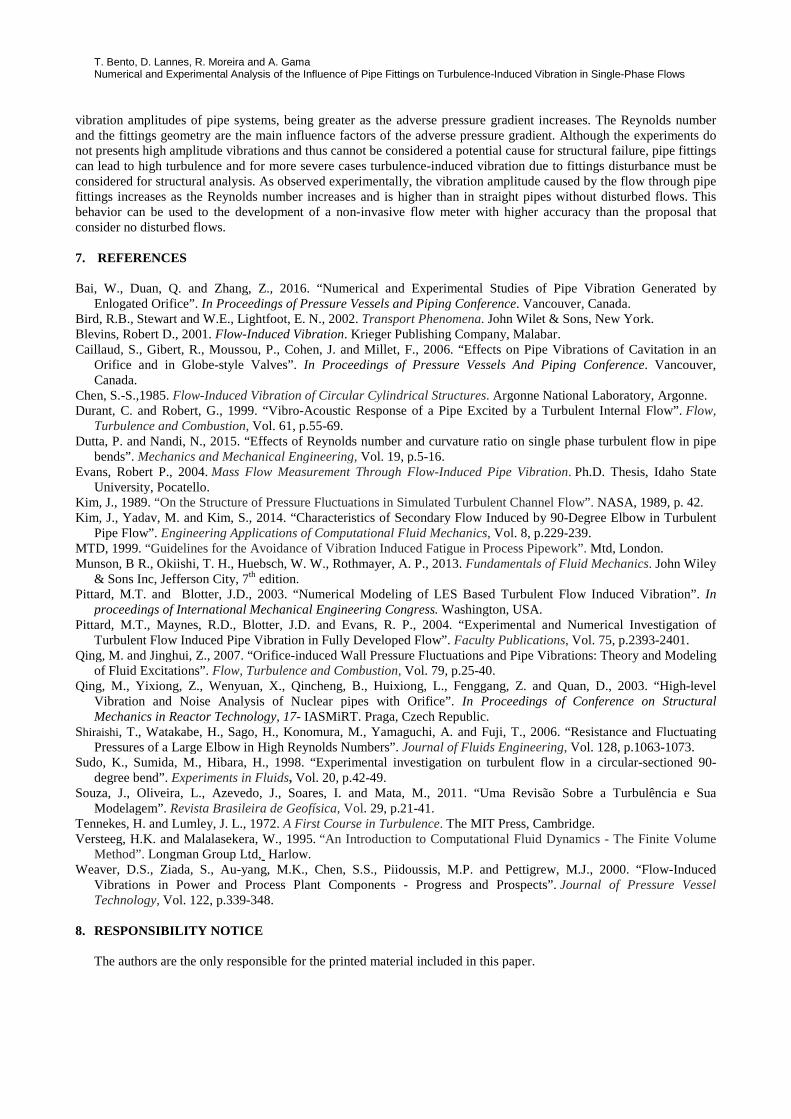
As showed in the previous results, the flow structures formed due to the disturbances caused by the pipe fittings are the main responsible for the turbulence increasing, and consequently for the pipe vibration, being stronger as the adverse pressure gradient increase as shown in Fig. 12. Figure 12 shows the static pressure variation along the pipe axis for the orifice plate and short-radius elbow test sections, which demonstrated higher production of k. It can be seen for each test section that the condition which generates a stronger adverse pressure gradient also produces a higher turbulent kinetic energy and consequently higher vibration, as corroborated by experimental results. The decrease in the diameter ratio in the orifice plate also showed an increase of the adverse pressure gradient for the same Reynolds number.
Figure 12. Static pressure along to pipe axis for orifice plate and short-radius elbow test sections for several Re.
6. CONCLUSIONS
Pipe fittings augment turbulence in single-phase flows, increasing the vibration of the pipe system. Results show a relation between the turbulent kinetic energy and the vibration amplitude, both showing similar behavior as function of Reynolds number, making the turbulent kinetic energy at least a qualitative parameter for the turbulence-induced vibration in single-phase flows. Flow disturbances caused by these fittings increases the turbulent kinetic energy and the
T. Bento, D. Lannes, R. Moreira and A. Gama Numerical and Experimental Analysis of the Influence of Pipe Fittings on Turbulence-Induced Vibration in Single-Phase Flows
vibration amplitudes of pipe systems, being greater as the adverse pressure gradient increases. The Reynolds number and the fittings geometry are the main influence factors of the adverse pressure gradient. Although the experiments do not presents high amplitude vibrations and thus cannot be considered a potential cause for structural failure, pipe fittings can lead to high turbulence and for more severe cases turbulence-induced vibration due to fittings disturbance must be considered for structural analysis. As observed experimentally, the vibration amplitude caused by the flow through pipe fittings increases as the Reynolds number increases and is higher than in straight pipes without disturbed flows. This behavior can be used to the development of a non-invasive flow meter with higher accuracy than the proposal that consider no disturbed flows. 7. REFERENCES
Bai, W., Duan, Q. and Zhang, Z., 2016. “Numerical and Experimental Studies of Pipe Vibration Generated by
Enlogated Orifice”. In Proceedings of Pressure Vessels and Piping Conference. Vancouver, Canada. Bird, R.B., Stewart and W.E., Lightfoot, E. N., 2002. Transport Phenomena. John Wilet & Sons, New York. Blevins, Robert D., 2001. Flow-Induced Vibration. Krieger Publishing Company, Malabar. Caillaud, S., Gibert, R., Moussou, P., Cohen, J. and Millet, F., 2006. “Effects on Pipe Vibrations of Cavitation in an
Orifice and in Globe-style Valves”. In Proceedings of Pressure Vessels And Piping Conference. Vancouver, Canada.
Chen, S.-S.,1985. Flow-Induced Vibration of Circular Cylindrical Structures. Argonne National Laboratory, Argonne. Durant, C. and Robert, G., 1999. “Vibro-Acoustic Response of a Pipe Excited by a Turbulent Internal Flow”. Flow,
Turbulence and Combustion, Vol. 61, p.55-69. Dutta, P. and Nandi, N., 2015. “Effects of Reynolds number and curvature ratio on single phase turbulent flow in pipe
bends”. Mechanics and Mechanical Engineering, Vol. 19, p.5-16. Evans, Robert P., 2004. Mass Flow Measurement Through Flow-Induced Pipe Vibration. Ph.D. Thesis, Idaho State
University, Pocatello. Kim, J., 1989. “On the Structure of Pressure Fluctuations in Simulated Turbulent Channel Flow”. NASA, 1989, p. 42. Kim, J., Yadav, M. and Kim, S., 2014. “Characteristics of Secondary Flow Induced by 90-Degree Elbow in Turbulent
Pipe Flow”. Engineering Applications of Computational Fluid Mechanics, Vol. 8, p.229-239. MTD, 1999. “Guidelines for the Avoidance of Vibration Induced Fatigue in Process Pipework”. Mtd, London. Munson, B R., Okiishi, T. H., Huebsch, W. W., Rothmayer, A. P., 2013. Fundamentals of Fluid Mechanics. John Wiley
& Sons Inc, Jefferson City, 7th edition. Pittard, M.T. and Blotter, J.D., 2003. “Numerical Modeling of LES Based Turbulent Flow Induced Vibration”. In
proceedings of International Mechanical Engineering Congress. Washington, USA. Pittard, M.T., Maynes, R.D., Blotter, J.D. and Evans, R. P., 2004. “Experimental and Numerical Investigation of
Turbulent Flow Induced Pipe Vibration in Fully Developed Flow”. Faculty Publications, Vol. 75, p.2393-2401. Qing, M. and Jinghui, Z., 2007. “Orifice-induced Wall Pressure Fluctuations and Pipe Vibrations: Theory and Modeling
of Fluid Excitations”. Flow, Turbulence and Combustion, Vol. 79, p.25-40. Qing, M., Yixiong, Z., Wenyuan, X., Qincheng, B., Huixiong, L., Fenggang, Z. and Quan, D., 2003. “High-level
Vibration and Noise Analysis of Nuclear pipes with Orifice”. In Proceedings of Conference on Structural Mechanics in Reactor Technology, 17- IASMiRT. Praga, Czech Republic.
Shiraishi, T., Watakabe, H., Sago, H., Konomura, M., Yamaguchi, A. and Fuji, T., 2006. “Resistance and Fluctuating Pressures of a Large Elbow in High Reynolds Numbers”. Journal of Fluids Engineering, Vol. 128, p.1063-1073.
Sudo, K., Sumida, M., Hibara, H., 1998. “Experimental investigation on turbulent flow in a circular-sectioned 90-degree bend”. Experiments in Fluids, Vol. 20, p.42-49.
Souza, J., Oliveira, L., Azevedo, J., Soares, I. and Mata, M., 2011. “Uma Revisão Sobre a Turbulência e Sua Modelagem”. Revista Brasileira de Geofísica, Vol. 29, p.21-41.
Tennekes, H. and Lumley, J. L., 1972. A First Course in Turbulence. The MIT Press, Cambridge. Versteeg, H.K. and Malalasekera, W., 1995. “An Introduction to Computational Fluid Dynamics - The Finite Volume
Method”. Longman Group Ltd, Harlow. Weaver, D.S., Ziada, S., Au-yang, M.K., Chen, S.S., Piidoussis, M.P. and Pettigrew, M.J., 2000. “Flow-Induced
Vibrations in Power and Process Plant Components - Progress and Prospects”. Journal of Pressure Vessel Technology, Vol. 122, p.339-348.
8. RESPONSIBILITY NOTICE The authors are the only responsible for the printed material included in this paper.