Numerical correction for secondary fluorescence across phase boundaries in EPMA J A Escuder 1 , F Salvat 1 , X Llovet 2,4 and J J Donovan 3 1 Universitat de Barcelona, Facultat de Física (ECM), Diagonal 647, ES-08028 Barcelona, Spain 2 Universitat de Barcelona, Serveis Científico-Tècnics, Lluís Solé i Sabarís 1-3, ES-08028 Barcelona, Spain 3 University of Oregon, CAMCOR, Department of Chemistry, US-97403 Eugene, Oregon, U.S.A. E-mail: [email protected]Abstract. A fast calculation method to compute secondary fluorescence near phase boundaries in electron probe microanalysis is described. Secondary fluorescence intensities are calculated by numerically integrating the equations that describe the emission of fluorescence by photoelectric absorption of primary X-rays (characteristic and bremsstrahlung) from a couple of two semi-infinite, adjacent materials, when the electron beam impacts on one of them. The reliability of the developed calculation is assessed by comparing calculated fluorescence k-ratios, as functions of the distance of the electron beam to the interface, with experimental data available in the literature and with the results of Monte Carlo simulation using code PENELOPE. 1. Introduction Conventional matrix-correction algorithms of electron probe microanalysis (EPMA) assume that the sample volume from which X-rays are generated has homogeneous composition. While this volume is of the order of several cubic micrometers for primary X-rays generated by electron impact, it can be one-to-two order of magnitude greater for X-rays generated by photoelectric absorption of primary X-rays, which are usually referred to as secondary fluorescent (SF) X-rays. This means that even for electron beams impacting quite a distance away from a phase boundary, there can be a SF contribution across the phase boundary arising from a non-excited phase. This contribution, which depends on the impact distance of the electron beam to the boundary and on the composition of the two adjacent phases, is generally small and it can be disregarded (as it is implicitly done when assuming that the volume that fluoresces is homogeneous). However, in certain situations, the contribution of SF across phase boundaries may become significant and should be taken into consideration carefully. One such situation is the analysis for a trace element when the neighbouring phase contains the element of interest [1]. Several methods have been proposed to correct for SF effects near phase boundaries. Bastin et al. [2] developed a numerical method to correct for this effect in metal couples. Myklebust and Newbury 4 To whom any correspondence should be addressed. 11th European Workshop on Modern Developments and Applications in Microbeam Analysis IOP Publishing IOP Conf. Series: Materials Science and Engineering 7 (2010) 012008 doi:10.1088/1757-899X/7/1/012008 c 2010 IOP Publishing Ltd 1
Transcript
Numerical correction for secondary fluorescence across phase boundaries in EPMA
J A Escuder1, F Salvat1, X Llovet2,4 and J J Donovan3 1 Universitat de Barcelona, Facultat de Física (ECM), Diagonal 647, ES-08028 Barcelona, Spain 2 Universitat de Barcelona, Serveis Científico-Tècnics, Lluís Solé i Sabarís 1-3, ES-08028 Barcelona, Spain 3 University of Oregon, CAMCOR, Department of Chemistry, US-97403 Eugene, Oregon, U.S.A.
Abstract. A fast calculation method to compute secondary fluorescence near phase boundaries in electron probe microanalysis is described. Secondary fluorescence intensities are calculated by numerically integrating the equations that describe the emission of fluorescence by photoelectric absorption of primary X-rays (characteristic and bremsstrahlung) from a couple of two semi-infinite, adjacent materials, when the electron beam impacts on one of them. The reliability of the developed calculation is assessed by comparing calculated fluorescence k-ratios, as functions of the distance of the electron beam to the interface, with experimental data available in the literature and with the results of Monte Carlo simulation using code PENELOPE.
1. Introduction Conventional matrix-correction algorithms of electron probe microanalysis (EPMA) assume that the sample volume from which X-rays are generated has homogeneous composition. While this volume is of the order of several cubic micrometers for primary X-rays generated by electron impact, it can be one-to-two order of magnitude greater for X-rays generated by photoelectric absorption of primary X-rays, which are usually referred to as secondary fluorescent (SF) X-rays. This means that even for electron beams impacting quite a distance away from a phase boundary, there can be a SF contribution across the phase boundary arising from a non-excited phase. This contribution, which depends on the impact distance of the electron beam to the boundary and on the composition of the two adjacent phases, is generally small and it can be disregarded (as it is implicitly done when assuming that the volume that fluoresces is homogeneous). However, in certain situations, the contribution of SF across phase boundaries may become significant and should be taken into consideration carefully. One such situation is the analysis for a trace element when the neighbouring phase contains the element of interest [1].
Several methods have been proposed to correct for SF effects near phase boundaries. Bastin et al. [2] developed a numerical method to correct for this effect in metal couples. Myklebust and Newbury 4 To whom any correspondence should be addressed.
11th European Workshop on Modern Developments and Applications in Microbeam Analysis IOP PublishingIOP Conf. Series: Materials Science and Engineering 7 (2010) 012008 doi:10.1088/1757-899X/7/1/012008
[3] used the Monte Carlo (MC) simulation of electron transport to predict SF induced at phase boundaries in metal couples. In these methods, SF induced by bremsstrahlung was approximated by very crude methods or even neglected. Llovet and Galán [5] used the general-purpose MC code PENELOPE [4] to correct for SF in mineral couples. Because both the electron and photon transport was considered, the contribution of SF from characteristic X-rays as well as that from bremsstrahlung photons was included in a natural way. PENELOPE was also used by Fournelle et al. [6] to study the dependence of SF on sample orientation. Although the use of MC simulation results has proven to be useful to correct for SF near phase boundaries, it is not suitable for on-line EPMA algorithms as it requires relatively large computing times.
In this study, we describe a fast calculation method to compute SF effects across phase boundaries. SF intensities are calculated numerically by integrating the equations that describe the emission of X-ray fluorescence by photoelectric absorption of primary X-rays (characteristic and bremsstrahlung) from a couple of two semi-infinite, adjacent materials, when the electron beam impacts on one of them. We assume that primary X-rays are emitted from a point source located at the surface of the irradiated material and that the boundary is planar and perpendicular to the surface. The reliability of the developed calculation is assessed by comparing calculated SF k-ratios (also referred to as “apparent” k-ratios), as functions of the distance of the electron beam to the interface, with experimental data from clean experiments available in the literature and with the results of MC simulation obtained using PENELOPE.
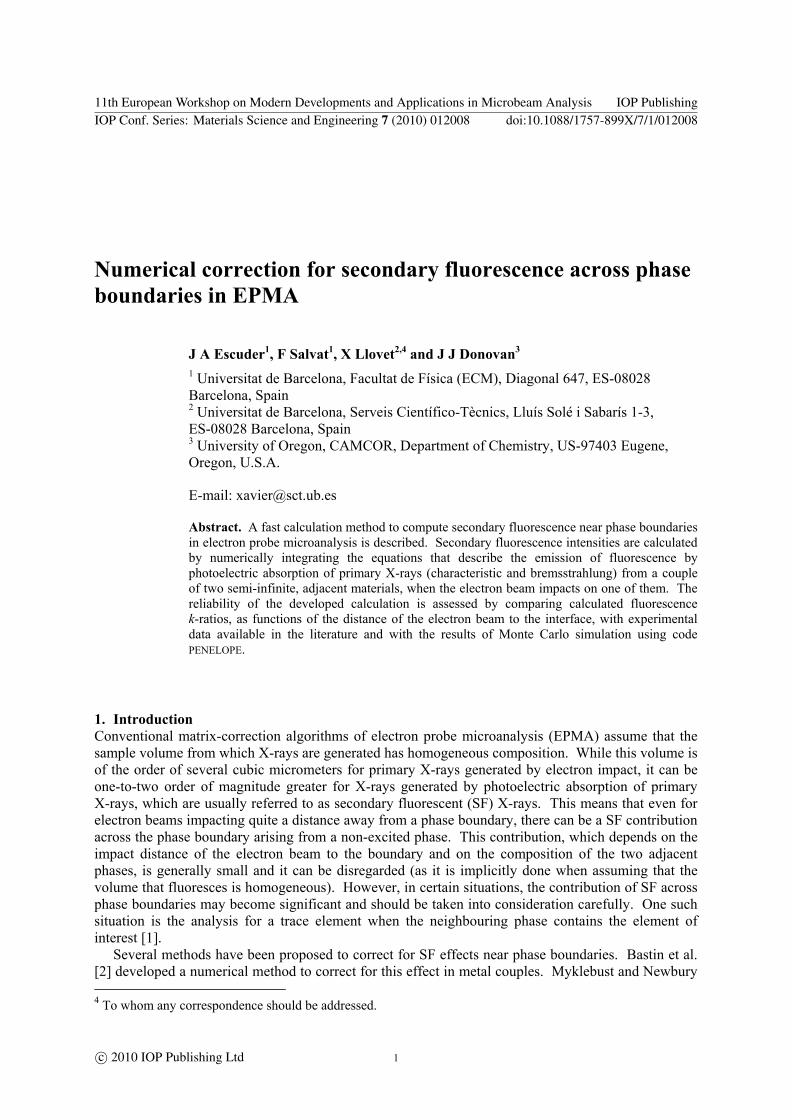
2. Theoretical description Let us consider a sample consisting of two different materials, 1 and 2, separated by a plane boundary perpendicular to the sample surface. A focussed, monoenergetic electron beam of energy E0 impinges normally on the surface of the sample, at the side of the material 1 and at a distance d from the interface (see figure 1).
Figure 1. Schematic picture that represents two materials 1 and 2. The electron beam is focused on the surface of 1 at point O. The distance between O and the boundary is d.
The total SF intensity emitted by the atomic shell j from material 2 is the sum of the characteristic and bremsstrahlung contributions,
. (1)
In the following sections, we derive the equations that describe these two contributions.
11th European Workshop on Modern Developments and Applications in Microbeam Analysis IOP PublishingIOP Conf. Series: Materials Science and Engineering 7 (2010) 012008 doi:10.1088/1757-899X/7/1/012008
2
2.1. Characteristic fluorescence The number of characteristic X-rays emitted with directions in the solid angle element dΩ from material 1 is given by (isotropic emission is assumed) , (2) where ωi1 is the fluorescence yield of the shell, Ni1 is the average number ionisations in the atomic-electron shell “i” by each incident electron, i.e., , (3) where Ei1 is the shell-ionisation energy, σi1(E) is the shell-ionisation cross-section for electrons of energy E, S1(E) = −dE/ds is the electron stopping power and N is the number of atoms per unit volume, i.e. , (4) where NA is Avogadro’s number, ρ is the mass density of the material (in gr/cm3) and Aw is the molar mass (g/mol) of the element.
For simplicity, we assume that all X-rays are emitted at zero depth. This assumption is justified as long as the effective range of electrons is much less than the mean free path of characteristic X-rays, which is usually the case. Hence, the intensity of primary characteristic X-rays (number of photons per incident electron and per unit solid angle) reaching a detector, in the direction (θd, ϕd) is . (5)
Some of the characteristic photons from material 1 will cross the interface, be absorbed in material 2 and produce fluorescence. Let P be a generic point in material 2, with polar coordinates (s, θ, ϕ). In their path from the generation site O to the point P, the intensity of characteristic X-rays is reduced by the attenuation factor where s1 and s2 are the lengths of segments of the straight trajectory from O to P in materials 1 and 2, respectively, and μ11 and μ12 are the attenuation coefficients of the characteristic X-rays of material 1 in materials 1 and 2, respectively. Evidently, and . (6) Hence, (7)
Each characteristic photon absorbed at P produces a fluorescence X-ray j with probability (8) where σT2 is the total cross-section for photon absorption in material 2 and σj2 is the partial photoelectric cross-section of the active atomic electron shell. The fluorescence photons are emitted isotropically; those that reach the detector are attenuated along their path before leaving the target.
11th European Workshop on Modern Developments and Applications in Microbeam Analysis IOP PublishingIOP Conf. Series: Materials Science and Engineering 7 (2010) 012008 doi:10.1088/1757-899X/7/1/012008
3
We assume that the whole path from the emission site P to the detector is contained within material 2, i.e., that the detector is “on the 2 side” of the sample. Under these circumstances, the path length of fluorescence photons in material 2 is (9) and the corresponding attenuation factor is . (10)
The intensity of fluorescence X-rays (number of photons per incident electron and per unit solid angle) reaching the detector is . (11) That is, (12) with (13) The integration over s can be performed analytically and yields (14) where . (15)
2.2. Bremsstrahlung fluorescence The case of fluorescence caused by bremsstrahlung photons can be treated in a similar way. As before, we assume that all bremsstrahlung photons are emitted from the surface (z = 0). We also assume that the energy spectrum of bremsstrahlung photons can be approximated by using the Kramers’ formula [7], i.e., . (16) where K is an empirical parameter and Z is the atomic number of the material. In Eq. (16) dIBr/dE is the number of continuum photons per unit photon energy E and per incident electron, assuming that the electron slows down to rest within the target (i.e., there is no backscattering).
11th European Workshop on Modern Developments and Applications in Microbeam Analysis IOP PublishingIOP Conf. Series: Materials Science and Engineering 7 (2010) 012008 doi:10.1088/1757-899X/7/1/012008
4
The intensity of bremsstrahlung fluorescence emitted by atomic shell j from material 2, in the direction of the detector is given by , (17) where C12(E) and F12,ij are given by Eqs. (13) and (15), respectively, and Z2 is the atomic number of material 2.
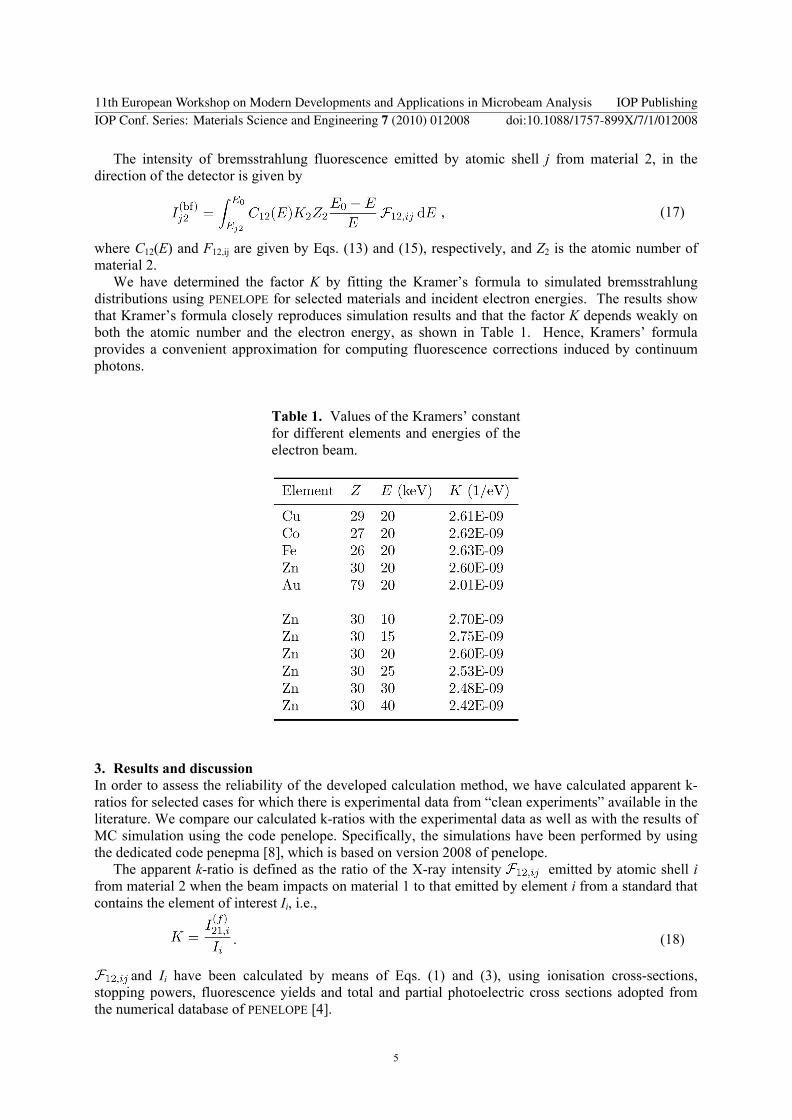
We have determined the factor K by fitting the Kramer’s formula to simulated bremsstrahlung distributions using PENELOPE for selected materials and incident electron energies. The results show that Kramer’s formula closely reproduces simulation results and that the factor K depends weakly on both the atomic number and the electron energy, as shown in Table 1. Hence, Kramers’ formula provides a convenient approximation for computing fluorescence corrections induced by continuum photons.
Table 1. Values of the Kramers’ constant for different elements and energies of the electron beam.
3. Results and discussion In order to assess the reliability of the developed calculation method, we have calculated apparent k-ratios for selected cases for which there is experimental data from “clean experiments” available in the literature. We compare our calculated k-ratios with the experimental data as well as with the results of MC simulation using the code penelope. Specifically, the simulations have been performed by using the dedicated code penepma [8], which is based on version 2008 of penelope.
The apparent k-ratio is defined as the ratio of the X-ray intensity emitted by atomic shell i from material 2 when the beam impacts on material 1 to that emitted by element i from a standard that contains the element of interest Ii, i.e., . (18) and Ii have been calculated by means of Eqs. (1) and (3), using ionisation cross-sections, stopping powers, fluorescence yields and total and partial photoelectric cross sections adopted from the numerical database of PENELOPE [4].
11th European Workshop on Modern Developments and Applications in Microbeam Analysis IOP PublishingIOP Conf. Series: Materials Science and Engineering 7 (2010) 012008 doi:10.1088/1757-899X/7/1/012008
5
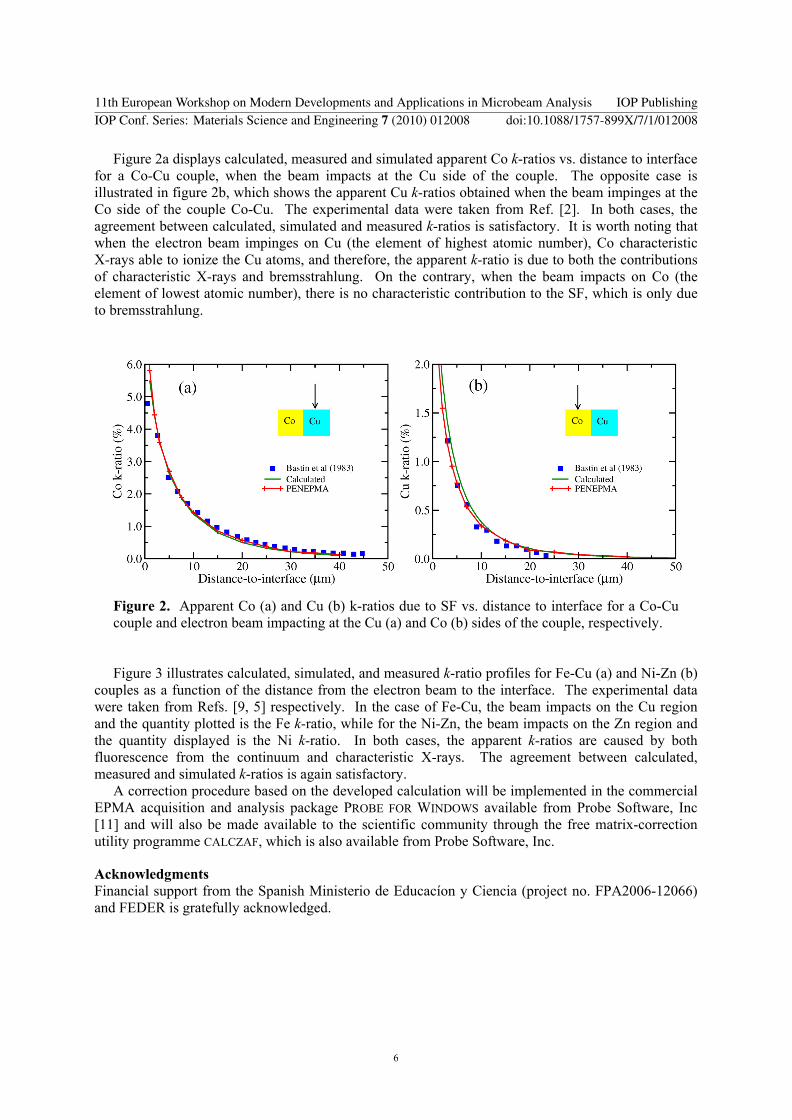
Figure 2a displays calculated, measured and simulated apparent Co k-ratios vs. distance to interface for a Co-Cu couple, when the beam impacts at the Cu side of the couple. The opposite case is illustrated in figure 2b, which shows the apparent Cu k-ratios obtained when the beam impinges at the Co side of the couple Co-Cu. The experimental data were taken from Ref. [2]. In both cases, the agreement between calculated, simulated and measured k-ratios is satisfactory. It is worth noting that when the electron beam impinges on Cu (the element of highest atomic number), Co characteristic X-rays able to ionize the Cu atoms, and therefore, the apparent k-ratio is due to both the contributions of characteristic X-rays and bremsstrahlung. On the contrary, when the beam impacts on Co (the element of lowest atomic number), there is no characteristic contribution to the SF, which is only due to bremsstrahlung.
Figure 2. Apparent Co (a) and Cu (b) k-ratios due to SF vs. distance to interface for a Co-Cu couple and electron beam impacting at the Cu (a) and Co (b) sides of the couple, respectively.
Figure 3 illustrates calculated, simulated, and measured k-ratio profiles for Fe-Cu (a) and Ni-Zn (b) couples as a function of the distance from the electron beam to the interface. The experimental data were taken from Refs. [9, 5] respectively. In the case of Fe-Cu, the beam impacts on the Cu region and the quantity plotted is the Fe k-ratio, while for the Ni-Zn, the beam impacts on the Zn region and the quantity displayed is the Ni k-ratio. In both cases, the apparent k-ratios are caused by both fluorescence from the continuum and characteristic X-rays. The agreement between calculated, measured and simulated k-ratios is again satisfactory.
A correction procedure based on the developed calculation will be implemented in the commercial EPMA acquisition and analysis package PROBE FOR WINDOWS available from Probe Software, Inc [11] and will also be made available to the scientific community through the free matrix-correction utility programme CALCZAF, which is also available from Probe Software, Inc.
Acknowledgments Financial support from the Spanish Ministerio de Educacíon y Ciencia (project no. FPA2006-12066) and FEDER is gratefully acknowledged.
11th European Workshop on Modern Developments and Applications in Microbeam Analysis IOP PublishingIOP Conf. Series: Materials Science and Engineering 7 (2010) 012008 doi:10.1088/1757-899X/7/1/012008
6
Figure 3. (a) Apparent Fe k-ratio in Cu due to SF versus distance to interface for a Fe-Cu couple and electron beam impacting at the Cu side of the couple. (b) Apparent Ni k-ratio in Zn due to SF vs. distance to interface for a Ni-Zn couple and electron beam impacting at the Zn side of the couple.
References [1] Reed S J B 1993 Electron microprobe analysis (Cambridge University Press, Cambridge) [2] Bastin G F, van Loo F J, Vosters P J and Vroljik J W 1983 Scanning 5 172 [3] Myklebust R L and Newbury D E 1994 Scanning 17 235 [4] Salvat F, Fernáandez-Varea J F and Sempau J 2008 PENELOPE-2008: A code system for
Monte Carlo simulation of electron and photon transport (OECD/NEA Data Bank, Issy-les-Moulineaux, France)
[5] Llovet X and Gal´an G 2003 Am. Mineral. 88 121 [6] Fournelle J H, Kim S and Perepezko J H 2005 Surf. Int. Anal. 37 1012 [7] Kramers H A 1923 Phil. Mag. 46 836 [8] Llovet X and Salvat F 2008, unpublished [9] Arnould O and Hild F 2002 Microchim. Acta 139 3 [10] Valovirta E, Erlach S, Llovet X and Heikinheimo E 2001 Proc. of EMAS 2001 Workshop p.
382. [11] Probe Software Inc. http://www.probesoftware.com/Technical.htm
11th European Workshop on Modern Developments and Applications in Microbeam Analysis IOP PublishingIOP Conf. Series: Materials Science and Engineering 7 (2010) 012008 doi:10.1088/1757-899X/7/1/012008