Numerical Differentiation and Integration Tutorial INTRODUCTION Numerical integration and differentiation are useful techniques for manipulating data collected from experimental tests. For example, often an object’s displacement and acceleration are measured with respect to time, using an LVDT and accelerometer, respectively. It may be useful to differentiate the LVDT data to obtain velocity and acceleration. Likewise, it may be useful to integrate the accelerometer data to achieve velocity and displacement. This document explains the basics of numerical differentiation and integration and applies these techniques to a simple data set. Also, some common problems that may arise due to imperfect data are discussed. BASIC NUMERICAL DIFFERENTIATION AND INTEGRATION There are multiple different methods which can be used for both numerical differentiation and integration. Differentiation Numerical differentiation serves to determine the local slope of the data, dy/dx. Fig. 1 shows a sample data set consisting of 7 data points, and shows how the individual points will be referenced. Fig. 1. Reference labels for data points when performing numerical differentiation and integration. In order to find the first derivative of a data set, one of three methods can be used: first forward differentiation, first backward differentiation, and first central difference. In first forward differentiation, a point is chosen as a reference (the “i” point), and this point and the next one are used to determine the local slope. This method can be performed at the beginning of a data set, using the first two data points. The equation used is i 1 i i 1 i x x y y x y slope − − = ∆ ∆ = + + . (1) Numerical Integration and Differentiation Tutorial Rev 011405 1
Transcript
Numerical Differentiation and Integration Tutorial INTRODUCTION
Numerical integration and differentiation are useful techniques for manipulating data collected from experimental tests. For example, often an object’s displacement and acceleration are measured with respect to time, using an LVDT and accelerometer, respectively. It may be useful to differentiate the LVDT data to obtain velocity and acceleration. Likewise, it may be useful to integrate the accelerometer data to achieve velocity and displacement. This document explains the basics of numerical differentiation and integration and applies these techniques to a simple data set. Also, some common problems that may arise due to imperfect data are discussed.
BASIC NUMERICAL DIFFERENTIATION AND INTEGRATION
There are multiple different methods which can be used for both numerical differentiation
and integration. Differentiation Numerical differentiation serves to determine the local slope of the data, dy/dx. Fig. 1 shows
a sample data set consisting of 7 data points, and shows how the individual points will be referenced.
Fig. 1. Reference labels for data points when performing numerical differentiation and integration.
In order to find the first derivative of a data set, one of three methods can be used: first forward differentiation, first backward differentiation, and first central difference.
In first forward differentiation, a point is chosen as a reference (the “i” point), and this point and the next one are used to determine the local slope. This method can be performed at the beginning of a data set, using the first two data points. The equation used is
i1i
i1ixxyy
xyslope
−−
=∆∆
=+
+ . (1)
Numerical Integration and Differentiation Tutorial
Rev 0114051
First backward differentiation is similar, except that the reference point and the one previous to it are used. Therefore, this method can be performed at the end of a data set, using the last two points. The slope is found using
1ii
1iixxyy
xyslope
−
−
−−
=∆∆
= . (2)
The first central difference method finds the average slope over three data points, using
1i1i
1i1ixxyy
xyslope
−+
−+
−−
=∆∆
= . (3)
First central difference is the most accurate of these three methods. Integration Two methods for numerical integration will be discussed here, the rectangular rule and the
trapezoidal rule. The basic principle of the rectangular rule is shown in Fig. 2.
Fig. 2. Numerical integration using the rectangular rule.
The equation used to determine the integral using the rectangular rule is ( )i1ii1ii xxyII −+= +− . (4) The trapezoidal rule, illustrated in Fig. 3, is clearly more accurate than the rectangular rule
and is therefore preferred.
Fig. 3. Numerical integration using the trapezoidal rule.
The equation used to find the integral using the trapezoidal rule is
( i1ii1i
1ii xx2
yyII −+
+= ++
− ) . (5)
Numerical Integration and Differentiation Tutorial
Rev 0114052
Note that, even for the first point of the data set, an “i – 1” term is required. This is the initial
condition for the integration. This requirement is one reason for acquiring both displacement and acceleration data for a given test. The displacement data can be differentiated to determine velocity, since differentiation requires no initial condition. This velocity, along with the measured displacement, can provide the initial conditions needed to numerically integrate the acceleration data.
Example: A Free-Falling Body A free-falling body will be used as an example to demonstrate the principles of numerical
differentiation and integration. Consider a free falling body dropped from an unknown height and acted on by gravity alone.
The object is known to fall for 12 seconds and begin free-fall with time, velocity and displacement equal to zero.
In Excel (or another spreadsheet program), generate the time and acceleration data for the falling body. Input the time data in column 1 in 1-second intervals for a total of 12 seconds. The acceleration due to gravity is constant, so input an acceleration of 32.2 ft/sec2 in each row of column 2. The body starts at rest, and we will consider the initial location to be the reference point. The data should resemble that shown in Table 1. From this data, the velocity and displacement of the body will be determined.
Table 1: Time and acceleration data for a free-falling body.
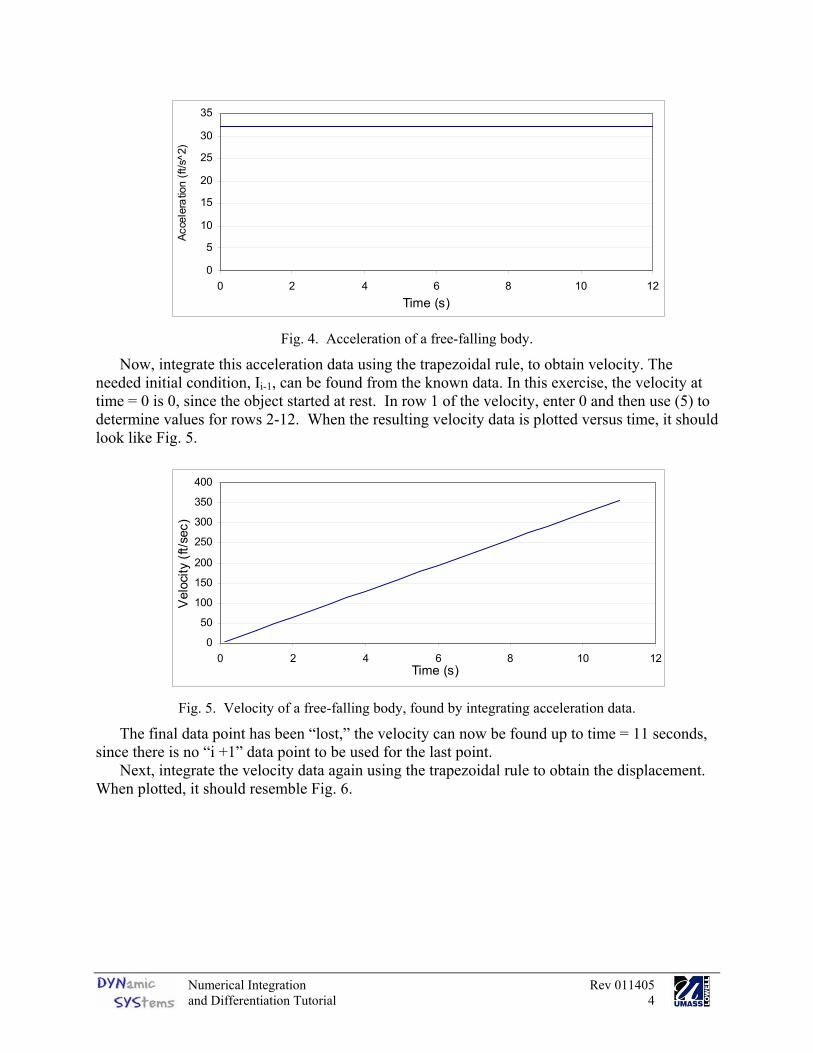
A plot of the acceleration of the free-falling body is shown in Fig. 4. As the acceleration is
constant, it is simply a horizontal line.
Numerical Integration and Differentiation Tutorial
Rev 0114053
0
5
10
15
20
25
30
35
0 2 4 6 8 10Time (s)
Acce
lera
tion
(ft/s
^2)
12
Fig. 4. Acceleration of a free-falling body.
Now, integrate this acceleration data using the trapezoidal rule, to obtain velocity. The needed initial condition, Ii-1, can be found from the known data. In this exercise, the velocity at time = 0 is 0, since the object started at rest. In row 1 of the velocity, enter 0 and then use (5) to determine values for rows 2-12. When the resulting velocity data is plotted versus time, it should look like Fig. 5.
0
50
100
150
200
250
300
350
400
0 2 4 6 8 10Time (s)
Vel
ocity
(ft/s
ec)
12
Fig. 5. Velocity of a free-falling body, found by integrating acceleration data.
The final data point has been “lost,” the velocity can now be found up to time = 11 seconds, since there is no “i +1” data point to be used for the last point.
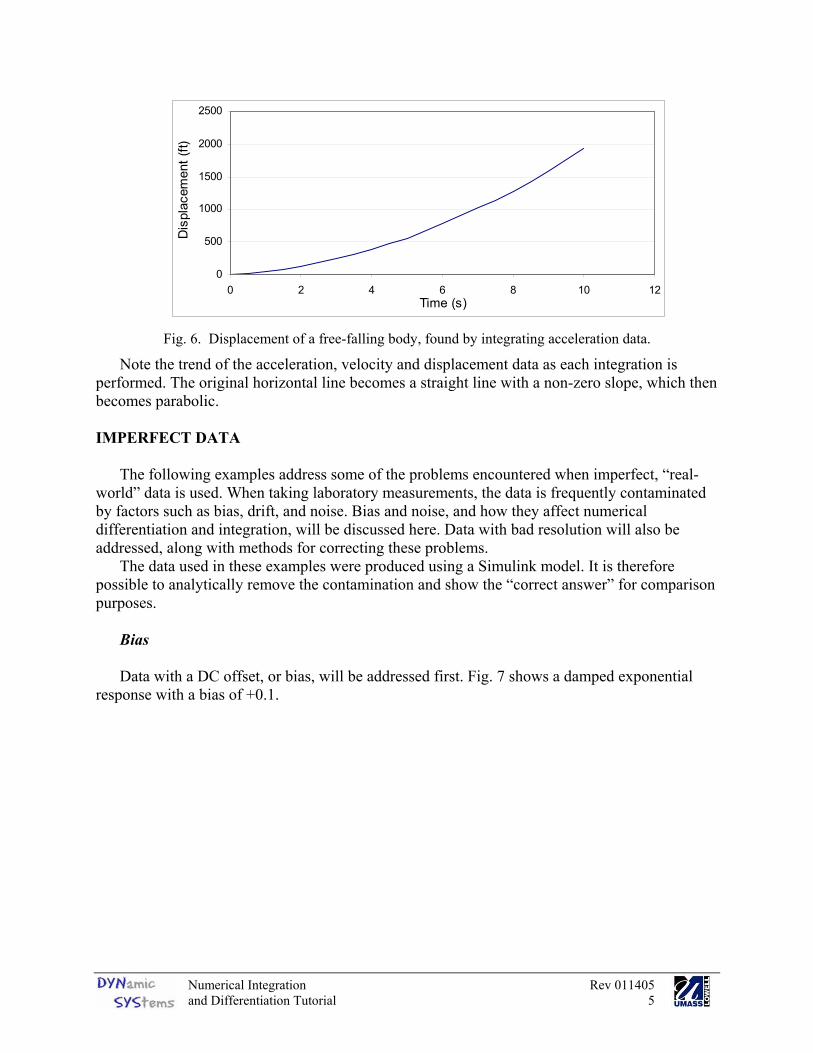
Next, integrate the velocity data again using the trapezoidal rule to obtain the displacement. When plotted, it should resemble Fig. 6.
Numerical Integration and Differentiation Tutorial
Rev 0114054
0
500
1000
1500
2000
2500
0 2 4 6 8 10Time (s)
Dis
plac
emen
t (ft)
12
Fig. 6. Displacement of a free-falling body, found by integrating acceleration data.
Note the trend of the acceleration, velocity and displacement data as each integration is performed. The original horizontal line becomes a straight line with a non-zero slope, which then becomes parabolic.
IMPERFECT DATA
The following examples address some of the problems encountered when imperfect, “real-world” data is used. When taking laboratory measurements, the data is frequently contaminated by factors such as bias, drift, and noise. Bias and noise, and how they affect numerical differentiation and integration, will be discussed here. Data with bad resolution will also be addressed, along with methods for correcting these problems.
The data used in these examples were produced using a Simulink model. It is therefore possible to analytically remove the contamination and show the “correct answer” for comparison purposes.
Bias Data with a DC offset, or bias, will be addressed first. Fig. 7 shows a damped exponential
response with a bias of +0.1.
Numerical Integration and Differentiation Tutorial
Rev 0114055
-5.0
-4.0
-3.0
-2.0
-1.0
0.0
1.0
2.0
3.0
4.0
0.0 0.5 1.0 1.5 2.0 2.5 3.0
Time (s)
Acce
lera
tion
(m/s
ec^2
)
Fig. 7. Data with bias.
This is acceleration data, and it will therefore be integrated twice to find displacement. Fig. 8 shows the result of these integrations.
-0.10
0.00
0.10
0.20
0.30
0.40
0.50
0.0 0.5 1.0 1.5 2.0 2.5 3.0
Time (s)
Dis
plac
emen
t (m
)
Displacement found byintegratingActual displacement
Fig. 8. Integrating data with bias.
Clearly, the result is entirely overwhelmed by what has become a parabolic drift. However by zooming in on the plot, as shown in Fig. 9, it can be seen that the damped exponential form is still present.
Numerical Integration and Differentiation Tutorial
Rev 0114056
-0.010
-0.005
0.000
0.005
0.010
0.015
0.020
0.025
0.030
0.0 0.1 0.2 0.3 0.4 0.5 0.6 0.7 0.8 0.9 1.0
Time (s)
Dis
plac
emen
t (m
)Displacement found byintegratingActual displacement
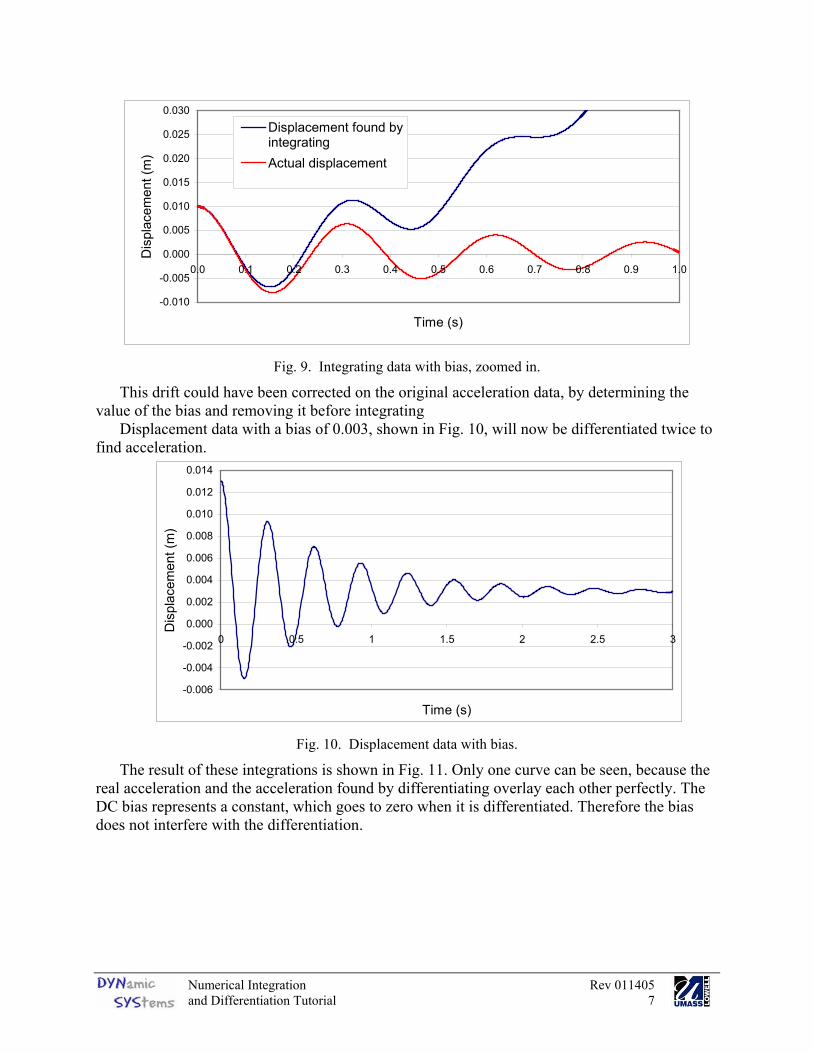
Fig. 9. Integrating data with bias, zoomed in.
This drift could have been corrected on the original acceleration data, by determining the value of the bias and removing it before integrating
Displacement data with a bias of 0.003, shown in Fig. 10, will now be differentiated twice to find acceleration.
-0.006
-0.004
-0.002
0.000
0.002
0.004
0.006
0.008
0.010
0.012
0.014
0 0.5 1 1.5 2 2.5
Time (s)
Dis
plac
emen
t (m
)
3
Fig. 10. Displacement data with bias.
The result of these integrations is shown in Fig. 11. Only one curve can be seen, because the real acceleration and the acceleration found by differentiating overlay each other perfectly. The DC bias represents a constant, which goes to zero when it is differentiated. Therefore the bias does not interfere with the differentiation.
Numerical Integration and Differentiation Tutorial
Rev 0114057
-3
-2
-1
0
1
2
3
4
0 1 1 2 2 3
Time (s)
Acc
eler
atio
n (m
/sec
^2)
3
Acceleration found bydifferentiating
Real acceleration
Fig. 11. Differentiating with bias
Noise The following two examples demonstrate the differing effects of noise on numerical
differentiation and integration. Fig. 12 shows displacement data which are contaminated by high-frequency sinusoidal noise.
-0.01
-0.008
-0.006
-0.004
-0.002
0
0.002
0.004
0.006
0.008
0.01
0.012
0 0.5 1 1.5 2 2.5
Time (s)
Dis
plac
emen
t (m
)
3
Fig. 12. Displacement data with sinusoidal noise.
This displacement data will now be differentiated twice to find acceleration. The resulting plot is shown in Fig. 13.
Numerical Integration and Differentiation Tutorial
Rev 0114058
-12
-7
-2
3
8
0 0.5 1 1.5 2 2.5 3
Time (s)
Acc
eler
atio
n (m
/sec
^2)
Acceleration found by differentiating Actual acceleration
Fig. 13. Differentiating with noise
This displacement data are clearly useless—the high frequency noise has been greatly amplified and now dominates the response. Consider why the derivative of the high-frequency signal has been so greatly amplified compared to that of the low-frequency damped sine wave.
Integration of noisy data will now be considered. Fig. 14 shows acceleration data with white noise.
-5.00
-4.00
-3.00
-2.00
-1.00
0.00
1.00
2.00
3.00
4.00
0 0.5 1 1.5 2 2.5 3
Time (s)
Acc
eler
atio
n (m
/sec
^2)
Fig. 14. Acceleration data with noise
This acceleration data will now be integrated twice to find displacement. The result is shown in Fig. 15.
Numerical Integration and Differentiation Tutorial
Rev 0114059
-0.01
-0.01
-0.01
0.00
0.00
0.00
0.00
0.00
0.01
0.01
0.01
0 0.5 1 1.5 2 2.5
Time (s)
Dis
plac
emen
t (m
)
3
Displacement found by integratingActual displacement
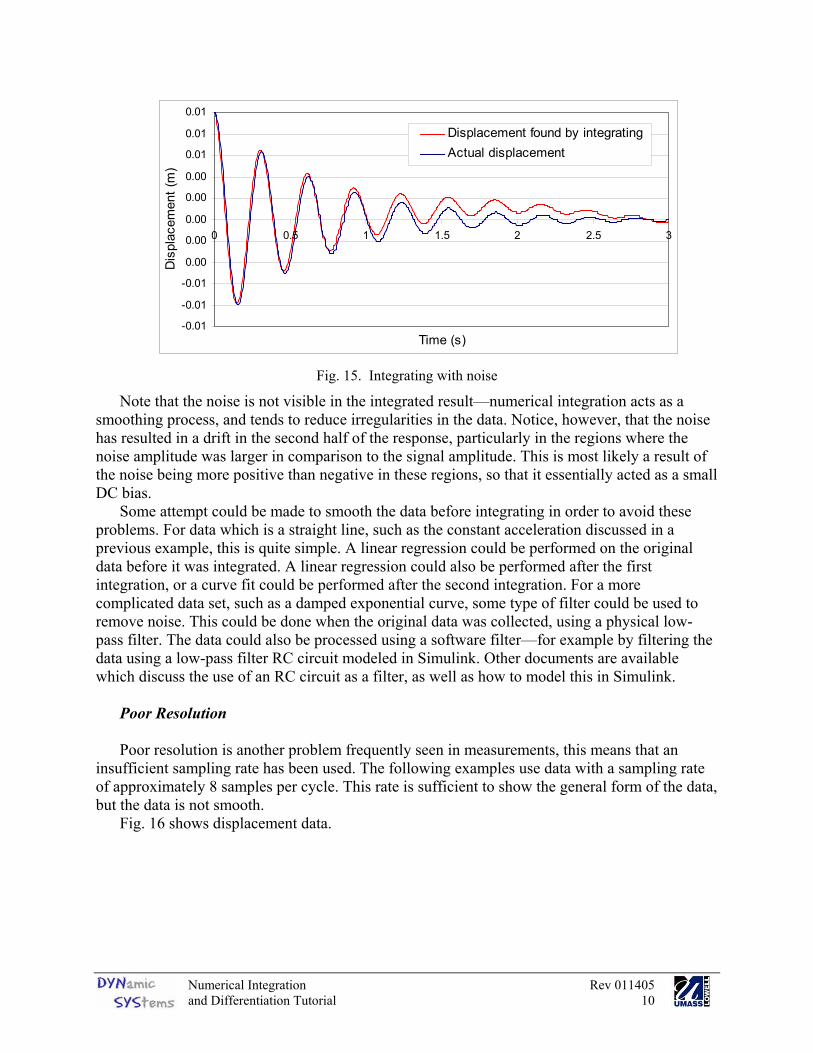
Fig. 15. Integrating with noise
Note that the noise is not visible in the integrated result—numerical integration acts as a smoothing process, and tends to reduce irregularities in the data. Notice, however, that the noise has resulted in a drift in the second half of the response, particularly in the regions where the noise amplitude was larger in comparison to the signal amplitude. This is most likely a result of the noise being more positive than negative in these regions, so that it essentially acted as a small DC bias.
Some attempt could be made to smooth the data before integrating in order to avoid these problems. For data which is a straight line, such as the constant acceleration discussed in a previous example, this is quite simple. A linear regression could be performed on the original data before it was integrated. A linear regression could also be performed after the first integration, or a curve fit could be performed after the second integration. For a more complicated data set, such as a damped exponential curve, some type of filter could be used to remove noise. This could be done when the original data was collected, using a physical low-pass filter. The data could also be processed using a software filter—for example by filtering the data using a low-pass filter RC circuit modeled in Simulink. Other documents are available which discuss the use of an RC circuit as a filter, as well as how to model this in Simulink.
Poor Resolution Poor resolution is another problem frequently seen in measurements, this means that an
insufficient sampling rate has been used. The following examples use data with a sampling rate of approximately 8 samples per cycle. This rate is sufficient to show the general form of the data, but the data is not smooth.
Fig. 16 shows displacement data.
Numerical Integration and Differentiation Tutorial
Acceleration found bydifferentiatingActual acceleration
Fig. 17. Differentiating data with bad resolution.
The irregular, rough slope of the original plot resulted in unusable acceleration data when differentiated.
Fig. 18 shows acceleration data with bad resolution.
Numerical Integration and Differentiation Tutorial
Rev 01140511
-5
-4
-3
-2
-1
0
1
2
3
4
0.0 0.2 0.4 0.6 0.8 1.0 1.2 1.4 1.6 1.8 2.0
Time (s)
Acc
eler
atio
n (m
/sec
^2)
Fig. 18. Acceleration data with bad resolution.
The acceleration data was integrated twice, and the result is shown in Fig. 19.
-0.03
0.02
0.07
0.12
0.17
0.22
0.0 0.2 0.4 0.6 0.8 1.0 1.2 1.4 1.6 1.8 2.0
Time (s)
Dis
plac
emen
t (m
)
Displacement found byintegrationActual displacement
Fig. 19. Integrating data with bad resolution.
The drift evident in this data is likely due to the same effect as was seen in Fig. 15—the data were no longer balanced about the x-axis. This led to a bias after the first integration and a drift after the second.
Problems due to data with bad resolution can be avoided by using a greater sampling rate, at least 10-20 times the highest frequency being measured.
Numerical Integration and Differentiation Tutorial