First International Symposium on Marine Propulsors smp’09, Trondheim, Norway, June 2009 Numerical investigation of the interaction between a stern tunnel thruster and two ducted main propellers. Lucia Sileo, Sverre Steen Department of Marine Technology, Norwegian University of Science and Technology (NTNU), Trondheim, Norway ABSTRACT A complex interaction between a stern tunnel thruster and main propellers is reckoned to be responsible for a con- siderable decay of the DP system performance during ma- noeuvring operations, in terms of drop of turning moment with increasing loading on the main propellers. In the present work a RANS method is used to depict the flow field and to investigate the hydrodynamic forces acting on a modified version of an offshore vessel model with two main ducted propellers and a tunnel thruster integrated in the stern skeg. The model was previously investigated in model tests carried out in the large towing tank at the Ma- rine Technology Centre in Trondheim. In this work differ- ent loading conditions for the main propellers and for the tunnel thruster are considered in accordance with the model tests. The commercial solver Fluent is applied to study the viscous turbulent flow around the ship hull. The propellers in the ducts as well as the one in the tunnel are represented by an actuator disk approximation, and appropriate distri- butions of thrust and tangential velocity are imposed on the fan disks. Validation of the numerical results is made by comparison against the experimental data. Results are in good agreement with model tests and the thrust loss effects are well represented by CFD calculations. The final aims are to provide physical understanding of the causes of the loss of turning moment, and to investigate the use of RANS calculations as a tool for propeller-thruster and propeller- hull interaction studies, so that the propeller arrangement and DP system design can be readily optimised with re- spect to manoeuvring efficiency. Keywords Tunnel thruster, propellers interaction, actuator disk, RANS methods. 1 INTRODUCTION Offshore vessels, cruise ships, and ferries are often equipped with bow and stern thrusters to improve their ma- noeuvring performances, especially at zero speed, when passive control devices are ineffective (like rudders when not exposed to a slipstream). A tunnel thruster consists of a propeller mounted inside a tunnel, able to generate the transverse thrust required for manoeuvring and positioning of the vessel. Some technical data and recommendations are available for general design purposes, concerning the length and the cross sectional area of the tunnel, the en- trance design, the inclination of the vessel side (for bow thrusters), the shape and position of protective grids, etc. (Brix, 1993). However the interaction between the tunnel thruster and other control devices, like the main propellers, is not currently taken into account and it is not yet fully understood. Additional knowledge is required in order to improve the design models and the manoeuvring perfor- mance by an optimal placement of the tunnel thruster and a more efficient configuration of the steering system. In 2007 MARINTEK (Norwegian Marine Technology Re- search Institute) carried out an extensive series of model tests on an offshore vessel model as a part of the University Technology Center research by Rolls-Royce Marine. The model had two main ducted propellers and a tunnel thruster integrated in the stern skeg. The model was modified in the stern skeg to allow the variation of the tunnel position in the longitudinal direction up to 2 tunnel propeller diam- eters towards the bow compared to the original position. Tunnel position and loading of main propellers and tunnel thruster were changed during the model tests, at very low vessel speed. It was found that the tunnel position and the vessel speed (for the very low forward speeds considered in the tests) are not substantially affecting the thrust of the tunnel thruster when the main propellers are off, while the influence of the main propellers is significant. A rapid drop of turning moment is observed with increasing loading on the main propellers when they are working in forward di- rection. This suggests a strong interaction between the slip- stream of the tunnel thruster and the main propellers, and in particular an increasing deflection of the jet from the tunnel thruster into the main propeller suction side with increas- ing propeller loading. A detailed investigation of the flow field is therefore required to understand the dynamics of this complex interaction. Reynolds Averaged Navier-Stokes equations (RANSe) methods are specially suited for detailed 3-D investiga- tions of viscous turbulent flows. A RANS solver was used to investigate a bow tunnel thruster in M¨ uller and Abdel-
Transcript
First International Symposium on Marine Propulsorssmp’09, Trondheim, Norway, June 2009
Numerical investigation of the interaction betweena stern tunnel thruster and two ducted main propellers.
Lucia Sileo, Sverre Steen
Department of Marine Technology, Norwegian University of Science and Technology (NTNU), Trondheim, Norway
ABSTRACT
A complex interaction between a stern tunnel thruster andmain propellers is reckoned to be responsible for a con-siderable decay of the DP system performance during ma-noeuvring operations, in terms of drop of turning momentwith increasing loading on the main propellers. In thepresent work a RANS method is used to depict the flowfield and to investigate the hydrodynamic forces acting ona modified version of an offshore vessel model with twomain ducted propellers and a tunnel thruster integrated inthe stern skeg. The model was previously investigated inmodel tests carried out in the large towing tank at the Ma-rine Technology Centre in Trondheim. In this work differ-ent loading conditions for the main propellers and for thetunnel thruster are considered in accordance with the modeltests. The commercial solver Fluent is applied to study theviscous turbulent flow around the ship hull. The propellersin the ducts as well as the one in the tunnel are representedby an actuator disk approximation, and appropriate distri-butions of thrust and tangential velocity are imposed on thefan disks. Validation of the numerical results is made bycomparison against the experimental data. Results are ingood agreement with model tests and the thrust loss effectsare well represented by CFD calculations. The final aimsare to provide physical understanding of the causes of theloss of turning moment, and to investigate the use of RANScalculations as a tool for propeller-thruster and propeller-hull interaction studies, so that the propeller arrangementand DP system design can be readily optimised with re-spect to manoeuvring efficiency.
Offshore vessels, cruise ships, and ferries are oftenequipped with bow and stern thrusters to improve their ma-noeuvring performances, especially at zero speed, whenpassive control devices are ineffective (like rudders whennot exposed to a slipstream). A tunnel thruster consists ofa propeller mounted inside a tunnel, able to generate thetransverse thrust required for manoeuvring and positioning
of the vessel. Some technical data and recommendationsare available for general design purposes, concerning thelength and the cross sectional area of the tunnel, the en-trance design, the inclination of the vessel side (for bowthrusters), the shape and position of protective grids, etc.(Brix, 1993). However the interaction between the tunnelthruster and other control devices, like the main propellers,is not currently taken into account and it is not yet fullyunderstood. Additional knowledge is required in order toimprove the design models and the manoeuvring perfor-mance by an optimal placement of the tunnel thruster anda more efficient configuration of the steering system.
In 2007 MARINTEK (Norwegian Marine Technology Re-search Institute) carried out an extensive series of modeltests on an offshore vessel model as a part of the UniversityTechnology Center research by Rolls-Royce Marine. Themodel had two main ducted propellers and a tunnel thrusterintegrated in the stern skeg. The model was modified in thestern skeg to allow the variation of the tunnel position inthe longitudinal direction up to 2 tunnel propeller diam-eters towards the bow compared to the original position.Tunnel position and loading of main propellers and tunnelthruster were changed during the model tests, at very lowvessel speed. It was found that the tunnel position and thevessel speed (for the very low forward speeds consideredin the tests) are not substantially affecting the thrust of thetunnel thruster when the main propellers are off, while theinfluence of the main propellers is significant. A rapid dropof turning moment is observed with increasing loading onthe main propellers when they are working in forward di-rection. This suggests a strong interaction between the slip-stream of the tunnel thruster and the main propellers, and inparticular an increasing deflection of the jet from the tunnelthruster into the main propeller suction side with increas-ing propeller loading. A detailed investigation of the flowfield is therefore required to understand the dynamics ofthis complex interaction.
Reynolds Averaged Navier-Stokes equations (RANSe)methods are specially suited for detailed 3-D investiga-tions of viscous turbulent flows. A RANS solver was usedto investigate a bow tunnel thruster in Muller and Abdel-
Maksuod (2007), but without any interaction with themain propellers. Complex geometries, three-dimensionalboundary-layers, high pressure gradients and rotationalflows represent very critical conditions for turbulence mod-elling. In the present case, because of the large size of thecomputational domain and the complexity of the problem,using advanced turbulence models like RSM (ReynoldsStress Model), or LES (Large Eddy Simulation) is not re-alistic. The realizable k − ε turbulence model (Shih et al.,1995) is used during the calculations, because it is reckonedto perform well for flows involving rotation, boundary lay-ers under strong adverse pressure gradients, separation andrecirculation, and to more accurately predict the spreadingrate of both planar and round jets respect to the not realiz-able formulations. As it will be shown later, the deflectionof the thruster slipstream in the cross flow represented bythe incoming fluid plays an important role in the thrusterperformances.
In the present study the whole ship geometry is consid-ered in the calculations and some simplifications are there-fore required. All the propellers are represented by actua-tor disks, which are referenced in the text as fan disks or,simply, fans. Other appendages, like the rudders, are notconsidered. The water surface is assumed frictionless andwithout deformation.
The actuator disk concept, derived from the momentumtheory of Froude (1889) and Rankine (1865), and exten-sively reviewed by Horlock (1978), has been widely usedin RANS methods, especially for effective wake simula-tions, or to evaluate the interaction between a propeller anda body immersed in its slipstream, or to predict the loadingon nearby appendages. The use of actuator disks insteadof the actual geometry of the propellers allows a significantsaving of computational time and resources. The detaileddescription of the flow close to the propeller blades is notthe principal aim of this study. In addition, the large num-ber of measurements of propeller thrust provides the valueof the pressure jump which should be imposed to the actu-ator disks for each case. The experimental data also makepossible a detailed validation of the numerical results, interms of integral values of the forces acting on the surfacesas well as in terms of turning moments.
2 MODEL AND TEST DESCRIPTION
The model studied in this work and used in the tests, asdescribed in Marintek (2007, 2008), is a modified versionof a 1:19.200 scale model of a twin-ducted propeller AHTSmodel with hull and propulsors designed by Rolls-RoyceMarine AS. The length between perpendiculars, LPP , isabout 4.3 m, and the draught is about 0.4 m. The propelleris a 4 bladed CP model well above 200mm in diameter (D)and duct length to propeller diameter ratio (L/D) is 0.5.The tunnel diameter, DTUNNEL, is about 0.5 D and thepropeller is not in the middle of the tunnel but it is moved
about 0.3 DTUNNEL toward the port side with respect tothe centre plane. A sketch of skeg, duct and tunnel is shownin Figure 1.
Figure 1: Sketch of skeg, duct and tunnel, in the threepossible positions.
Note that only model scale results and dimensions are con-sidered in the paper. Although there will be some influenceof Reynolds number on the results, we believe that the mainfeatures of the flow, and so the main findings and conclu-sions, will be valid also for full scale. The realizable k − εturbulence model used in the calculations is suitable alsofor higher Reynolds number simulations, within the samerange of accuracy expected at model scale, but proving thecapability of the numerical method at model scale is a firstimportant step before full scale simulations.In the present work the configuration with the tunnel in itsoriginal position (POS1) and with a forward ship speed,U0, equal to 0.223 ms−1 is considered. The loading condi-tions for the tunnel thruster and for the main propellers aredescribed in Table 1: TT-0, TT-50 and TT-100 correspondrespectively to 0%, 50% and 100% MCR for the tunnelthruster; MP-0, MP-60 and MP-90 correspond respectivelyto 0%, 60% and 90% MCR for the main propellers. MP-60and MP-90 are referred to as half and full load in the text.The abbreviations TT and MP are used to refer to the tun-nel thruster and to the main propellers loading conditionsfor the real propellers in model tests as well for the fans incalculations.During the tests both the main propellers are working inforward mode and rotating outward at the same RPM. Thetunnel thruster jet is directed toward the port side and thepositive tunnel thruster RPM results in a negative turningmoment, as described in Figure 2.
3 THE NUMERICAL METHODThe commercial solver FLUENT is used for the calcula-tions. It supports unstructured grids and it offers a built-in fan model for the actuator disk approximation (Fluent,2006).A steady double-precision pressure-based solver is used,with second order discretization scheme for the convec-tion terms in all the equations and the SIMPLE pressure-correction algorithm.
Table 1. Test description: tunnel in POS1, forward ship velo-city U0, propellers and tunnel thruster from zero thrust up tofully loaded conditions.
Figure 2: Coordinate system and sign conventions.
3.1 The Computational Grid
The computational domain is a box 3.5 LPP long, 2 LPPlarge and LPP deep. Different grid sizes have been con-sidered. The final one ensures a fully developed flow at theexternal boundaries. The exit is 2 LPP downstream of thecenter of the hull, located at LPP /2, which corresponds tothe pivot point or center of rotation.The hybrid mesh, generated with the ICEM-CFD software,has hexahedral cells close to the wall surfaces and tetrahe-dral cells in the other parts of the domain. The height ofthe first layer attached to the surface corresponds to valuesof y+ close to 1 for all the surfaces, allowing the use of anenhanced wall treatment for the turbulent boundary layer(Fluent, 2006).The duct geometry is included in the model and the actuatordisks are located inside the ducts, for the main propellers,and inside the tunnel for the thruster. Each actuator disk islocated at the same axial position of the corresponding pro-peller plane, which is assumed to pass through the middlepoint of the blade root section. Two hexahedral cells layers
are also attached to each side of the actuator disks, so thatthe first computational nodes are equidistant from the diskand the determination of the pressure jump is straightfor-ward. In this way, in fact, the surfaces where the imposedpressure jump is achieved are located on fixed sections forall the cases. The fan disks fill the entire opening sectionsof the ducts and of the tunnel, but only the actual propellerdisk area (rboss < r < rtip), has a non-zero pressure jumpand induced tangential velocity. In this way the equiva-lence conditions between the actuator disks and the actualpropellers are fulfilled, in terms of diameters, distributionof the elementary thrust along the radius and in terms oftotal thrust. The reason for this way of including the fandisk was to avoid a numerical problem that occurred whena small gap was left between the actuator disk and the ductor tunnel wall. Figure 3 shows a view of the computationalmesh on the hull stern and a detailed view at the locationof the fan disk.
3.2 Boundary ConditionsThe velocity-inlet condition is imposed on the entry sideand pressure-outlet on the exit side of the entire computa-tional domain. On the lateral boundaries, as well as on thebottom and the top of the domain, the symmetry boundarycondition is imposed. The no-slip condition is imposed onthe wall surfaces of hull, skeg, tunnel and ducts, while thefan boundary condition is used to model the actuator disks.A fan is infinitely thin, and the discontinuous pressure riseacross it can be specified in different ways (Fluent, 2006).In the present case, the radial distribution profiles of pres-sure jump and tangential velocity are provided for eachconfiguration. Their radial distribution profiles are ob-tained from the distribution profile of the circulation Γ(r)calculated by potential methods for the open water pro-peller close to bollard condition. Lifting line theory is usedto derive the thrust distribution profile from the circulationprofile. The same radial thrust distribution is used for allthe considered test cases, while the actual values are scaledto get the same total thrust in the calculations as in the com-parable model tests. In the future a possible coupling be-tween the RANS calculations and potential flow calculationmethods for the propeller may be considered, to update inan interactive way the thrust distribution profile as the com-putation proceeds, on the basis of the incoming flow. Thepressure jump across the actuator disk is then calculated bythe radial thrust distribution as follows:
dP (r) =dT (r)2πrdr
. (1)
For what concerns the flow swirl, according to the Kelvintheorem and to the assumption of absence of swirl up-stream of the disk, the tangential velocity vθ can be definedby the circulation Γ of the actuator disk:
vθ(r) =Γ(r)2πr
. (2)
Figure 3: Grid on the hull stern, with tunnel and ducts. View of the internal side of a duct with detail of the fandisk.
Through the differential Joukowski theorem, the circula-tion can be expressed in terms of the thrust derivative inthis way:
Γ(r) =dT (r)
%dr(2πnr − vθ(r)/2), (3)
where n is the propeller rotational velocity. The substitu-tion of Equation (3) in Equation (2) leads to a quadraticexpression which provides the profile of the tangential ve-locity vθ(r) given the distribution of thrust. Within an ac-tuator disk approximation, pressure and velocity fields arecircumferentially averaged and there is no flow swirl up-stream of the fan disk, i.e. the tangential velocity variesabruptly from the location in front of the disk to that be-hind it.
4 ANALYSIS OF RESULTS
This section explains the method used to analyze both nu-merical and model test data and to focus on the investi-gated loss effects. Some additional cases are simulatedwith CFD, related to MP loading conditions lower than60% MCR. In particular 4, 12 and 35% of MCR are con-sidered; the value of RPM and thrust are calculated usingthe open water tests available for the main propellers (Mar-intek, 2007).The results are presented first in terms of integral variables,then for selected cases also a description of the main fea-tures of the flow field is made in terms of streamlines anddistributions of pressure and velocity. The quantities ofmain interest and their symbols are listed in Table 2.The comparison for the above quantities between modeltests and numerical results is reported in Table 3, while Ta-ble 4 reports the numerical results for the additional cases.
Table2. Main variables and their symbols.
The data in the tables will be described and discussed in thefollowing subsections.
The significant variable of practical use to highlight thethrust loss effects is the total turning moment. Its valuewill be converted to a corresponding total lateral force ap-plied in the tunnel thruster longitudinal position and withan equivalent moment about LPP/2. In the text below thisforce is referenced to as total thruster force, i.e. the lateralforce acting on the vessel caused by the tunnel thruster. Foreach loading condition of the working tunnel thruster, i.e.for TT-50 and TT-100, the variations of the total thrusterforce are caused by the only change of the MP load. Thereduction of thruster force can be represented in terms of anon-dimensional coefficient, Cy , equal to the ratio betweenthe actual thruster force and the undisturbed one, withoutthe main propellers. We can define the thrust deduction asz = 1− Cy .
Table 3. Comparison between model tests and numerical results.
The first three cases, 1040-1, 1001-1 and 1001-2, with thetunnel thruster off, are not of main interest, but they areuseful to individuate eventual asymmetries or inaccuraciesin the model test set-up or measurements. In fact, it shouldbe noted in Table 3 that, when the tunnel thruster is off(TT-0), a non-zero turning moment is measured in the ex-periments. After removing the turning moment due to thenon-zero value of the thruster thrust and due to the slightlyasymmetric load on the propellers, residual values of turn-ing moment remain in the model tests for each scenario,i.e. 0.45 for MP-0, 6.13 for MP-60 and 5.92 for MP-90,and they will be used as corrections in the following anal-ysis. Such inaccuracies in the model test set-up also resultfrom the not symmetrical values of the lateral force on thePT and SB ducts when the thruster is off (1040-1, 1001-1,1001-2). This suggests a small inclination of the ship bowtoward the port side. In the numerical model the geometryis perfectly symmetric respect to the central plane of theship, which is perfectly aligned with the advance velocitydirection. For this reason no correction is needed for thenumerical results.Figure 4 shows the turning moment for both calculationsand model tests after this correction. The numerical resultsobtained for the additional cases are also shown in the fig-ure. The asymmetry due to the different MP loading is notcorrected, as it is reproduced in the numerical calculationsas well. After the above mentioned correction only a smallturning moment remains for the TT-0 conditions, as shownin Figure 4 and in Table 3; as expected it is just the con-tribution due to the asymmetry in the MP load and to theactual non-zero thruster thrust.
Figure 4: Total turning moment.
For the TT-50 conditions some discrepancies are evidentwhen the propellers are off, whilst for the TT-100 con-
ditions the value of the turning moment is overestimatedwhen the propellers are heavy loaded.
4.2 Main Propellers Off (MP-0)
When the thruster is undisturbed (MP load equal to 0% inFigure 4, i.e. cases 1040-1, 1080-1, 1080-6 in Table 3), in-creasing the loading on the thruster obviously increases theturning moment. The resulting turning moment is negativeboth for model tests and calculations, but a lower absolutevalue of the total turning moment, MTOT , is found fromthe calculations, especially for the case 1080-1 (TT-50).The main reason is that the outer layers on the top of thejet are deflected by the incoming flow, and they hit againstthe duct, especially at half loading conditions, as shown inFigure 5(a). In fact, the thruster jet is acting normal to themoving ambient fluid and it gets deflected because of thestagnation pressure exerted by the free stream. Its deflec-tion is a function of the ratio α between the mean velocityUJ of the jet and the velocity U0 of the cross flow (Rajarat-nam, 1976). Increasing the thruster loading reduces the jetdeflection and improves the turning performance becausethe value of the ratio α increases. In fact, in calculations,when the TT-fan is fully loaded (Figure 5(b)), a smalleramount of fluid in its race impacts with the duct. Thisphenomenon is more evident in calculations than in modeltests, and there might be several different reasons.
Figure 5: Deflection of the jet. 3-D streamlines coloredby total pressure levels. MP-0. TT-50 (a), and TT-100(b). View from the top.
The simplifying assumptions of the fan model may be in-accurate in representing the thruster jet, especially in terms
of induced velocities. The differences to the real case maybe emphasized by the fact that the same distribution profileobtained for the main propeller is also used for the thruster.The spreading of the jet may also be overestimated, beingrelated to both the axial and tangential induced velocitiesinside the jet (a circular jet with swirl spreads more rapidlyand the velocity field decays much faster than a jet withoutswirl (Rajaratnam, 1976)). The k − ε turbulence model it-self may be inadequate in modeling a swirling turbulent jetin an ambient field in motion in a direction different fromthe jet axis, and in representing its deflection and its im-pact against a wall surface. Another minor reason could bethat with an actuator disk approximation it is not possibleto simulate the “physical ”presence of the actual propellerswhen they are not working (the negative thrust measuredfor the main propellers in the experiments for the cases1080-1 and 1080-6 could not be achieved in the numeri-cal calculations as shown in Table 3). As a consequence,instead of a stagnation pressure in front of the disks, a lowpressure area is produced and the main flow is acceleratedby the action of the duct and deviated by the incoming flowmore than in the model tests. An additional reason mightbe not numeric but related to the possible inclination of themodel test set-up, as discussed before, with a more favor-able position of the port duct respect to the tunnel and theincoming flow, which can reduce or avoid the impact of thejet against the duct.
4.3 Interaction Effects
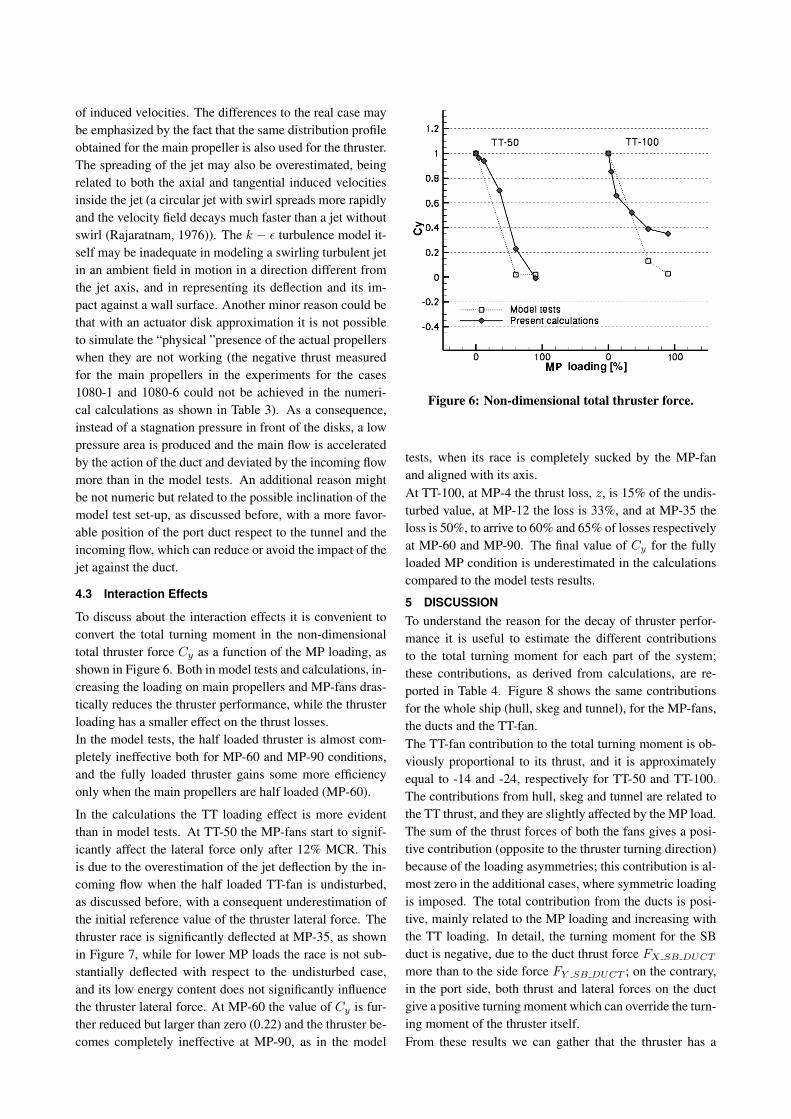
To discuss about the interaction effects it is convenient toconvert the total turning moment in the non-dimensionaltotal thruster force Cy as a function of the MP loading, asshown in Figure 6. Both in model tests and calculations, in-creasing the loading on main propellers and MP-fans dras-tically reduces the thruster performance, while the thrusterloading has a smaller effect on the thrust losses.In the model tests, the half loaded thruster is almost com-pletely ineffective both for MP-60 and MP-90 conditions,and the fully loaded thruster gains some more efficiencyonly when the main propellers are half loaded (MP-60).
In the calculations the TT loading effect is more evidentthan in model tests. At TT-50 the MP-fans start to signif-icantly affect the lateral force only after 12% MCR. Thisis due to the overestimation of the jet deflection by the in-coming flow when the half loaded TT-fan is undisturbed,as discussed before, with a consequent underestimation ofthe initial reference value of the thruster lateral force. Thethruster race is significantly deflected at MP-35, as shownin Figure 7, while for lower MP loads the race is not sub-stantially deflected with respect to the undisturbed case,and its low energy content does not significantly influencethe thruster lateral force. At MP-60 the value of Cy is fur-ther reduced but larger than zero (0.22) and the thruster be-comes completely ineffective at MP-90, as in the model
Figure 6: Non-dimensional total thruster force.
tests, when its race is completely sucked by the MP-fanand aligned with its axis.At TT-100, at MP-4 the thrust loss, z, is 15% of the undis-turbed value, at MP-12 the loss is 33%, and at MP-35 theloss is 50%, to arrive to 60% and 65% of losses respectivelyat MP-60 and MP-90. The final value of Cy for the fullyloaded MP condition is underestimated in the calculationscompared to the model tests results.
5 DISCUSSIONTo understand the reason for the decay of thruster perfor-mance it is useful to estimate the different contributionsto the total turning moment for each part of the system;these contributions, as derived from calculations, are re-ported in Table 4. Figure 8 shows the same contributionsfor the whole ship (hull, skeg and tunnel), for the MP-fans,the ducts and the TT-fan.The TT-fan contribution to the total turning moment is ob-viously proportional to its thrust, and it is approximatelyequal to -14 and -24, respectively for TT-50 and TT-100.The contributions from hull, skeg and tunnel are related tothe TT thrust, and they are slightly affected by the MP load.The sum of the thrust forces of both the fans gives a posi-tive contribution (opposite to the thruster turning direction)because of the loading asymmetries; this contribution is al-most zero in the additional cases, where symmetric loadingis imposed. The total contribution from the ducts is posi-tive, mainly related to the MP loading and increasing withthe TT loading. In detail, the turning moment for the SBduct is negative, due to the duct thrust force FX SB DUCT
more than to the side force FY SB DUCT ; on the contrary,in the port side, both thrust and lateral forces on the ductgive a positive turning moment which can override the turn-ing moment of the thruster itself.From these results we can gather that the thruster has a
Figure 7: Deflection of the slipstream. 3-D streamlines colored by the total pressure levels. Pressure contours onthe ducts and on the tunnel. TT-50 (left), TT-100 (right).
strong effect on the side force acting on the ducts. Whenthe thruster is off and the main propellers are working, boththe axial and the lateral forces acting on the ducts are sym-metric about the central longitudinal plane, and their valuesincrease with the propeller load. When the thruster is work-ing, the duct in the port side is influenced by the thrusterrace and the lateral force on the duct acts in the opposite(negative) direction.This negative force on the PT side decreases with increas-ing propeller loading, probably because the flow created bythe suction of the main propeller is increasingly dominat-ing the flow created by the race of the thruster. As a conse-quence the negative lateral force on the SB duct increaseswith the propeller loading and it is no longer balanced bythe positive force on the PT duct. The total effect is an ad-ditional negative lateral force developing a turning momentopposite to the rotation induced by the thruster.
This additional side force can be related to the variationof the lateral component of momentum in the thruster racewhich is partially or totally sucked and deflected by the ac-
tion of the propellers; it increases with the propeller loadingbecause a larger amount of race is sucked and deviated bythe propellers, and it increases with the thruster loading be-cause the total pressure content in the race is higher. Thevalue of this additional lateral force and the related turningmoment can be of the same order or larger than the thrusterturning moment contribution.
A similar behavior, especially concerning the additionallateral force, can be expected also on other appendages,like the propeller shafts, or on the propellers as well, fur-ther reducing the turning performance with respect to cal-culations. In fact, the lateral force on the propellers was notdirectly measured in model tests but it is counted in the to-tal lateral force and in the turning moment. This would ex-plain the higher value of the total thruster forceCy obtainedat the highest loading conditions in the present calcula-tions: the actual propellers and their shafts are not mod-eled as solid bodies and their opposite contribution to thetotal turning moment is missing, especially when it wouldbe more significant, i.e. when propellers and thruster are
Figure 8: Contributions to the total turning momentfrom the different parts of the model.
fully loaded.The asymmetry of thrust for propellers/fans and ducts alsoplays an important role in the decay of thruster perfor-mance. As depicted in Figure 9, the race creates a flowdeficit for the PT fan, which becomes then overloaded withrespect to the fan in the SB side. In fact the thruster actiondecelerates the flow in the PT side where the race bendsthe incoming flow, partially obstructing the flow enteringthe fan, as shown in Figure 10.The overload of the propeller in the PT side is evident alsoin model tests, as shown in Table 3, where the thrust ofthe ducted propeller in the PT side is always higher thanthe one in the SB side, even if they are loaded with thesame power. The same happens in calculations, even whenexactly the identical thrust is imposed to the fans.
6 CONCLUSIONS
The investigation by RANS methods of the interaction be-tween a stern tunnel thruster and main propellers havehighlighted the principal phenomena responsible for thelarge decay of turning performance, which had been ob-served during model tests but which could not easily findan explanation through the experimental data. The numer-ical results, in addition to the experimental data, suggestthat the large drop in turning performance observed dur-ing model tests is caused by an interaction between thethruster race and the propellers, whose effect increases bothwith the thruster and the main propeller loading. The vari-ation of the lateral component of momentum in the thrusterrace, partially or totally sucked by the propeller, determinesadditional negative side forces acting on the ducted pro-pellers. The related turning moment can be of the same or-der or larger than the thruster turning moment contribution,and acting in the opposite sense of rotation. The action ofthe thruster leads also to the overload of the propeller in-
Figure 9: Flow deficit in the PT fan. Contours of theaxial velocity component U divided by the advance ve-locity U0.
fluenced by its race, and generates a thrust asymmetry inpropellers and ducts with a further reduction of the totalturning moment.
A detailed comparison of calculations with model tests hasbeen carried out and the results are in good agreement withthe experimental data. The discrepancies are in the rangeof accuracy expected within actuator disk approximation.Thrust and side force on the SB duct are slightly underes-timated, mainly due to the approximation of the actuatordisk used instead of the actual propellers; only the lateralforce on the PT duct is sometimes overestimated; it mightbe because in the real case the race is also hitting againstother appendages, like the shaft, and against the propelleritself, with a consequently smaller impact on the duct. Thethrust loss effects are definitely captured considering theorder of magnitude of the simplifying assumptions and thecomplexity of the investigated phenomena, which are noteasily reproduced by eddy-viscosity turbulence models.
In conclusion, the actuator disk approximation, withinRANS-type CFD calculations, can be used for propeller-thruster and propeller-hull interaction studies: further im-provements are possible, overall for modelling the deflec-tion of the thruster jet, which is crucial for determining thetotal lateral force acting on the system. Obtaining pressureand velocity distribution profiles from the actual thrustergeometry would be beneficial to get a better representa-tion of the thruster race. Using the actual geometry for thethruster could also be an alternative option, provided thatthe higher accuracy does not reduce the efficiency, in termsof computational time and resources.
After this first evaluation, the method can now be used toanalyze the modified model, with the tunnel moved towardbow, under the same loading conditions.
Figure 10: Action of the thruster jet on the incoming flow entering the PT duct. Pressure contours and projectionof streamlines on the horizontal plane passing in the middle of the tunnel. Fully loaded thruster. MP-0 (a) andMP-35 (b).
ACKNOWLEDGMENTThis work has been performed within the Rolls-Royce Uni-versity Technology Centre at NTNU. The authors wish tothank Rolls-Royce Marine for permission to publish the pa-per. Special thanks are given to MARINTEK for providingthe model test data.This project was partially supported by the NorwegianHPC project NOTUR that granted access to its computerfacilities.
Fluent (2006). ‘Fluent 6.3 User Guide’. Fluent Inc.
Froude, R. E. (1889). ‘On the Part Played in Propulsion byDifferences of Fluid Pressure’. Trans. Inst. Nav. Arch.,30, p.390.
Horlock, J. H. (1978). Actuator Disk Theory.Discontinuities in Thermo-Fluid Dynamics. McGraw-Hill Book Company.
Marintek (2007). ‘Model tests, AHTS’. Norwegian MarineTechnology Research Institute. Internal report.
Marintek (2008). ‘Interaction effects between tunnel-thrusters and main propellers’. Norwegian Marine Tech-nology Research Institute. Internal report.
Muller, S. V. and Abdel-Maksuod, M. (2007). ‘NumericalInvestigation of Transverse Thrusters’. In Proceedingsof STG - Sprechtag “CFD in Ship Design”, Hamburg.
Rajaratnam, N. (1976). Turbulent Jets. Elsevier, Amster-dam.
Rankine, W. J. M. (1865). ‘On the Mechanical Principlesof the Action of Propellers’. Trans. Inst. Nav. Arch., 3,p.13.
Shih, T.-H., Liou, W. W., Shabbir, A., Yang, Z., and Zhu,J. (1995). ‘A New k-ε Eddy-Viscosity Model for HighReynolds Number Turbulent Flows - Model Develop-ment and Validation’. Computers Fluids, 24(3):227–238.