Numerical investigations of buoyancy-driven natural ventilation in a simple atrium building and its effect on the thermal comfort conditions Shafqat Hussain, Patrick H. Oosthuizen * Department of Mechanicals and Materials Engineering, Queen’s University, 130 Stuart, Kingston, ON, Canada K7L3N6 article info Article history: Received 19 October 2011 Accepted 10 February 2012 Available online 17 February 2012 Keywords: Numerical investigations Atrium building Atrium designs Comfort analysis abstract In the present study use of solar-assisted buoyancy-driven natural ventilation in a simple atrium building is explored numerically with particular emphasis on the thermal comfort conditions in the building. Initially various geometric configurations of the atrium space were considered in order to investigate airflows and temperature distributions in the building using a validated computational fluid dynamics (CFD) model. The Reynolds Averaged NaviereStokes (RANS) modelling approach with the SST-keu turbulence model and the Discrete Transfer Radiation Model (DTRM) was used for the investigations. The steady-state governing equations were solved using a commercial CFD solver FLUENT Ó . From the numerical results obtained, it was noted that an atrium space integrated with a solar chimney would be a relatively better option to be used in an atrium building. In the geometry selected, the performance of the building in response to various changes in design parameters was investigated. The produced airflows and temperature distributions were then used to evaluate indoor thermal comfort conditions in terms of the thermal comfort indices, i.e. the well-known predicted mean vote (PMV) index, its modi- fications especially for natural ventilation, predicted percent dissatisfied (PPD) index and Percent dissatisfied (PD) factor due to draft. It was found that the thermal conditions in the occupied areas of the building developed as a result of the use of solar-assisted buoyancy-driven ventilation for the particular values of the design parameters selected are mostly in the comfortable zone. Finally, it is demonstrated that the proposed methodology leads to reliable thermal comfort predictions, while the effect of various design variables on the performance of the building is easily recognized. Ó 2012 Elsevier Ltd. All rights reserved. 1. Introduction In recent years energy efficiency demands and environmental concerns have prompted building designers to reconsider natural ventilation in summer, solar heating in winter and the use of daylighting to save energy consumed by buildings. The advanced technology of highly glazed atriums is currently being incorporated in the design of large modern buildings in order to take advantage of day lighting, solar heating and buoyancy-driven natural venti- lation. Atrium spaces, when properly integrated with the building design, complement the building’s functionality, provide vibrant space, provide daylighting deep into the building interior and also save energy. There have been several studies that support this view e.g. see Refs. [1e6]. Atrium design is complex and creates unique interrelationships between various parameters that must be understood and accounted for in the final design. Good atrium design will maximize the natural environment to minimize energy consumption. Atriums can be configured in an infinite number of ways, but atrium configurations should be always a reasoned response to the climatic and life safety goals. Typical atrium configurations may be completely surrounded by building elements or may be partially enclosed. They may be top lit, side lit or a combination of both. The configuration of the atrium will dictate many of the features of the atrium. The shape and geometry of an atrium depend upon the intended functions of the adjoining occupied portions of the building. There are several simple and complex basic configurations of an atrium space. The configuration selected by an individual designer is a function of (among other issues) personal taste, life safety issues, proposed uses of both the atrium and adjoining spaces, impact the atrium is wished to have climatically. Natural ventilation in atria buildings can be achieved with solar- driven, buoyancy-induced airflows through the use of an atrium space, a solar chimney channel or a combination of both. In the past the use of solar chimneys or an atrium space in buildings has been examined i.e., see Refs. [7e14,38]. However, the integration of the * Corresponding author. Tel.: þ1 613 533 2573. E-mail addresses: [email protected](S. Hussain), [email protected](P.H. Oosthuizen). Contents lists available at SciVerse ScienceDirect Applied Thermal Engineering journal homepage: www.elsevier.com/locate/apthermeng 1359-4311/$ e see front matter Ó 2012 Elsevier Ltd. All rights reserved. doi:10.1016/j.applthermaleng.2012.02.025 Applied Thermal Engineering 40 (2012) 358e372
1359-4311/$ e see front matter � 2012 Elsevier Ltd.doi:10.1016/j.applthermaleng.2012.02.025
a b s t r a c t
In the present study use of solar-assisted buoyancy-driven natural ventilation in a simple atrium buildingis explored numerically with particular emphasis on the thermal comfort conditions in the building.Initially various geometric configurations of the atrium space were considered in order to investigateairflows and temperature distributions in the building using a validated computational fluid dynamics(CFD) model. The Reynolds Averaged NaviereStokes (RANS) modelling approach with the SST-keu
turbulence model and the Discrete Transfer Radiation Model (DTRM) was used for the investigations.The steady-state governing equations were solved using a commercial CFD solver FLUENT�. From thenumerical results obtained, it was noted that an atrium space integrated with a solar chimney would bea relatively better option to be used in an atrium building. In the geometry selected, the performance ofthe building in response to various changes in design parameters was investigated. The producedairflows and temperature distributions were then used to evaluate indoor thermal comfort conditions interms of the thermal comfort indices, i.e. the well-known predicted mean vote (PMV) index, its modi-fications especially for natural ventilation, predicted percent dissatisfied (PPD) index and Percentdissatisfied (PD) factor due to draft. It was found that the thermal conditions in the occupied areas of thebuilding developed as a result of the use of solar-assisted buoyancy-driven ventilation for the particularvalues of the design parameters selected are mostly in the comfortable zone. Finally, it is demonstratedthat the proposed methodology leads to reliable thermal comfort predictions, while the effect of variousdesign variables on the performance of the building is easily recognized.
� 2012 Elsevier Ltd. All rights reserved.
1. Introduction
In recent years energy efficiency demands and environmentalconcerns have prompted building designers to reconsider naturalventilation in summer, solar heating in winter and the use ofdaylighting to save energy consumed by buildings. The advancedtechnology of highly glazed atriums is currently being incorporatedin the design of large modern buildings in order to take advantageof day lighting, solar heating and buoyancy-driven natural venti-lation. Atrium spaces, when properly integrated with the buildingdesign, complement the building’s functionality, provide vibrantspace, provide daylighting deep into the building interior and alsosave energy. There have been several studies that support this viewe.g. see Refs. [1e6].
Atrium design is complex and creates unique interrelationshipsbetween various parameters that must be understood and
accounted for in the final design. Good atrium designwill maximizethe natural environment tominimize energy consumption. Atriumscan be configured in an infinite number of ways, but atriumconfigurations should be always a reasoned response to theclimatic and life safety goals. Typical atrium configurations may becompletely surrounded by building elements or may be partiallyenclosed. They may be top lit, side lit or a combination of both. Theconfiguration of the atrium will dictate many of the features ofthe atrium. The shape and geometry of an atrium depend upon theintended functions of the adjoining occupied portions of thebuilding. There are several simple and complex basic configurationsof an atrium space. The configuration selected by an individualdesigner is a function of (among other issues) personal taste, lifesafety issues, proposed uses of both the atrium and adjoiningspaces, impact the atrium is wished to have climatically.
Natural ventilation in atria buildings can be achieved with solar-driven, buoyancy-induced airflows through the use of an atriumspace, a solar chimney channel or a combination of both. In the pastthe use of solar chimneys or an atrium space in buildings has beenexamined i.e., see Refs. [7e14,38]. However, the integration of the
solar chimney with an atrium space in multi-storied buildingsneeds further investigation in order to explore the use of solar-assisted buoyancy-driven natural ventilation to reduce energyconsumption. Currently computational fluid dynamics (CFD) tech-niques are being increasingly employed for predicting buildingairflows and testing natural ventilation strategies, e.g., seeRefs. [15e18]. With the recent advances in computing power, theprocess of creating a CFD model and analyzing the results hasbecome much less labour-intensive, reducing the time and there-fore the cost. Rundle et al. [19] carried out a systematic validation ofa commercial CFD code against experimental measurements. Theynoted that CFD can be used successfully to simulate the heattransfer and fluid flow in atria geometries and provided recom-mendations regarding turbulence and relative heat transfermodelling. Joseph and Sam [20] examined the sensitivity of theenergy performance of the office buildings in Hong Kong andindentified input design parameters and analysed annual buildingenergy consumptions. It was noted that building simulations areuseful for assessing thermal response of buildings and datavariability.
The application of computational fluid dynamics (CFD) toanalyse the thermal comfort conditions in atrium buildings hasbeen studied i.e., see Refs. [21e24]. Standards and fundamentals ofthermal comfort have been published e.g., see Refs. [25e29].Thermal comfort is defined as “the condition of mind that expressessatisfaction with the thermal environment” in ISO 7730 [29]. Themost common thermal comfort model used is the traditional Pre-dicted Mean Vote (PMV) index model for air-conditioned buildings[28]. The thermal comfort indices PMV (Predicted Mean Vote) andPPD (Predicted Percentage of Dissatisfied) of Fanger [28] areaccepted as ISO 7730 and are calculated by empirical equations. ThePMV equation uses a steady-state heat balance for the human body.This equation was derived empirically and the thermal sensationvote indicates the personal deviation from the heat balance[�3(cold) to þ3(hot); a seven point scale, 0¼ neutral (optimum)].The PPD equation indicates the variance in the thermal sensation ofthe group of persons exposed to same conditions. Dissatisfactionwith the thermal environment, discomfort, was defined for thosewho voted cool (�2), cold (�3), warm (þ2) or hot (þ3). Underoptimal thermal conditions (PMV¼ 0) a minimum 5% dissatisfied isfound assuming identical activity level, clothing and environmentalconditions. The PMV and PPD are calculated from six basic vari-ables: activity, clothing, air temperature, air velocity, mean radianttemperature (MRT) and humidity. The values of the variables forthe activity (metabolic rate) and clothing (ensemble insulation) aredetermined using ASHRAE Fundamentals.
However, it has been proven that the PMV index is inadequate inthe case of naturally ventilated buildings [28], and an optionalthermal comfort model, also known as “adaptive comfort standard”is implemented in the new revised American Society of Heating,Refrigerating and Air-conditioning Engineers (ASHRAE) Standard55 [27], together with the PMV index. This model is used todetermine thermal comfort in exclusively naturally ventilatedspaces. However, it has limitations [28], such as the fact that itsapplicability is restricted tomeanmonthly temperatures from 10 �Cto 33 �C, occupants must be engaged in near sedentary activity, andonly information of global thermal discomfort in large spaces isprovided. Fanger and Toftum [28] introduced the extended PMVNV
comfort model which is more suitable for naturally ventilatedbuildings and can be considered consistent with the traditionalPMV model. The PMVNV index represents an extension of thetraditional PMV model to account for the occupants ‘expectancyfactor’ according to their habitat, as well as to the estimated activity,i.e. the metabolic rate is reduced under hot and humid conditions[28]. The expectancy factor is multiplied with PMV to reach the
mean thermal sensation vote of the occupants of the naturallyventilated building in a warm climate. The expectancy factor isestimated to vary between 1 and 0.5. If theweather is warm all yearor most of the year, the expectancy factor may be 0.5. In regionswith only a brief period of warm weather during the summer, theexpectancy factor may be 0.9e1. It is 1.0 for the air-conditionedbuildings. The aforementioned models follow the ASHRAEthermal comfort scale [27]. For draft assessments, the PercentageDissatisfied (PD) index [27] may also be used. In order to quantifythermal comfort in naturally ventilated buildings, these modelsmay be integrated with a CFD model. In order to study indoorthermal comfort variations with respect to the architecturalelements changes, various geometrical configurations may betested.
The present study was undertaken to consider the variousgeometric configurations of the atrium space in a simple prototypethree-storied atrium building and to investigate the effects of theatrium design changes on the buoyancy-driven natural ventilationflow rate and temperature distributions inside the building. Thisstudy addresses natural ventilation assessments for both thephysical phenomenon and the effects of the various architectural-design factors on the thermal comfort conditions in the building.For different geometric and solar parameters (input variables)considered, the airflow pattern is predicted through numericalsimulation using a CFD model that has been developed and vali-dated in previous studies i.e., see Refs. [30e34]. Outdoor prevailingconditions are imposed as inlet boundary conditions. The numer-ical results are then introduced to a special post-processing algo-rithm, which calculates the thermal comfort indices (PMV, PMVNV,PPD, and PD) in the occupied region of the building. The details ofthe study, the methodology, and the results are presented in thesubsequent sections.
2. Atrium design configurations
Previously we studied the actual atrium space in the Engi-neering Building of Concordia University using a CFDmodel and theCFD predictions were validated against the experimental dataavailable i.e., see Refs. [30e34]. In the present study we havesimulated a simple three-storied atrium building with variousconfigurations of the atrium space (see Fig. 1) by following thedesign approach developed by Holford and Hunt [35] analyticallyfor a simple multi-storied atrium building. Important dimensionsand areas of the building design (Case-1) are given in Table 1.Inorder to utilize the CFD model from the previous studies [30e34],the simulated building was assumed to be located and orientedexactly as the actual Engineering Building of Concordia University,i.e., 35 degrees west of south in the region of Montreal, Canadawiththe facade glass wall facing southwest. The atrium exhausts arelocated on the highest point in the atrium and the storey inlets andoutlets are located on the side walls of the rooms (see Fig. 1) whichwere sized on each floor using the design curves developed byHolford and Hunt [35]. The effective atrium outlet opening areawasselected equivalent to the inlet opening areas for all floors.
3. Numerical solution procedures
3.1. CFD model
The airflow patterns and temperature distributions in theatrium building are governed by the conservation laws of mass,momentum and energy. The mathematical model applied includesthe numerical techniques to solve the continuity, NaviereStokes(NeS), and energy for 3D, turbulent flow. The general form of themomentum, pressure, turbulent kinetic energy, turbulent energy
Fig. 1. Basic design configurations of an atrium space considered.
dissipation, and enthalpy (temperature for constant heat capacity)equations can be expressed in the general form as follows:
vðrfÞvt
þ vðruifÞvxi
¼ v
xi
�Gf
vf
vxi
�þ Sf (1)
where (f)¼ (u), (v), (w), (P), (k), ( 3), (h, T) , respectively and Sfrepresents the source terms including pressure terms, thermalsource terms, etc., as appropriate for the variable (f) being solved.The assumptions made for the problem are: (a) single phase,steady-state flow for a Newtonian fluid, (b) heat transfer at thewalls by either conduction or radiation is neglected, except glazingwalls (c) steady-state atmospheric conditions, (d) wind velocity isassumed zero and (e) air is considered as a mixture of dry air andwater vapour with constant relative humidity.
Because natural ventilation is a phenomenon of random naturedue to the constant changes of external weather conditions, anymathematical model applied for the prediction of natural ventila-tion should include the dynamic nature of the external conditions.In applying a CFDmethod one should ideally use a time-dependentapproach, which, however, would require knowledge of thetime-dependent variations of the boundary conditions used. Thistechnique would provide very detailed and useful information
Table 1Basis areas and dimensions of the prototype building (Case-1).
about natural ventilation but it requires excessive computationalresources for practical applications. A simplified approach toovercome such restrictions is the steady-state assumption, as mostphenomena take place at almost steady-state conditions over longperiods of time. Furthermore, during daytime cycles in real build-ings, temperature changes occur but the steady-state assumption isconsidered to be valid over long periods of time. Thus, in order torecognize the potential time-averaged value of temperatures andvelocities, the solution was obtained using the Reynolds averagedgoverning equations for steady, incompressible, three-dimensionaland turbulent flow. In dealing with the buoyancy forces in themomentum equations the Boussinesq approach was adopted, i.e., itwas assumed that the fluid properties are constant except for thedensity change with temperature which gives rise to the buoyancyforces, these being dealt with a linear relation between the densitychange and the temperature change. In addition, the dissipationterm in the energy equationwas neglected due to the low velocitiesinvolved.
When the first-order fluid parameters are of main concern (e.g.mean temperature and flow rate) rather than turbulent fluctuationdetails, two equation eddy-viscosity turbulence models aregenerally thought suitable for modelling indoor flows. As notedfrom our previous studies [30e34] for the evaluation of turbulencemodels and from literature survey, the SST-keu turbulence modelalong with a radiation model DTRM was considered suitable forpresent CFD simulations. The resultant steady-state governingequations were solved using the commercial CFD solver FLUENT�.Pressure coupling was treated using the SIMPLE algorithm. Thesecond-order upwind scheme was used to discretize themomentum, turbulent kinetic energy, dissipation rate and energyconservation equations. The body force weighted scheme was usedto discretize pressureevelocity coupling. These were solved ina segregated manner. Convergence was considered to have beenreached when the energy residual was less than 0.1% and the flowvariables residuals varied by 1% over the last 100 iterations. Theunder relaxation factors for pressure, density, momentum, turbu-lence kinetic energy, turbulence dissipation rate, turbulentviscosity, energy 0.3,1,2,0.8,0.8,1,0.9 respectively were used to get
Table 2Solar irradiation and outside conditions for at time of 16:00 on July 10, 2010.
Sun direction vector x y z
�0.54 0.84 �0.06
Sunshine fraction 1Direct normal solar irradiation (at earth’s surface)
[W/m2]863
Diffuse solar irradiation e vertical surface [W/m2] 123Diffuse solar irradiation e horizontal surface
[W/m2]109
Outside heat transfer coefficient [W/m2 �C] 7.4Outside air temperature [�C] 29.7
Fig. 2. Mesh structure (Case-1) for CFD simulations (Mesh2).
the solution converged. Simulations were performed on a windowdesktop PC with Intel Quad Core Processor EM64T Family 6 Model15 Stepping 11 Genuine Intel w3.0 Ghz each processor, 8 GB Ram1333 Hz, Operating system is Windows XP Professional 64 bit SP2and required approximately 24 h for the grid selected.
3.1.1. Boundary conditionsExternal climatic conditions affect architectural design of
naturally ventilated buildings. The internal airflow pattern is theresult of interaction between the indoor and outdoor environment.Especially in the case of natural ventilation, outdoor conditionsstrongly affect the indoor airflow pattern, and thus affect thethermal sensation of the occupants. In the present study the focuswas to investigate the use of solar-assisted buoyancy-driven naturalventilation, therefore numerical investigations were performedunder fixed steady-state outdoor climatic conditions with ambienttemperature of 29.7 �C, relative humidity of 44 at 13:00 h on July15, 2010which represents the peak summer time for the location ofregion considered while wind velocity was assumed zero. Theventilation system of the building was considered based on theonly buoyancy-driven natural ventilation induced by the heat gainsfrom the solar radiation and other heat sources present in thebuilding. The heat sources were assumed to be located in the centreof each floor to match with the assumptions of the mathematicalmodels developed by Hunt and Holford [35].
In practice airflow inside the connected spaces is mixed byconduction, convection and radiation heat transfer effects. In thiswork, conduction and radiation effects were only considered for theglazing facade walls while all the other walls were assumed to beadiabatic to meet the assumptions of the mathematical modelsdeveloped by Hunt and Holford [35]. All boundaries of the domain,except the façade glass surfaces, ventilation openings, heat source,were modelled as no-slip (uj¼ 0) wall boundaries with zero heatflux. The mixed thermal boundary conditions were used for thefaçade glass surfaces. One of the most demanding aspects of heattransfer through the envelope is the evaluation of the convectionheat transfer coefficient. There are many different correlations inthe literature to determine the external heat transfer coefficient forbuildings. The paper by Palyvos [36] summarizes and outlines thedifferent correlations found in literature. On the basis of thirtyavailable linear correlations, he comes up with the following“average” correlation to calculate the heat transfer coefficient (hc)for windward surfaces:
hc ¼ 4Vw þ 7:4 (2)
where Vw, is wind velocity. With zero wind velocity the value ofexternal heat transfer coefficient equals to 7.4 W/m2 K was used.The optical properties of the glazing surfaces (semi transparent)used in our previous studies [30e34] of an existing atrium buildingof Concordia University, in Montreal with solar transmittance of36% and absorptivity of 17.5% were used. The modelling of theglazing walls was simplified as a single glazing with effectivethermal conductivity of 0.0626 W/m2 K with a total overall thick-ness 24 mm. The radiation exchange between the facade and thesky was also taken into account. The sky temperature was calcu-lated to be 28.9 �C using theMills [37] correlation, Tsky¼ [ 3skyTout
4 ]1/4
where the emissivity of the sky ( 3sky) for the daytimewas calculatedto be 0.90 using the relation, 3sky¼ 0.727þ 0.0060Tout with anambient temperature Tout of 29.7 �C. The heat sources weremodelled as a no-slip wall boundary (2� 2 m) located in the centreof each floor with a constant heat flux equivalent to 132 W/m2 onthe atrium floor and 205W/m2 on the floors of each room. Aconstant relative pressure of 0 Pa was imposed across the roominlets and the atrium outlet.
3.2. Radiation model
In order to calculate the local solar heat gain in the buildingthrough the glass surfaces, the position of the sun in the sky mustbe known, and then the intensity of incident total solar radiationand the thermal radiation exchange between each building enve-lope element and the surroundings (sky, ground and neighbouringbuildings) must be calculated. This results in a source term that isadded to the energy (temperature) equation (Eq. 1). In the presentwork, solar calculator was used for calculation of the incident solarradiation. Total solar radiation incident on a sloped surface is:
It ¼ ID þ Ids þ Idg (3)
where It is the total incident shortwave radiation, ID is the directradiation, Ids the sky diffuse radiation, and Idg is the groundreflected radiation to the surface. Shortwave radiation incidentupon a surface is considered to be converted to a thermal source,depending on the local absorption coefficient (a) of the material,which equals emissivity (e) for grey surfaces in equilibrium.
To account for long-wave thermal radiation exchange among thesurfaceswithin the building, radiation intensity transport equations(RTEs) are solved. FLUENT offers five radiation models; DiscreteTransfer Radiation Model (DTRM); P-1 Radiation Model; RosselandRadiation Model; Surface to Surface (S2S) Radiation Model; andDiscreteOrdinates (DO) RadiationModel. Fromour previous studiesit was noted that DTRM radiation model is more suitable for thepresent study. Themain assumption followed in the DTRMmodel isthat radiation leaving surface element in a specific range of solidangles can be approximated by a single ray. It uses a ray-tracingalgorithm to integrate radiant intensity along each ray and is
Fig. 3. Prediction of vertical temperature profile (a) and vertical velocity profile (b) in the centre of rooms for different mesh densities, where 0 m, 4 m and 8 m define the ground,first and second floor levels respectively.
relatively simple model and increases accuracy by increasingnumber of rays while applies to a wide range of optical thicknesses.The solar calculator was used to find the sun’s location in the skywith the given inputs of time, date and the global location. Solarirradiation and outside conditions at 13:00 on July 15, 2010 areshown in Table 2.
Table 3Buoyancy-driven natural ventilation volume flow rates on each floor and temperature (�
Atrium designs Glazing area (m2) Volume flow rate (m3/s) in each room
Three mesh densities with hexahedral cells were investigated:Mesh1 (415 k cells), Mesh2 (812 k cells, see Fig. 2) and Mesh3(1235 k cells). The grids used are highly non-uniform characterizedby high-nodes density near solid walls and more cells are located
C) values in the centre of each room on left-hand side of the building.
Temperature (�C) at 1.1 m from floor of each room
Atrium floor Ground floor First floor Second floor Atrium floor
where more velocity and temperature gradients are expected e.g.,near walls, ventilation openings and the area potentially occupiedby the thermal plume in order to capture the variation in theairflows in these areas. The minimum cell size near each wall wasselected, leading to yþ values �10 in order to apply SST-keuturbulence model. The simulation results shown in this sub-section are based on the conditions for achieving the same venti-lation flow rate in each storey for Case-1 geometry. The verticaltemperature and velocity profiles in the centre of the left-hand siderooms along the height of the building using three mesh densitiesare shown in Fig. 3a and b respectively. It can be seen from Fig. 3,there is very small difference less than 1% among the resultsobtained using the three meshes. Considering both accuracy andcomputational time, it was decided that Mesh2 (812 k hexahedralcells) is fine enough to accurately predict volume flow rate, airflowpatterns and temperature distributions in the building. It tookabout 10,000 iterations for the cases simulated with a mesh size of812,000 cells to meet the convergence criteria.
4. Results and discussion
4.1. Validation of the CFD model
The CFD model used in this work was validated by comparingthe CFD predictions against the experimental measurements in ourrecent studies during the evaluation of various turbulence modelsfor the prediction of the airflow and temperature distributions inatria and validation of numerical modelling of conditions in anatrium space with a hybrid ventilation system in the Engineeringbuilding of the Concordia University, Montreal, and an the atriumbuilding in Ottawa, Canada i.e., see Refs. [30e34]. A close agree-ment was found between the CFD predictions and experimentalmeasurements which successfully demonstrate the ability of theCFDmodel used to accurately predict three-dimensional buoyancy-driven displacement ventilation flows in multi-storey spaces con-nected to a common atrium.
4.2. Selection of geometry
Various geometrical configurations of the atrium space ofa simple atrium building designated as Cases-A, B, C, D, E and F.shown in Fig. 1 were simulated to select a more appropriategeometry and explore the use of solar-assisted buoyancy-drivennatural ventilation in summer. A series of CFD simulations were runfor all of the cases considered under the same boundary conditionsat 13:00 h on 15th July 2010 with an ambient temperature of29.7 �C i.e., a typical hot day and time during summer in the regionconsidered. For the comparison of various geometries, thebuoyancy-driven natural ventilation volume flow rates at air inletsand temperature (�C) values at 1.1 m above the floors in the centreof each room on the east-end side of the building and in the atriumspacewere calculated and the results are shown in Table 3. It is seenthat due to the symmetry of the building, the results for the eastand west-end rooms are approximately the same and with theincrease of the glazing area, the ventilation volume flow rate andtemperature values increase as a result of more solar heat gain.Cases-A and B have similar geometry but Case-B has more glazingarea and has shown better ventilation flow rates. Similarly Case-Fwith higher glazing area has shown higher flow rates andtemperature values. Cases-C, D and E have shown approximatelysimilar performance. However, it was observed that for Case-C witha dome-shaped roof and where the location of the exhausts islowered by 2 m, the ventilation flow rate in the upper storey isreduced considerably due to a reduction in the buoyancy forces.This was compensated by increasing the inlet size of the upper
storey from 0.41 m2 to 0.51 m2. Similarly for Cases-D, E and F, theintegration of atrium space with a solar chimney was tested and itwas noted that this option also affects the ventilation flow rates inthe upper storey which was also compensated by increasing thearea of inlets from 0.41 m2 to 0.51 m2. To observe the effect of solarheat flux, the contours of solar heat flux on the facade and walls ofthe atrium for geometry Case-A are shown in Fig. 4. In order toobserve the airflow patterns and temperature distribution for all ofthe cases considered, the qualitative results indicating thetemperature and velocity contours in the middle plane parallel tothe facade glass surface along the height of the building are shownin Figs. 5 and 6respectively.
From the results obtained, it was found that all the geometriesconsidered have shown good performance. However, taking intoaccount other factors i.e., simplicity, night ventilation, winterheating, overheating during summer and heat loss, the geometry ofCase-5 integrated with a combination of atrium and solar chimneywas selected as a base case for reference for further investigationsto seek the effect of various geometric and solar parameters on theperformance of the atrium building.
4.3. Parametric study
Due to the dynamic nature of climatic conditions and the effectof various architectural-design elements, selection of the specifi-cations for energy-efficient buildings is highly uncertain. Thus, anymathematical approach requires a parametric study to quantify theeffect of various parameters to explore and understand the mech-anism controlling the performance of the building. To cover all theclimatic parameters and perform optimization is beyond the scopeof the present study. Hence in this study attention is focused onlyon the use of solar energy to induce buoyancy-driven naturalventilation in an atrium building and to investigate the effect of the
main parameters influencing the performance of the atrium space,solar chimney and their solar interactions. The most influentialparameters can be catagorised as geometrical (e.g. atrium height,atriumwidth, chimney height and width), construction (e.g. type ofglass) and solar (e.g. solar intensity, radiation properties andshading). The parameters selected were varied one by one usingthree values of each parameter in a certain range with some vari-ations from the basic design specifications selected to determinethe sensitivity of the building’s performance against each param-eter. Some indicative results are presented in this section regardingthe effect of these parameters on the performance of the building.The effect of each input parameter was examined in terms of fouroutput performance parameters: ventilation volume flow rate ateach inlet, temperature value in the centre of each occupied spaceat 1.1 m above each floor, predictedmean vote (PMV) and predictedpercent dissatisfied (PPD) (thermal comfort indices) for seatedactivity in the centre of occupied zones.
4.3.1. Calculation of volume flow rates and temperaturesA series of CFD simulations was run to obtain results for the
atmospheric conditions at 13:00 h on 15th July 2010 with an
Fig. 5. Temperature contours in the middle plane parallel to the facade gla
ambient temperature of 29.7 �C and a relative humidity of 44% inthe region of Montreal, Canada. At the air flow inlets, volume flowrates were calculated and local values of temperatures in thecentre of each occupied area at 1.1 m above each floor weredetermined in response to each input parameter. The resultsobtained for the geometric and solar parameters considered areshown in Tables 4 and 5 where numbers 1, 2, 3 and 4 representthe ground floor, the first floor, the second floor and the atriumfloor respectively. From the results obtained, it was observed thatfor the variation in values of the input parameters in the rangeselected, there is an increase or decrease in the air flow rates from2 to 10% and a small change in the values of temperatures wasnoticed. The increase of glazing area has a positive effect on thevolume flow rates but also causes an increase in the insidetemperature values. The height of air flow inlets from floors at0.6 m has a relatively better effect on the volume flow rates butthere is not any significant difference in temperature values. Theintensity of the solar heat flux is the motive force for the opera-tion of the solar chimney and atrium configuration and is thus themost determinant factor for the building performance. The airflow rate was found to rise with the increase in solar heat flux. The
ss surface for all the cases considered along the height of the building.
Fig. 6. Velocity contours in the middle plane parallel to the façade glass surface for all the cases considered along the height of the building.
glazing type (glazing properties and shading) also affects thevolume flow rate, increase in the values of the glazing properties(transmissivity and absorptivity) was found to increase theinduced airflow rates of the buoyancy-driven ventilation andcorresponding changes in the temperature distributions in thebuilding.
4.3.2. Calculation of the thermal comfort indicesThe performance indicators for the analysis of the various
geometric and solar parameters in terms of the thermal comfortindices (i) predictedmean vote (PMV) and (ii) predicted percentagedissatisfied (PPD) are calculated in this section. The PMV and PPDare calculated from six basic variables: activity, clothing, airtemperature, air velocity, mean radiant temperature (MRT) andhumidity for air-conditioned building [25]. In the present work, thevalues of the variables for the activity (metabolic rate) and
clothing (ensemble insulation) were determined from ASHRAEFundamentals [25]. Air temperatures and air velocities weredetermined from CFD simulations. Mean radiant temperatureswere calculated using the relationship between dry bulb temper-ature (DBT) and mean radiant temperature (MRT) [26]. The indicesused in the present study are the traditional PMV index and theextended index PMVNV [28], the last one being more appropriatefor the present case of naturally ventilated building, as stated inIntroduction. The PMVNV model is based on the expectancy factor,e, which is assumed to depend on the habitat of the occupant. Forfurther details about the extended PMV model, the reader isreferred to Fanger and Toftum [28]. In the present calculations,the expectancy factor 0.8 was estimated for the region underconsideration.
The values of activity, metabolic rate (W/m2) for seated a person,clothing (clo) and relative humiditywere selected 0, 60, 0.5 and 44%
Table 4Effect of geometric variations on the volume flow rates and inside temperature values at 1.1 m from each floor.
Geometric input parameters Output parameters
Parameters Values Volume flow rate (m3/s) Average temperatures (�C) at 1.1 m from floor
1 2 3 4 1 2 3 4
Depth of atrium 6 ma 0.42 0.42 0.40 0.80 33.31 32.39 32.68 33.938 m 0.44 0.44 0.42 0.82 33.42 32.64 32.86 33.9610 m 0.47 0.47 0.45 0.85 33.53 33.27 33.06 34.21
Width of atrium 4 m 0.40 0.41 0.40 0.74 32.24 33.03 33.1 33.475 ma 0.42 0.42 0.40 0.80 33.61 32.39 32.68 33.936 m 0.45 0.46 0.43 0.78 32.9 33.45 33.34 33.55
Chimney height 2 m 0.33 0.32 0.31 0.62 31.6 33.16 33.16 31.694 ma 0.42 0.42 0.40 0.80 33.61 32.39 32.68 33.936 m 0.45 0.47 0.50 0.85 33.38 32.99 31.95 33.45
Chimney width 1 m 0.41 0.41 0.39 0.76 33.42 32.15 32.43 33.762 ma 0.42 0.42 0.40 0.80 33.61 32.39 32.68 33.933 m 0.44 0.45 0.43 0.82 33.82 33.46 33.14 34.21
respectively and air temperatures and velocities (V) in the area ofinterest were determined from CFD simulations to calculate thevalues of PMV and PPD for the evaluation of the thermal comfortconditions in the occupied areas of all the floors in the buildingwith respect to three values of each parameter considered. Thevalues of the PMV and PPD (%) were calculated in the centre of theoccupied area at the height of 0.6 m from each floor for seatedactivity using the JAVA applet ISO 7730 computer program [27]. Tocalculate the PMVnv and PPDnv for natural ventilation, the expec-tancy factor 0.8 was used [28]. The results obtained for the PMVnvand PPDnv indices in each floor for seated activity are shown inTables 6 and 7. The effect of each parameter on the building’sperformance in terms of PPD (%) is presented graphically in Figs. 7and 8 and is discussed in the next section.
Table 5Effect of climatic variations on the volume flow rates and inside temperature values at 1
Climatic input parameters Output parameters
Parameters Values Volume flow rate (m3/s)
1 2 3
Solar intensity 7:00 h 0.45 0.43 0.413:00 ha 0.42 0.42 0.418:00 h 0.35 0.34 0.3
1- Ground floor, 2- First floor, 3- Second floor, 4- Atrium floor.a Base case.
4.3.3. Effect of various parameters on the performance of thebuilding4.3.3.1. Effect of atrium depth and width. From the results obtainedshown in Table 4 it is seen that with the increase of atrium depth by2 m, the volume flow increases only by 4% and there is a smallincrease in temperature values at all floors. Similarly an increase inatrium width by 1 m causes a 4% increase in volume flow rates.Table 6 shows the effect of the atrium depth and width on thePMVnv and PPDnv values in centre of the occupied area in each floorof the building for seated activity. It is seen that with the selectedvalues of the atrium depth and width, the value of PMVnv wasfound to be in the range �0.20 to �0.50 (corresponding to neutralcomfortable) for the ground, first and atrium floors and �0.54to �0.65 (slightly cool, acceptable) for the second floor. The PPDnv
(%) values indicate that only 6.5e9.8% people are not satisfied withthe thermal conditions on the ground, first and atrium floors but onthe second floor 11e14% people are dissatisfied with the thermalconditions. Overall thermal conditions prevailing in the buildingwith buoyancy-driven ventilation within the selected range ofatrium depth and width are satisfactory. From these values, itwas noted that relative atrium depth of 6 m and a width 5 m arefeasible for the design specifications of the atrium space underconsideration.
4.3.3.2. Effect of chimney height and width. From Table 4 it can beseen that with the increase of chimney height from 2 m to 4 m, thevolume flow rate increases by 30% on all floors and from 4 m to 6 mcaused an increase by 7% on the ground, first and atrium floors and30% on the second floor while there is a small increase in temper-ature values at all floors. Whereas an increase in chimney width by
Table 7Calculations of PMV and PPD for geometric parameters at 0.6 m above each floor in the
Input parameters Output parameters
Parameters Values PMVNV (at 0.6 m above floor)
1 2 3
Solar intensity 7:00 h �0.33 �0.46 �0.13:00 h �0.32 �0.37 �0.18:00 h �0.50 �0.64 �0.
1 m causes an increase only by 4% at all floors. Table 6 shows theeffect of the chimney height and width on the PMVnv and PPDnvvalues in the centre of the occupied area of each floor of thebuilding for seated activity. It is seen that with the selected valuesof the chimney height and width, the value of PMVnv was found tobe in the range �0.20 to �0.48 (corresponding to neutralcomfortable) for the ground, first and atrium floors and �0.65 to75(slightly cool, acceptable) for the second floor. The PPDnv (%)values indicate that 6.5e9.7% people are not satisfied with thethermal conditions on the ground, first and atrium floors but on thesecond floor of 16% people are dissatisfied with the thermalconditions. For the selected values of chimney height and width,thermal conditions prevailing in the building due to buoyancy-driven ventilation are satisfactory. From these values, it wasnoted that relative chimney height of 6 m and width of 2 m aremore feasible for the design specifications of the chimney used.
PPD (%) values for seated persons in the centre of
each room
4
6
8
10
12
14
16
Ground floor First floor Second floor Atrium floor
PP
D (%
) v
alu
es
Atrium width 4m
Atrium width 5m
Atrium width 6m
PPD (%) values for seated persons in the centre of
each room
4
6
8
10
12
14
16
Ground floor First floor Second floor Atrium floor
PP
D (%
) v
alu
es
Atrium depth 6m
Atrium depth 8m
Atrium depth 10m
PPD (%) values for seated persons in the centre of
each room
4
6
8
10
12
14
16
Ground floor First floor Second floor Atrium floor
PP
D (%
) valu
es
Chimney height 2m
Chimney height 4m
Chimney height 6m
PPD (%) values for seated persons in the centre of
each room
4
6
8
10
12
14
16
18
Ground floor First floor Second floor Atrium floor
PP
D (%
) v
alu
es
Chimney width 1m
Chimney width 2m
Chimney width 3m
PPD (%) values for seated persons in the centre of
each room
4
6
8
10
12
14
16
Ground floor First floor Second floor Atrium floor
PP
D (%
) valu
es
Inlets above floor 0m
Inlets above floor 0.6m
Inlets above floor 1.2m
PPD (%) values for seated persons in the centre of
each room
4
6
8
10
12
14
16
18
Ground floor First floor Second floor Atrium floor
PP
D (%
) v
alu
es
Glazing area 68 m2
Glazing area 107 m2
Glazing area 118 m2
a b
c d
e f
Fig. 7. Effect of the atrium width (a) atrium depth (b) chimney width (c) chimney height (d) location of inlets (e) and glazing area (f) on PPD (%) values for seated persons in thecentre of each occupied floor of the building.
4.3.3.3. Effect of glazing area and location of inlets. Table 4 showsthat with the increase of glazing area in the selected range, thevolume flow rate increases by 4% and there is small increase intemperature values at all floors while location of inlets within theselected range has no any considerable effect on the volume flowrates. Table 6 shows the effect of the glazing area and location ofinlets on the PMVnv and PPDnv values in centre of the occupied areaof the each floor of the building for seated activity. It is seen thatwithin the selected values of the glazing area and location of inlets,the value of PMVnv is found to be in the range �0.16 to �0.46(corresponding to neutral comfortable) for the ground, first andatrium floors and �0.37 to �0.65 (neutral and slightly cool,acceptable) for the second floor. The PPDnv (%) values indicate that
only 5.4e9.4% people are not satisfied with the thermal conditionson the ground, first and atrium floors but on the second floor8.1e14% people are dissatisfied with the thermal conditions. For theselected values of the glazing area and location of inlets, thethermal conditions prevailing in the building with buoyancy-driven ventilation within the selected range were foundsatisfactory.
4.3.3.4. Effect of the solar intensity and shading. The intensity of thesolar heat flux is the motive force for the operation of the solarchimney and atrium configuration and is thus the most determi-nant factor for the building performance. The air flow rate wasfound to rise with the increase in solar heat flux. From Table 5 it is
PPD (%) values for seated persons in the centre of each
room
4
6
8
10
12
14
16
18
Ground floor First floor Second floor Atrium floor
PP
D (%
) v
alu
es
At 7:00 hr
At 13:00 hrs
At 18:00hrs
PPD (%) values for seated persons at the centre of
each room
PPD (%) values for seated persons at the centre of
each room
4
6
8
10
12
14
16
18
20
Ground floor First floor Second floor Atrium floor
PP
D (%
) valu
es
Blinds open Blind half open Blinds closed
PPD values for seated persons in centre of each room
4
6
8
10
12
14
16
18
Ground floor First floor Second floor Atrium floor
PP
D (%
) valu
es
Emisivity 0.4
Emissivity 0.8
Emissivity 1.0
4
6
8
10
12
14
16
18
Ground floor First floor Second floor Atrium floor
PP
D (%
) v
alu
es
Transmissivity 0.16
Transmissivity 0.36
Transmissivity 0.56
PPD (%) values for seated persons in the centre of
each room
4
6
8
10
12
14
16
Ground floor First floor Second floor Atrium floor
PP
D (%
)
Absorptivity 0.075
Absorptivity 0.175
Absorptivity 0.375
a b
c d
e
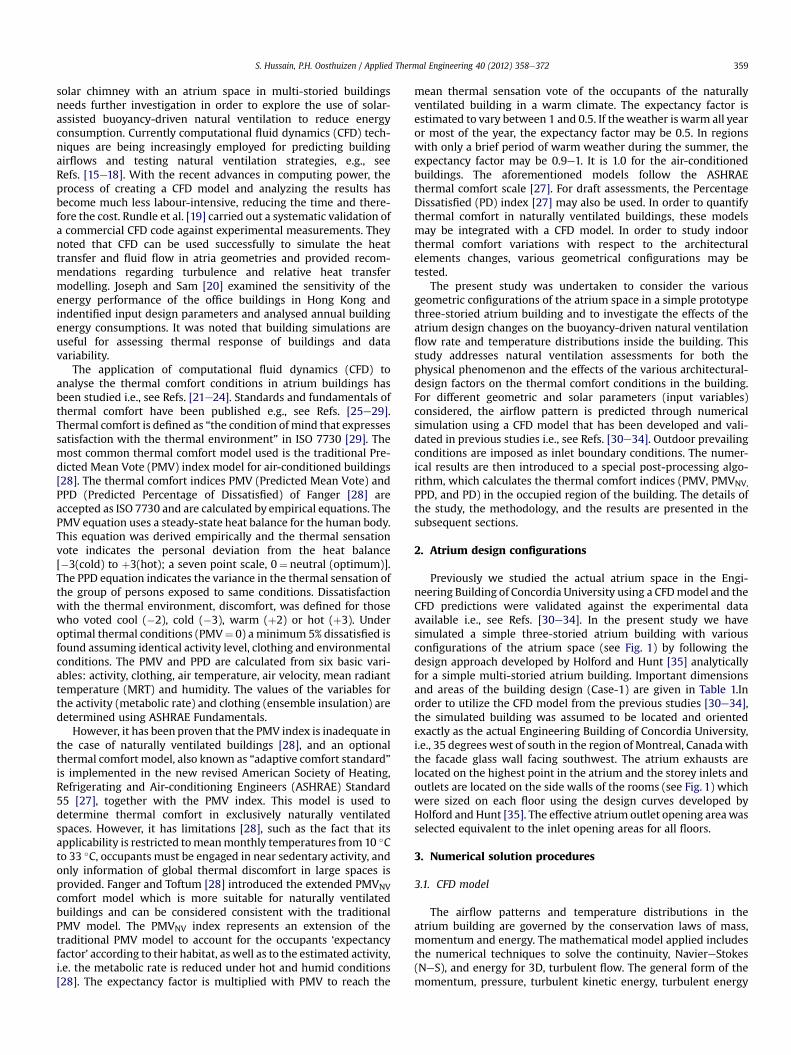
Fig. 8. Effect of the solar intensity (a) shading (b) emissivity (c) transmissivity (d) and absorptivity (e) on PPD (%) values for seated persons in the centre of each occupied floor of thebuilding.
seen that the volume flow rate calculated at 13:00 h is decreased byapproximately 20% when calculated at 18:00 h at all floors. Simi-larly the volume flow decreases by almost 24% when blinds posi-tioned inside the glass surfaces are closed. Table 7 shows the effectof the solar intensity on the PMVnv and PPDnv values in centre of theoccupied area of the each floor of the building for seated activity. Itis seen that for the solar intensity at 7:00 h and 13:00 h, the value ofPMVnv is found to be in the range�0.20 to�0.32 (corresponding toneutral comfortable) for the ground, first and atrium floorsand �0.68 (slightly cool, acceptable) for second floor while at18:00 h the value of PMVnv is found to be �0.50 to �0.64 (slightlycool, acceptable) for ground, first and atrium floors and �0.75(slightly cool, acceptable) for the second floor. The PPDnv (%) valuesindicate that 6.5e9.5% people are not satisfied with the thermalconditions at 7:00 h and 13:00 h, on the ground, first and atrium
floors but on the second floor 14% people are dissatisfied with thethermal conditions. The PPDnv (%) values calculated at 18:00 hindicate that 10e14% people are not satisfied with the thermalconditions on the ground, first and atrium floors but on the secondfloor 16% people are dissatisfied with the thermal conditions.
From Table 5 it is seen that that when blinds are closed, thevolume air flow rate is reduced by 20%. Table 7 shows the effect ofthe blind positions on the PMVnv and PPDnv values in centre of theoccupied area of the each floor of the building for seated activity. Itis seen that for the blinds open, value of PMVnv is found to be in therange �0.20 to �0.37 (corresponding to neutral comfortable) forground, first and atrium floors and �0.65 (slightly cool, acceptable)for second floor while when blinds are half-open or closed, thevalue of PMVnv is found to be �0.43 to �0.47 (corresponding toneutral comfortable) for atrium floor and �0.56 to �0.80 (slightly
cool, acceptable) for ground, first and second floors. The PPDnv (%)values indicate that 6.5e14% people are not satisfied with thethermal conditions on all the floors when blinds are open whilewhen blinds are half-open or closed, 9% people are not satisfied inthe atrium space and 11e18% are not satisfied on other floors.
4.3.3.5. Effect of the glazing properties. Glazing properties haveremarkable effect on theperformance of the building. FromTable 5 itwas noted that with the increase in the value of transmissivity by0.20, theflowrate increases byapproximately 15%.With the increaseof absorptivity in the selected range, the volume flow rate increasesby 4% while increase of emissivity from 0.8 to 1.0 causes decrease involume flow rate approximately 16%. Table 7 shows the effect ofglazing properties on the PMVnv and PPDnv values in centre of theoccupied area of the each floor of the building for seated activity. It isseen that for the values transmissivity, absorptivity and emissivity0.16, 0.075 and 1.0 respectively, the calculated values of PMVnv arefound to be in the range�0.40 to�0.75 (slightly cool, acceptable) forall the floors. For other values of the glazing properties the values ofPMVNVare found to be in the range�0.02 to�0.45 (corresponding toneutral comfortable) for ground, first and atrium floors while�0.67for second floors. Similarly for the transmissivity, absorptivity andemissivity values of 0.16, 0.075 and 1.0 respectively the PPDnv (%)values are found to be 8e17% for all the floors and for other values ofthe glazing properties PPDNV values are 5e9.2% for ground, first andatrium floors while 14% for second floors.
From these values, it was noted that the glazing materialproperties; transmissivity, absorptivity and emissivity with valuesof 0.36, 0.175 and 0.8 respectively used for the reference case arefeasible for the design specifications of the glazing material.
4.4. Evaluationof thermal comfort conditions in thebuilding (Case-5)
4.4.1. Calculation of thermal comfort indicesThe thermal comfort conditions in the building for geometry
Case-5 were evaluated using the thermal comfort indices. Thevalues of the air temperatures and velocities (V) in the area ofinterest were determined from CFD simulations. The values of thePMVNV and PPDNV (%) were calculated in the occupied area alongthe horizontal plane at nine points (x¼ 1, 3, 5 and z¼ 1, 3, 5) forseated activity at 0.6 m above each floor using the JAVA appletISO 7730 computer program. The values of activity, metabolic rate(W/m2), clothing (clo) and relative humiditywere selected 0, 60, 0.5
Table 8Calculations of PMVNV and PPDNV at 0.6 m above each floor in the occupied area of each
and 44% respectively with an expectancy factor of 0.8 in thecalculations of PMVNV and PPDNV indices and the results are shownin Table 8aed. From the results obtained, it is seen that that forselected points in the occupied area on the ground, first and atriumfloors the value of PMVnv is found to be in the range�0.20 to�0.50(corresponding to neutral comfortable) for the ground, first andatrium floors and �0.65 to �0.72 (slightly cool, acceptable) for thesecond floor. The PPDnv (%) values indicate that only 6.5e11%people are not satisfied with the thermal conditions on the ground,first and atrium floors but on the second floor 14e16% people aredissatisfied with the thermal conditions. It was noticed that overallthermal conditions prevailing in the building due to use of solar-assisted buoyancy-driven ventilation are in the comfortable zone.
4.4.2. Discomfort due to draftTo calculate the risk of thermal discomfort due to draft in the
building, the thermal comfort empirical equation, Percentage ofDissatisfied (PD) of Fanger [28] is normally used which is acceptedas ISO 7730 [29].
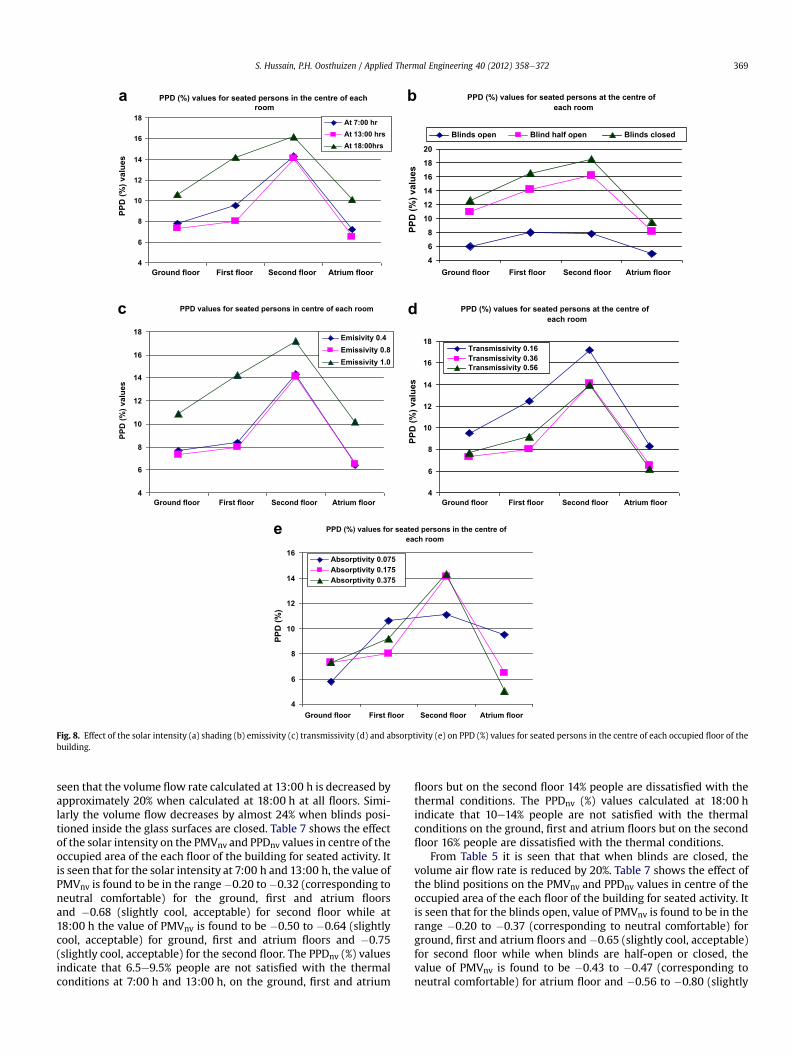
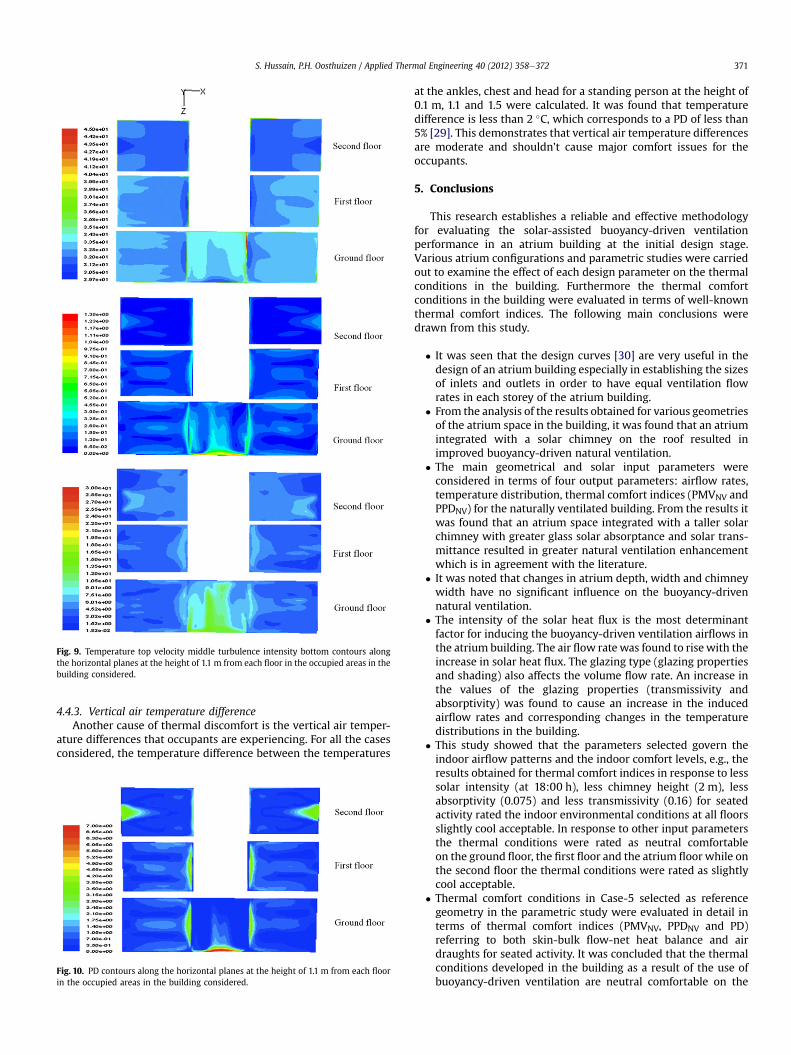
This equation requires the values of three parameters; velocity(V), air temperature (Ta) and turbulence intensity (Tu) to be known.These parameters were evaluated at a height of 0.6 m, which coversthe head, neck, and shoulder region of a seated person. Fig. 9 showsthe contours of the three required parameters obtained throughCFD simulations over a horizontal plane at 0.6 m above each floor inthe occupied areas of the building. Using the values of the velocity,air temperature and turbulence intensity from the contours shownin Fig. 9 Eq. (4) was solved and the resulting contours of Percentdissatisfied (PD) factor over the region considered are displayed inFig. 10.
From Fig. 10 it is seen that near the air flow inlets of the building,due to both low temperatures and high velocities, the PD values arehigher. However, in the whole region of the occupied area of eachfloor, the PD values lie in the range of 2e7%. The calculated values ofthe PD indicate that due to draft the thermal conditions in theoccupied area of the rooms and atrium space ventilated by solar-assisted buoyancy-driven airflow are in comfortable zone. The PDvalues show that less than 7% of the occupants are expected toexpress dissatisfaction due to draft.
Fig. 9. Temperature top velocity middle turbulence intensity bottom contours alongthe horizontal planes at the height of 1.1 m from each floor in the occupied areas in thebuilding considered.
4.4.3. Vertical air temperature differenceAnother cause of thermal discomfort is the vertical air temper-
ature differences that occupants are experiencing. For all the casesconsidered, the temperature difference between the temperatures
Fig. 10. PD contours along the horizontal planes at the height of 1.1 m from each floorin the occupied areas in the building considered.
at the ankles, chest and head for a standing person at the height of0.1 m, 1.1 and 1.5 were calculated. It was found that temperaturedifference is less than 2 �C, which corresponds to a PD of less than5% [29]. This demonstrates that vertical air temperature differencesare moderate and shouldn’t cause major comfort issues for theoccupants.
5. Conclusions
This research establishes a reliable and effective methodologyfor evaluating the solar-assisted buoyancy-driven ventilationperformance in an atrium building at the initial design stage.Various atrium configurations and parametric studies were carriedout to examine the effect of each design parameter on the thermalconditions in the building. Furthermore the thermal comfortconditions in the building were evaluated in terms of well-knownthermal comfort indices. The following main conclusions weredrawn from this study.
� It was seen that the design curves [30] are very useful in thedesign of an atrium building especially in establishing the sizesof inlets and outlets in order to have equal ventilation flowrates in each storey of the atrium building.
� From the analysis of the results obtained for various geometriesof the atrium space in the building, it was found that an atriumintegrated with a solar chimney on the roof resulted inimproved buoyancy-driven natural ventilation.
� The main geometrical and solar input parameters wereconsidered in terms of four output parameters: airflow rates,temperature distribution, thermal comfort indices (PMVNV andPPDNV) for the naturally ventilated building. From the results itwas found that an atrium space integrated with a taller solarchimney with greater glass solar absorptance and solar trans-mittance resulted in greater natural ventilation enhancementwhich is in agreement with the literature.
� It was noted that changes in atrium depth, width and chimneywidth have no significant influence on the buoyancy-drivennatural ventilation.
� The intensity of the solar heat flux is the most determinantfactor for inducing the buoyancy-driven ventilation airflows inthe atrium building. The air flow rate was found to rise with theincrease in solar heat flux. The glazing type (glazing propertiesand shading) also affects the volume flow rate. An increase inthe values of the glazing properties (transmissivity andabsorptivity) was found to cause an increase in the inducedairflow rates and corresponding changes in the temperaturedistributions in the building.
� This study showed that the parameters selected govern theindoor airflow patterns and the indoor comfort levels, e.g., theresults obtained for thermal comfort indices in response to lesssolar intensity (at 18:00 h), less chimney height (2 m), lessabsorptivity (0.075) and less transmissivity (0.16) for seatedactivity rated the indoor environmental conditions at all floorsslightly cool acceptable. In response to other input parametersthe thermal conditions were rated as neutral comfortableon the ground floor, the first floor and the atrium floor while onthe second floor the thermal conditions were rated as slightlycool acceptable.
� Thermal comfort conditions in Case-5 selected as referencegeometry in the parametric study were evaluated in detail interms of thermal comfort indices (PMVNV, PPDNV and PD)referring to both skin-bulk flow-net heat balance and airdraughts for seated activity. It was concluded that the thermalconditions developed in the building as a result of the use ofbuoyancy-driven ventilation are neutral comfortable on the
ground floor, the first floor and the atrium floor while on thesecond floor they are slightly cool acceptable.
� The results of this study can be considered at the initial designstage of an energy-efficient atrium building in order to obtaina comfortable indoor thermal environment. Based on thisstudy, future research will include wind speed and otherclimatic factors.
Overall, the proposed methodology provides a useful procedureto quantify architectural-design effects on indoor thermal comfort.Probably, more accurate results could have been obtained by per-forming either unsteady RANS or LES simulations. However, due tothe demand of a relatively large database, more computer intensiveCFD simulations would lead to prohibitive computational costs forpractical engineering applications, and the steady-state approach isconsidered at present adequate for this study. It should bementioned that the methodology introduced is general and it canmeet thermal comfort estimations produced by either turbulencemodelling or experimental measurements.
Acknowledgements
This work was supported by the Natural Sciences and Engi-neering Research Council of Canada (NSERC).
References
[1] A. Moser, F. Off, A. Schalin, X. Yuan, Numerical modeling of heat transfer byradiation and convection in an atrium with thermal inertia, ASHRAE Trans-actions 101 (2) (1995) 1136e1143.
[2] N. Takahachi, E. Iwata, M. Funatsu, Simulation and evaluation of the envi-ronment of a large-scale atrium, in: Proceedings of Room Air Convection andVentilation Effectiveness, Tokyo (1992), pp. 511e515.
[3] B. Zhao, X. Li, Q. Yan, A simplified system for indoor airflow simulation,Building and Environment 38 (2003) 543e552.
[4] Yiqun Pan, Gang Wu, Fujan Yang, Zhizhong Huang, CFD and daylight simu-lation calibrated with site measurement for waiting hall of Shanghai southrailway station, in: Third National Conference of IBPSA Berkeley, California,July 30eAugust 1, 2008.
[5] P.H. Oosthuizen, M. Lightstone, Numerical analysis of the flow and tempera-ture distributions in an atrium, in: Proceedings of the Int. Conference onComputational Methods for Energy Engineering and Environment-ICCM3E,Sousse, 20e22 November 2009.
[6] Y. Ji, M.J. Cook, V. Hanby, CFD modelling of natural displacement ventilation inan enclosure connected to an atrium, Building and Environment 42 (2007)1158e1172.
[7] Y. Ji, M.J. Cook, Numerical studies of displacement natural ventilation in multi-storey buildings connected to an atrium, Building Services EngineeringResearch and Technology 28 (3) (2007) 207e222.
[8] K.H. Lee, R.K. Strand, Enhancement of natural of natural ventilation in build-ings using a thermal chimney, Energy and Buildings 41 (2009) 615e621.
[9] G. Guohui, Simulation of buoyancy induced flow in open cavities for naturalventilation, Energy and Buildings 38 (2006) 410e420.
[10] T. Josef, H. Vitaly, H. Meir, Airflow and heat flux through the vertical openingof buoyancy-induced naturally ventilated enclosures, Energy and Buildings 40(2008) 637e646.
[11] J.L. Kevin, Architectural design of an advanced naturally ventilated buildingform, Energy and Buildings 39 (2007) 166e181.
[12] P.F. Linden, P. Cooper, Multiple sources of buoyancy in a naturally ventilatedenclosure, Journal of Fluid Mechanics 311 (1996) 177e192.
[13] A. Tahir, Y. Osman, Investigating the potential use of natural ventilation innew building design, Energy and Buildings 38 (2005) 959e963.
[14] S. Walker, H. Manchanda, L. Spindler, Building performance: analysis ofnaturally ventilated UK Office Building, in: Proceedings of RoomVent (2004)Coimbra, Portugal.
[15] P.C. Liu, H.T. Lin, J.H. Chou, Evaluation of buoyancy-driven ventilation inatrium buildings using computational fluid dynamics and reduced-scale airmodel, Building and Environment 44 (2009) 1970e1979.
[16] M.J. Cook, Y. Ji, G.R. Hun, CFD modeling of natural ventilation: combinedwind and buoyancy forces, International Journal of Ventilation 1 (2003)169e180.
[17] Z. Zhai, Q. Chen, Sensitivity analysis and application guides for integratedbuilding energy and CFD simulation, Energy and Buildings 38 (9) (2006)1060e1068.
[18] M.J. Cook, K.L. Lomas, Buoyancy-driven displacement ventilation flows:evaluation of two eddy viscosity models for prediction, Building ServicesEngineering Research and Technology 19 (1998) 15e21.
[19] C.A. Rundle, M.F. Lightstone, P.H. Oosthuizen, P. Karava, E. Mouriki, Validationof computational fluid dynamics simulations for atria geometries, Buildingand Environment 46 (2011) 1343e1353.
[20] C.L. Joseph, C.H. Sam, Sensitivity analysis of energy performance of officebuildings, Building and Environment 31 (1996) 27e39.
[21] A. Atif, D. Claridge, Atrium buildings, thermal performance and climaticfactors, ASHRAE Transactions 101 (1) (1995) 454e460.
[22] M. Kavgic, D. Mumovic, Z. Stevanovic, A. Young, Analysis of thermal comfortand indoor air quality in a mechanically ventilated theatre, Energy andBuildings 40 (2008) 1334e1343.
[23] R. Li, Adrian, Thermal comfort and environmental modeling in atrium build-ings, in: PLEA2006 e 23rd Conference on passive and low energy architecture,Geneva, Switzerland, 6e8 September 2006.
[24] K.W.D. Cheong, E. Djunaedy, Y.L. Chua, K.W. Tham, S.C. Sekhar, N.H. Wong,M.B. Ullah, Thermal comfort of an air-conditioned lecture theatre in thetropics, Building and Environment 38 (2003) 63e73.
[25] ASHRAE, ASHRAE Handbook Fundamentals, American Society of Heating,Refrigerating and Air- Conditioning Engineers, Atlanta, USA, 1997.
[26] URL: www.healthyheating.com.[27] URL: http://www.eat.lth.se/fileadmin/eat/Termisk_miljoe/PMV-PPD.html.[28] P.O. Fanger, J. Toftum, Extension of the PMV model to non-air-
conditioned buildings in warm climates, Energy and Buildings 34 (6)(2002) 533e536.
[29] ISO 7730, Moderate Thermal Environments e Determination of the PMV andPPD Indices and Specifications of the Conditions for Thermal Comfort, 2nd ed.,International Standards Organisation, Geneva, Ref no ISO 7730:1994 (E).
[30] S. Hussain, P.H. Oosthuizen, An evaluation of turbulence models for thenumerical study of flow and temperature distribution in atria, in: 18thAnnual Conference of the CFD Society of Canada, London Ontario, 17e19May 2010.
[31] S. Hussain, P.H. Oosthuizen, Validation of numerical study of flow andtemperature distribution in an atrium space, in: 19th Annual Conference ofthe CFD Society of Canada Montreal, Canada, 27e29 April 2011.
[32] S. Hussain, P.H. Oosthuizen, Numerical study of an atrium integrated withhybrid ventilation system, in: 23rd Canadian Congress of Applied Mechanics,Vancouver, BC, Canada, 5e9 June 2011.
[33] S. Hussain, P.H. Oosthuizen, Validation of numerical modeling of conditions inan atrium space with a hybrid ventilation system, Building and Environment(2012). doi:10.1016/j.buildenv.2011.12.016.
[34] S. Hussain, P.H. Oosthuizen, A. Kalendar, Evaluation of various turbulencemodels for the prediction of the airflow and temperature distributions inatria, Energy and Buildings (2012). doi:10.1016/j.enbuild.2012.01.004.
[35] J.M. Holford, G.R. Hunt, Fundamental atrium design for natural ventilation,Building and Environment 38 (2003) 409e426.
[36] J.A. Palyvos, A survey of wind convection coefficient correlations for buildingenvelope energy systems, modeling, Applied and Thermal Engineering 28(2008) 801e810.
[37] A.F. Mills, Heat Transfer, second ed. Prentice Hall, New Jersey, 1999, pp.570e572.
[38] R. Bassiouny, S.A. Koura, Analytical and numerical study of solar chimney usefor room natural ventilation, Energy and Buildings 40 (2008) 865e873.