Numerical MHD modelling of waves in solar coronal loops. Petr Jel ínek 1 and Marian Karlický 2. 1 University of South Bohemia, Department of Physics České Budějovice 2 Astronomical Institute, Academy of Sciences of the Czech Republic Ondřejov. Outline. Motivation of numerical studies - PowerPoint PPT Presentation
40
Numerical MHD modelling of waves in solar coronal loops Petr Jel ínek 1 and Marian Karlický 2 1 University of South Bohemia, Department of Physics České Budějovice 2 Astronomical Institute, Academy of Sciences of the Czech Republic Ondřejov
Transcript
Numerical MHD modelling of waves in solar coronal loops
Petr Jelínek1 and Marian Karlický2
1University of South Bohemia, Department of PhysicsČeské Budějovice
2Astronomical Institute, Academy of Sciences of the Czech Republic Ondřejov
Outline Motivation of numerical studies
Equations of magnetohydrodynamics (MHD)
Numerical methods & solutions
Results 1D model – impulsively generated acoustic waves 1D model – gravitational stratification 2D model – impulsively generated acoustic waves 2D model – modelling of wavetrains
Conclusions
Motivation of numerical studies – I.
Oscillations in solar coronal loops have been observed for a few decades
The importance of such oscillations lies in their potential for the diagnostics of solar coronal structure (magnetic field, gas density, etc.)
The various oscillation modes in coronal loops were observed with highly sensitive instruments such as SUMER (SoHO), TRACE
The observed oscillations include propagating and slow magnetosonic waves. There are also observations of fast magnetosonic waves, kink and sausage modes of waves
Motivation of numerical studies – II. Coronal loop oscillations were studied analytically but these studies
are unfortunately applicable only onto highly idealised situations
The numerical simulations are often used for solutions of more complex problems – these studies are based on numerical solution of the full set of MHD equations
Mentioned studies of coronal loop oscilla-tions are very important in connection with the problem of coronal heating, solar wind acceleration and many unsolved problems in solar physics
Magnetohydrodynamic coronal seismology is one of the main reasons for studying wa-ves in solar corona
MHD equations In our models we describe plasma dynamics in a coronal loop by
the ideal magnetohydrodynamic equations
The plasma energy density
The flux vector
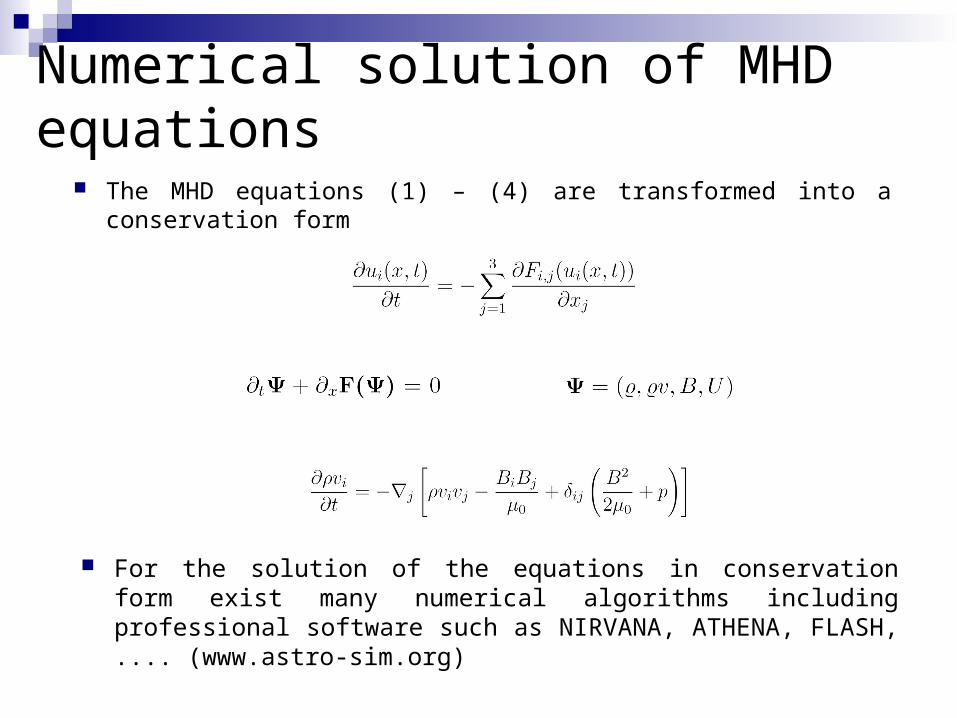
Numerical solution of MHD equations
The MHD equations (1) – (4) are transformed into a conservation form
For the solution of the equations in conservation form exist many numerical algorithms including professional software such as NIRVANA, ATHENA, FLASH, .... (www.astro-sim.org)
Numerical methods – I. There exist a lot of numerical methods used for the solution of
equations in conservation form in numerical mathematics
Generally we can use the two types of numerical methods explicit methods – calculate the state of a system at a later time from
the state of the system at the current time
easy to programming
unstable in many cases
implicit methods – find the solution by solving an equation involving both the current state of the system and the later one
unconditionally stable
difficult to programming (tridiagonal matrix; solution by Thomas algorithm)
Numerical methods – II. We use only explicit methods in our calculations for this reason we
must use the artificial smoothing for the stabilisation of the numerical scheme
Some mathematical definitions of numerical methods for PDEs Consistency – the numerical scheme is called consistent if
Convergence – the numerical method is called convergent if
Numerical methods – III.
For the solution of the MHD equations in a conservation form the methods of so-called flux limiters are used
These numerical methods are able to jump down the oscillations near sharp discontinuities and jumps
Generally, for the solution of PDE in conservation form in 1D we can write
Numerical methods – IV. Many authors often use the linear methods
upwind scheme
Lax-Wendroff scheme (downwind slope)
Beam-Warming scheme (upwind slope)
Fromm scheme (centered slope)
Numerical methods – V.
Numerical methods – VI. To avoid the “overshoots” we limit the slope by flux limiter
methods minmod
superbee
MC
van Leer
And many others – van Albada, OSPRE, UMIST, MUSCL schemes
Numerical methods – VII.
1D model of acoustic standing waves There exists a lot of types of oscillations in solar coronal loop
acoustic oscillations kink and sausage oscillations fast and slow propagating waves, ...
Acoustic oscillations are easy to simulate, they can be modelled in 1D, without magnetic field, etc.
Kink and sausage oscillations were directly observed (SOHO, TRACE) and there are many unanswered questions – excitation and damping mechanisms, etc.
We focused on the impulsively generated acoustic standing waves in coronal loops
1D model – initial conditions Initial condtitions
The length of the coronal loop was L = 50 Mm which corresponds to loop radius about 16 Mm.
The loop footpoints were settled at positions x = 0 and x = L
1D model – perturbations Perturbations
In the view of our interest to study impulsively generated waves in the solar coronal loops, we have launched a pulse in the pressure and mass density
The pulse had the following form
1D model – numerical solution The numerical region was covered by a uniform grid with 2 500
cells and open boundary conditions that allow a wave signal freely leave the region were applied
The time step used in our calculations satisfied the Courant-Friedrichs-Levy stability condition in the form
In order to stabilize of numerical methods we have used the artificial smoothing as the replacing all the variables at each grid point and after each full time step as
Results – 1D model
Time evolution of velocity v(x = L/4,t), mass density (x = L/4,t) (top panels) and spatial profiles of velocity v(x,t), v(x,7.12T1) (bottom panels); all for mass density contrast d = 108, pulse width w = L/40, and initial pulse position x0 = L/4.
Results – 1D model
Time evolution of velocity v(x = L/4,t), mass density (x = L/4,t) (top panels) and spatial profiles of velocity v(x,t), v(x,7.89T2) (bottom panels); all for mass density contrast d = 108, pulse width w = L/40, and initial pulse position x0=L/2.
Time evolution of velocity v(x = L/4,t), mass density (x = L/4,t) (top panels) and spatial profiles of velocity v(x,t), v(x,11.00T1) (bottom panels); all for mass density contrast d = 108, pulse width w = L/40, and initial pulse position x0 = L/50.
Results – 1D model
Time evolution of average pressure, increased by the factor 103, initial pulse position x0 = L/4 (left top panel), x0 = L/2 (right top panel) and x0 = L/50 (bottom panel), mass density contrast d = 108 and pulse width w = L/40; note that x-axis is in the logarithmic scale.
Results – 1D model
Results – 1D model
Fourier power spectra of velocities v for initial pulse position x0 = L/2 (left) and x0 = L/4 (right), mass density contrast d = 105 (top panels) and d = 108 (bottom panels) and pulse width w = L/40. The amplitude of the power spectrum A(P) is normalized to 1.
Results – 1D model
Time evolution of total (red), pressure (blue) and kinetic (green) energies for various positions in numerical box. Left upper panel – whole simulation region, left upper panel – “transition region”, bottom panel – “coronal region”. The
initial pulse position x0 = L/4, d = 108 and pulse width w = L/40.
Results – 1D model
Time evolution of total (red), pressure (blue) and kinetic (green) energies for various positions in numerical box. Left upper panel – whole simulation region, left upper panel – “transition region”, bottom panel – “coronal region”. The initial
pulse position x0 = L/2, d = 108 and pulse width w = L/40.
1D – gravitational stratification
To create more realistic model the gravitational stratification was added
We consider a semi-circular loop with the curvature radius RL, in this model we incorporate the effect of loop plane inclination the shift of circular loop centre from the baseline was omitted
1D – gravitational stratification – I.
The gravitational acceleration at a distance s measured from the footpoint along the loop, is
The MHD equation of motion has the following form
For the plasma pressure in the loop we can write
The temperature profile was calculated by means of this formula
1D – gravitational stratification – II.
The length of the coronal loop was L = 100 Mm in this case which corresponds to loop radius about 32 Mm.
The mass density was calculated from
Gravitational stratification – first results in 1D
Time evolution of velocity v(x = L/4,t), mass density contrast d = 102, pulse width w = L/80, and initial pulse position x0 = L/4 and x0 = L/2, inclination angle = 0° (blue line) and = 45° (red line).
2D modelling of magnetoacoustic standing waves We consider a coronal slab with a width w = 1Mm and mass density
i, embedded in a environment of mass density e
The pressure, mass density, temperature and initial pulses in pressure and mass density are calculated similarly as in 1D model
Numerical solution in 2D For the solution of 2D MHD equations the Lax-Wendroff numerical
scheme was used, this method is often used for the solutions of MHD by many authors
Step 1
Step 2
The stability condition
Results – 2D model
Time evolution of velocity v(x = L/4, y = 0, t) (left top panel). Spatial profile of x-component of velocity – vx at time t = 8.17 T1 (right top panel) and the corresponding slices of vx along y = H/2 (x = L/2) – bottom left (right) panel; all for mass density contrast d = 108, pulse width w = L/40, and initial pulse position x0 = L/2.
Results – 2D model
Time evolution of velocity v(x = L/4, y = 0, t) (left top panel). Spatial profile of x-component of velocity – vx at time t = 6.15 T2 (right top panel) and the corresponding slices of vx along y = H/2 (x = L/4) – bottom left (right) panel; all for mass density contrast d = 108, pulse width w = L/40, and initial pulse position x0 = L/4.
Modelling of wave trains in 2D The wave trains were directly observed and discovered by SECIS
(Solar Eclipse Coronal Imaging System)
Observed in Ondrejov in radio waves
The theoretical description is needed – the comparison of observed and modelled tadpoles → what type of waves are present
We study impulsively generated magnetoacoustic wave trains propagating along a coronal loop
The problem is modelled by means of 2D model presented before, but magnetic field is parallel to the y axis
The equilibrium is perturbed by a pulse in velocity, situated at L/4 of the numerical domain
Modelling of wave trains in 2D
Wave trains – first results – I.
The spatial profile of the velocity vx at time t = 30 s from initial pulse (left upper panel), and
corresponding slices of vx along x axis (y = H/2) (right upper panel) and along y axis (x = L/4). Initial pulse position x0 = L/4, mass density contrast d = 108, pulse width w = L/40
Wave trains – first results – II.
Time evolution of mass density (x = L/2,t), (top panel) and corresponding wavelet analysis (bottom panel); all for mass density contrast d = 108, pulse width w = L/40, and initial pulse position x0 = L/4.
Conclusions – I.
Computer modelling seems to be very useful tool for the understan-ding of processes in solar coronal loops
The next step in our research will be the extension of current model to three dimensions (by means of mentioned software – Athena, Nirvana, FLASH...), including the source terms such as cooling term, heating term, gravitational stratification, etc.
By means of this model we could investigate effects like attenuation of waves in coronal loops, plasma energy leakage by the dissipation into solar atmosphere and more very interesting problems in solar coronal physics...
More informations about 1D or 2D models can be found in
Jelínek P., Karlický, M.: Numerical Modelling of Slow Standing Waves in a Solar Coronal Loop, Proc. 12th ESPM, Freiburg, Germany, 2008
Jelínek, P., Karlický, M.: Computational Study of Implusively Generated Standing Slow Acoustic Waves in a Solar Coronal Loop, Eur. Phys. J. D, after revisions.
Conclusions – II.
References [1] M. Aschwanden, Physics of the Solar Corona (Springer, Praxis Publ.,
Chichester UK 2004).
[2] T. J. Chung, Computational Fluid Dynamics (Cambridge University Press, New York USA 2002).
[3] E. R. Priest, Solar Magnetohydrodynamics (D. Reidel Publishing Company, London England 1982).
[4] M. Selwa, K. Murawski, S. K. Solanki, A&A 436, 701 (2005).
[5] Tsiklauri, D., Nakariakov, V. M., A&A, 379, 1106 (2001).
[6] Nakariakov, V. M. et al.: Mon. Not. R. Astron. Soc., 349, 705 (2004).