Page 1
1
Numerical modeling of particle generation from ozone reactions with human-worn clothing 1
in indoor environments 2
Aakash C. Rai1, Chao-Hsin Lin2, & Qingyan Chen3,1* 3
1School of Mechanical Engineering, Purdue University, West Lafayette, IN 47907, USA 4 2Environmental Control Systems, Boeing Commercial Airplanes, Everett, WA 98203, USA 5
3School of Environmental Science and Engineering, Tianjin University, Tianjin 300072, China 6
*Tel. (765)496-7562, Fax (765)494-0539, Email: [email protected]
Abstract 8
Ozone-terpene reactions are important sources of indoor ultrafine particles (UFPs), a 9
potential health hazard for human beings. Humans themselves act as possible sites for ozone-10
initiated particle generation through reactions with squalene (a terpene) that is present in their 11
skin, hair, and clothing. This investigation developed a numerical model to probe particle 12
generation from ozone reactions with clothing worn by humans. The model was based on 13
particle generation measured in an environmental chamber as well as physical formulations of 14
particle nucleation, condensational growth, and deposition. In five out of the six test cases, the 15
model was able to predict particle size distributions reasonably well. The failure in the remaining 16
case demonstrated the fundamental limitations of nucleation models. The model that was 17
developed was used to predict particle generation under various building and airliner cabin 18
conditions. These predictions indicate that ozone reactions with human-worn clothing could be 19
an important source of UFPs in densely occupied classrooms and airliner cabins. Those reactions 20
could account for about 40% of the total UFPs measured on a Boeing 737-700 flight. The model 21
predictions at this stage are indicative and should be improved further. 22
Keywords: Ozone, Skin-oils, Particles, Nucleation, Condensation, Indoor environment 23
1. Introduction 24
Particulate air pollution is a matter of serious health concern for humans. Several studies 25
have associated exposure to outdoor particles with increased morbidity and mortality risks 26
(Dominici et al., 2006; Pope and Dockery, 2006). However, outdoor exposure to particles is 27
usually less significant than indoor exposure because people spend the majority of their time 28
indoors. Therefore, it is presumable that many of the adverse health effects that are apparently 29
due to outdoor particles are actually caused by exposure indoors (Jones, 1999). Hence, it is 30
imperative to characterize people’s exposure to particles in indoor environments. 31
Several investigations have identified ozone reactions with terpene-containing consumer 32
products as an important source of indoor particles (Sarwar and Corsi, 2007; Weschler and 33
Shields, 1999). For example, Long et al. (2000) found that ozone/terpene reactions drastically 34
increased (with a peak increase of 7–100 times) the particle number concentrations in Boston-35
area homes. They also found that more than 50% of those particles (by volume) were ultrafine in 36
nature. Such ultrafine particles (UFPs) can deposit deep into the lungs and presumably are 37
responsible for many of the adverse health effects associated with particles (Donaldson et al., 38
Rai, A.C., Lin, C.‐H., and Chen, Q. 2015. “Numerical modeling of particle generation from ozone reactions with human‐worn clothing in indoor environments,” Atmospheric Environment, 102, 145-155.
Page 2
2
1998; Sioutas et al., 2005). Hence, several researchers focused on measuring UFP generations 39
from ozone/terpene reactions (Coleman et al., 2008; Destaillats et al., 2006). They found that 40
such reactions were indeed a major source of indoor UFPs. A recent investigation has identified 41
ozone reactions with squalene (a triterpene) present in human skin-oils as another potential 42
source of indoor UFPs (Wang and Waring, 2014). 43
In addition to experimental investigations, some researchers have developed models for 44
predicting particle generation from ozone/terpene reactions on the basis of detailed chemical 45
mechanisms (Leungsakul et al., 2005; Sarwar et al., 2003). These models can provide reasonable 46
predictions of particle mass generation. However, they cannot compute particle number 47
concentrations and size distributions, which are essential indices for characterizing exposure to 48
UFPs (Donaldson et al., 1998; Peters et al., 1997). A recent study by Ito and Harashima (2011) 49
developed a sectional model for simulating particle generation from ozone reactions with d-50
limonene (a terpene) together with particle size distributions. However, their model did not 51
include condensational growth, which is the predominant mechanism for increase in particle size 52
in such reactions. 53
Therefore, to better understand ozone-initiated particle generation and human exposure to 54
the particles, this investigation developed a numerical model for computing size-resolved particle 55
concentrations based on physical formulations of particle dynamics. We used the model to 56
analyze particle generation from ozone reactions with human-worn clothing, which were recently 57
identified as a potential source of indoor UFPs (Rai et al., 2013). The model was then used to 58
compute concentrations of such ozone-initiated particles in various indoor environments such as 59
buildings and airliner cabins. 60
2. Method 61
This investigation simulated the generation of ozone-initiated particles from reactions 62
with human-worn clothing as measured in an environmental chamber. The details of the chamber 63
experiments were provided in Rai et al. (2013) and are briefly summarized here. Figure 1 shows 64
the schematic of the chamber and the anticipated particle-generation mechanism. Experiments 65
were conducted in a medium-scale environmental chamber (dimensions: 1.8 m × 1.7 m × 1.7 m) 66
containing a steel box (dimensions: 0.2 m × 0.4 m × 1.2 m.) at its center. The box was used as a 67
human simulator, with its temperature maintained at 31±1 °C and a cotton T-shirt stretched over 68
it. The T-shirt was soiled with skin-oils by a human subject’s sleeping in it and was the primary 69
site for ozone reactions. The chamber was ventilated with outdoor air enriched with ozone, 70
which reacted with the T-shirt to generate particles. The experiments measured the time-varying 71
concentrations of ozone and particles at the chamber inlet and exhaust. The measurements 72
therefore presented a well-controlled and challenging case study for developing models to study 73
ozone-initiated particle generation from the reaction of ozone with clothing. 74
To model particle generation, this investigation assumed that ozone reacted with skin-oils 75
on the T-shirt to produce a hypothetical semi-volatile organic compound (SVOC) in the vapor 76
phase, as shown in Figure 1. Our assumption was based on the fact that skin-oil constituents such 77
as squalene react with ozone and produce SVOCs (Fadeyi et al., 2013). The concentration of the 78
SVOC vapor then increased in the chamber because its production rate from ozone/skin-oil 79
reactions was higher than its removal rate by ventilation and deposition. The SVOC vapor 80
Page 3
3
concentration subsequently crossed its nucleation threshold, and new particles (liquid droplets of 81
SVOC) were generated. Note that if ventilation and deposition rates were sufficiently high, 82
particle generation would not take place because the SVOC vapor concentration would never 83
cross its nucleation threshold. 84
These freshly nucleated particles then served as condensation sites for the SVOC vapor 85
and subsequently reduced its concentration below the nucleation threshold, preventing further 86
nucleation. From this time onward, condensation was predominant, which led to growth in 87
particle size and consumption of the SVOC vapor. Furthermore, the number of particles in the 88
chamber was also decreasing because nucleation had stopped and particles were continuously 89
removed by ventilation and deposition, as illustrated in Figure 1. This in turn reduced the number 90
of available condensation sites for the SVOC vapor, and its concentration started to increase 91
again, producing another nucleation burst of particles. This cycle of particle generation, growth, 92
and removal continued until the ozone/skin-oil reactions could not generate sufficient SVOC 93
vapor in the chamber. Note that coagulation of particles was ignored in the above description 94
because the particle concentrations in most cases were too low for coagulation to have a 95
significant influence (Hussein et al., 2009). 96
2.1 Model formulation 97
As described above, the SVOC vapor was the primary driver of the particle generation 98
cycle. The SVOC concentration in the chamber was assumed to be under well-mixed conditions. 99
The mass conservation equation for the SVOC is as follows: 100
3SVOCgen v SVOC d,SVOC SVOC SVOC nuc nuc
dCS C C CS C Dp J
dt 6
(1)
where CSVOC is the concentration of SVOC vapor [kg m−3], t the time [s], Sgen the SVOC 101
production rate [kg m−3 s−1], λv the air change rate [s−1], λd,SVOC the SVOC deposition rate 102
coefficient on the chamber walls [s−1], CS the condensational sink of SVOC vapor on the 103
existing particles [s−1] (see Section 2.1.3 for details), ρ the particle density [kg m−3], Dpnuc the 104
diameter of nucleating particles [m], and Jnuc the particle nucleation rate [# m−3 s−1]. 105
The first term in the above equation is the rate of change of SVOC concentration in the 106
chamber. The second term describes the production of SVOC from ozone/skin-oil reactions. The 107
third and fourth terms describe SVOC removal by ventilation and deposition, respectively. The 108
fifth and sixth terms are the SVOC conversion rates of particles from vapor to liquid droplets as 109
a result of condensation and nucleation, respectively. Clearly, the above equation can be used to 110
determine the time-varying SVOC vapor concentration in the chamber if the various terms on the 111
right-hand side are computed. However, the equation is intrinsically coupled with the particle 112
concentrations through the condensation and nucleation sink terms. 113
Therefore, it is necessary to introduce governing equations for particles. Just as the mass 114
balance equation was used for the SVOC vapor, this investigation used the number balance 115
equation to compute the particle number concentrations in the chamber. The particles were first 116
classified into different groups on the basis of diameter, and their number concentrations were 117
computed by the following equations: 118
Page 4
4
iv i d,p i i nuc
iv i d,p i i
dN(Dp , t)N(Dp , t) (Dp )N(Dp , t) J for i 1
dtdN(Dp , t)
N(Dp , t) (Dp )N(Dp , t) for i 2, 3, ...dt
(2)
where i is the group number, N the number concentration of particles [# m−3] with diameters Dpi 119
[m] at time t, λd,p their deposition rate coefficient [s−1], and Dpnuc the diameter of nucleating 120
particles [m]. The first term in each of the above equations is the rate of change of particle 121
number concentration with diameter Dpi. The second and third terms describe the removal of 122
particles by ventilation and deposition, respectively. The fourth term expresses particle 123
generation by nucleation of SVOC vapor, which is a source of nucleating particles (i = 1 and Dp1 124
= Dpnuc) only. Note that the above equations do not include the incoming particles from 125
ventilation and that we chose those experimental cases for which the inlet air contained 126
negligible particles for comparison with the numerical results. Although inlet particles do not 127
pose any theoretical problems and can be easily incorporated into Eq. (2), they increase 128
computational costs drastically by increasing the number of groups in the model, and therefore 129
they were not considered. We also did not account for coagulation in Eq. (2) because it was 130
usually insignificant as a result of low particle concentrations. 131
To solve Eq. (2) for computing size-resolved particle concentrations, it is also necessary 132
to account for particle size growth as described by Kumar and Ramkrishna (1997). The growth 133
of particle diameters was governed by the condensation of SVOC vapor, which was computed by 134
the following expression (Kulmala, 1988): 135
SVOCi
i
4 D CdDp
dt Dp
(3)
where D is the diffusion coefficient of SVOC in air [m2 s−1] and β the transition correction factor 136
(Fuchs and Sutugin, 1971). 137
Overall, Eqs. (1), (2), and (3) can be used for computing the time-dependent SVOC vapor 138
concentration, particle number concentrations, and particle diameters, respectively. However, the 139
various terms on the right-hand side of these equations needed to be determined, as described in 140
the following subsections. 141
2.1.1 Modeling the SVOC generation (Sgen) 142
The ozone-initiated SVOC generation (Sgen in Eq. (1)) was estimated by assuming a 143
heterogeneous second-order reaction between ozone and skin-oils on the T-shirt as follows: 144
ozonekvaporOzone + Skin-oils SVOC
Thus, the generation rate of SVOC was expressed as: 145
V
CCAkS ozoneoilsskinshirtTozone
gen (4)
Page 5
5
where kozone is the ozone/skin-oils reaction rate constant [s-1 ppb-1]; AT-shirt the area of the T-shirt 146
[m2]; V the chamber volume [m3]; and Cozone and Cskin-oils the concentrations of ozone in the air 147
[ppb] and skin-oils on the T-shirt [kg m-2], respectively. The determination of ozone/skin-oils-148
reaction-generated SVOC was based on the assumption that the T-shirt was soiled with skin-oils 149
because it was worn by a human subject. We calculated the time-varying concentration of skin-150
oils by solving the following equation: 151
ozoneoilsskinozoneoilsskin CCk
dt
dC
(5)
Clearly, the above equation can be easily solved if the initial concentration of skin-oils on 152
the T-shirt (C0,skin-oils), Cozone, and kozone are known. Cozone was measured during the experiments; 153
however, C0,skin-oils and kozone were not known beforehand. Therefore, this investigation fitted 154
those two constants by comparing the model predictions for ozone-initiated particles with their 155
corresponding measurements, as described in the Supplementary Information (SI). Finally, Eqs. 156
(4) and (5) can be solved for computing Sgen. 157
The above calculation method for Sgen can be simplified if it is assumed that the T-shirt 158
contained a large reservoir of skin-oils and that the reactions were controlled only by the ozone 159
concentration in the chamber. Then the expression for Sgen becomes: 160
V
CAkS ozoneshirtTexozone
gen (6)
where kozone-ex is the ozone/skin-oils reaction rate constant with the assumption of excess skin-161
oils [kg m-2 s-1 ppb-1]. Again, kozone-ex can be estimated by comparing the model predictions with 162
measurements as described in the SI. 163
This study used both of the methods described above for computing Sgen and also 164
compared their performance in simulating ozone-initiated particles, as analyzed in the results 165
section. The calculation of Sgen from Eqs. (4) and (5) was termed the “skin-oils depletion” model, 166
and the calculation of Sgen from Eq. (6) was termed the “excess skin-oils” model. 167
2.1.2. Modeling the nucleation rate (Jnuc) 168
Nucleation governs the generation rate of new particles from ozone/skin-oil reactions. 169
Hence, the aim of any nucleation model is to predict the generation rate of new particles given 170
the physical properties of the nucleating species (SVOC vapor in this study), its super-saturation, 171
and other environmental conditions. Various nucleation theories are described in detail in many 172
texts (Seinfeld and Pandis, 2006), so our discussion here will be brief. 173
The nucleation rate can be determined experimentally if the generation of freshly 174
nucleated particles is measured. However, such particles have extremely small sizes (on the 175
order of a few nanometers) and usually cannot be detected by conventional measurement 176
instruments such as a scanning mobility particle sizer (SMPS). Therefore, particles are measured 177
only when they grow beyond the detection size limit, which is usually about ten nanometers. For 178
example, the detection range for the SMPS used in our ozone/T-shirt experiments was between 179
Page 6
6
9.65–421.7 nm, which means that the true nucleation rate was unknown. Nevertheless, these 180
SMPS measurements can be used to compute the generation rate of the smallest detectable 181
particles, also called the apparent nucleation rate (Kerminen and Kulmala, 2002). 182
To calculate the apparent nucleation rate, we summed Eq. (2) over all particle sizes and 183
performed some algebraic manipulations given in the SI, which led to the following expression: 184
)t,Dp(N).Dp()t(N.dt
)t(dNJ i
DpDpip,dSMPS,totalv
SMPS,totalapp,nuc
SMPSi
(7)
where Jnuc,app is the apparent nucleation rate, Ntotal,SMPS the total particle number concentration 185
measured by SMPS [# m−3], and DpSMPS the smallest particle diameter detected by the SMPS 186
(9.65 nm). 187
Finally, to compute Jnuc,app, Eq. (7) can be solved jointly with Eqs. (1) to (3) by using 188
Ntotal,SMPS from the measured data. However, we first need to replace Dpnuc with DpSMPS and Jnuc 189
with Jnuc,app in Eqs. (1) and (2) because those particles with diameters below DpSMPS were 190
eliminated from the model formulation and were accounted for indirectly through the Jnuc,app term 191
in Eq. (7). Such an approach was extremely useful for studying the evolution of particle sizes 192
after they were detected by the SMPS. It was also useful to compare the model results with 193
measurements of particle size distributions for validating Eqs. (1) to (3). 194
The primary limitation of the above approach was that Jnuc,app need to be computed at 195
every time-step from the measured Ntotal,SMPS in an environmental chamber in which ozone/T-196
shirt reactions were the only particle source. A similar technique would not be possible in real 197
indoor settings because the measured Ntotal,SMPS would also contain contributions from other 198
particle-generating sources. Therefore, it was necessary to explore a number of theoretical 199
models for nucleation that did not require Ntotal,SMPS(t) as an input. However, the nucleation 200
precursors and mechanism of particle generation from ozone/clothing reactions is itself 201
unknown. Therefore, we chose several popular nucleation models from the literature and 202
compared their performance in order to identify the most suitable model. The models studied 203
were the thermodynamic, kinetic, and activation nucleation models. 204
The thermodynamic model is based on the classical homogenous nucleation theory, 205
which is derived from the thermodynamic theory of fluctuations. A widely used expression for 206
nucleation rate is the following, which is based on work by Volmer and Weber (1926), Farkas 207
(1927), Becker and Döring (1935), Zeldovich (1942), and Frenkel (1955): 208
23
32
3
2SVOC
2/1
5nuc )S(lnT
v
k3
16exp
S
vC
m
2J (8)
where σ is the surface tension of the SVOC [kg s-2], m the molecular mass of SVOC [kg], v (v = 209
m/ρ) the molecular volume of particles [m3], S the super-saturation ratio, k the Boltzmann 210
constant [1.38×10⁻²³ m2 kg s−2 K−1], and T the air temperature [K]. The super-saturation ratio of 211
the SVOC is defined as S=CSVOC/CSVOC,sat, where CSVOC,sat is the SVOC concentration in a 212
saturated vapor at equilibrium [kg m−3]. 213
Page 7
7
Another popular theory of nucleation is the kinetic theory, which assumes that nucleation 214
is determined by the collision rate of molecules rather than by the thermodynamic criterion 215
(Lushnikov, 2010). The nucleation rate is given by: 216
2SVOCkinnuc CkJ (9)
where kkin is the kinetic nucleation constant [m3 kg-2 s-1]. 217
Recently, the activation nucleation theory was proposed by Kulmala et al. (2006) for 218
explaining atmospheric nucleation events. It was also used by Vartiainen et al. (2006) to 219
compute nucleation of particles from ozone/d-limonene reactions in an indoor environment. 220
Therefore, it was chosen as another possible candidate for computing nucleation. This theory 221
assumes that nucleation occurs through the activation of existing thermodynamically stable 222
clusters by SVOCs, and the nucleation rate is given by: 223
SVOCactnuc CkJ (10)
where kact is the activation nucleation constant [kg-1 s-1]. 224
2.1.3. Modeling the condensational sink (CS) and deposition rate coefficients (λd,SVOC and 225
λd,p). 226
The condensational sink (CS) determines the rate of SVOC condensation on existing 227
particles. For the condensational growth governed by Eq. (3), CS is given by the following 228
expression (Kulmala et al., 2001): 229
)Dp(N.Dp.D2CS ii
i (11)
The SVOC deposition coefficient (λd,SVOC) on the chamber walls was computed from Lai 230
and Nazaroff’s (2000) deposition model, as suggested by Weschler and Nazaroff (2008). The 231
particle deposition coefficient (λd,p) on the chamber walls was assumed to be constant (0.25 h-1) 232
for all diameters since a more sophisticated deposition modeling was not possible due to the lack 233
of data for size-resolved deposition velocities at the chamber walls. 234
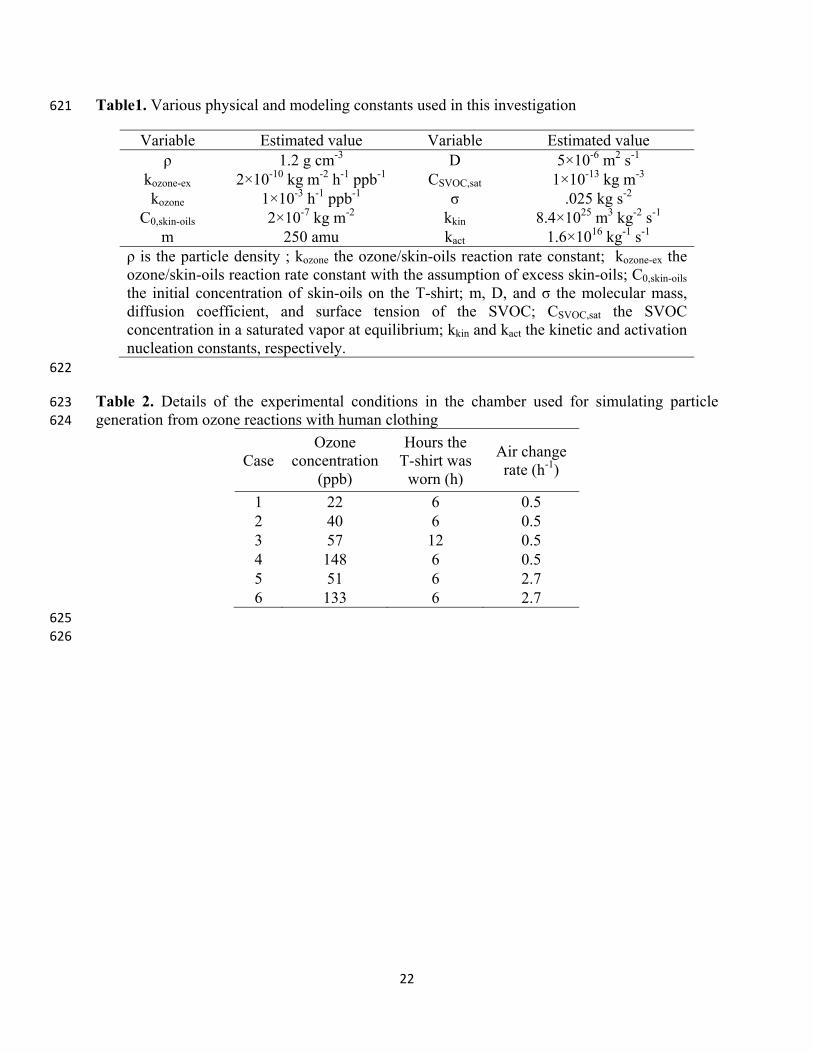
2.2 Estimating physical and modeling constants 235
The solutions of the model equations (Eqs. (1) – (11)) require appropriate values for the 236
physical properties of the hypothetical SVOC and particles as well as the various modeling 237
constants. However, those physical properties and modeling constants could only be estimated 238
because the particle generation mechanism from ozone/skin-oils reactions is not well studied and 239
the SVOCs responsible for particle generation are themselves unknown. Table 1 shows the 240
values used in this investigation and our estimation methodology is given in the SI. 241
3. Results and discussions 242
This section first reports the simulation results for ozone-initiated particle generations 243
from reactions with soiled clothing obtained by using the apparent nucleation formulation (Eq. 244
Page 8
8
(7)) and their comparison with chamber measurements conducted by Rai et al. (2013). These 245
comparisons were useful for evaluating the performance of the various model formulations used 246
in this investigation, except for the nucleation model, because Eq. (7) computed the nucleation 247
from the measurements themselves (i.e., the measurements of Ntotal,SMPS). However, as discussed 248
previously, it is not practical to use such an approach for computing ozone/clothing-generated 249
particles under realistic indoor conditions, since their individual contributions to particles cannot 250
be isolated from other particle sources. Therefore, we subsequently replaced the apparent 251
nucleation model with different theoretical nucleation models that can compute ozone-initiated 252
particles without the measurement of Ntotal,SMPS. We then evaluated the performance of the 253
thermodynamic, kinetic, and activation nucleation models by comparing their predictions with 254
the corresponding measurements. Finally, we used the thermodynamic model to estimate the 255
ozone-initiated particle generation from human clothing under typical building and airliner cabin 256
conditions, because performance of this model was found to be superior to that of the other two 257
models. 258
3.1. Apparent nucleation rate formulation 259
Because nucleation modeling was the most difficult aspect of this research, we computed 260
the apparent nucleation rates from Eq. (7). To reduce computational expenses, our model 261
assumed that the inlet air contained a negligible number of particles. Therefore, to test the model 262
formulations, we chose those cases from the measurements of Rai et al. (2013) which had low 263
inlet particle concentrations. The experimental conditions for these cases are summarized in 264
Table 2. The cases systematically analyzed the impact of various factors on ozone-initiated 265
particle generation, such as ozone concentration, soiling degree of the T-shirt, and air change 266
rate. They were designed by keeping Case 2 as the reference case and typically varying one 267
condition at a time. 268
Among these cases, we studied Cases 1-4 with the apparent nucleation formulation. We 269
could not study Cases 5 and 6 with this approach because particle generation was not detected in 270
these cases, which meant that Eq. (7) could not be used for computing the nucleation rate 271
(Jnuc,app). These two cases were used for studying the performance of the various nucleation 272
models, which is discussed in the next subsection. 273
Figure 2 compares the computed and measured ozone-initiated particle number 274
concentrations for Cases 1, 3, and 4. The measurements showed that the ozone-initiated particle 275
numbers were negligible from t = 0 to t = 2.5 h because the ozone concentration was very low 276
(~5 ppb). Particle generation was measured about one hour after ozone injection through a burst 277
of nucleation, and the total number concentrations reached a maximum. The particle numbers 278
then started to decay because of the lack of nucleation and because of particle removal by 279
ventilation and deposition. A secondary burst of nucleation was clearly observed in cases with 280
high ozone concentrations, and the particle numbers showed secondary maxima. The secondary 281
burst was not detected under low ozone conditions, mainly because of the large measurement 282
uncertainties. Finally, the particle numbers decayed further, and the experiments were terminated 283
at t = 12.5 h. 284
As shown in Figure 2 for the “excess skin-oils” model, the computed particle number 285
concentrations were in excellent agreement with the measurements at different ozone levels, 286
Page 9
9
primarily because the apparent nucleation rate was estimated from the measurements themselves. 287
Note that in the case of 148 ppb ozone, the model over-predicted the number concentrations by 288
about 10–15% from t = 5.2 h to t = 8.5 h. This case had particle concentrations in excess of 289
10,000 #/cm3, meaning that coagulation could be responsible for a reduction in particle number 290
(Hussein et al., 2009). The fact that coagulation was not included in our model probably led to 291
slight over-prediction. We also obtained excellent agreement in the 40 ppb ozone case (results 292
not shown). The results with the “skin-oils depletion” model were almost identical to the “excess 293
skin-oils” model and therefore are not shown here. 294
Figure 3(a) shows the particle mass concentrations obtained by the two SVOC generation 295
models for the 40 ppb and 148 ppb ozone cases (Cases 2 and 4) and their comparisons with 296
measurements. In both cases, the measured mass concentrations first increased as a result of 297
particle generation after ozone injection, and then decayed toward the end. In the case of 40 ppb 298
ozone, both models predicted the particle mass concentrations reasonably well when compared 299
with the measurements, but the “excess skin-oils” model seemed to provide slightly better 300
predictions than the “skin-oils depletion” model. However, with 148 ppb ozone, the “excess 301
skin-oils” model hugely over-predicted the particle masses, while the “skin-oils depletion” model 302
performed much better, although it still over-predicted the mass concentration by about 30%. 303
Thus, it seems that the soiled T-shirt contained a limited quantity of skin-oils available for ozone 304
reactions. These were consumed faster at the higher ozone concentration, and the T-shirt was 305
significantly depleted of skin-oils, especially at later times. 306
In the case of 57 ppb ozone (Case 3), the trends of the results for particle mass 307
concentrations from both models were similar to those in the previous cases, as shown in Figure 308
3(b). In this case, the T-shirt was soiled for 12 hours, as compared with 6 hours in the previous 309
cases, which means that the quantity of skin-oils in the T-shirt was probably higher. Thus, the 310
performance of the “excess skin-oils model” was somewhat better than that of the skin-oils 311
depletion model, although it still slightly over-predicted the mass concentrations towards the end. 312
We did not make comparisons for mass concentrations in the 22 ppb ozone (Case 1) because 313
there were large uncertainties in the measurements of particle masses at this low ozone level (Rai 314
et al., 2013). 315
Overall, the “skin-oils depletion” model seemed more suitable for simulating ozone-316
initiated particle generations from the soiled T-shirt over the human simulator because (1) its 317
predictions of particle mass concentration agreed reasonably well with the measurements for all 318
three cases analyzed, and (2) it correctly captured the decreasing trend of particle masses towards 319
the end of the experiments, particularly in the case of 148 ppb ozone. However, it seems that the 320
“excess skin-oils” model would be more appropriate for simulating particle generation with 321
clothing worn by human beings, because the skin-oils would be replenished by human activities. 322
The various discrepancies between the computed and measured values of mass concentration 323
arose because (1) the T-shirt most likely did not contain the same amount of skin-oils in all 324
cases, while the “skin-oils depletion” model assumed otherwise; and (2) the model assumed a 325
second-order reaction between ozone and skin-oils, whereas the actual reaction is very complex. 326
Figure 4 compares the particle size distributions computed by the “skin-oils depletion” 327
model with the corresponding measurements at an ozone concentration of 40 ppb (Case 2). The 328
details of the particle generation, growth, and removal phenomena were provided in our previous 329
Page 10
10
paper (Rai et al., 2013), and we briefly describe those results here for the purpose of comparison 330
with model predictions. 331
As shown in Figure 4(a), ozone-initiated particles were generated in the ultrafine region 332
with a mode diameter of approximately 40 nm at t = 4.2 h, and this was predicted reasonably 333
well by the model. At t = 6.2 h, the particle mode diameter shifted to 90 nm as a result of 334
condensational growth, and the number of particles was also depleted by ventilation and 335
deposition losses; these phenomena were also well captured by the model. At t = 8.5 h, the 336
particle size distribution was predominantly bimodal, with modes at 40 nm and 136 nm as shown 337
in Figure 4(b). The former mode (40 nm) resulted from a secondary nucleation burst, and the 338
latter (136 nm) was due to condensational growth of the original mode. The model predictions 339
also showed two dominant modes and an overall good match with the measurements. From t = 340
8.5 h to 12.5 h, the particle concentrations decayed because of ventilation and deposition, and 341
there were no obvious modes in the size distribution at t = 12.5 h. The model prediction also 342
showed decay in particle concentrations, and the overall size distribution was again predicted 343
reasonably well. 344
Evidently, the model captured the overall trend of particle generation, growth, and 345
removal with good accuracy for the 40 ppb ozone case described above. The model performed 346
slightly worse for the other cases (Cases 1, 3, and 4), but those predictions still compared well 347
with their corresponding measurements. It should be emphasized that the model contained 348
physical formulations for SVOC generation, condensation, and SVOC and particle deposition 349
with few fitting constants. Hence, these model formulations seemed reasonable, given the good 350
agreement between model predictions and experimental measurements. However, the apparent 351
nucleation rate was computed from the experimental data itself (i.e, the measured Ntotal,SMPS), 352
which was a big drawback in applying the model under new indoor conditions. Moreover, even 353
if the Ntotal,SMPS were obtained through measurement, there would be no way to separate the 354
contributions of particles generated from ozone/clothing reactions from those from other indoor 355
sources. Therefore, it was desirable to incorporate a suitable nucleation model for simulating 356
ozone-initiated particles without aid from experimental measurements, as discussed in the next 357
subsection. 358
3.2. Nucleation models 359
This section discusses the results obtained by using the different theoretical nucleation 360
models described in Section 2.1.2: the activation, kinetic, and thermodynamic nucleation models. 361
We again used the “skin-oils depletion” model to compute the results for this section because its 362
performance was found to be superior to that of the “excess skin-oils” model. 363
As illustrated in the SI, the modeling constants in the various nucleation models were 364
chosen such that the peak of the particle number concentration (at t = 4.2 h) in the reference case 365
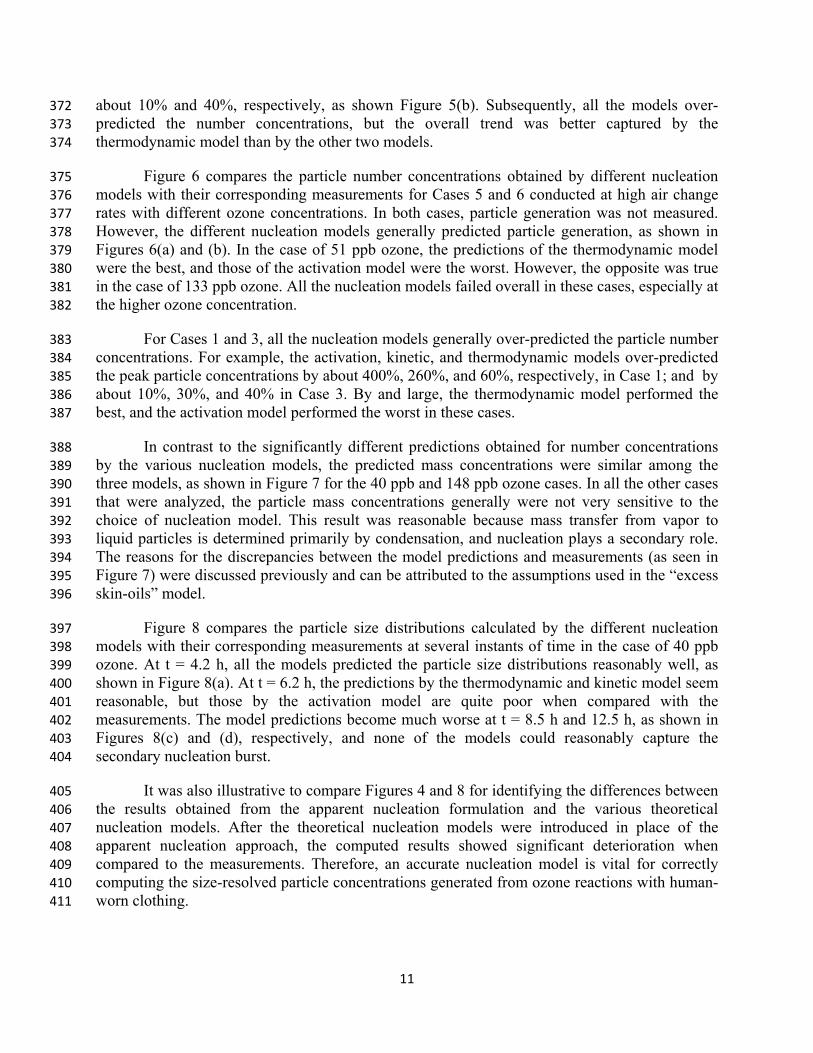
(40 ppb ozone) was captured reasonably well. Thus, all the nucleation models provided a good 366
prediction of the maximum particle concentration in the case of 40 ppb ozone, as shown in 367
Figure 5(a). However, none of the nucleation models could effectively capture the steep decline 368
in particle number from t = 4.2 h to t = 7.0 h and the subsequent secondary nucleation burst. In 369
the case of 148 ppb ozone, the thermodynamic model over-predicted the peak particle 370
concentration by about 30%, whereas the kinetic and activation models under-predicted it by 371
Page 11
11
about 10% and 40%, respectively, as shown Figure 5(b). Subsequently, all the models over-372
predicted the number concentrations, but the overall trend was better captured by the 373
thermodynamic model than by the other two models. 374
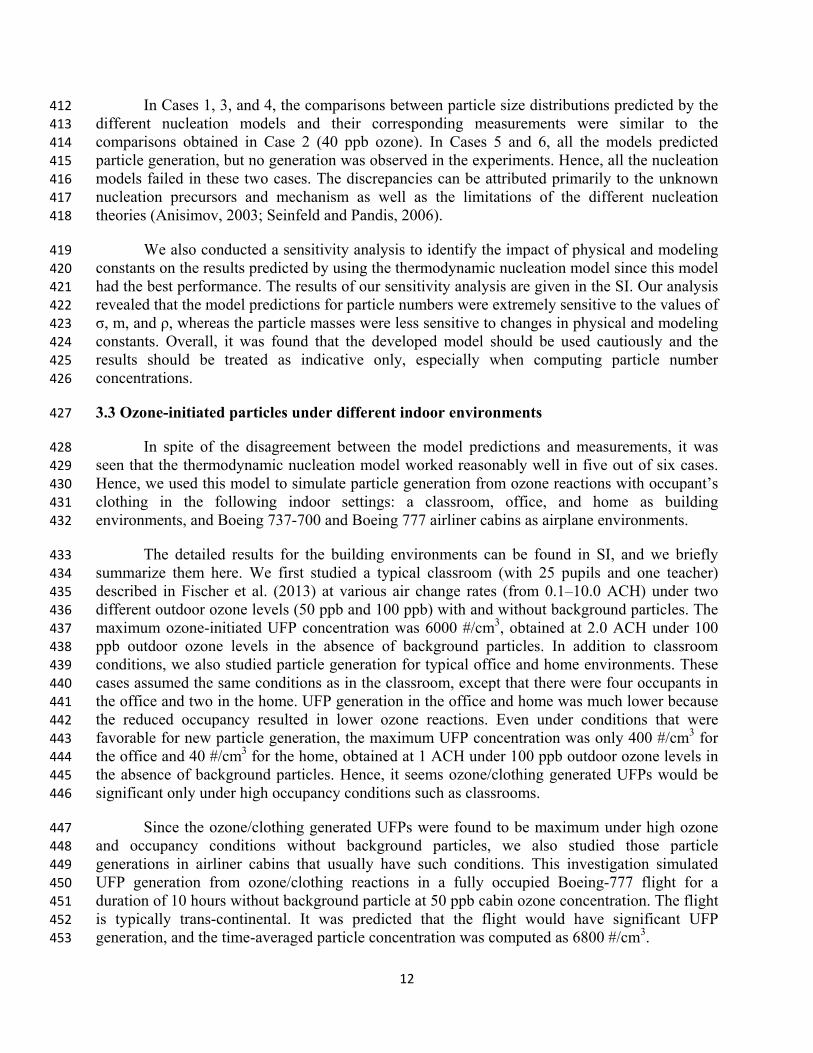
Figure 6 compares the particle number concentrations obtained by different nucleation 375
models with their corresponding measurements for Cases 5 and 6 conducted at high air change 376
rates with different ozone concentrations. In both cases, particle generation was not measured. 377
However, the different nucleation models generally predicted particle generation, as shown in 378
Figures 6(a) and (b). In the case of 51 ppb ozone, the predictions of the thermodynamic model 379
were the best, and those of the activation model were the worst. However, the opposite was true 380
in the case of 133 ppb ozone. All the nucleation models failed overall in these cases, especially at 381
the higher ozone concentration. 382
For Cases 1 and 3, all the nucleation models generally over-predicted the particle number 383
concentrations. For example, the activation, kinetic, and thermodynamic models over-predicted 384
the peak particle concentrations by about 400%, 260%, and 60%, respectively, in Case 1; and by 385
about 10%, 30%, and 40% in Case 3. By and large, the thermodynamic model performed the 386
best, and the activation model performed the worst in these cases. 387
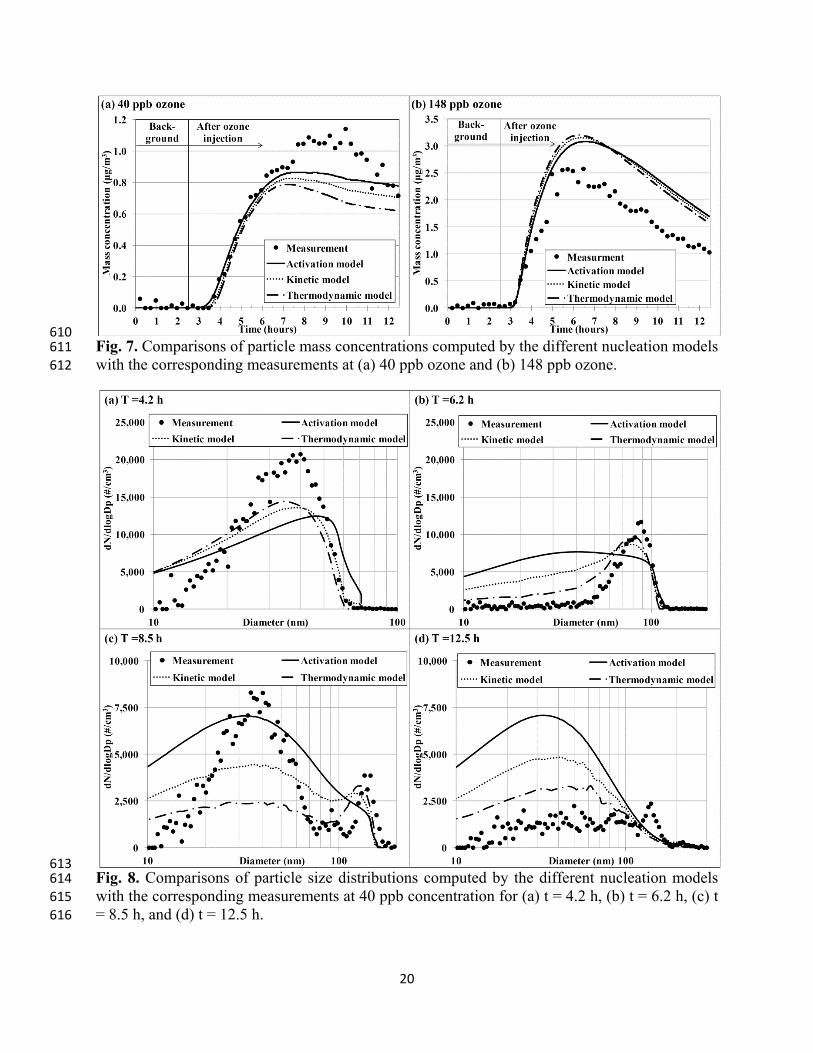
In contrast to the significantly different predictions obtained for number concentrations 388
by the various nucleation models, the predicted mass concentrations were similar among the 389
three models, as shown in Figure 7 for the 40 ppb and 148 ppb ozone cases. In all the other cases 390
that were analyzed, the particle mass concentrations generally were not very sensitive to the 391
choice of nucleation model. This result was reasonable because mass transfer from vapor to 392
liquid particles is determined primarily by condensation, and nucleation plays a secondary role. 393
The reasons for the discrepancies between the model predictions and measurements (as seen in 394
Figure 7) were discussed previously and can be attributed to the assumptions used in the “excess 395
skin-oils” model. 396
Figure 8 compares the particle size distributions calculated by the different nucleation 397
models with their corresponding measurements at several instants of time in the case of 40 ppb 398
ozone. At t = 4.2 h, all the models predicted the particle size distributions reasonably well, as 399
shown in Figure 8(a). At t = 6.2 h, the predictions by the thermodynamic and kinetic model seem 400
reasonable, but those by the activation model are quite poor when compared with the 401
measurements. The model predictions become much worse at t = 8.5 h and 12.5 h, as shown in 402
Figures 8(c) and (d), respectively, and none of the models could reasonably capture the 403
secondary nucleation burst. 404
It was also illustrative to compare Figures 4 and 8 for identifying the differences between 405
the results obtained from the apparent nucleation formulation and the various theoretical 406
nucleation models. After the theoretical nucleation models were introduced in place of the 407
apparent nucleation approach, the computed results showed significant deterioration when 408
compared to the measurements. Therefore, an accurate nucleation model is vital for correctly 409
computing the size-resolved particle concentrations generated from ozone reactions with human-410
worn clothing. 411
Page 12
12
In Cases 1, 3, and 4, the comparisons between particle size distributions predicted by the 412
different nucleation models and their corresponding measurements were similar to the 413
comparisons obtained in Case 2 (40 ppb ozone). In Cases 5 and 6, all the models predicted 414
particle generation, but no generation was observed in the experiments. Hence, all the nucleation 415
models failed in these two cases. The discrepancies can be attributed primarily to the unknown 416
nucleation precursors and mechanism as well as the limitations of the different nucleation 417
theories (Anisimov, 2003; Seinfeld and Pandis, 2006). 418
We also conducted a sensitivity analysis to identify the impact of physical and modeling 419
constants on the results predicted by using the thermodynamic nucleation model since this model 420
had the best performance. The results of our sensitivity analysis are given in the SI. Our analysis 421
revealed that the model predictions for particle numbers were extremely sensitive to the values of 422
σ, m, and ρ, whereas the particle masses were less sensitive to changes in physical and modeling 423
constants. Overall, it was found that the developed model should be used cautiously and the 424
results should be treated as indicative only, especially when computing particle number 425
concentrations. 426
3.3 Ozone-initiated particles under different indoor environments 427
In spite of the disagreement between the model predictions and measurements, it was 428
seen that the thermodynamic nucleation model worked reasonably well in five out of six cases. 429
Hence, we used this model to simulate particle generation from ozone reactions with occupant’s 430
clothing in the following indoor settings: a classroom, office, and home as building 431
environments, and Boeing 737-700 and Boeing 777 airliner cabins as airplane environments. 432
The detailed results for the building environments can be found in SI, and we briefly 433
summarize them here. We first studied a typical classroom (with 25 pupils and one teacher) 434
described in Fischer et al. (2013) at various air change rates (from 0.1–10.0 ACH) under two 435
different outdoor ozone levels (50 ppb and 100 ppb) with and without background particles. The 436
maximum ozone-initiated UFP concentration was 6000 #/cm3, obtained at 2.0 ACH under 100 437
ppb outdoor ozone levels in the absence of background particles. In addition to classroom 438
conditions, we also studied particle generation for typical office and home environments. These 439
cases assumed the same conditions as in the classroom, except that there were four occupants in 440
the office and two in the home. UFP generation in the office and home was much lower because 441
the reduced occupancy resulted in lower ozone reactions. Even under conditions that were 442
favorable for new particle generation, the maximum UFP concentration was only 400 #/cm3 for 443
the office and 40 #/cm3 for the home, obtained at 1 ACH under 100 ppb outdoor ozone levels in 444
the absence of background particles. Hence, it seems ozone/clothing generated UFPs would be 445
significant only under high occupancy conditions such as classrooms. 446
Since the ozone/clothing generated UFPs were found to be maximum under high ozone 447
and occupancy conditions without background particles, we also studied those particle 448
generations in airliner cabins that usually have such conditions. This investigation simulated 449
UFP generation from ozone/clothing reactions in a fully occupied Boeing-777 flight for a 450
duration of 10 hours without background particle at 50 ppb cabin ozone concentration. The flight 451
is typically trans-continental. It was predicted that the flight would have significant UFP 452
generation, and the time-averaged particle concentration was computed as 6800 #/cm3. 453
Page 13
13
Next, we conducted a case study for a typical domestic flight of 1.5 hours. The flight was 454
made by a partially occupied B737-700 airliner for which ozone-initiated UFP generation was 455
recently measured by Spengler et al. (2012). The measured ozone and particle concentrations 456
very quite low initially, as shown in Figure 9. After 15 minutes, the ozone concentration started 457
to increase, and after another five minutes the particle concentrations also rose steeply. The 458
particle concentration then remained steady throughout the cruising portion of the flight. Finally, 459
the ozone and particles decayed sharply during the descent. Figure 9 also shows the contributions 460
of UFPs generated from ozone reactions with the passengers’ clothing as computed by our 461
model. These reactions can account for about 40% of the total UFPs measured. Obviously, other 462
ozone-initiated mechanisms of particle generation must have prevailed, such as the reaction of 463
ozone with various terpene-containing consumer products, but taking these reactions into 464
account was beyond the scope of this investigation. Nevertheless, the model results indicate that 465
ozone reaction with passengers’ clothing could be a significant contributor of UFPs under typical 466
airliner cabin conditions. 467
4. Conclusions 468
This investigation developed numerical models to study particle generation from the 469
reaction of ozone with human-worn clothing. The models were developed with the use of: (1) 470
experimental measurements of particle generation in an environmental chamber; (2) two new 471
approaches developed for modeling the SVOC generation from ozone/clothing reactions; and (3) 472
physical formulations for particle nucleation, growth, and removal mechanisms taken from 473
literature. The models can predict size-resolved particle number concentrations, and they have 474
provided insights into the overall particle-generation mechanism. 475
The UFP predictions with the apparent nucleation formulation were in good agreement 476
with the experimental data, in which the “nucleation rate” was directly estimated from the 477
measured particle concentrations. However, the numerical models in combination with different 478
theoretical nucleation models displayed significant discrepancies in predicting the UFP size 479
distributions because of some fundamental limitations of the nucleation models. Overall, the 480
thermodynamic model based on the classical homogeneous nucleation theory provided the most 481
reasonable predictions for five out of the six experimental cases. 482
Finally, the thermodynamic model was used to compute particle generation from ozone 483
reactions with human-worn clothing in different building and airplane environments. The results 484
show that ozone reactions could significantly contribute to UFP generation in high-occupancy 485
spaces such as classrooms and airliner cabins. Ozone/clothing reactions may have accounted for 486
about 40% of the UFPs measured in a Boeing 737-700 flight. However, their contributions to 487
UFPs in office and home environments did not seem to be important because of the low occupant 488
density. 489
Acknowledgements 490
This study was partially supported by the National Basic Research Program of China 491
(The 973 Program) through Grant No. 2012CB720100 and the Center for Cabin Air Reformative 492
Environment (CARE) at Tianjin University, China. The investigation was also partially funded 493
by the U.S. Federal Aviation Administration (FAA) Office of Aerospace Medicine through the 494
Page 14
14
National Air Transportation Center of Excellence for Research in the Intermodal Transport 495
Environment at Purdue University under Cooperative Agreement 10-C-RITE-PU. Although the 496
FAA sponsored this project, it neither endorses nor rejects the findings of the research. This 497
information is presented in the interest of invoking comments from the technical community 498
about the results and conclusions of the research. 499
References 500
Anisimov, M.P., 2003. Nucleation: theory and experiment. Russ. Chem. Rev. 72, 591–628. 501
Becker, R., Döring, W., 1935. Kinetische behandlung der keimbildung in übersättigten dampfen, 502
Ann. Phys. (Leipzig) 24, 719-752. 503
Coleman, B.K., Lunden, M.M., Destaillats, H., Nazaroff, W.W., 2008. Secondary organic 504
aerosol from ozone-initiated reactions with terpene-rich household products. Atmos. 505
Environ. 42, 8234–8245. 506
Destaillats, H., Lunden, M.M., Singer, B.C., Coleman, B.K., Hodgson, A.T., Weschler, C.J., 507
Nazaroff, W.W., 2006. Indoor secondary pollutants from household product emissions in 508
the presence of ozone: a bench-scale chamber study. Environ. Sci. Technol. 40, 4421–509
4428. 510
Dominici, F., Peng, R.D., Bell, M.L., Pham, L., McDermott, A., Zeger, S.L., Samet, J.M., 2006. 511
Fine particulate air pollution and hospital admission for cardiovascular and respiratory 512
diseases. JAMA, J. Am. Med. Assoc. 295, 1127–1134. 513
Donaldson, K., Li, X.Y., MacNee, W., 1998. Ultrafine (nanometre) particle mediated lung 514
injury. J. Aerosol Sc. 29, 553–560. 515
Fadeyi, M.O., Weschler, C.J., Tham, K.W., Wu, W.Y., Sultan, Z.M., 2013. Impact of human 516
presence on secondary organic aerosols derived from ozone-initiated chemistry in a 517
simulated office Environment. Environ. Sci. Technol. 47, 3933–3941. 518
Farkas, L., 1927 Keimbildungsgeschwindigkeit in übersättigen dämpfen, Z Phys. Chem. 125, 519
236–242. 520
Fischer, A., Ljungström, E., Langer, S., 2013. Ozone removal by occupants in a classroom. 521
Atmos. Environ. 81, 11–17. 522
Frenkel, J., 1955. Kinetic theory of liquids. Dover, New York. 523
Fuchs, N.A., Sutugin, A.G., 1971. Topics in current aerosol research. Pergamon, New York. 524
Hussein, T., Hruška, A., Dohányosová, P., Džumbová, L., Hemerka, J., Kulmala, M., Smolík, J., 525
2009. Deposition rates on smooth surfaces and coagulation of aerosol particles inside a 526
test chamber. Atmos. Environ. 43, 905–914. 527
Ito, K., Harashima, H., 2011. Coupled CFD analysis of size distributions on indoor secondary 528
organic aerosol derived from ozone/limonene reactions. Build. Environ. 46, 711–718. 529
Jones, A.P., 1999. Indoor air quality and health. Atmos. Environ. 33, 4535–4564. 530
Kerminen, V.-M., Kulmala, M., 2002. Analytical formulae connecting the “real” and the 531
“apparent” nucleation rate and the nuclei number concentration for atmospheric 532
nucleation events. J. Aerosol Sc. 33, 609–622. 533
Kulmala, M., 1988. Nucleation as an aerosol physical problem (Ph.D. thesis). University of 534
Helsinki, Helsinki, Finland. 535
Kulmala, M., Lehtinen, K.E.J., Laaksonen, A., 2006. Cluster activation theory as an explanation 536
of the linear dependence between formation rate of 3nm particles and sulphuric acid 537
concentration. Atmos. Chem. Phys. 6, 787–793. 538
Page 15
15
Kulmala, M., Maso, M.D., Mäkelä, J.M., Pirjola, L., Väkevä, M., Aalto, P., Miikkulainen, P., 539
Hämeri, K., O’dowd, C.D., 2001. On the formation, growth and composition of 540
nucleation mode particles. Tellus B 53, 479–490. 541
Kumar, S., Ramkrishna, D., 1997. On the solution of population balance equations by 542
discretization—III. Nucleation, growth and aggregation of particles. Chem. Eng. Sci. 52, 543
4659–4679. 544
Lai, A.C.K., Nazaroff, W.W., 2000. Modeling indoor particle deposition from turbulent flow 545
onto smooth surfaces. J. Aerosol Sc. 31, 463–476. 546
Leungsakul, S., Jaoui, M., Kamens, R.M., 2005. Kinetic mechanism for predicting secondary 547
organic aerosol formation from the reaction of d-limonene with ozone. Environ. Sci. 548
Technol. 39, 9583–9594. 549
Long, C.M., Suh, H.H., Koutrakis, P., 2000. Characterization of indoor particle sources using 550
continuous mass and size monitors. J. Air Waste Manage. Assoc. 50, 1236–1250. 551
Lushnikov, A.A., 2010. Condensation, evaporation, nucleation, in: Agranovski, I. (Ed.), Aerosols 552
- Science and Technology. Wiley-VCH Verlag GmbH & Co. KGaA, 91–126. 553
Peters, A., Wichmann, H.E., Tuch, T., Heinrich, J., Heyder, J., 1997. Respiratory effects are 554
associated with the number of ultrafine particles. Am. J. Respir. Crit. Care Med. 155, 555
1376–1383. 556
Pope, C.A., Dockery, D.W., 2006. Health effects of fine particulate air pollution: lines that 557
connect. J. Air Waste Manage. Assoc. 56, 709–742. 558
Rai, A.C., Guo, B., Lin, C.-H., Zhang, J., Pei, J., Chen, Q., 2013. Ozone reaction with clothing 559
and its initiated particle generation in an environmental chamber. Atmos. Environ. 77, 560
885–892. 561
Sarwar, G., Corsi, R., 2007. The effects of ozone/limonene reactions on indoor secondary 562
organic aerosols. Atmos. Environ. 41, 959–973. 563
Sarwar, G., Corsi, R., Allen, D., Weschler, C., 2003. The significance of secondary organic 564
aerosol formation and growth in buildings: experimental and computational evidence. 565
Atmos. Environ. 37, 1365–1381. 566
Seinfeld, J.H., Pandis, S.N., 2006. Atmospheric chemistry and physics: from air pollution to 567
climate change. John Wiley & Sons. 568
Sioutas, C., Delfino, R.J., Singh, M., 2005. Exposure assessment for atmospheric Ultrafine 569
Particles (UFPs) and implications in epidemiologic research. Environ. Health Perspect. 570
113, 947–955. 571
Spengler, J.D., Vallarino, J., McNeely, E., Estephan, H., 2012. In-flight/onboard monitoring: 572
ACER’s component for ASHRAE 1262, Part 2 (No. RITE - ACER - CoE - 2012 - 6). 573
Harvard School of Public Health, Boston, MA. 574
Vartiainen, E., Kulmala, M., Ruuskanen, T.M., Taipale, R., Rinne, J., Vehkamäki, H., 2006. 575
Formation and growth of indoor air aerosol particles as a result of d-limonene oxidation. 576
Atmos. Environ. 40, 7882–7892. 577
Volmer, M., Weber, A., 1926. Keimbildung in übersättigten gebilden, Z. Phys. Chem. 119, 277–578
301. 579
Wang, C., Waring, M.S., 2014. Secondary organic aerosol formation initiated from reactions 580
between ozone and surface-sorbed squalene. Atmos. Environ. 84, 222–229. 581
Weschler, C.J., Nazaroff, W.W., 2008. Semivolatile organic compounds in indoor environments. 582
Atmos. Environ. 42, 9018–9040. 583
Page 16
16
Weschler, C.J., Shields, H.C., 1999. Indoor ozone/terpene reactions as a source of indoor 584
particles. Atmos. Environ. 33, 2301–2312. 585
Zeldovich, Y. B., 1942. Theory of new-phase formation: cavitation. J. Exp. Theor. Phys. (USSR) 586
12, 525–538. 587
Page 17
17
588 Fig. 1. Schematic of the environmental chamber used to study ozone reactions with a T-shirt on 589
a human simulator and an illustration of the particle-generation mechanism. 590
591 Fig. 2. Comparison of particle number concentrations computed by the “excess skin-oils” model 592
with the corresponding measurements at different ozone concentrations. 593
Page 18
18
594 Fig. 3. Comparisons of particle mass concentrations computed by the “excess skin-oils” and 595
“skin-oils depletion” models with the corresponding measurements at (a) 40 ppb and 148 ppb 596
ozone with 6 hours of T-shirt soiling, and (b) 57 ppb ozone with 12 hours of T-shirt soiling. 597
598 Fig. 4. Comparisons of particle size distributions computed by the “skin-oils depletion” model 599
with the corresponding measurements at an ozone concentration of 40 ppb for (a) t = 4.2 h and 600
6.2 h, and (b) t = 8.5 h and 12.5 h. 601
Page 19
19
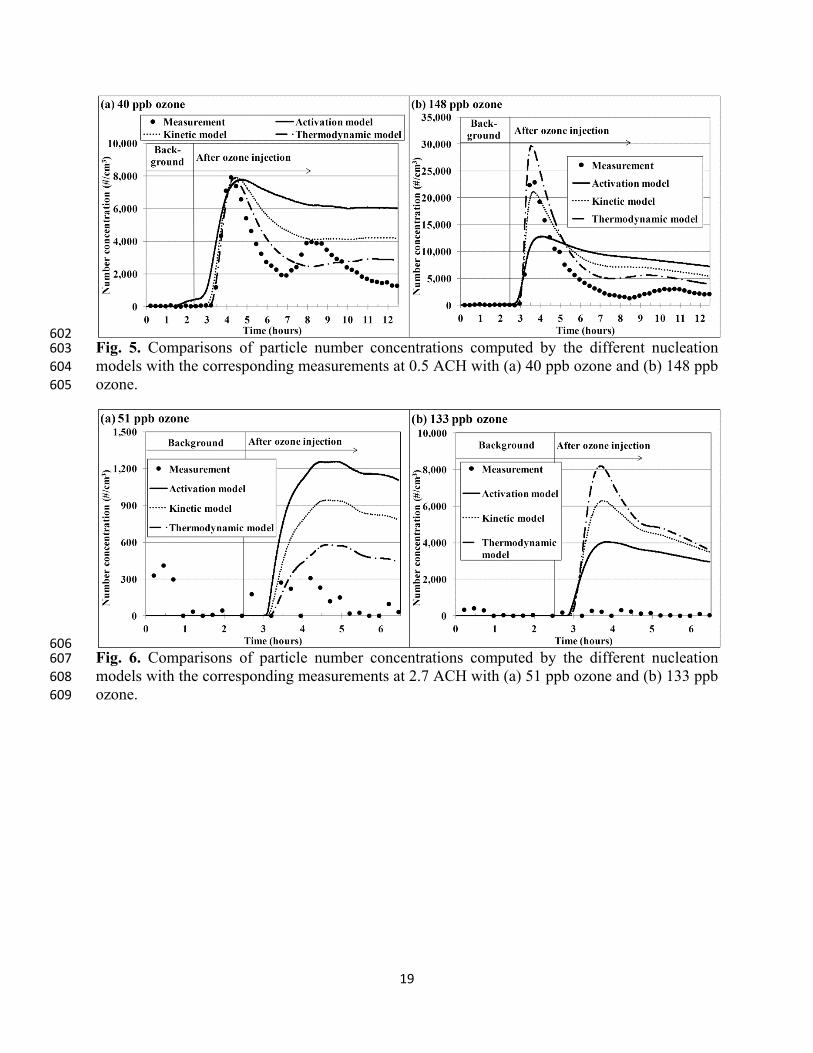
602 Fig. 5. Comparisons of particle number concentrations computed by the different nucleation 603
models with the corresponding measurements at 0.5 ACH with (a) 40 ppb ozone and (b) 148 ppb 604
ozone. 605
606 Fig. 6. Comparisons of particle number concentrations computed by the different nucleation 607
models with the corresponding measurements at 2.7 ACH with (a) 51 ppb ozone and (b) 133 ppb 608
ozone. 609
Page 20
20
610 Fig. 7. Comparisons of particle mass concentrations computed by the different nucleation models 611
with the corresponding measurements at (a) 40 ppb ozone and (b) 148 ppb ozone. 612
613 Fig. 8. Comparisons of particle size distributions computed by the different nucleation models 614
with the corresponding measurements at 40 ppb concentration for (a) t = 4.2 h, (b) t = 6.2 h, (c) t 615
= 8.5 h, and (d) t = 12.5 h. 616
Page 21
21
617 Fig. 9. Measurements of the ozone-initiated UFPs in a Boeing 737-700 flight and the 618
corresponding contributions by ozone reactions with passengers’ clothing as computed by the 619
model. 620
Page 22
22
Table1. Various physical and modeling constants used in this investigation 621
Variable Estimated value Variable Estimated value ρ 1.2 g cm-3 D 5×10⁻⁶ m2 s-1
kozone-ex 2×10⁻¹⁰ kg m-2 h-1 ppb-1 CSVOC,sat 1×10-13 kg m-3 kozone 1×10⁻³ h-1 ppb-1 σ .025 kg s-2
C0,skin-oils 2×10⁻⁷ kg m-2 kkin 8.4×1025 m3 kg-2 s-1 m 250 amu kact 1.6×10¹⁶ kg-1 s-1
ρ is the particle density ; kozone the ozone/skin-oils reaction rate constant; kozone-ex the ozone/skin-oils reaction rate constant with the assumption of excess skin-oils; C0,skin-oils the initial concentration of skin-oils on the T-shirt; m, D, and σ the molecular mass, diffusion coefficient, and surface tension of the SVOC; CSVOC,sat the SVOC concentration in a saturated vapor at equilibrium; kkin and kact the kinetic and activation nucleation constants, respectively.
622
Table 2. Details of the experimental conditions in the chamber used for simulating particle 623
generation from ozone reactions with human clothing 624
Case Ozone
concentration (ppb)
Hours the T-shirt was
worn (h)
Air change rate (h-1)
1 22 6 0.5 2 40 6 0.5 3 57 12 0.5 4 148 6 0.5 5 51 6 2.7 6 133 6 2.7
625
626
Page 23
23
SUPPLEMENTARY MATERIALS 627
Model sensitivity analysis 628
This investigation performed a model sensitivity analysis to identify the critical modeling 629
constants and their impact on the predictions obtained by using the thermodynamic nucleation 630
model. We used the one-at-a-time approach while conducting the sensitivity analysis. Following 631
this approach, we changed one constant by ±10% and kept all others at their baseline values and 632
computed the model outputs (particle mass and number concentrations). Then we returned that 633
constant to its baseline value and repeated the previous step for each of the other constants. Thus, 634
we systematically studied the sensitivity of the model output to each of the model inputs. 635
Figures S1 is a tornado diagram representing percentage change in peak particle number 636
concentration for Case 2 (40 ppb ozone) when the model constants were varied by ±10%. In a 637
tornado diagram the inputs (on the y axis) are arranged systematically from top to bottom such 638
that the ones that cause maximum variation in the output are at the top. Clearly, Figure S1 shows 639
that the peak particle number concentration in Case 2 was the most sensitive to variations in σ, 640
m, and ρ. Likewise, the tornado diagrams for the peak particle number concentration in Cases 1, 641
3, and 4 also showed similar results. Such results are due to the high sensitivity of the 642
thermodynamic nucleation model to small changes in σ, m, and ρ since these constants appear in 643
the exponential term of the nucleation rate expression given by Eq. (8). 644
645 Fig. S1. Percentage change in the computed peak particle number concentration for Case 2 when 646
the model constants were varied by ±10% from their base values given in Table 1. 647
Page 24
24
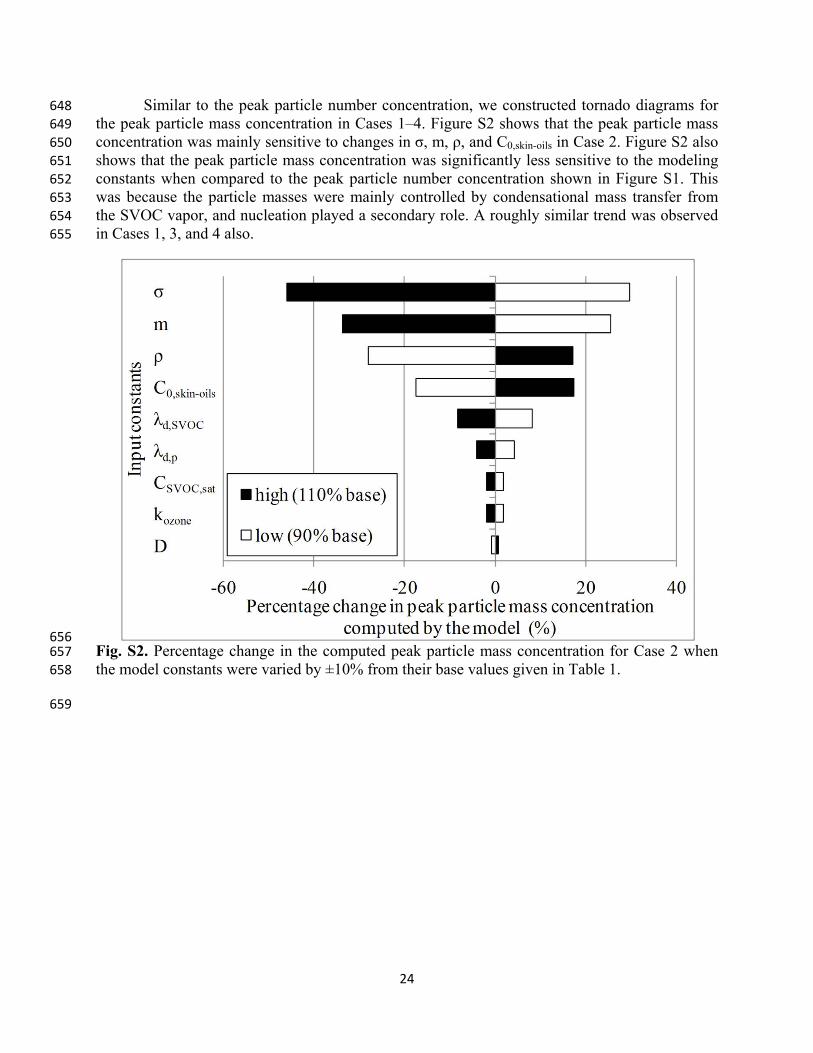
Similar to the peak particle number concentration, we constructed tornado diagrams for 648
the peak particle mass concentration in Cases 1–4. Figure S2 shows that the peak particle mass 649
concentration was mainly sensitive to changes in σ, m, ρ, and C0,skin-oils in Case 2. Figure S2 also 650
shows that the peak particle mass concentration was significantly less sensitive to the modeling 651
constants when compared to the peak particle number concentration shown in Figure S1. This 652
was because the particle masses were mainly controlled by condensational mass transfer from 653
the SVOC vapor, and nucleation played a secondary role. A roughly similar trend was observed 654
in Cases 1, 3, and 4 also. 655
656 Fig. S2. Percentage change in the computed peak particle mass concentration for Case 2 when 657
the model constants were varied by ±10% from their base values given in Table 1. 658
659