ISSN 1 746-7233, England, UK World Journal of Modelling and Simulation Vol. 10 (2014) No. 1, pp. 49-59 Numerical simulation of effects of machining parameters and tool geometry using DEFORM-3D: Optimization and experimental validation T. Tamizharasan 1* , N. Senthilkumar 2 1 Principal, TRP Engineering College, Tiruchirappalli 621 105, India 2 Adhiparasakthi Engineering College, Melmaruvathur, TamilNadu India-603319 (Received November 21 2012, Accepted August 29 2013) Abstract. This research work focusses on optimization of machining and geometrical parameters during turning AISI 1045 steel using carbide cutting tool insert, by Finite Element Analysis and Taguchi’s Technique. Three levels of cutting speed, feed rate, depth of cut, cutting insert shape, relief angle and nose radius are chosen. A suitable L18 Orthogonal array is selected based on Taguchi’s Design of Experiments (DoE) and the simulation analysis is carried out using DEFORM-3D, machining simulation software and the output quality characteristics such as tool-chip interface temperature, interface pressure, wear depth, cutting forces and tool stress are analyzed by Signal-to-Noise (S/N) ratio. Analysis of Variance is performed to determine the most contributing factor, which shows that cutting insert shape is the most prominent parameter contributing by 37.84%, cutting speed by 13.47% and depth of cut by 11.56%. From the optimum condition evolved, validation is done experimentally and by FEM. It is observed that 18.81% increase in quality characteristics are achieved using the optimum condition. Keywords: Tool geometry, flankwear, FEM analysis, Taguchi, DEFORM-3D 1 Introduction Turning is a machining process for generating external surfaces of revolution by the action of a cutting tool on a rotating workpiece, done in a lathe. Cutting tool life is one of the most important economic con- siderations in metal cutting along with quality surface generated and cutting forces generated. In roughing operations, the tool material, the various tool angles, cutting speeds, and feed rates, are usually chosen to give an economical tool life. On the other hand, the use of very low speeds and feeds to give long tool life will not be economical because of the low production rate. The depth of cut should be as great as consistent with the strength and size of any cutting tool or carbide inserts when used, and the amount of stock to be removed. The feed depends on the desired finish and the strength and rigidity of the part and the machine. Cutting speed depends primarily on workpiece hardness and tool material [23] . By continually improving the carbide cutting tool insert geometries, the efficiency and effectiveness of machining process can be increased [20] . Machining a particular material under suitable conditions requires an optimal set of machining parameters and tool geometry [10] . The cutting life of carbide inserts can only be determined by cutting tests under real operating conditions. But model wear tests using finite element methods would be very much useful for the pre-selection of machining parameters and tool geometries. The main objective of this work is to study the effects of machining parameters such as cutting speed, feed rate, depth of cut and tool geometries such as cutting insert shape, relief angle and nose radius on flank wear [3] , temperatures generated, cutting forces and stress on the inserts [12, 19] . The different shapes of inserts used for machining are shown in Fig. 1. * Corresponding author. Tel.: +0431-2908050; fax: +0431-4298951. E-mail address: [email protected]. Published by World Academic Press, World Academic Union
Transcript
ISSN 1 746-7233, England, UKWorld Journal of Modelling and Simulation
Vol. 10 (2014) No. 1, pp. 49-59
Numerical simulation of effects of machining parameters and tool geometryusing DEFORM-3D: Optimization and experimental validation
(Received November 21 2012, Accepted August 29 2013)
Abstract. This research work focusses on optimization of machining and geometrical parameters duringturning AISI 1045 steel using carbide cutting tool insert, by Finite Element Analysis and Taguchi’s Technique.Three levels of cutting speed, feed rate, depth of cut, cutting insert shape, relief angle and nose radius arechosen. A suitable L18 Orthogonal array is selected based on Taguchi’s Design of Experiments (DoE) andthe simulation analysis is carried out using DEFORM-3D, machining simulation software and the outputquality characteristics such as tool-chip interface temperature, interface pressure, wear depth, cutting forcesand tool stress are analyzed by Signal-to-Noise (S/N) ratio. Analysis of Variance is performed to determine themost contributing factor, which shows that cutting insert shape is the most prominent parameter contributingby 37.84%, cutting speed by 13.47% and depth of cut by 11.56%. From the optimum condition evolved,validation is done experimentally and by FEM. It is observed that 18.81% increase in quality characteristicsare achieved using the optimum condition.
Keywords: Tool geometry, flank wear, FEM analysis, Taguchi, DEFORM-3D
1 Introduction
Turning is a machining process for generating external surfaces of revolution by the action of a cuttingtool on a rotating workpiece, done in a lathe. Cutting tool life is one of the most important economic con-siderations in metal cutting along with quality surface generated and cutting forces generated. In roughingoperations, the tool material, the various tool angles, cutting speeds, and feed rates, are usually chosen to givean economical tool life. On the other hand, the use of very low speeds and feeds to give long tool life willnot be economical because of the low production rate. The depth of cut should be as great as consistent withthe strength and size of any cutting tool or carbide inserts when used, and the amount of stock to be removed.The feed depends on the desired finish and the strength and rigidity of the part and the machine. Cutting speeddepends primarily on workpiece hardness and tool material[23].
By continually improving the carbide cutting tool insert geometries, the efficiency and effectiveness ofmachining process can be increased[20]. Machining a particular material under suitable conditions requiresan optimal set of machining parameters and tool geometry[10]. The cutting life of carbide inserts can onlybe determined by cutting tests under real operating conditions. But model wear tests using finite elementmethods would be very much useful for the pre-selection of machining parameters and tool geometries. Themain objective of this work is to study the effects of machining parameters such as cutting speed, feed rate,depth of cut and tool geometries such as cutting insert shape, relief angle and nose radius on flank wear[3],temperatures generated, cutting forces and stress on the inserts[12, 19]. The different shapes of inserts used formachining are shown in Fig. 1.
Published by World Academic Press, World Academic Union
50 T. Tamizharasan & N. Senthilkumar: Numerical simulation of effects of machining parameters
requires an optimal set of machining parameters and tool geometry. The cutting life of carbide inserts can only be determined by cutting tests under real operating conditions. But model wear tests using finite element methods would be very much useful for the pre-selection of machining parameters and tool geometries. The main objective of this work is to study the effects of machining parameters such as cutting speed, feed rate, depth of cut and tool geometries such as cutting insert shape, relief angle and nose radius on flank wear [2], temperatures generated, cutting forces [15] and stress [22] on the inserts. The different shapes of inserts used for machining are shown in Fig 1.
Fig. 1 Shapes of cutting inserts
Finite element simulation [3, 4] is carried out by varying the machining parameters [6] and tool
geometries [10, 12, 25]. The cutting speed are chosen as 285 m/min, 256 m/min and 227 m/min, feed rate as 0.203 mm/rev, 0.318 mm/rev and 0.432 mm/rev and depth of cut as 0.3 mm, 0.45 mm and 0.6 mm and cutting inserts selected are C (Diamond 80˚), D (Diamond 55˚) and S (Diamond 90˚) and relief angle as 0˚, 3˚ and 7˚ and nose radius as 0.4 mm, 0.8 mm and 1.2 mm. For 6 parameters varied through 3 levels an L18 Orthogonal array is selected and the experiments are designed using Taguchi’s Design of Experiment. Based on the designed L18 Orthogonal array, finite element simulation is carried out using commercially available DEFORM-3D software [20]. DEFORM is an engineering simulation software used by designers to analyze metal forming, machining and heat treatment processes by trial and error method. DEFORM is an effective tool for research and industrial applications. Many researchers have performed FEM analysis to study the effects of machining parameters for different materials. Based on the literature survey conducted, it is observed that no researcher has performed FEM analysis combining both the machining and geometrical parameters, as it is chosen in this present work. Researchers have considered different shapes of cutting insert having different nose radius separately only or its combination in limited. But in this research work, all parameters are considered for performing the FEM analysis.
The main contribution in this research work is to study the performance of carbide cutting tool inserts during turning AISI 1045 steel by varying the machining and geometrical parameters. The future scope is to study the effect of rake angle inclination and approach angle of cutting tools during machining with uncoated and coated inserts. Following the introduction part, the materials used as cutting insert and workpiece are given, followed by a brief introduction about the finite element method, with its need and cutting inserts modeled with meshing details. The technique used for analyzing the output parameter is described after it, followed by the simulation results obtained and a brief analysis of the results. Details of both FEM validation and experimental validation are provided and finally the results are concluded.
2. Materials for Cutting insert and Workpiece The workpiece material used for the plane-strain orthogonal metal cutting simulation is AISI 1045 carbon steel whose chemical composition is given in Table 1. AISI 1045 is a low cost alloy with adequate strength and toughness suitable for most of the engineering and construction applications, whose Brinell hardness value is 181 HB. Engineering applications of AISI 1045 steel includes shafts, pins, bolts, gears, forgings, cold drawing and extrusion.
Fig. 1. Shapes of cutting inserts
Finite element simulation[8, 16] is carried out by varying the machining parameters[18] and toolgeometries[9, 24, 27]. The cutting speed are chosen as 285 m/min, 256 m/min and 227 m/min, feed rate as 0.203mm/rev, 0.318 mm/rev and 0.432 mm/rev and depth of cut as 0.3 mm, 0.45 mm and 0.6 mm and cutting insertsselected are C (Diamond 80º), D (Diamond 55º) and S (Diamond 90º) and relief angle as 0º, 3ºand 7ºand noseradius as 0.4 mm, 0.8 mm and 1.2 mm. For 6 parameters varied through 3 levels an L18 Orthogonal arrayis selected and the experiments are designed using Taguchi’s Design of Experiment. Based on the designedL18 Orthogonal array, finite element simulation is carried out using commercially available DEFORM-3Dsoftware[13]. DEFORM is an engineering simulation software used by designers to analyze metal forming,machining and heat treatment processes by trial and error method. DEFORM is an effective tool for researchand industrial applications. Many researchers have performed FEM analysis to study the effects of machiningparameters for different materials. Based on the literature survey conducted, it is observed that no researcherhas performed FEM analysis combining both the machining and geometrical parameters, as it is chosen inthis present work. Researchers have considered different shapes of cutting insert having different nose radiusseparately only or its combination in limited. But in this research work, all parameters are considered forperforming the FEM analysis.
The main contribution in this research work is to study the performance of carbide cutting tool insertsduring turning AISI 1045 steel by varying the machining and geometrical parameters. The future scope is tostudy the effect of rake angle inclination and approach angle of cutting tools during machining with uncoatedand coated inserts. Following the introduction part, the materials used as cutting insert and workpiece aregiven, followed by a brief introduction about the finite element method, with its need and cutting insertsmodeled with meshing details. The technique used for analyzing the output parameter is described after it,followed by the simulation results obtained and a brief analysis of the results. Details of both FEM validationand experimental validation are provided and finally the results are concluded.
2 Materials for cutting insert and workpiece
The workpiece material used for the plane-strain orthogonal metal cutting simulation is AISI 1045 carbonsteel whose chemical composition is given in Table 1. AISI 1045 is a low cost alloy with adequate strength andtoughness suitable for most of the engineering and construction applications, whose Brinell hardness value is181 HB. Engineering applications of AISI 1045 steel includes shafts, pins, bolts, gears, forgings, cold drawingand extrusion.
Table 1. Chemical composition of AISI 1045 steel
C Si Mn Cr Mo Ti V W P S Cu Al Fe0.312 0.189 0.852 0.025 0.033 0.005 0.004 0.033 0.039 0.011 0.031 0.037 Remainder
The SEM image of AISI 1045 steel is shown in Fig. 2, which has large grains of pearlite in a matrix offerrite. The microstructure is typical of medium carbon steel that has been hot rolled and re-crystallized. Theflow line of the grains clearly shows the hot working operation carried out. The matrix is free from sulphidestringers which is a non-metallic inclusion. The grain size of the matrix is ASTM grain size No: 6 as perASTM grain size measurement. The grain size is calculated as the average of five fields.
The SEM image of AISI 1045 steel is shown in Fig. 2, which has large grains of pearlite in a matrix of ferrite. The microstructure is typical of medium carbon steel that has been hot rolled and re-crystallized. The flow line of the grains clearly shows the hot working operation carried out. The matrix is free from sulphide stringers which is a non-metallic inclusion. The grain size of the matrix is ASTM grain size No: 6 as per ASTM grain size measurement. The grain size is calculated as the average of five fields.
Fig. 2: SEM image of AISI 1045 steel.
The cutting insert material used is uncoated Tungsten carbide [1] WIDIA make, whose material
composition is given in Table 2.
Table 2 Chemical compositions of tungsten carbide insert
Fig. 3 shows the SEM image of cemented carbide insert in which the tungsten carbide particles areembedded in a matrix of titanium carbide, bonded by cobalt.
3 Finite element method
In recent years, finite element analysis[11, 15] has become the main tool for simulating orthogonal ma-chining processes[6, 17]. Finite element analysis is preferred over experimental work because it saves time andcost. Moreover the results obtained from the finite element analysis stays close to the results obtained from theexperimental work. Finite element method is proved to be an effective technique for analyzing chip formationprocesses and in predicting process variables such as temperatures, pressures[5, 26], forces and stresses etc.For our analysis, 18 different uncoated tungsten carbide cutting inserts are modeled using SOLIDWORKS,for various combination of cutting insert shape (included angle of insert), relief angle and nose radius. Themodeled cutting tool inserts are shown in Fig. 4.
3. Finite Element Method In recent years, finite element analysis [5, 11] has become the main tool for simulating orthogonal machining processes [9, 16]. Finite element analysis is preferred over experimental work because it saves time and cost. Moreover the results obtained from the finite element analysis stays close to the results obtained from the experimental work. Finite element method is proved to be an effective technique for analyzing chip formation processes and in predicting process variables such as temperatures, pressures [17, 24], forces and stresses etc. For our analysis, 18 different uncoated tungsten carbide cutting inserts are modeled using SOLIDWORKS, for various combination of cutting insert shape (included angle of insert), relief angle and nose radius. The modeled cutting tool inserts are shown in Fig. 4.
Fig. 4: Modeled cutting inserts used in FEM analysis.
DEFORM-3D uses Usui’s tool wear model to compute cutting insert wear, which can be used only
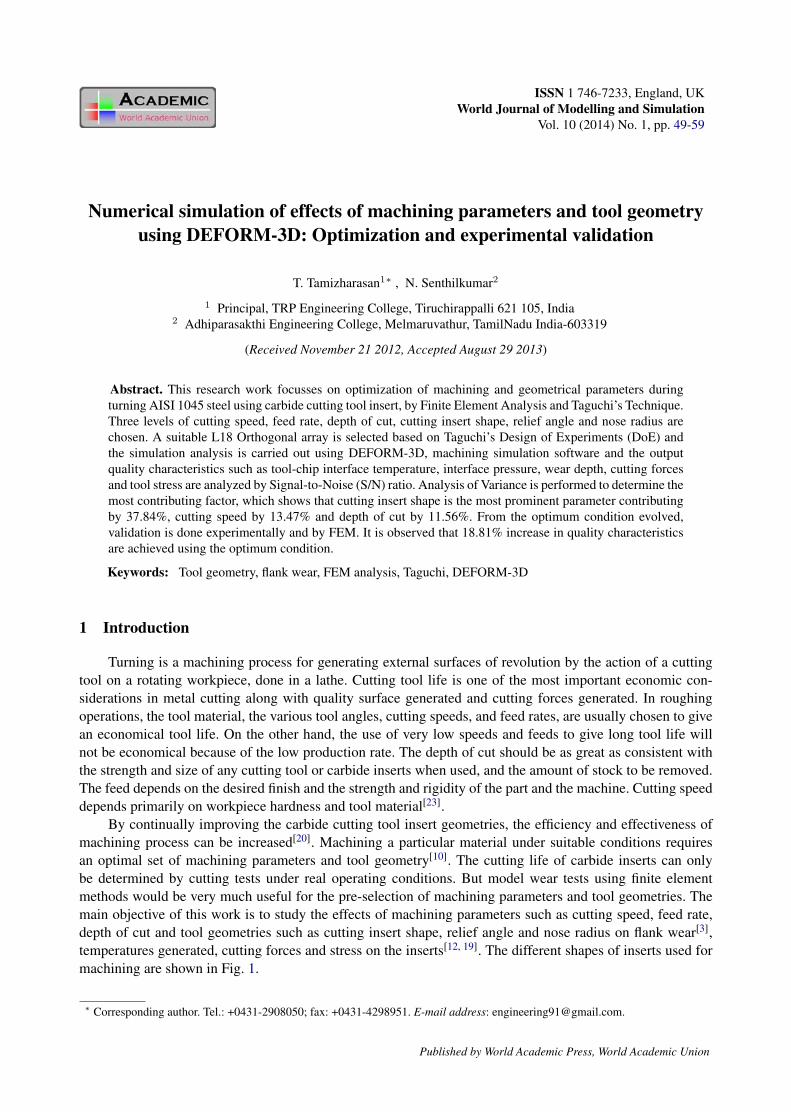
with non-isothermal run as it requires interface temperature calculations. The initial temperature for the workpiece and tool is set as 30˚C (room temperature). During meshing of cutting insert, the numbers of tetrahedron elements are fixed as 30000, while the number of elements in workpiece is kept at 25 % of feed rate. A finer mesh can be seen at the tool tip and in the workpiece, where the tool comes in contact with the workpiece [18, 19]. The tetrahedral mesh of uncoated carbide insert and workpiece is shown in Fig. 5. The finite element analysis is carried out on a computer having a configuration of Intel core i3, [email protected] GHz, 2 GB RAM with Windows 7, 32 bit operating system.
Fig. 5: Tetrahedral mesh of tool and workpiece.
Fig. 4. Modeled cutting inserts used in FEM analysis
DEFORM-3D uses Usui’s tool wear model to compute cutting insert wear, which can be used only withnon-isothermal run as it requires interface temperature calculations. The initial temperature for the workpiece
52 T. Tamizharasan & N. Senthilkumar: Numerical simulation of effects of machining parameters
and tool is set as 30ºC (room temperature). During meshing of cutting insert, the numbers of tetrahedronelements are fixed as 30000, while the number of elements in workpiece is kept at 25% of feed rate. A finermesh can be seen at the tool tip and in the workpiece, where the tool comes in contact with the workpiece[1, 2].The tetrahedral mesh of uncoated carbide insert and workpiece is shown in Fig. 5. The finite element analysisis carried out on a computer having a configuration of Intel core i3, M3502.27 GHz, 2 GB RAM with Windows7, 32 bit operating system.
3. Finite Element Method In recent years, finite element analysis [5, 11] has become the main tool for simulating orthogonal machining processes [9, 16]. Finite element analysis is preferred over experimental work because it saves time and cost. Moreover the results obtained from the finite element analysis stays close to the results obtained from the experimental work. Finite element method is proved to be an effective technique for analyzing chip formation processes and in predicting process variables such as temperatures, pressures [17, 24], forces and stresses etc. For our analysis, 18 different uncoated tungsten carbide cutting inserts are modeled using SOLIDWORKS, for various combination of cutting insert shape (included angle of insert), relief angle and nose radius. The modeled cutting tool inserts are shown in Fig. 4.
Fig. 4: Modeled cutting inserts used in FEM analysis.
DEFORM-3D uses Usui’s tool wear model to compute cutting insert wear, which can be used only
with non-isothermal run as it requires interface temperature calculations. The initial temperature for the workpiece and tool is set as 30˚C (room temperature). During meshing of cutting insert, the numbers of tetrahedron elements are fixed as 30000, while the number of elements in workpiece is kept at 25 % of feed rate. A finer mesh can be seen at the tool tip and in the workpiece, where the tool comes in contact with the workpiece [18, 19]. The tetrahedral mesh of uncoated carbide insert and workpiece is shown in Fig. 5. The finite element analysis is carried out on a computer having a configuration of Intel core i3, [email protected] GHz, 2 GB RAM with Windows 7, 32 bit operating system.
Fig. 5: Tetrahedral mesh of tool and workpiece.
Fig. 5. Tetrahedral mesh of tool and workpiece
In Usui’s tool wear model, given by Eq. (1), the wear rate is a function of constant pressure, relativevelocity and absolute temperature at the contact surface. The constants of the wear rate model are taken asA = 0.0000000078 and B = 5302[25].
dw
dt= AσuVse
(−B/T ). (1)
4 Taguchi’s technique
The Taguchi method [14, 21] is a powerful tool in quality optimization. Optimization is carried outto utilize the available resources effectively to achieve better results[7, 22]. Taguchi method makes use of aspecial design of orthogonal array (OA) to examine the quality characteristics through a minimal number ofexperiments. The experimental results based on the orthogonal array are then transformed into S/N ratio toevaluate the performance characteristics. Taguchi design of experiments is used to design the orthogonal arrayfor 6 parameters such as cutting speed, feed rate, depth of cut, cutting insert shape, relief angle and noseradius and for each parameter 3 different values that are chosen is shown in Tab. 3. The minimum number ofexperiments to be conducted for the parametric optimization is calculated as,
Parameter/Level Symbol Level I Level 2 Level 3Cutting Speed (m/min) A 227 256 285Feed Rate (mm/rev) B 0.432 0.318 0.203Depth of Cut (mm) C 0.3 0.45 0.6Cutting Tool Insert Shape D C (80º) D(55º) S(90º)Relief Angle (º) E 0 3 7Nose Radius (mm) F 0.4 0.8 1.2
The various combinations of machining and geometrical parameters, designed using Taguchi’s design ofexperiments, based on which the simulation analysis are to be conducted is shown in Tab. 4.
Based on the designed L18 Orthogonal array, finite element simulations are carried out and the responseparameters like tool-chip interface temperature, interface pressure, wear depth, resultant cutting force andstresses acting on cutting tool are determined. The statistical measure of quality characteristic like Signal-to-Noise ratio is applied to analyze the effect of various machining parameters and cutting tool geometries on theoutput parameters. For analysis, there are 3 categories of performance characteristics, (i.e.) Smaller-the-better,Larger-the-better and Nominal-the-better.
World Journal of Modelling and Simulation, Vol. 10 (2014) No. 1, pp. 49-59 53
Table 4. L18 Inner orthogonal array
Trial Cutting Speed Feed Rate Depth of Cut Insert Shape Relief Angle Nose Radius ISO Insert DesignationNo (m/min) (mm/rev) (mm) (º) (mm)1 227 0.432 0.3 C 0 0.4 CNMG 12 04 042 227 0.318 0.45 D 3 0.8 DAMG 15 04 083 227 0.203 0.6 S 7 1.2 SCMG 12 04 124 256 0.432 0.3 D 3 1.2 DAMG 15 04 125 256 0.318 0.45 S 7 0.4 SCMG 12 04 046 256 0.203 0.6 C 0 0.8 CNMG 12 04 087 285 0.432 0.45 C 7 0.8 CCMG 12 04 088 285 0.318 0.6 D 0 1.2 DNMG 15 04 129 285 0.203 0.3 S 3 0.4 SAMG 12 04 0410 227 0.432 0.6 S 3 0.8 SAMG 12 04 0811 227 0.318 0.3 C 7 1.2 CCMG 12 04 1212 227 0.203 0.45 D 0 0.4 DNMG 15 04 0413 256 0.432 0.45 S 0 1.2 SNMG 12 04 1214 256 0.318 0.6 C 3 0.4 CAMG 12 04 0415 256 0.203 0.3 D 7 0.8 DCMG 15 04 0816 285 0.432 0.6 D 7 0.4 DCMG 15 04 0417 285 0.318 0.3 S 0 0.8 SNMG 12 04 0818 285 0.203 0.45 C 3 1.2 CAMG 12 04 12
Smaller-the better (Minimize): S/N = −10 log
(1n
n∑i=1
y2i
), (2)
Larger-the better (Maximize): S/N = −10 log
(1n
n∑i=1
1y2
i
), (3)
Nominal-the best: S/N = 10 log(
y
s2y
). (4)
For our objective, to obtain optimal machining performance, the smaller-the-better performance charac-teristic of output parameters should be chosen, as given by Eq. (2).
5 Simulation results and discussion
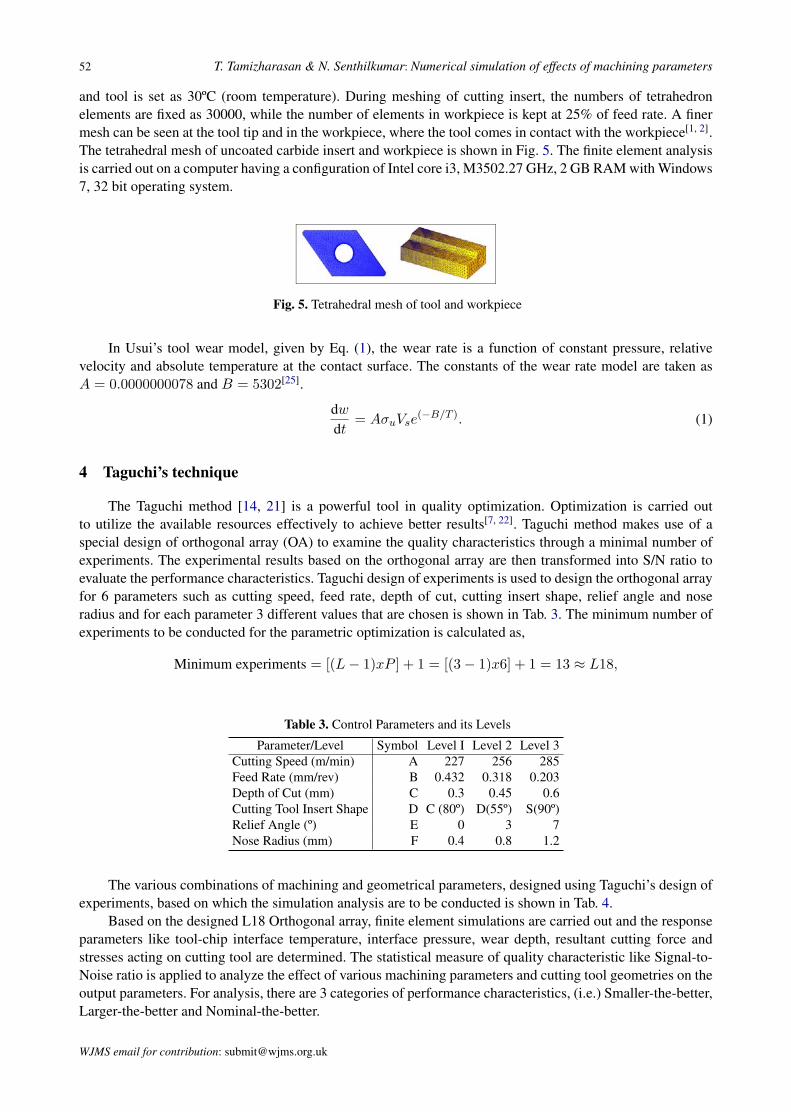
Finite element simulations are conducted to examine the effects of cutting speed, feed rate, depth of cut,cutting insert shape, relief angle and nose radius. After performing the simulation analysis, the output qualitycharacteristics like tool-chip interface temperature, tool-chip interface pressure, wear depth, resultant cuttingforces and tool stress are determined, which are tabulated in Tab. 5.
When the cutting speed increases, the chip temperature increases proportionately. The wear depth alsoincreases with increase in cutting speed. Resultant cutting forces are lower when the cutting speed is low.When the feed rate increases, the chip temperature and tool-chip interface temperature increase with increasein wear depth. When feed rate is high, the cutting forces generated become higher. When depth of cut is high,the chip temperature and tool-chip interface temperature increase with increase in wear depth and cuttingforces. When the included angle of the cutting insert is decreased, the chip temperature and tool-chip interfacetemperature become low with reduction in cutting forces. For maximum included angle, the wear depth isless, but the stress acting on the insert is high. When relief angle of the cutting insert is high, chip temperatureincreases with decrease in tool-chip interface temperature. Tool wear is low when relief angle is smaller. The
stress acting on the insert is low when the relief angle is low. When the nose radius is high, the chip tem-perature, tool-chip interface temperature, wear depth and the cutting forces generated are lower with nominalstress acting on the cutting insert. Hence it is concluded that for machining AISI 1045 steel, the cutting speedand feed rate have to be minimum with a moderate depth of cut with a less included angle of cutting tool inserthaving a minimum relief angle and a larger nose radius. Since this is a simulation of turning process usingFEM analysis, wear depth value achieved is lower. But in actual condition, the wear depth will be higher. Thisis due to the smaller mesh size at the tool-workpiece interface.
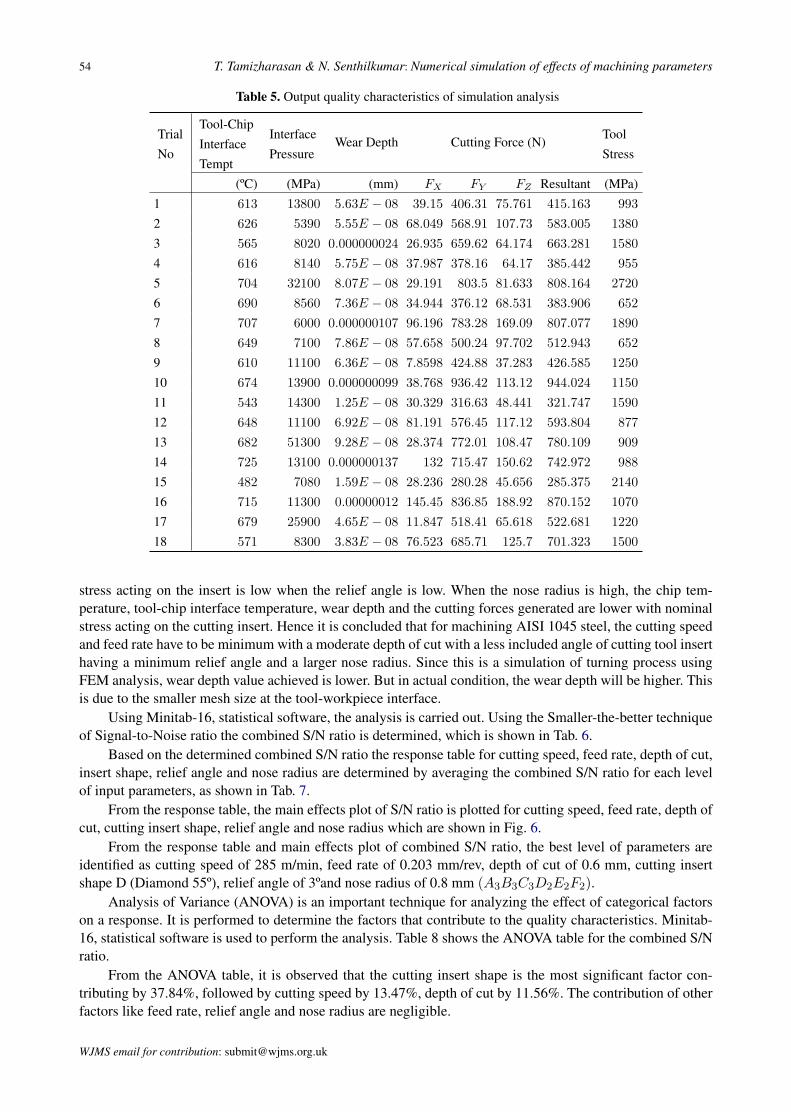
Using Minitab-16, statistical software, the analysis is carried out. Using the Smaller-the-better techniqueof Signal-to-Noise ratio the combined S/N ratio is determined, which is shown in Tab. 6.
Based on the determined combined S/N ratio the response table for cutting speed, feed rate, depth of cut,insert shape, relief angle and nose radius are determined by averaging the combined S/N ratio for each levelof input parameters, as shown in Tab. 7.
From the response table, the main effects plot of S/N ratio is plotted for cutting speed, feed rate, depth ofcut, cutting insert shape, relief angle and nose radius which are shown in Fig. 6.
From the response table and main effects plot of combined S/N ratio, the best level of parameters areidentified as cutting speed of 285 m/min, feed rate of 0.203 mm/rev, depth of cut of 0.6 mm, cutting insertshape D (Diamond 55º), relief angle of 3ºand nose radius of 0.8 mm (A3B3C3D2E2F2).
Analysis of Variance (ANOVA) is an important technique for analyzing the effect of categorical factorson a response. It is performed to determine the factors that contribute to the quality characteristics. Minitab-16, statistical software is used to perform the analysis. Table 8 shows the ANOVA table for the combined S/Nratio.
From the ANOVA table, it is observed that the cutting insert shape is the most significant factor con-tributing by 37.84%, followed by cutting speed by 13.47%, depth of cut by 11.56%. The contribution of otherfactors like feed rate, relief angle and nose radius are negligible.
With the identified optimum parameters, a new tool is modeled using SOLIDWORKS and a validationsimulation analysis is performed and the quality characteristics obtained are shown in Tab. 9.
Fig. 7 shows the chip formation during machining AISI 1045 steel with the optimum machining andgeometrical parameters along with graph showing the load acting on the cutting insert. It is observed that, theload acting on the insert is increased linearly with respect to time of the cutting tool comes in contact with the
Based on the determined combined S/N ratio the response table for cutting speed, feed rate, depth of
cut, insert shape, relief angle and nose radius are determined by averaging the combined S/N ratio for each level of input parameters, as shown in Table 7.
From the response table, the main effects plot of S/N ratio is plotted for cutting speed, feed rate, depth
of cut, cutting insert shape, relief angle and nose radius which are shown in Fig. 6.
285256227
-72.0-73.5-75.0-76.5-78.0
0.4320.3180.203 0.600.450.30
SDC
-72.0-73.5-75.0-76.5-78.0
730 1.20.80.4
Cutting Speed
Mea
n of
SN
rat
ios
Feed Rate Depth of Cut
Insert Shape Relief Angle Nose Radius
Main Effects Plot for Combined S/N ratioData Means
Signal-to-noise: Smaller is better
Fig. 6: Main Effects Plot for S/N Ratio. Fig. 6. Main effects plot for S/N ratio
Table 9. Output quality characteristics of optimal condition
Tool-Chip Temperature Interface Pressure Wear Depth Cutting Force (N) Tool Stress(ºC) (MPa) (mm) FX FY FZ Resultant (MPa)689 7650 8.47E − 08 65.375 524.38 93.086 536.576 1060
workpiece and after that during the machining process; the load acting on the cutting insert is stabilized withno more further increase in load.
Fig. 7: Simulation Result of Optimum Condition A3B3C3D2E2F2.
The stress acting on the optimum cutting insert is shown in Fig. 8. The maximum stress acting is 760 MPa. It is also seen that the stress distribution is concentrated on the cutting edge of the cutting insert. Hence the cutting insert with less included angle will experience less stress than that of the cutting inset with more included angle.
Fig. 8: Maximum Principal Stress in Optimum insert.
5.2. Experimental Validation Based on the obtained optimum condition an experiment is conducted in a CNC machine of specifications, Lokesh made 2 axis CNC TL-20, swing diameter 350mm, between center 600mm, spindle speed 4500 rpm, and the output parameters such as cutting forces is measured using a Kistler make tool dynamometer. Flank wear is measured by using a Mitutoyo digital tool makers microscope of specifications, eyepiece: 15X, view field diameter 13mm, objective 2X, working distance 67mm, total magnification 30X. Surface roughness is measured by using a Kosaka Laboratory Ltd make Surfcorder SE1200; with a vertical measuring range of 520µm, horizontal measuring range of 25mm, vertical resolution of 0.008µm, cutoff value of 0.8 mm with Gaussian filter.
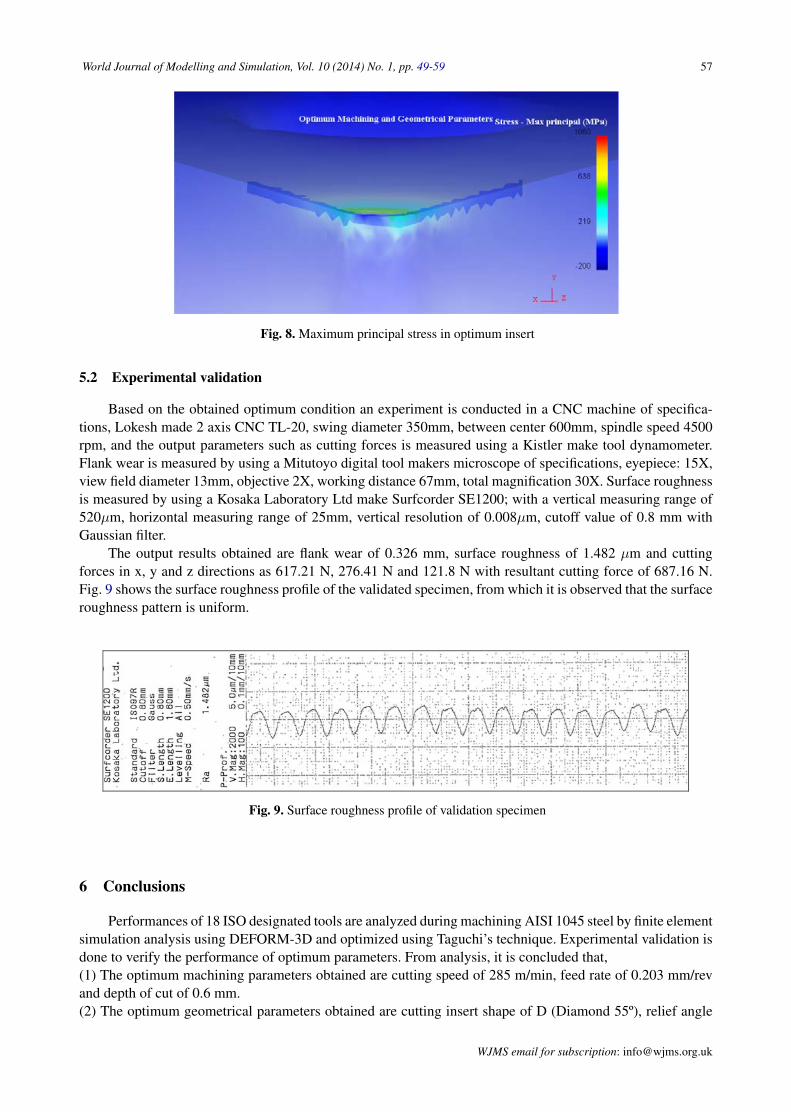
The output results obtained are flank wear of 0.326 mm, surface roughness of 1.482 µm and cutting forces in x, y and z directions as 617.21 N, 276.41 N and 121.8 N with resultant cutting force of 687.16 N. Fig. 9 shows the surface roughness profile of the validated specimen, from which it is observed that the surface roughness pattern is uniform.
Fig. 7. Simulation result of optimum condition A3B3C3D2E2F2
The stress acting on the optimum cutting insert is shown in Fig. 8. The maximum stress acting is 760MPa. It is also seen that the stress distribution is concentrated on the cutting edge of the cutting insert. Hencethe cutting insert with less included angle will experience less stress than that of the cutting inset with moreincluded angle.
World Journal of Modelling and Simulation, Vol. 10 (2014) No. 1, pp. 49-59 57
Fig. 7: Simulation Result of Optimum Condition A3B3C3D2E2F2.
The stress acting on the optimum cutting insert is shown in Fig. 8. The maximum stress acting is 760 MPa. It is also seen that the stress distribution is concentrated on the cutting edge of the cutting insert. Hence the cutting insert with less included angle will experience less stress than that of the cutting inset with more included angle.
Fig. 8: Maximum Principal Stress in Optimum insert.
5.2. Experimental Validation Based on the obtained optimum condition an experiment is conducted in a CNC machine of specifications, Lokesh made 2 axis CNC TL-20, swing diameter 350mm, between center 600mm, spindle speed 4500 rpm, and the output parameters such as cutting forces is measured using a Kistler make tool dynamometer. Flank wear is measured by using a Mitutoyo digital tool makers microscope of specifications, eyepiece: 15X, view field diameter 13mm, objective 2X, working distance 67mm, total magnification 30X. Surface roughness is measured by using a Kosaka Laboratory Ltd make Surfcorder SE1200; with a vertical measuring range of 520µm, horizontal measuring range of 25mm, vertical resolution of 0.008µm, cutoff value of 0.8 mm with Gaussian filter.
The output results obtained are flank wear of 0.326 mm, surface roughness of 1.482 µm and cutting forces in x, y and z directions as 617.21 N, 276.41 N and 121.8 N with resultant cutting force of 687.16 N. Fig. 9 shows the surface roughness profile of the validated specimen, from which it is observed that the surface roughness pattern is uniform.
Fig. 8. Maximum principal stress in optimum insert
5.2 Experimental validation
Based on the obtained optimum condition an experiment is conducted in a CNC machine of specifica-tions, Lokesh made 2 axis CNC TL-20, swing diameter 350mm, between center 600mm, spindle speed 4500rpm, and the output parameters such as cutting forces is measured using a Kistler make tool dynamometer.Flank wear is measured by using a Mitutoyo digital tool makers microscope of specifications, eyepiece: 15X,view field diameter 13mm, objective 2X, working distance 67mm, total magnification 30X. Surface roughnessis measured by using a Kosaka Laboratory Ltd make Surfcorder SE1200; with a vertical measuring range of520µm, horizontal measuring range of 25mm, vertical resolution of 0.008µm, cutoff value of 0.8 mm withGaussian filter.
The output results obtained are flank wear of 0.326 mm, surface roughness of 1.482 µm and cuttingforces in x, y and z directions as 617.21 N, 276.41 N and 121.8 N with resultant cutting force of 687.16 N.Fig. 9 shows the surface roughness profile of the validated specimen, from which it is observed that the surfaceroughness pattern is uniform.
Fig. 9: Surface roughness profile of validation specimen.
6. Conclusions Performances of 18 ISO designated tools are analyzed during machining AISI 1045 steel by finite
element simulation analysis using DEFORM-3D and optimized using Taguchi’s technique. Experimental validation is done to verify the performance of optimum parameters. From analysis, it is concluded that, 1. The optimum machining parameters obtained are cutting speed of 285 m/min, feed rate of 0.203
mm/rev and depth of cut of 0.6 mm. 2. The optimum geometrical parameters obtained are cutting insert shape of D (Diamond 55˚), relief
angle of 3˚ and nose radius of 0.8 mm. i.e., DAMG 15 04 08. 3. From Analysis of Variance, it is observed that the cutting insert shape is the most significant
parameter contributing 37.84%, cutting speed by 13.47% and depth of cut by 11.56%. The contribution of feed rate, relief angle and nose radius are not that much significant.
4. A decrease in output quality characteristics such as interface temperature, interface pressure, wear depth, resultant cutting force and tool stress by 18.81% is achieved by machining with the optimum tool and machining parameters.
5. In future, the performance of coated carbide cutting tool with or without chip breakers can be analyzed. In addition, the influence of approach angle of cutting tool insert during turning may also be investigated.
References [1] A. Attanasio, E. Ceretti, A. Fiorentino, C. Cappellini, and C. Giardini, “Investigation and FEM-based
simulation of tool wear in turning operations with uncoated carbide tools”, Wear. 269 (2010), pp. 344–350. [2] A. Attanasio, E. Ceretti, S. Rizzuti, D. Umbrello, and F. Micari F, “3D finite element analysis of tool wear in
machining”, CIRP Annals - Manufacturing Technology. 57 (2008), pp. 61–64. [3] C. Maranhao, and J. Paulo Davim, “Finite element modelling of machining of AISI 316 steel: Numerical
simulation and experimental validation”, Simulation Modelling Practice and Theory. 18 (2010), pp. 139–156. [4] C.Z. Duan, T. Dou, Y.J. Cai, and Y.Y. Li, “Finite Element Simulation and Experiment of Chip Formation
Process during High Speed Machining of AISI 1045 Hardened Steel”, International Journal of Recent Trends in Engineering. 1 (5) (2009), pp. 46-50.
[5] Dechrit Maneetham , and Nitin Afzulpurkar, “Modeling, simulation and control of high speed nonlinear hydraulic servo System”, World Journal of Modelling and Simulation. 6(1) (2010), pp. 27-39.
[6] Erik Oberg, Franklin D. Jones, Holbrook L. Horton, and Henry H. Ryffel, “Machinery’s Handbook 28th Edition”, Industrial Press, New York, 2008.
[7] George Schneider, and Jr Cmfge, “Cutting Tool Applications”, GMRS Associates, 2002.
Fig. 9. Surface roughness profile of validation specimen
6 Conclusions
Performances of 18 ISO designated tools are analyzed during machining AISI 1045 steel by finite elementsimulation analysis using DEFORM-3D and optimized using Taguchi’s technique. Experimental validation isdone to verify the performance of optimum parameters. From analysis, it is concluded that,(1) The optimum machining parameters obtained are cutting speed of 285 m/min, feed rate of 0.203 mm/revand depth of cut of 0.6 mm.(2) The optimum geometrical parameters obtained are cutting insert shape of D (Diamond 55º), relief angle
58 T. Tamizharasan & N. Senthilkumar: Numerical simulation of effects of machining parameters
of 3ºand nose radius of 0.8 mm. i.e., DAMG 15 04 08.(3) From Analysis of Variance, it is observed that the cutting insert shape is the most significant parametercontributing 37.84%, cutting speed by 13.47% and depth of cut by 11.56%. The contribution of feed rate,relief angle and nose radius are not that much significant.(4) A decrease in output quality characteristics such as interface temperature, interface pressure, wear depth,resultant cutting force and tool stress by 18.81% is achieved by machining with the optimum tool and machin-ing parameters.(5) In future, the performance of coated carbide cutting tool with or without chip breakers can be analyzed. Inaddition, the influence of approach angle of cutting tool insert during turning may also be investigated.
References
[1] P. Arrazola, T. Ozel. Investigations on the effects of friction modeling in finite element simulation of machining.International Journal of Mechanical Sciences, 2010, 52: 31–42.
[2] P. Arrazola, D. Ugarte, X. Dominguez. A new approach for the friction identification during machining throughthe use of finite element modeling. International Journal of Machine Tools & Manufacture, 2008, 48: 173–183.
[3] A. Attanasio, E. Ceretti, et al. 3d finite element analysis of tool wear in machining. CIRP Annals - ManufacturingTechnology, 2008, 57: 61–64.
[4] A. Attanasio, E. Ceretti, et al. Investigation and fem-based simulation of tool wear in turning operations withuncoated carbide tools. Wear, 2010, 269: 344–350.
[5] O. Beg, O. Makinde, et al. Hydromagnetic viscous flow in a rotating annular high-porosity medium with nonlinerforchheimer drag effects: numerical study. World Journal of Modelling and Simulation, 2012, 8(2): 83–95.
[6] H. Bil, S. Kilic, A. Tekkaya. A comparison of orthogonal cutting data from experiments with three different finiteelement models. International Journal of Machine Tools & Manufacture, 2004, 44: 933–944.
[7] K. Deep, K. Das. Optimization of infiltration parameters in hydrology. World Journal of Modelling and Simulation,2008, 4(2): 120–130.
[8] C. Duan, T. Dou, et al. Finite element simulation and experiment of chip formation process during high speedmachining of aisi 1045 hardened steel. International Journal of Recent Trends in Engineering, 2009, 1(5): 46–50.
[9] K. Ee, O. Jr, I. Jawahir. Finite element modeling of residual stresses in machining induced by cutting using a toolwith finite edge radius. International Journal of Mechanical Sciences, 2005, 47: 1611–1628.
[10] V. Gaitonde, S. Karnik, J. Davim. Selection of optimal mql and cutting conditions for enhancing machinability inturning of brass. Journal of Materials Processing Technology, 2008, 204: 459–464.
[11] K. Karanth, N. Sharma. Numerical analysis on the effect of varying number of diffuser vanes on impeller—diffuserflow interaction in a centrifugal fan. World Journal of Modelling and Simulation, 2009, 5(1): 63–71.
[12] Q. Li, M. Hossan. Effect of cutting force in turning hardened tool steels with cubic boron nitride inserts. Journalof Materials Processing Technology, 2007, 191: 274–278.
[13] R. Li, A. Shih. Finite element modeling of 3d turning of titanium. International Journal of Advanced Manufactur-ing Technology, 2006, 29: 253–261.
[14] Y. Liu, W. Chang, Y. Yamagata. A study on optimal compensation cutting for an aspheric surface using the taguchimethod. CIRP Journal of Manufacturing Science and Technology, 2010, 3: 40–48.
[15] D. Maneetham, N. Afzulpurkar. Modeling, simulation and control of high speed nonlinear hydraulic servo system.World Journal of Modelling and Simulation, 2010, 6(1): 27–39.
[16] C. Maranhao, J. Davim. Finite element modelling of machining of aisi 316 steel: Numerical simulation and exper-imental validation. Simulation Modelling Practice and Theory, 2010, 18: 139–156.
[17] M. Miguelez, A. Sanchez, et al. An efficient implementation of boundary conditions in an ale model for orthogonalcutting. Journal of Theoretical and Applied Mechanics, 2009, 47: 599–616.
[18] E. Oberg, F. Jones, et al. Machinery’s Handbook 28th Edition. Industrial Press, New York, 2008.[19] T. Ozel, T. Altan. Determination of workpiece flow stress and friction at the chip-tool contact for high-speed
cutting. International Journal of Machine Tools & Manufacture, 2000, 40: 133–152.[20] T. Ozel, M. Sima, et al. Investigations on the effects of multi-layered coated inserts in machining ti-6al-4v alloy
with experiments and finite element simulations. CIRP Annals - Manufacturing Technology, 2010, 59: 77–82.[21] G. Prihandana, M. Mahardika, et al. Effect of micro-powder suspension and ultrasonic vibration of dielectric
fluid in micro-edm processes-taguchi approach. International Journal of Machine Tools & Manufacture, 2009, 49:1035–1041.
[22] K. Ramji, V. Goel, et al. Optimum design of suspension system of three-wheeled motor vehicles. World Journalof Modelling and Simulation, 2007, 3(1): 36–44.
World Journal of Modelling and Simulation, Vol. 10 (2014) No. 1, pp. 49-59 59
[23] G. Schneider, J. Cmfge. Cutting Tool Applications. GMRS Associates, 2002.[24] Y. Yen, A. Jain, T. Altan. A finite element analysis of orthogonal machining using different tool edge geometries.
Journal of Materials Processing Technology, 2004, 146: 72–81.[25] Y. Yen, J. Sohner, et al. Estimation of tool wear in orthogonal cutting using the finite element analysis. Journal of
Materials Processing Technology, 2004, 146: 82–91.[26] X. Zhao, J. Xu. Numerical simulation of temperature and pressure distribution in producing gas well. World
Journal of Modelling and Simulation, 2008, 4(2): 94–103.[27] J. Zouhar, M. Piska. Modelling the orthogonal machining process using cutting tools with different geometry. MM