biomass & renewables International Journal of Heat transfer and heterogeneous chemical reactions in a biomass particle during pyrolysis were investigated using numerical simulation. The radiation heat transfer through the pores and the secondary tar cracking exhibited considerable effects on the results including the intraparticle temperature profile and the product yields. Time course of the temperature at the center of biomass particle didn’t depend on the lignin content of the biomass. However, the higher lignin content of biomass resulted in the higher yields of tar and solid and the lower yield of gas at the setting temperatures between 673 and 1073 K. The Arrhenius plot of the maximum gas generation rate exhibited two regimes having different activation energies regardless of biomass type. These two regions may be attributed to cellulose and hemicellulose decomposition at lower temperatures and lignin decomposition at higher temperatures, respectively. The maximum gas generation rate depended on the volume of the particle below a certain particle size (3.5 mm), and depended on the external surface area of the particle above 3.5 mm. Keywords: Lignocellulose; pyrolysis; tar decomposition; thermal conduction; lignin content. NUMERICAL SIMULATION OF HEAT TRANSFER AND HETEROGENEOUS CHEMICAL REACTIONS IN A BIOMASS PARTICLE DURING PYROLYSIS Ken-ichiro Tanoue 1* , Yoshimitsu Uemura 2 , Tatsuo Nishimura 1 , Miki Taniguchi 3 , Ken-ichi Sasauchi 3 1 Department of Mechanical Engineering, Yamaguchi University, Yamaguchi 755-8611, Japan 2 Center for Biofuel and Biochemical Research (CBBR), Universiti Teknologi PETRONAS, 31750 Tronoh, Perak, Malaysia 3 Chugai Ro Co.Ltd , Sakai, Osaka 592-8331, Japan * [email protected]*Corresponding author. Tel: +91 542-2317589; fax: +91 542-2368092. E-mail address: [email protected]Abstract In recent years, there has been increasing demand for quickly produced, environment-friendly energy resources; in particular, there is wide interest in the production of energy from woody biomass, using wood resources which are currently underutilized [1-4]. The use of biomass to provide energy has many advantages: it is renewable, abundant, easy to store, and carbon-neutral. As Japan has many mountains with steep slopes, it is difficult to transport the felled trees. So that, the development of a compact gasifier with having high quality, which can cope with variations both in the amount of biomass collected and in energy demand, is necessary. Furthermore, in order to ensure that the system is used in the most efficient manner, it is necessary to increase our understanding of both the reaction mechanism and heat transfer during pyrolysis of biomass. Pyrolysis of biomass consists of many interdependent reactions; nevertheless, it can be reduced to the reaction, which is universally known as the Broido-Shafizadeh mechanism [5, 6]. In the primary reactions, biomass decomposes to gas, tar and char. This reaction has been studied extensively in the form of cellulose decomposition. In the secondary reaction, the tar generated in the primary reaction decomposes to light gas and char. This model can express only wood pyrolysis. Miller et al. [7] proposed the parallel chemical reaction model of the main components, which were cellulose, hemicellulose and lignin. In our previous report, it was found that the yield of solid by pyrolysis for not only wood but also bark agreed well with the calculated one using Miller’s model [8]. However, as the model didn’t include the decomposition of tar, the calculated gas generation rate during pyrolysis could not partly reproduce the experimental one [9]. Heat transfer with including thermal conduction, radiation from the reactor wall and the heat of the chemical reactions during the pyrolysis has been also investigated by D. L. Pyle et al. [10], C. Di Blasi [11], C. P. Koufopanos et al. [12], C. P. Won et al. [13]. Although all of these researches have been investigated not only the temperature distribution but also the yield of solid during pyrolysis experimentally and numerically, there is no data for the gas generation rate except for our previous reports [9, 14, 15]. In this paper, numerical simulation of heat transfer and 1. Introduction Page 39
Transcript
biomass & renewablesInternational Journal of
Heat transfer and heterogeneous chemical reactions in a biomass particle during pyrolysis were investigated using numerical simulation. The radiation heat transfer through the pores and the secondary tar cracking exhibited considerable e�ects on the results including the intraparticle temperature pro�le and the product yields. Time course of the temperature at the center of biomass particle didn’t depend on the lignin content of the biomass. However, the higher lignin content of biomass resulted in the higher yields of tar and solid and the lower yield of gas at the setting temperatures between 673 and 1073 K. The Arrhenius plot of the maximum gas generation rate exhibited two regimes having di�erent activation energies regardless of biomass type. These two regions may be attributed to cellulose and hemicellulose decomposition at lower temperatures and lignin decomposition at higher temperatures, respectively. The maximum gas generation rate depended on the volume of the particle below a certain particle size (3.5 mm), and depended on the external surface area of the particle above 3.5 mm.
Keywords: Lignocellulose; pyrolysis; tar decomposition; thermal conduction; lignin content.
NUMERICAL SIMULATION OF HEAT TRANSFER AND HETEROGENEOUS CHEMICAL REACTIONS IN A BIOMASS PARTICLE DURING PYROLYSIS
Ken-ichiro Tanoue1*, Yoshimitsu Uemura2, Tatsuo Nishimura1, Miki Taniguchi3, Ken-ichi Sasauchi31Department of Mechanical Engineering, Yamaguchi University, Yamaguchi 755-8611, Japan2Center for Biofuel and Biochemical Research (CBBR), Universiti Teknologi PETRONAS, 31750 Tronoh, Perak, Malaysia3Chugai Ro Co.Ltd , Sakai, Osaka 592-8331, Japan*[email protected]
In recent years, there has been increasing demand for quickly produced, environment-friendly energy resources; in particular, there is wide interest in the production of energy from woody biomass, using wood resources which are currently underutilized [1-4]. The use of biomass to provide energy has many advantages: it is renewable, abundant, easy to store, and carbon-neutral.
As Japan has many mountains with steep slopes, it is di�cult to transport the felled trees. So that, the development of a compact gasi�er with having high quality, which can cope with variations both in the amount of biomass collected and in energy demand, is necessary. Furthermore, in order to ensure that the system is used in the most e�cient manner, it is necessary to increase our understanding of both the reaction mechanism and heat transfer during pyrolysis of biomass. Pyrolysis of biomass consists of many interdependent reactions; nevertheless, it can be reduced to the reaction, which is universally known as the Broido-Sha�zadeh mechanism [5, 6]. In the primary reactions, biomass decomposes to gas, tar and char. This reaction has been studied extensively in the form of cellulose
decomposition. In the secondary reaction, the tar generated in the primary reaction decomposes to light gas and char. This model can express only wood pyrolysis. Miller et al. [7] proposed the parallel chemical reaction model of the main components, which were cellulose, hemicellulose and lignin. In our previous report, it was found that the yield of solid by pyrolysis for not only wood but also bark agreed well with the calculated one using Miller’s model [8]. However, as the model didn’t include the decomposition of tar, the calculated gas generation rate during pyrolysis could not partly reproduce the experimental one [9].
Heat transfer with including thermal conduction, radiation from the reactor wall and the heat of the chemical reactions during the pyrolysis has been also investigated by D. L. Pyle et al. [10], C. Di Blasi [11], C. P. Koufopanos et al. [12], C. P. Won et al. [13]. Although all of these researches have been investigated not only the temperature distribution but also the yield of solid during pyrolysis experimentally and numerically, there is no data for the gas generation rate except for our previous reports [9, 14, 15].
In this paper, numerical simulation of heat transfer and
1. Introduction
Page 39
biomass & renewablesInternational Journal of
heterogeneous chemical reactions in a biomass particle during pyrolysis was conducted. In�uences of not only radiation heat transfer through the pores in the particle but also the tar decomposition on the temperature distribution and yield of products during pyrolysis were investigated. Furthermore, dependence of the gas generation rate on the lignin content, setting temperature and particle diameter were studied.
2. Numerical Simulation
2.1 Chemical reaction model during pyrolysis with tar decomposition
When a biomass particle was pyrolyzed around the pyrolysis temperature, TPy, it could be partly converted to an activated biomass, char, tar and gas. Figure 1 shows the proposed chemical reaction model during pyrolysis by arranging Miller’s one [7].
Figure 1 Proposed chemical reactions during pyrolysis with the e�ect of tar decomposition. βH = 0.6, βC = 0.35, βL = 0.75.
The model could reproduce the pyrolysis of the main components (hemicellulose, cellulose and lignin) of biomass [8, 9]. Firstly, every main component decomposes to the activated one. Then the tar, char and gas are formed by the successive reactions. Furthermore, the char and gas increased with the secondary decomposition of tar [16, 17]. Material balance for the component i is given by:
(1)
Table 1 shows the material balance and the expression for the chemical reaction rates Ri as a function of Wi. The units of the frequency factor and activation energy are [1/s] and [J/mol], respectively.
Table 1 Material balance and reaction rate during pyrolysis for proposed chemical reaction model
The kinetic parameters for tar decomposition proposed by C. Di Blasi [18] were used. In this study, wood and bark were selected as the representative kinds of biomass. Table 2 shows the composition of main components for wood and bark reported by Ayhan [19].
Table 2 Composition of biomass
2.2 Thermal conduction during pyrolysis
If the volume change of the particle and the convective heat transfer by the formation of tar and gas can be neglected, the energy equation of a biomass particle is given as follows:
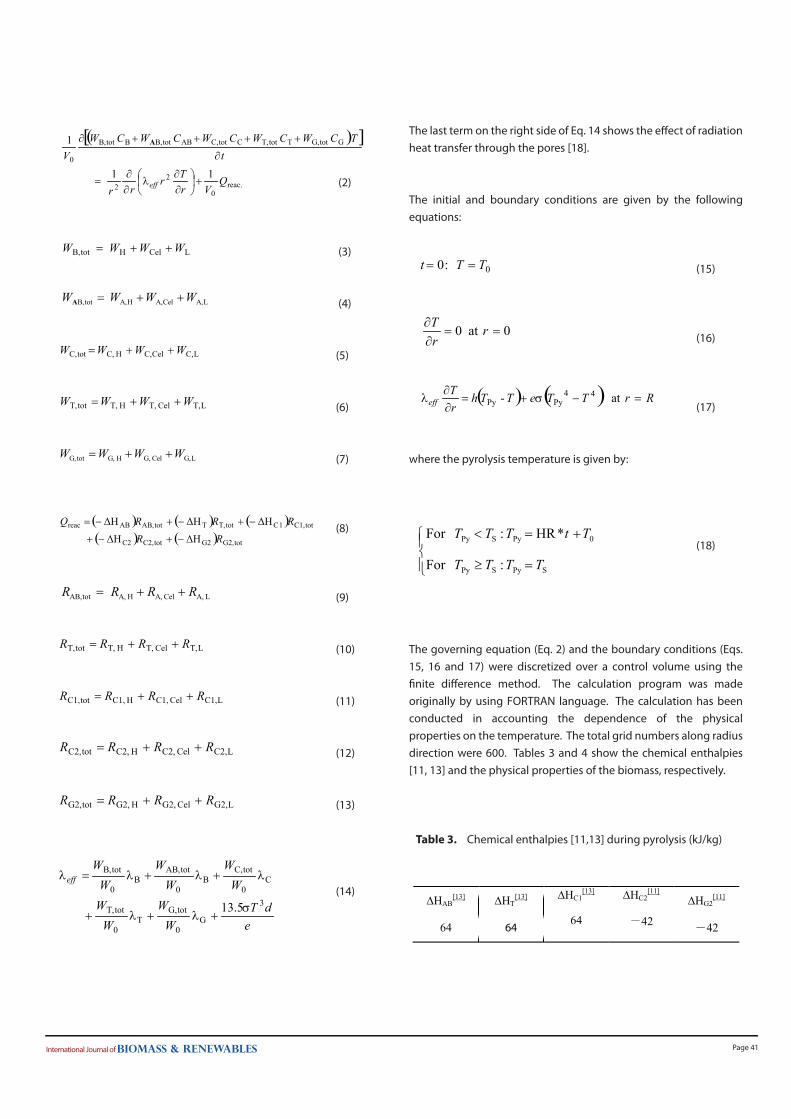
The last term on the right side of Eq. 14 shows the e�ect of radiation heat transfer through the pores [18].
The initial and boundary conditions are given by the following equations:
(15)
(16)
(17)
where the pyrolysis temperature is given by:
(18)
The governing equation (Eq. 2) and the boundary conditions (Eqs. 15, 16 and 17) were discretized over a control volume using the �nite di�erence method. The calculation program was made originally by using FORTRAN language. The calculation has been conducted in accounting the dependence of the physical properties on the temperature. The total grid numbers along radius direction were 600. Tables 3 and 4 show the chemical enthalpies [11, 13] and the physical properties of the biomass, respectively.
Table 3. Chemical enthalpies [11,13] during pyrolysis (kJ/kg)
Page 41
LA,CelA,HA,totB, WWWW ++=A
LC,CelC,H C,totC, WWWW ++=
LT,Cel T,H T,totT, WWWW ++=
LG,Cel G,H G,totG, WWWW ++=
( ) ( ) ( )( ) ( ) totG2,G2totC2,C2
totC1,1 CtotT,TtotAB,ABreac
ΔHΔHΔHΔHΔH
RRRRRQ
−+−+
−+−+−=
L A,Cel A,H A,totAB, RRRR ++=
LT,Cel T,H T,totT, RRRR ++=
LC1,Cel C1,H C1,totC1, RRRR ++=
LC2,Cel C2,H C2,totC2, RRRR ++=
LG2,Cel G2,H G2,totG2, RRRR ++=
edT
WW
WW
WW
WW
WW
eff
3
G0
totG,T
0
totT,
C0
totC,B
0
totAB,B
0
totB,
5.13 σλλ
λλλλ
+++
++=
0:0 TTt ==
0at0 ==∂∂ r
rT
( ) ( ) RrTTeTThrT
eff =−+=∂∂ at- 44
PyPy σλ
=≥
+=<
SPySPy
0PySPy
: For
*HR: For
TTTT
TtTTT
∆HAB[13] ∆HΤ
[13] ∆HC1[13] ∆HC2
[11] ∆HG2[11]
64 64 64 -42
-42
( )[ ]
reac.0
22
GtotG,TtotT,CtotC,ABtotB,BtotB,
0
11
1
QVr
Trrr
tTCWCWCWCWCW
V
eff +
∂∂
∂∂
=
∂
++++∂
λ
A
LCelHtotB, WWWW ++=
biomass & renewablesInternational Journal of
Table 4 Physical properties
2.3 Algorithm for solving heat and mass transfer during pyrolysis
For the mass transfer, the yields of solid component, tar component, gas component and the generation rate of the gas in every control volume were calculated by solving the material balance using the 4th order Runge Kutta method. On the other hand, for the heat transfer, the temperature pro�le in the particle and the temperature at the surface of the particle were solved by the THOMAS algorithm and the Newton-Raphson method, respectively. Figure 2 shows the algorithm for solving heat and mass transfer during pyrolysis. Calculation conditions are listed in Table 5.
Figure 2 Flow chart of numerical simulation for the thermal conduction during pyrolysis of a biomass particle.
Table 5 Calculation conditions
3. Results and Discussion
3.1 Radiation heat transfer through the pores during pyrolysis
Figure 3 shows the time course of temperature distribution along the radius direction during pyrolysis under the two conditions including no radiation from the pores and radiation from the pores in the particle.
Page 42
Nomenclature Value Time step [s] ∆t 0.001 Particle diameter [mm] Dp 0.03 - 30 Heating rate [K/s] HR 30 Initial temperature [K] T0 300 Setting temperature [K] TS 473 - 1073
Nomenclature Equation Reference
Specific heat [J/kg/K] C
Biomass T85.4213 +− 20
Activated biomass
T85.4213 +− Present work
Char T09.2432 + 21
Tar 200157.04.4100 TT −+− 22
Gas 2000191.0629.0770 TT −+ 22
Thermal conductivity
[W/m/K] λ
Biomass T0003.0048.0 + 11, 20
Activated biomass
T0003.0048.0 + Present work
Char T0001.0107.0 + 11,21
Tar 763.0000331.0 T Present work
Gas 763.0000331.0 T 23
True density of biomass [kg/m3] ρT 1500 24
Pore size [m] d
+−+
+
−
−
0
totAB,totB,4
0
totAB,totB,5
1*10
*10*5
WWW
WWW
22
Emissivity of biomass [J/kg/K] e 0.95 21
Initial porosity in
the particle [-] ε0 0.5 Present work
Heat transfer coefficient [W/m2/K]
h 20 13
Initial weight of the
particle [kg] W0 ( ) 3p0T 6
ε1ρ Dπ− Present work
biomass & renewablesInternational Journal of
Figure 3 Temperature distribution along the radius direction in a biomass particle during pyrolysis. TS = 773 K, Dp = 15 mm, wood.
The solid line in Fig. 3 shows the results without the radiation heat transfer through the pores in the particle. At t = 0.5 min, the temperature di�erence between the center and the surface was about 200 K. At t = 10 min, the di�erence decreased below 20 K. By comparing the solid and dashed lines, the e�ect of the radiation heat transfer through the pores became prominent at t = 5 min. As the temperature range was from 650 K to 750 K in the particle, the radiation heat transfer through the pores could occur mainly during pyrolysis of lignin [25]. Hereafter the simulation is conducted with the radiation heat transfer through the pores.
3.2 E�ect of tar decomposition during pyrolysis
Figure 4 shows the in�uence of the tar decomposition on heat transfer and chemical reaction during pyrolysis. Solid line and dashed one show the results without and with the tar decomposition, respectively.
Figure 4 Time course of a) temperature at center of a biomass particle and b) yield of products during pyrolysis for the e�ect of tar decomposition. TS = 773 K, Dp = 15 mm, wood.
In Fig. 4a, the temperature at the center of the particle did not show signi�cant di�erence between the result with tar decomposition and the result without tar decomposition until 600 K. However, the temperature with tar decomposition was higher than that without one at 650 K < T < 750 K due to the exothermic heat of the tar decomposition. In Fig. 4b, the yield of tar with its decomposition decreased dramatically compared with that without its decomposition. Correspondingly, the yield of gas increased and the yield of solid increased of the result without the tar decomposition. Hereafter the simulation is conducted with the secondary decomposition of tar.
3.3 In�uences of the setting temperature and kind of biomass on the pyrolysis
Figure 5 shows the in�uence of the setting temperature and the kind of biomass on heat transfer and chemical reaction during pyrolysis. Solid and dashed lines show the results for wood and for bark, respectively.
Figure 5 Time course of a) temperature at center of a biomass particle and b) yield of solid components during pyrolysis for the e�ects of the setting temperature and kind of biomass. Dp = 15 mm.
Page 43
biomass & renewablesInternational Journal of
In Fig. 5a, the temperature at the center of the particle increased with time monotonously and then approached at the setting temperature up to TS = 573 K. However, an in�ection point appears at TS > 673 K due to the radiation heat transfer through the pores. The type of biomass does not show signi�cant e�ect on the temperature change with time. In Fig. 5b, for TS = 573 K and wood, the yield of solid became decreasing with time. As the decomposition of the hemicellulose and the cellulose could occur mainly at TS = 573 K, the pyrolysis rate for wood was larger than that for bark. The yield of solid component for bark was therefore less than that for wood. On the other hand, the yield of solid component decreased dramatically for TS ≥ 673 K because the decomposition of lignin could also occur. Hasegawa et al. [25] reported that the pyrolysis rate for the lignin was less than that for the cellulose and hemicellulose. The yield of solid component for wood was therefore less than that for bark as listed in Table 2.
Figure 6 shows the relationship between the setting temperature and yield of products at steady state for wood and bark.
Figure 6 Dependences of the setting temperature and kind of biomass on the yield of products at steady state by pyrolysis. Dp = 15 mm.
For wood, the yield of gas increased with the setting temperature up to TS = 673 K and then approached the constant value while the yield of tar showed a maximum value at TS = 573 K. This result implies that the tar decomposition could have started at 573 K < TS < 673 K. On the other hand, the yield of gas for bark was less than that for wood since bark shows the lower pyrolysis rate due to its higher lignin content. The yield of tar for bark was larger than that for wood at TS > 673 K.
Figure 7 shows the time course of gas generation rate at various setting temperatures for wood and bark. For wood, the gas started to be generated at TS = 573 K and its generation rate had a maximum value at 8 min. At TS > 673 K, the gas was generated for a longer time than that at TS = 573 K. This may be attributed to the onset of lignin decomposition. When the setting temperature
increases, the gas generation rate shows more abrupt increase with time and its maximum becomes larger. For bark, the gas generation rate was less than that for wood at TS ≥ 673 K. The maximum gas generation rate is de�ned as Gmax.
Figure 7 Time course of gas generation rate for the e�ects of the setting temperature and kind of biomass. Dp = 15 mm.
Figure 8 shows the Arrhenius plot of Gmax. for wood and bark. Two regions having di�erent slopes are observed regardless of biomass type. These two regions may be attributed to cellulose and hemicellulose decomposition at lower temperatures and lignin decomposition at higher temperatures, respectively. Hemicellulose and cellulose mainly decompose at TS = 573 K and lignin decomposes mainly at TS = 573 K.
Figure 8 Arrhenius plot of maximum gas generation rate for the e�ect of kind of biomass. Dp = 15 mm.
3.4 Dependence of maximum gas generation rate on the particle size
Figure 9 shows the logarithmic plot for the relationship between the particle diameter and the maximum gas generation rate Gmax.
Page 44
.
.
.
biomass & renewablesInternational Journal of
As the slope of the plot until a certain particle size, Dp* was 3.5, the gas generation rate depended strongly on the volume of the biomass due to chemical reaction control. On the other hand, for Dp ≥ Dp*, the gas generation rate depended on the surface area of the biomass due to thermal conduction control because the slope was 2.
Figure 9 Dependence of maximum gas generation rate on both the particle diameter and the setting temperature for wood pyrolysis.
4. Conclusions
Numerical simulation of heat transfer and heterogeneous chemical reactions in a biomass particle during pyrolysis was conducted. The main conclusions can be summarized as follows:
1) The radiation heat transfer through the pores and the secondary tar cracking exhibited considerable e�ects on the results including the intraparticle temperature pro�le and the product yields.
2) Time course of the temperature at the center didn’t depend on the lignin content of the biomass. However, the higher lignin content of biomass made the higher yields of tar and solid and the lower yield of gas at 673 K < TS (setting temperature) < 1073 K.
3) The Arrhenius plot of the maximum gas generation rate exhibited two regimes having di�erent activation energies regard less of biomass type. These two regions may be attributed to cellulose and hemicellulose decomposition at lower temperatures and lignin decomposition at higher temperatures, respectively.
4) The maximum gas generation rate depended on the volume of the particle below a certain particle size, Dp*
(= 3.5 mm). On the other hand, it depended on the external surface area of the particle at Dp > Dp *.
Acknowledgements
This work was supported in part by a Grant-in Aid for Scienti�c Research C (No. 19560174) from the Japan Society for the Promotion of Science, Ube Industries, Ltd. and Chugairo Co. Ltd.
Nomenclature
Ci Heat capacity of i [J/(kg•K)]
Dp Particle size of biomass [mm]
d Pore size of the biomass [mm]
e Emissivity of biomass [-]
G Gas generation rate [kg/s]
h Heat transfer coe�cient between biomass and gas [W/(m2•K)]
ΔHi Heat of reaction for the formation of i [J/kg]
HR Heating rate of the pyrolysis temperature around the particle [K/s]
Qreac Total heat source of the chemical reaction [J/s]
C1, Cel Char 1 formed by the decomposition from cellulose
C1, H Char 1 formed by the decomposition from hemicellulose
C1, L Char 1 formed by the decomposition from lignin
C1, tot Total of char 1
C2, Cel Char 2 formed by the decomposition from tar, Cel
C2, H Char 2 formed by the decomposition from tar, H
C2, L Char 2 formed by the decomposition from tar, L
C2, tot Total of char 2
C2 Char2
e� E�ective
G Gas
G,tot Total of gas
G2, Cel Gas 2 formed by the decomposition from tar, Cel
G2, H Gas 2 formed by the decomposition from tar, H
G2, L Gas 2 formed by the decomposition from tar, L
G2, tot Total of gas 2
H Hemicellulose
Py Pyrolysis
S setting
T Tar
T, Cel Tar formed by the decomposition from cellulose
T, H Tar formed by the decomposition from hemicellulose
T, L Tar formed by the decomposition from lignin
T, tot Total tar by the decomposition from biomass
max Maximum value
References
[1] Yokoyama S, Prospect and Challenge of Woody Biomass in Japan. Enerugi to Shigen 2005; 26-3:169-172.
[2] Suzuki T, Liquefaction and Gasi�cation of Woody Biomass – Current status of process development. Mokuzaigakkaishi 2002;48-4:217-224.
Page 46
ε
λ
ρ
biomass & renewablesInternational Journal of
[3] Sasauchi K, Application for Electric Generator by Pyrolysis Gasi�cation of Biomass, J. Com. Soc. Japan 2005;47-139:31-39.
[4] Watanabe T, Development of Small-scale Distributed Power Generation System Utilizing Woody Biomass Gasi�cation Technology. Taiyoenerugi 2003;29-1:14-17.
[5] Broido A, Kinetics of solid-phase cellulose pyrolysis. In: F. Sha�zadeh, K. V. Sarkanenm, D. A. Tillman, editors. Thermal uses and properties of carbohydrates and lignins. New York Academic Press; 1976, p.19-35.
[6] Vamvuka D, Kakras E, Kastanaki E and Goammelis P, Pyrolysis characteristics and kinetics of biomass residuals mixtures with lignite. Fuel 2003;82:1949-1960.
[7] Miller R S, Bellan J A, Generalized Biomass Pyrolysis Model Based on Superimposed Cellulose, Hemicelluloseand Liqnin Kinetics. Combust. Sci. Technol. 1997;126:97-137.
[8] Tanoue K, Yamasaki K, Nishimura T, Taniguchi M and Sasauchi K, A Relationship between the Formation Rate of Solid Component and Volume Reduction of Packed Bed of Woody Biomass Particles during Pyrolysis. J. Jpn. Inst. Energy 2011;90-11:1031-1037
[9] Tanoue K, Suetomi T, Nishimura T, Taniguchi M and Sasauchi K, Thermal conduction and gas generation undergoing pyrolysis in the packed bed of woody biomass. J. Jpn. Inst. Energy, in press.
[10] Pyle D L and Zaror C A, Heat transfer and kinetivs in the low temperature pyrolysis of solids, Chem. Eng. Sci. 1984;39-1,147-158.
[11] Koufopanos C P , Maschio A N G and Lucchesi A, Modelling of the Pyrolysis of Biomass Particles. Studies on Kinetics, Thermal and Heat Transfer E�ects. Can. J. Chem. Eng. 1991;69:907-915.
[12] Di Blasi C, Physico-chemical processes coccuring inside a degrading two-dimensional anisotropin prous medium, I. J. Heat and Mass Trans. 1998;41:4139-4150.
[13] Won C P, Arvind A and Howard R B, Experimental and theoretical investigation of heat and mass transfer processes during wood pyrolysis. Combust. Flame 2010;157:481-494.
[14] Tanoue K, Nishimura T, Hinauchi T, Uchida K, Taniguchi M and Sasauchi K, Analysis of pyrolysis of woody biomass with heating rate. Energy and Resources 2007;28-3: 186-192
[15] Tanoue K, Hinauchi T, Thaung Oo, Nishimura T, Taniguchi M and Sasauchi K, Modeling of heterogeneous chemical reactions caused in pyrolysis of biomass particles. Adv. Powder Technol. 2007;18-6:825-840.
[16] Antal MJ, E�ects of reactor severity on the gas-phase pyrolysis of cellulose- and kraft lignin-derived volatile matter. Ind. Eng. Prod. Res. Dev. 1983;22:366–75.
[17] Antal MJ, A review of the vapor phase pyrolysis of biomass derived volatile matter. In: Overend RP, Milne TA, Mudge LK, editors. Fundamentals of biomass thermochemical conversion. Elsevier; 1985. p. 511–37.
[18] Di Blasi C, Heat, momentum and mass transport through a shrinking biomass particle exposed to thermal radiation. Chem. Eng. Sci. 1996;51-7:1121-1132.
[19] Ayhan D,Calculation of higher heating values of biomass fuels. Fuel 1997;76-5:431-434.
[20] Wenzl H, The chemical technology of wood. New York Academic press;1970
[21] Perry R H and Green D, Perry’s chemical engineers’ handbook. 6th edition. New York,McGraw-Hill; 1984
[22] Gronli M G and Melaaen M C, Mathematical model for wood pyrolysis –comparison of experimental measurements with model predictions, Energy & Fuels 2000; 14 -4: 791–800.
[23] Ayhan D,Calculation of higher heating values of biomass fuels. Fuel 1997;76-5:431-434. Hashimoto K, Chemical reaction engineering, Baifukan; 1989, p. 278.
[24] Okano K. and Sofue N., Mokuzai kagaku handbook, Asakura shoten;2006, p. 117.
[25] Hasegawa I, Fujisawa H, Sunagawa K, Mae K, Quantitative Prediction of Yield and Elemental Composition during Pyrolysis of Wood Biomass. J. Jpn. Inst. Energy 2005;84-1:46-52.