Numerical study of a CO 2 laser beam focused on a theta-pinch plasma in the axial direction Gilles Saint-Hilaire Using two different empirical density profiles for the end region of a theta-pinch plasma, one with a maxi- mum density on the axis (radiation-dispersing profile) the other with a pronounced axial minimum (radia- tion-trapping profile), the trajectory of the CO 2 laser beam (10.6 ,um) focused axially on such a plasma was studied numerically. This calculation is used to evaluate the optical influence of the plasma, since the maxi- mum power density in the focal plane can be reduced by several orders of magnitude owing to the presence of the plasma. This influence can be substantial even for very subcritical electron densities (ne << 1019 cm- 3 ). In cases of large dispersion, the characteristics of a multifocal lens capable of producing perfect fo- cusing are found, and it is shown that the solution is not unique. The radial distribution of the laser beam power density is also calculated and shows numerous irregularities and discontinuities due to the nonuni- form beam dispersion. 1. Introduction Ray paths in large-scale plasmas, such as ionospheric plasmas, have been studied extensively 1 - 3 in the past. However, for small-scale plasmas, such as laboratory- produced plasmas obtained by focusing a powerful laser pulse on a target, the ray paths have not been studied until very recently. 4 This was due partly to the negli- gible effect expected but also to lack of knowledge of the density distribution in such plasmas. It is now recog- nized, however, that optical effects may be substantial, 5 and the calculation of ray paths can therefore be justi- fied. The transverse heating of a theta-pinch plasma 6 by a focused CO 2 laser beam does not show strong optical defocusing since the ray paths and electron density gradients (refractive index gradients) are almost par- allel. However, effective focusing of the laser beam axially into the plasma appears to be more difficult. In fact, attempted axial heating using a Lumonics CO 2 laser (40 J, 50 nsec) on the theta-pinch plasma described by Decoste 6 did not produce a measurable temperature increase. Axial heating has been reported 7 ' 8 for the case of weak pinches, where the electron density has a local minimum on the axis (recognized radiation-trapping profile). Decoste did not report any attempt to obtain the radiation-trapping profile experimentally or to carry out axial heating of the plasma. However, the author The author is with Institut de recherche de 'Hydro-Quebec, Di- rection Sciences de Base, Varennes, Quebec, Canada JOL 2PO. Received 30 December 1976. recently tried axial heating, using the same experi- mental setup, with negative results, and was thus mo- tivated to undertake the present work. For a better understanding of the focusing of a CO 2 laser beam incident axially on a theta-pinch plasma, this paper considers two types of empirical electron density profile for the end region of the plasma, one with a maximum density on the axis (radiation-dispersing profile), the other with a pronounced axial minimum (radiation-trapping profile). Using these profiles, the trajectories of an axially focused CO 2 laser beam (10.6 ,im) were calculated together with the radial distribu- tion of the laser beam power density for several z- coordinates in the plasma. As the aim was to direct all the laser energy into one small region, the characteristics of a lens which would offset the optical of the plasma were calculated. A stationary plasma was assumed for this purpose, and abnormal heating of the end region, 9 which may alter the local index of refraction, was disregarded. Recent research on ray trajectories in 1-D plasmas made use of the theory of linear optics 10 'll which is based on the wave equation and a complex electric field vector together with its phase. The present work, on the other hand, uses the geometricaloptics approximation, as did Steinhauer, 5 to study a 2-D plasma numerically. (Cy- lindrical symmetry was assumed.) The results should be the same on a scale larger than a few wavelengths. II. Basic Considerations Let us consider a 2-D medium with a scalar refractive index distribution n(r,z). Assuming K is a unit vector pointing out of the (r,z) plane, the deviation of a ray moving a distance dl in the medium may be written July 1977 / Vol. 16, No. 7 / APPLIED OPTICS 1975
Transcript
Numerical study of a CO2 laser beam focused ona theta-pinch plasma in the axial direction
Gilles Saint-Hilaire
Using two different empirical density profiles for the end region of a theta-pinch plasma, one with a maxi-mum density on the axis (radiation-dispersing profile) the other with a pronounced axial minimum (radia-tion-trapping profile), the trajectory of the CO2 laser beam (10.6 ,um) focused axially on such a plasma wasstudied numerically. This calculation is used to evaluate the optical influence of the plasma, since the maxi-mum power density in the focal plane can be reduced by several orders of magnitude owing to the presenceof the plasma. This influence can be substantial even for very subcritical electron densities (ne << 1019cm- 3). In cases of large dispersion, the characteristics of a multifocal lens capable of producing perfect fo-cusing are found, and it is shown that the solution is not unique. The radial distribution of the laser beampower density is also calculated and shows numerous irregularities and discontinuities due to the nonuni-form beam dispersion.
1. Introduction
Ray paths in large-scale plasmas, such as ionosphericplasmas, have been studied extensively1 -3 in the past.However, for small-scale plasmas, such as laboratory-produced plasmas obtained by focusing a powerful laserpulse on a target, the ray paths have not been studieduntil very recently.4 This was due partly to the negli-gible effect expected but also to lack of knowledge of thedensity distribution in such plasmas. It is now recog-nized, however, that optical effects may be substantial, 5
and the calculation of ray paths can therefore be justi-fied.
The transverse heating of a theta-pinch plasma6 bya focused CO2 laser beam does not show strong opticaldefocusing since the ray paths and electron densitygradients (refractive index gradients) are almost par-allel. However, effective focusing of the laser beamaxially into the plasma appears to be more difficult. Infact, attempted axial heating using a Lumonics CO2laser (40 J, 50 nsec) on the theta-pinch plasma describedby Decoste6 did not produce a measurable temperatureincrease. Axial heating has been reported 7' 8 for the caseof weak pinches, where the electron density has a localminimum on the axis (recognized radiation-trappingprofile). Decoste did not report any attempt to obtainthe radiation-trapping profile experimentally or to carryout axial heating of the plasma. However, the author
The author is with Institut de recherche de 'Hydro-Quebec, Di-rection Sciences de Base, Varennes, Quebec, Canada JOL 2PO.
Received 30 December 1976.
recently tried axial heating, using the same experi-mental setup, with negative results, and was thus mo-tivated to undertake the present work.
For a better understanding of the focusing of a CO2laser beam incident axially on a theta-pinch plasma, thispaper considers two types of empirical electron densityprofile for the end region of the plasma, one with amaximum density on the axis (radiation-dispersingprofile), the other with a pronounced axial minimum(radiation-trapping profile). Using these profiles, thetrajectories of an axially focused CO2 laser beam (10.6,im) were calculated together with the radial distribu-tion of the laser beam power density for several z-coordinates in the plasma. As the aim was to direct allthe laser energy into one small region, the characteristicsof a lens which would offset the optical of the plasmawere calculated.
A stationary plasma was assumed for this purpose,and abnormal heating of the end region,9 which mayalter the local index of refraction, was disregarded.Recent research on ray trajectories in 1-D plasmas madeuse of the theory of linear optics10'll which is based onthe wave equation and a complex electric field vectortogether with its phase. The present work, on the otherhand, uses the geometrical optics approximation, as didSteinhauer, 5 to study a 2-D plasma numerically. (Cy-lindrical symmetry was assumed.) The results shouldbe the same on a scale larger than a few wavelengths.
II. Basic Considerations
Let us consider a 2-D medium with a scalar refractiveindex distribution n(r,z). Assuming K is a unit vectorpointing out of the (r,z) plane, the deviation of a raymoving a distance dl in the medium may be written
July 1977 / Vol. 16, No. 7 / APPLIED OPTICS 1975
dO = [dl X Vn(r,z)] Kn(r,z)
For laser radiation of 10.6 gim, the plasma refractiveindex is independent of the magnetization for magneticfields below 103 T. Then, for a -given laser frequencyfL, n(r,z) is calculated from the local plasma electrondensity ne (r,z) by the relation
n(r,z) = - (80.5)10 n(rz)1/2 cgs (2)
Neo
(1)
d(z)
Rdial profile
Since n may vanish in Eq. (2) when ne reaches criticaldensity it is very important to point out that a largedeviation dO [Eq. (1)] may be the result of a vanishingn rather a large Vn. Both absorption and reflectionshould be taken into account near the critical density,although this study was limited to an electron densitywell below n, (n, = 1019 cm-3 for 10.6-gm radiation).Assuming an electron density profile for the plasma andstarting from imposed initial conditions (r0,z0O,0), theray paths are calculated by iteration using Eqs. (1) and(2). Convergence is tested by checking that the calcu-lated paths remain independent of the choice of incre-ment Idli.
For a given radiation wavelength, the medium is fullydefined by n(r,z) in Eq. (2). Since Eqs. (1) and (2) aredimensionless equations, a scale factor can be usedwhich provides the possibility of using normalized pa-rameters for ray path representation.
Ill. Density Profiles of the End-Region of a Theta-Pinch Plasma
Let us first establish an analytic electron densityprofile of a theta-pinch plasma based on simple physicalconsiderations. In order to study the laser beam entrycharacteristics, an approximate description of theplasma density profile will suffice rather than a rigorous,detailed model. The geometrical parameters will thenbe adjusted to describe a specific theta-pinch plas-ma.6
Assuming symmetry of revolution around the z axis(cylindrical geometry), let us consider a theta-pinchplasma uniform in the region z < 0, with the plasmaend-region specified empirically in the region z > 0 bythe following set of equations:
[n,(r,z)]/(ncO) = Q(z)R [r,a.,d(z)], (3)
withQW = 1 + exp[(-L)/P]
1 + exp[(z - L)/P]'
R[r,a(,,d(z)] =
r-d(z) 12 r + d(z) 2exp- a +expI ao I
2R0
(4)
, (5)
d(z) = d - 2ga.[1h - Q(z)] exp(L/P), (6)
D = 2(a. + d). (7)
The parameters are schematically presented in Fig. 1.The z dependence of the maximum radial plasmadensity is given by the Q (z) function which is equal to1 at z = 0 and decreases to 0 in the interval P centeredon z = L, L being the length of the plasma end-region
_ L _ *_ I
Fig. 1. Empirical description of the plasma electron density profilein cylindrical geometry.
Table I. Chosen Values for the Emperical ParametersDescribing the Theta-Pinch Plasma of Decostea
Radiation- Radiation-dispersing trapping
Parameters profile profile
Characteristic length ofthe plasma extremity L = 1 1
External plasmadiameter atz = 0 Do/L = 0.1 0.1
Density decreasing in-terval centered on L PIL = 0.3 0.3
Distance of the Gaussiansfrom the z axis at z = 0 doIL = 0 0.03
Halfwidth of theGaussians aoIL = 0.05 0.02
Opening factor g 0.05 0.05
a All values are in units of L which, for this plasma, isequal to 10 cm.
to which all other parameters are normalized. In Eq.(3), the radial dependence of electron density is givenby the function R which is defined by Eq. (5) as the sumof two Gaussians (half-width equal to a,)) shifted to eachside of the z axis by a quantity d (z). The normalizationcoefficient Rn is such that the radial maximum ofR[r,a0,d(O)] = 1.
The Gaussian shift d (z) is given by Eq. (6) in whichdo is roughly the diameter of the central density mini-mum; do = 0 in the case of a central maximum on theaxis at z = 0. The g value in Eq. (6) is a ponderationfactor which expresses the opening rate of the plasmadue to a widening of the magnetic field at the coil ex-tremity. At z = L, the Gaussian shift is
d(L) - d + ag. (8)
The g value chosen is such that d(L) has a realisticvalue. Figure 1 illustrates how the external plasmadiameter Do at z = 0 is given by Eq. (7) while Table Ipresents the chosen values for the parameters whichcharacterize the theta-pinch plasma described by De-coste.6
Although no detailed experimental electron densityprofile of the plasma was established, a valuable de-termination of Do = 1 cm and L = 10 cm is provided by
1976 APPLIED OPTICS / Vol. 16, No. 7 / July 1977
0 2.0 4.0 6.0 8.0 10.0
Fig. 2. Radiation-dispersing plasma profile (incoming beam): (a)constant electron density lines in the plasma (from 0.9 to 0.1 times3 X 1017 cm- 3 ) and half of the incoming laser beam trajectory; (b)distribution of the beam rays in the plasma (curve 0), ponderationfactor for each ray (curve +), and radial power density distribution
of the laser radiation (curve X).
some approximate axial and radial electron densitymeasurements. Parameter P describing the slowdensity variation from the center, is taken as being equalto L/3. The opening factor (g = 0.05), which accountsfor the opening magnetic field line at the coil extremity,has little effect on the parameters considered here. Inthe case of the radiation-trapping profile, no experi-mental basis exists for the choice of parameters do =0.03L and a, = 0.02L. We include such a plasma in ourstudy because of its interesting properties.
IV. Map of the Ray Paths, Laser Power Density, andMultifocal Lens Characteristics
The plasma is represented by a set of equidensitylines in the (r,z) plane [part (a) of Figs. 2-5] where themaximum electron density no is equal to 3 X 1017 cm-3.The first equidensity line near the maximum has thevalue 0.9n 0 followed by 0.8n 0 etc. down to G.1n,. (Forpurposes of representation, the r axis is expanded by afactor of 2 with respect to the z axis which, it should be
Fig. 3. Radiation-dispersing plasma profile (outcoming beam): (a)constant electron density lines in the plasma (from 0.9 to 0.1 times3 x 10'7 cm- 3 ) and half the outgoing point source beam trajectory;(b) distribution of the beam rays in the plasma (curve 0), ponderationfactor for each ray (curve +), and radial radiation power density
distribution (curve X).
remembered, gives an apparent angle of incidence onthe axis nearly twice the true angle.) The plasma withthe radiation-dispersing profile (do = 0) is consideredin Figs. 2, 3, and 6, the plasma with the radiation-trap-ping profile (do = 0.03L) in Figs. 4, 5, and 7.
A. Radiation-Dispersing Profile
First let us consider in detail the case of a plasma witha radiation-dispersing density profile. Superposed onthe set of equidensity lines in Fig. 2(a) may be seen thetrajectory of the CO2 laser beam focused on the axis atz = 0.5L, using a lens with a focal length f equal to 10Lplaced at zf = 10.5L. The trajectories of ten rays arecalculated to show the beam spread. The lens diameteris L (10 cm for the plasma described by Decoste6 ). Thebeam incident on the lens is assumed to be parallel, andeach calculated ray leaves the lens at radius ri (whichwe define as the internal lens radius): 0, 0.05,0.10,...0.40, 0.45L, with initial angles given by the lens for-mula
July 1977 / Vol. 16, No. 7 / APPLIED OPTICS 1977
] Ir' An-2
(')
(a) R/L0,2
Fig. 4. Radiation-trapping plasma profile (incoming beam): (a)constant electron density lines in the plasma (from 0.9 to 0.1 times3 X 10"7 cm- 3 ) and half of the incoming laser beam trajectory; (b)distribution of the beam rays in the plasma (curve 0), ponderationfactor for each ray (curve +), and radial radiation power density
distribution (curve X).
':: 1.0
I 0.5C
._0.5C
0.5 1.0Focal length (x10-1)/L
1.5
Fig. 6. Radiation-dispersing plasma profile. Multifocal lens char-acteristics for z = 5L.
Fig. 5. Radiation-trapping plasma profile (outgoing beam): (a)constant electron density lines in the plasma (from 0.9 to 0.1 times3 X 10"7 cm-
3) and half of the outgoing point source beam trajectory;
(b) distribution of the beam rays in the plasma (curve 0), ponderationfactor for each ray (curve +), and radial radiation power density
distribution (curve X).
-2.0 ' ' I 0 0.5 1.0
Focal length (x10 1-)/L1.5
Fig. 7. Radiation-trapping plasma profile. Multifocal lens char-acteristics for z = 5L.
1978 APPLIED OPTICS / Vol. 16, No. 7 / July 1977
R/L 0,2
(a)
°i-= tan-1[(ri)/f]. (9)
For reasons of clarity, only those rays initiating fromthe positive region of the lens radius were plotted, al-though symmetrical rays are also present in the plasmaand must accordingly be taken into consideration.Figure 2(a) shows an important defocusing (vacuumfocal point at r = 0; z = 0.5L), the focused beam incidenton the plasma being deflected toward the axis in theregion z > L because the maximum plasma density isin the positive region of R. Consequently, the beam ispartly focused near z = 1.1L and penetrates the plasma,parallel to the axis, until it reaches the vicinity of z =0.5L, where it is abruptly deflected by the maximumplasma density which, in this region, is on the axis (0 <z <L).
The three curves plotted in Fig. 2(b) are related to thecalculation of the radial radiation power density dis-tribution. The symbols (0, +, X) are used to identifythe curves. The first curve (0) shows the position ofeach ray (100 in the beam) as a function of its number(starting at one on the lens axis) in the vacuum focalplane at z = 0.5L. All rays originate from the lens in thepositive region of R and appear in the negative regionR in the plasma. Except for rays 24 to 27, the rays ofthe focused laser beam are distributed fairly uniformlyin the plasma, and the power density at any radial po-sition is proportional to the density of the rays times theaverage power propagated by the rays initially. Theponderation factor (curve +) is calculated for each rayas the ratio of the zone of influence in the lens plane tothe zone of influence in the plasma plane. In the ab-sence of plasma and for the 10.6-gim wavelength radia-tion, the ponderation factor is constant and equal to theratio of the lens surface to the surface of the focal spot,which may be of the order of 106. Assuming uniformlaser illumination of the lens, the laser radiation powerdensity at any coordinate of the plane z = 0.5L is theproduct of the incident power density on the lens timesthe sum of the ponderation factors of the rays at thiscoordinate. For each radial coordinate of the plasma,the logarithm of the radiation power density, log (2P),is plotted [curve X, in Fig. 2(b)]. The ray position andponderation factor curves, for which negative R coor-dinates appear, display details of the trajectories forrays emanating from the upper half of the lens. Incontrast, the power density curve presents only positivevalues of R, since rays for both halves of the lens havebeen included in the calculation. It is interesting toobserve that the maximum radiation power density isquite off axis (0.025L = 2.5 mm) and that this maximumis nearly 2 orders of magnitude smaller than the valueexpected in the absence of the plasma.
In the case of outgoing radiation from a point sourcein the plasma [Fig. 3(a)], the reverse path of the ray isconsidered, and, assuming uniform incident luminosityat the lens coordinate (z = 5L), a calculation is per-formed of the laser power density distribution in theplane 0.75L which shows a similarity to the power dis-tribution in the vicinity of the desired focal spot (z =0.5L), where a singularity in the distribution exists.Figure 3(a) implies that in the lens plane (z = 5L) there
are in fact several sets of rays covering the lens. Sinceuniform luminosity of the lens was assumed for each ofthese beams, the radiation power density calculatedcorresponds to an upper limit. It would be easy to se-lect separate beams and calculate their specific radialpower density distribution although such a detailedanalysis would not be worthwhile here since the primarypurpose of this study is to examine the nature of theprocess per se. Curve 0 in Fig. 3(b) shows the positionof each numbered ray. The straight line indicates auniform dispersion of the rays starting from the pointsource at z = 0.5L with a constant angular incrementfrom ray to ray. Since the power density is determinedby the zone of influence of each ray in the lens plane,assuming uniform luminosity in the incident beam, itis essential to calculate all the rays before associatinga power density with each one. Curve + is the loga-rithm of the ponderation factor (ratio of the influencezone at the lens to that at the analysis plane z = 0.75L)vs the ray number. It may be seen that even if the raysare equally spaced in the plane z = 0.75L, the maximumpower density distribution (curve X) is not constant butdemonstrates a sharp radial minimum followed by amaximum nearly 3 orders of magnitude greater. If theplane of study is moved from z = 0.75L toward thegeometric focal spot (point source at z = 0.5L), the ra-diation power density profile (curve X) compresses itselfnear the plasma axis and increases in amplitude to amaximum value around 106, which is determined by theminimum permissible focal spot. Note that the maxi-mum power density is again off axis.
Since one aim of this study was to examine nonlinearlaser heating, which depends on the total laser radiationpower density, an attempt was made to develop atechnique for obtaining the best possible focal spot inthe plasma. If a point source is assumed at the locationof the desired focal spot in the plasma [Fig. 3(a)] and ifthe ray paths in the outgoing direction are calculated,then, because the ray paths are unchanged upon re-versal of the direction of propagation, the correct entryconditions in any z plane outside the plasma will beknown. Generalizing the lens formula (9), these entryconditions may be expressed in terms of a focal lengthvarying with the internal lens radius
f(r) = r/[tan0(r)]. (10)
The entry conditions in the plane z = 5L are calculatedfor the case of Fig. 3 and the internal lens radius vs thefocal length plotted in Fig. 6. At first glance, the sur-prising thing is that for a given internal lens radius, aunique definition of the focal length does not necessarilyexist. (Since the symmetrical rays for the lower half-plane were not calculated, only the absolute value of theinternal lens radius should be considered here.) Acareful look at the ray trajectories of Fig. 3(a) reveals thepresence of a propagation mode which, from the focalpoint to the lens, corresponds to a single or to multiplerebounds against a maximum plasma density situatedeither above or below the plasma axis on the diagram.It is this which results in a multivalued definition of thefocal length. Referring to the same figure, all modesrequire convergent lens characteristics. In theory, any
July 1977 / Vol. 16, No. 7 / APPLIED OPTICS 1979
combination of allowed focal lengths may be selectedfrom these characteristics to produce a multifocal lens,although for stability reasons the set with the weakestradial dependence seems preferable. An importantpoint to note is the strong variation of the focal lengthof the lens (by more than a factor of 2) from its centerto its periphery, whereas, outside the central region, thefocal length is more or less constant and nearly equal tothe vacuum condition (f = 4.5L). It should be notedthat the focal characteristic for the symmetrical rays(not considered here) would show symmetry with thatshown in Fig. 6.
B. Radiation-Trapping Profile
The above-described numerical study was also per-formed for a plasma with a radiation-trapping electrondensity profile as shown in Figs. 4(a) and 5(a). Themaximum electron density is 3 X 1017 cm-3, as for theradiation-dispersing profile. In the present case, theplasma appears as a cylinder with a local minimum ofthe electron density on the axis. In Fig. 4(a), the beamis focused in the plane 0.5L by a lens placed at z =10.5L. The large-incidence rays are deflected outsidethe plasma in the z = 1.5L region. The smaller-inci-dence rays penetrate the minimum electron densityregion and are guided by successive reflections from thehigher density plasma toward the central region. Thetrapping criterion becomes progressively more severeas the beam penetrates the plasma because of theplasma nonuniformity, and some rays are trapped untila certain point is reached whereupon they escape fromthe central region, as seen near z = 0.3L. The over-alltrajectory is much more complicated in this case, as isthe calculation of the radiation power density. Figure5(a) shows the ray trajectories starting from a pointsource on the plasma axis at z = 0.5L.
Let us return now to the radiation power densitydistribution. In Fig. 4(b), curve 0 shows the radialposition of the ray vs the ray number in the plane z =0.5L. The logarithm of the ponderation factor is plot-ted (curve +) vs the ray number assuming uniform lu-minosity at the lens placed at z = 10.5L. The conglo-meration of rays near the plasma axis (rays 1 to 20)make their ponderation factor quite large. On the otherhand, a small group of rays is distributed over the entireplasma (around ray 90), and their associated pondera-tion factors are very small. The radial radiation powerdensity (curve X), for each radial plasma coordinate,consists of the sum of the ponderation factors associatedwith each ray appearing at that coordinate. To main-tain the symmetry of revolution, account must be takenof the absolute value of the position of the radial rays(curve 0). Taking the rays in the plasma at the coor-dinate r = 0.005L, numbers 43, 53, and 89, for instance,the sum of their respective ponderation factors is theradiation power density at that coordinate assuming aunit radiation power density on the lens. It is inter-esting to study the maxima and minima of ray positioncurve 0 in terms of the radiation power density. Con-sider ray number 49 on the ray position curve 0 [Fig.
5(b)] at the plasma radius r = 0.006L. For a slightlysmaller radius, there are three rays in the plasma whilefor a slightly larger radius, there is only one. Conse-quently, a discontinuity of the radiation power densityoccurs at this radial coordinate of the plasma, whichnaturally appears on curve X. The amplitude of thediscontinuity depends on the ponderation factor asso-ciated with the rays. Note that the radiation powerdensity discontinuity is not the result of a true dia-phragm since the rays involved are from the centralregions of the lens. Two similar discontinuities areproduced at the plasma radius r = 0.025L by rays 75 and77.
The case of a point source in a radiation-trappingdensity profile is illustrated in Fig. 5(b) for the plane z= 0.75L. The ray distribution curve 0 demonstratesa minimum for ray number 80, which produces a dis-continuity of the radiation power density at the radialplasma coordinate r = 0.022L. Furthermore, the rayposition curve presents a discontinuity near ray number70; this is responsible for the dark plasma region be-tween r = 0.016L and 0.022L. Despite an almost con-tinuous ray distribution in the plasma, the ponderationfactor (curve +) is quite irregular owing to the widesweep of the ray in the lens region at z = 5.OL. Notethat the radiation power density reaches a maximumon the axis (curve X). As the plane of study moves fromz = 0.75L down to z = 0.5, the power density distribu-tion is constricted radially, then expands and com-pressed once more near z = 0.5L; keeping roughly thesame shape. Again, it should be borne in mind that thepower density distribution describes the theoreticalmaximum value, assuming all modes propagate radia-tion (a physically impossible case, in fact).
For this case [Fig. 5(a)], it is obvious that many setsof rays will be superposed on the lens. In the lens planez = 5L, the associated focal length for each ray is cal-culated by the same method as described for Fig. 6, andthe internal lens radius and the corresponding focallength are plotted on a similar graph (Fig. 7). Thisgraph shows the complex characteristics of the multi-focal lens. It should be remembered here that the lenscharacteristic is not unique and that for each internallens radius it is possible to choose any calculated focallength satisfying the condition that the incident parallellaser beam will be focused on the axis at z = 0.5L.(Here again it is the absolute value of the radial lensposition which must be considered.) It is also inter-esting to note that at small angles of incidence (near thecenter of the multifocal lens) the focal length may benegative which means that divergent lens characteristicscan be used, at least in a small interval, to focus part ofthe laser beam into the plasma. To select characteristicsegments for high radiation power density, it may benecessary to consider, simultaneously with the stabilitycriteria, the space occupied by the beam in a particularmode to see if prefocusing occurs, since this can affectthe experiment by causing local plasma heating outsidethe designated focal volume.
In practice, it would be difficult to use a multifocallens for optimum focusing in a theta-pinch plasma.First, the electron density distribution of the plasma
1980 APPLIED OPTICS / Vol. 16, No. 7 / July 1977
would have to be known in order to calculate the mul-tifocal lens characteristics with accuracy. Also, electronprofile irregularities and nonreproducibility from shotto shot can reduce the effectiveness of such a lens.Fortunately, the evolution of the plasma is generallynegligible during the laser pulse of interest (<50 nsec).Nevertheless, in view of the fact that the optical effectof the plasma reduces the laser power density by severalorders of magnitude, a multifocal lens could be used, inmost cases, t improve the laser power density in theplasma. A simple way to make a multifocal lens wouldbe to approximate the calculated characteristics of sucha lens by superposing an appropriate small-diameterlens on the axis of a larger lens which covers the wholelaser beam.
In the case of Fig. 5, the plasma has a strong opticaleffect on the laser beam, and small plasma fluctuationsand nonreproducibilities would obviously affect the raytrajectories and rapidly nullify the usefulness of amultifocal lens. This extr'eme case is presented purelyas an illustration of the feasibility of the multifocal lenstechnique; in practice, however, unless the plasmadensity profile is accurately known, this technique couldbe used to apply small corrections to a constant focallength lens. On the other hand, calculations haveshown that the multifocal lens could be useful in thecase of Fig. 5 if the focal spot is to be optimized in theregion z - L instead of 0.5L, since in this position thelaser rays are slightly deflected and do not oscillate inthe plasma channel before focusing.
V. Conclusion
An empirical description -of the electron density forthe end-region of a theta-pinch plasma was used tocalculate the trajectory of an axially focused laser beam.It is shown that for optimum focusing, the optical effectof the plasma cannot be neglected. Two cases wereexamined, namely, the radiation-dispersing and ra-diation-trapping electron density profiles, and the radialdistributions of the laser power density show irregu-larities and discontinuities. The maximum laser power
density, in a given normal plane of the plasma, may bequite off axis. In an attempt to produce an optimumfocal spot in the plasma in order to study plasma heat-ing, the characteristics of a multifocal lens which wouldoffset the optical effect of the plasma and offer optimumfocusing were calculated for each preceding case. Fora given plasma density profile and a given geometry,these characteristics show not one but several solutions,a result which may be explained in terms of one or sev-eral reflections of the rays from the higher electrondensity regions of the plasma. Finally, the multifocallens is proposed as a technique for obtaining higher laserradiation power density within the plasma.
The author thanks Michel St-Jean of IREQ for thenumerical calculations in this paper which were per-formed very quickly and competently. Thanks are alsodue to C. R. Neufeld and G. Beaudry for helpful dis-cussions.
References1. V. L. Ginzburg, The Propagation of Electromagnetic Waves in
Plasmas (Permagon, Oxford, 1964).2. J. M. Kelso, Radio Ray Propagation in the Ionosphere
(McGraw-Hill, New York, 1964).3. T. H. Stix, Theory of Plasma Waves (McGraw-Hill,-New York,
1962).4. P. D. Rockett, in IEEE 2nd International Conference Plasma
Science, Ann Arbor, Mich. (1975).5. L. C. Steinhauer and H. G. Ahlstrom, Phys. Fluids 14, 1109
(1971).6. R. Decoste, A. G. Engelhart, V. Fuchs, and C. R. Neufeld, J. Appl.
Phys. 45, 1127 (1974).7. A. L. Hoffman, Appl. Phys. Lett. 23, 693 (1973).8. G. M. Molen, J. Kristiansen, M. 0. Hagler, and R. D. Bengtson,
Appl. Phys. Lett. 24, 583 (1974).9. R. A. Hess and H. R. Griem, Phys. Fluids 18, 1056 (1975).
10. D. V. Giovanielli and R. P. Godwin, Am. J. Phys. 43, 808(1975).
11. S. A. Mani, J. E. Eninger, and J. Wallace, Nucl. Fusion 15, 371(1975).
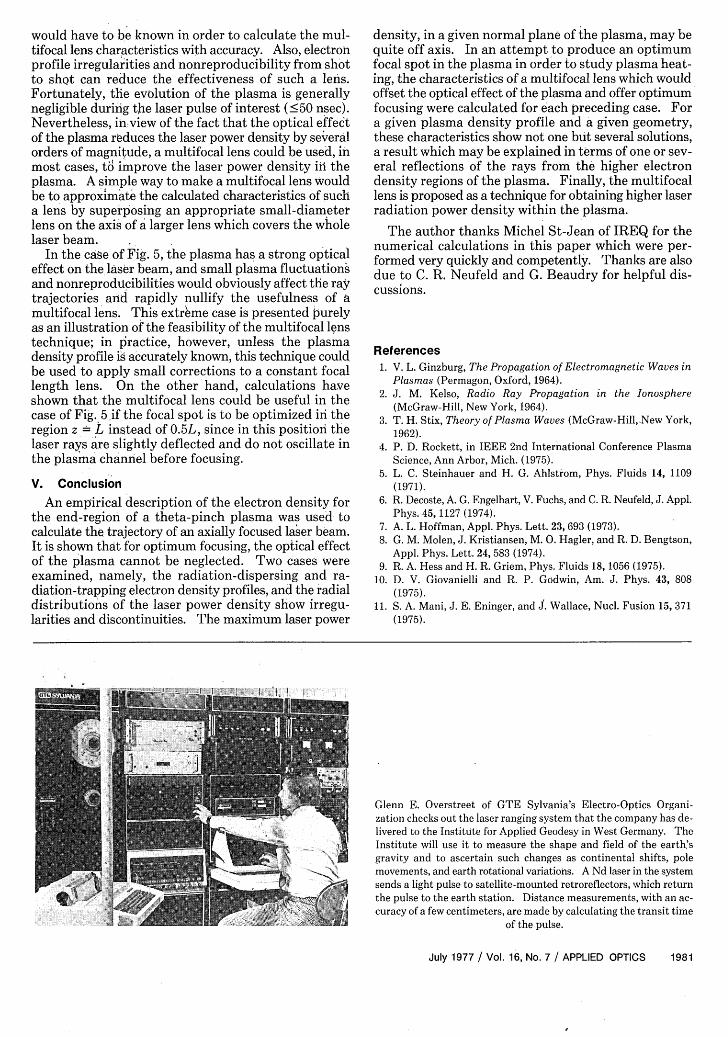
Glenn E. Overstreet of GTE Sylvania's Electro-Optics Organi-zation checks out the laser ranging system that the company has de-livered to the Institute for Applied Geodesy in West Germany. TheInstitute will use it to measure the shape and field of the earth'sgravity and to ascertain such changes as continental shifts, polemovements, and earth rotational variations. A Nd laser in the systemsends a light pulse to satellite-mounted retroreflectors, which returnthe pulse to the earth station. Distance measurements, with an ac-curacy of a few centimeters, are made by calculating the transit time