Numerical study of single mode Er-doped microstructured fibers: influence of geometrical
parameters on amplifier performances Stéphane Hilaire, Dominique Pagnoux, Philippe Roy, and Sébastien Février
Xlim - 123 avenue Albert Thomas, 87060 Limoges, France [email protected]
http://www.xlim.fr
Abstract: A theoretical study of optimized single mode Er-doped MOFs designed for high efficiency amplification at 1550nm is carried out, deriving benefit from the demonstrated very low decrease of the overlap factor versus wavelength. In spite of this potential advantage, classical single mode MOFs are first shown to be less efficient than usual Er-doped step index fibers (SIF). However, novel single mode large core MOFs (LCMOFs) are designed, providing overlap factors higher than 0.9 at both the pump and the signal wavelengths. To obtain the same gain, the necessary length of LCMOF is reduced by up to 40% compared to that of Er-doped SIF. Such a highly efficient amplifying fiber is attractive for short pulse and soliton amplification.
1. E. Desurvire, Erbium-Doped Fibre Amplifiers-Principles and Applications (Wiley-Interscience, New York, 1994).
2. G. P. Agrawal, Nonlinear Fibre Optics 3rd edition (Academic Press, San Diego, 2003). 3. G. Kulcsar, Y. Jaouen, G. Canat, E. Olmedo, and G. Debarge, “Multiple-Stokes stimulated Brillouin
scattering generation in pulsed high-power double-cladding Er3+ -Yb3+ -codoped fiber amplifier,” IEEE Photon. Technol. Lett. 15, 801-803 (2003).
4. V. Philippov, C. Codemard, Y. Jeong, C. Alegria, J. K. Sahu, J. Nilsson, and G. N. Pearson, “High-energy in-fiber pulse amplification for coherent lidar applications,” Opt. Lett. 29, 2590-2592 (2004).
5. P. Leproux, P. Roy, D. Pagnoux, B. Kerrinckx, and J. Marcou, “Theoretical and experimental study of loss at splices between standard single-mode fibres and Er-doped fibres versus direction,” Opt. Commun. 174, 419-425 (2000).
6. P. Russell, “Photonic crystal fibres,” Science 299, 358-362 (2003). 7. T. A. Birks, J.C. Knight, and P. St. Russell, “Endlessly single-mode photonic crystal fibre,” Opt. Lett. 22,
961-963 (1997). 8. D. Pagnoux, A. Peyrilloux, P. Roy, S. Fevrier, L. Labonté, and S. Hilaire, “Microstructured air-silica
fibres: recent developments in modelling, manufacturing and experiment,” Ann. Telecommun. 58, 1238-1274 (2003).
9. F. Bréchet, J. Marcou, D. Pagnoux, and P. Roy, “Complete analysis of the characteristics of propagation into photonic crystal fibres, by the finite element method,” Opt. Fiber Technol. 6, 181-191 (2000).
10. B. Bourliaguet, C. Paré, F. Emond, A. Croteau, A. Proulx, and R. Vallée, “Microstructured fiber splicing,” Opt. Express 11, 3412-3417 (2003).
11. O. Frazão, J. P. Carvalho, and H. M. Salgado, “Low-loss splice in a microstructured fibre using a conventional fusion splicer,” Microwave and Opt. Technol. Lett. 46, 172-174 (2005).
12. T. P. White, R. C. McPhedran, and C. M. de Sterke, “Confinement losses in microstructured optical fibers,” Opt. Lett. 26, 1660-1662 (2001).
#69850 - $15.00 USD Received 10 April 2006; revised 7 July 2006; accepted 31 July 2006
(C) 2006 OSA 30 October 2006 / Vol. 14, No. 22 / OPTICS EXPRESS 10865
13. A. Shirakawa, J. Ota, M. Musha, K. Nakagawa, K. Ueda, J. R. Folkenberg, and J. Broeng, “Large-mode-area erbium-ytterbium-doped photonic-crystal fiber amplifier for high-energy femtosecond pulses at 1.55 µm,” Opt. Express 13,1221-1227 (2005).
14. A. Galvanauskas and M. E. Fermann, “High-power scaling of femtosecond fiber lasers using large-core Yb fibers,” LEOS Newsletter 14 (2000).
1. Introduction
Erbium doped fiber amplifiers operating in the third telecommunication optical range of wavelengths (λs= 1530nm to 1560nm) have been intensively studied and developed along the past fifteen years. Usual fiber amplifiers are based on a single mode step index fiber (SIF) which Er-doped core is pumped at λp=980nm. To increase the efficiency of the amplifier, it is necessary to obtain high overlap factors between the doped area and radiations at both the signal and the pump wavelengths [1]. This means that the fields must be strongly confined in the core at the two wavelengths. To fulfill this condition, the index difference between the core and the cladding must be raised up to values of the order of 20.10-3 [2]. But the price to pay to preserve the single mode propagation conditions in the fiber at both λs and λp (i.e., to
maintain 4052aNA2
V .<λ
π= , where a is the core radius and NA is the numerical
aperture) is to dramatically reduce the radius of the core down to about 1.5µm. The effective area of the mode is then equal to about 8µm2 and 15µm2 at 980nm and 1550nm respectively. The significant diminution of the cross-sectional area of the amplifying medium has several undesirable consequences. On the one hand, it makes it necessary to use long lengths of fiber amplifier to take advantage of a sufficient active volume and obtaining the required gain. On the second hand, the high power density due to the confinement of light in the core may give rise to disastrous non-linear effects, especially stimulated Raman scattering (SRS) and stimulated Brillouin scattering (SBS) [2], especially since the core area is small. In particular, for spectroscopy and heterodyne LIDAR applications, the required amplification of narrow linewidth signals (<10MHz) can be dramatically affected by the SBS [3, 4]. At last, due to the discrepancy between the effective areas of the modes of the fiber amplifier and those of standard fibers (that are respectively 54µm2 and 86µm2 at 980nm and 1550nm), the coupling loss at perfectly aligned splices at the input and output ends of the amplifier can be as high as 2dB. Fortunately, it can be significantly reduced with multifusion techniques [5].
To overcome the above drawbacks, we propose to investigate the potential performances of optimized Er-doped core microstructured optical fiber (Er-MOF) amplifiers. MOFs operating following the classical total internal reflection principle consist in a solid silica core surrounded by a triangular lattice of air holes (diameter d and pitch Λ) in a silica medium constituting the cladding. These fibers have been intensively studied along the ten past years, due to their novel propagation properties [6]. These properties derive from the non conventional chromatic dependence of the effective index of the space filling mode in the surrounding lattice that can be considered as the cladding index of the equivalent step index fiber [7]. For example, single mode propagation can be achieved over a wide range of wavelengths in MOF with a 2Λ diameter core, whatever Λ provided that d/Λ<0.35 [8]. Furthermore, the increase of the radial extension of the fundamental mode with the wavelength is significantly weaker in MOFs than in standard fibers. These features are potentially very attractive to design large core single mode highly efficient amplifiers based on Er-MOFs.
In this paper, we expose the design of different Er-MOFs and we compare their performances to those of typical step index fiber (SIF) amplifiers. In particular, we discuss the influence of their geometrical characteristics on the gain performances of the
#69850 - $15.00 USD Received 10 April 2006; revised 7 July 2006; accepted 31 July 2006
(C) 2006 OSA 30 October 2006 / Vol. 14, No. 22 / OPTICS EXPRESS 10866
corresponding amplifiers. At last, we present an attractive structure of Er-MOF designed for highly efficient single mode amplification.
2. Theoretical basis
The preform of a classical triangular lattice MOF is made by carefully stacking solid silica rod and silica tubes as shown in Fig. 1. Both the pitch in this preform (Λpr) and the diameter of the rod are equal to the outer diameter (d2) of the tubes. When manufacturing the preform of a classical Er-MOF, the central pure silica rod is replaced by an Er-doped one. Considering that the equality between the diameter of the rod and the pitch is preserved after the drawing process, the above remarks obviously show that the diameter of the doped area in the final fiber cannot exceed the pitch Λ.
a) b)
Fig. 1. Schematic cross section of a) preform, b) a MOF, with a classical triangular lattice of holes.
In the fiber, Γp and Γs are the overlap factors between the erbium doped area and the
energy transverse distributions of the pump and of the signal respectively. The spatio-temporal evolutions of the pump Pp(t,z) and of the signal Ps(t,z) are given by the usual following coupled equations:
),(),()(
),(1 ztPztN
dz
ztdPpppa
p Γ−= λσ (1)
),,()()],()(),()([),,(
12 sssssasess ztPztNztN
dz
ztdP λλλσλσλΓ−=
(2)
where σe(λs) and σa(λp) are respectively the emission and absorption cross sections at the pump and the signal wavelength, N1 and N2 are respectively the density of population of the erbium ions in fundamental and excited levels at the position z.
The gain over the length L of fiber, deduced from Eq. (2), is expressed as:
[ ]
⎭⎬⎫
⎩⎨⎧
−Γ= ∫ dzzNzNGL
sasesss
0
12 )()()()()(exp)( λσλσλλ (3)
Silica
Erbium doped zone
Λpr
d1
d2
#69850 - $15.00 USD Received 10 April 2006; revised 7 July 2006; accepted 31 July 2006
(C) 2006 OSA 30 October 2006 / Vol. 14, No. 22 / OPTICS EXPRESS 10867
Obviously, as shown in Eq. (3), obtaining a high gain over a given length L of fiber requires an efficient population inversion all along the fiber (i.e., high pump power and high Γp) together with a high Γs value. Γp and Γs in Er-MOFs can be computed with the following classical relation:
ϕ
ϕ=Γ ∫ ∫
∫ ∫
π
∞ π drdr
rdrd)r(E
)r(Edr
0
2
0
0
2
0
2x
2xx
(x=s or p) (4)
where, r and ϕ are the radial and the azimutal coordinates of a given point located on the
cross section of the studied fiber, dr is the radius of the erbium doped area and )( rE2x is
the electric field intensity of the guided wave at λx ( psx ,= ). Because of the complex
structure of the cross section of MOFs, no analytical expression of the field distributions in the guided modes of these fibers is available. Then, we numerically compute the electric field distribution of these modes by means of a home-made software based on the full vector Finite Element Method (FEM). The cross section is first split into a finite number of triangular subspaces (Fig. 2).
a) b)
Fig. 2. a) Triangular grid over the cross section of a MOF, b) zoom on a air hole split into triangular subspaces.
The Maxwell equations are then solved at each node of the grid, taking into account the
conditions of continuity at the boundaries. When solving the global matrix system, the effective index of each guided mode and the associated electric field distribution are determined [9]. Let us notice that, for a suitable accuracy of the results, the dimensions of the subspaces must remain shorter than Λ/5. This means that, when modeling a large fiber, the available memory of the computer can become insufficient because of the too large number of subspaces. To limit the necessary memory space and the computation time, one solution consists in considering only one quarter of the fiber and in applying either an electric short-
#69850 - $15.00 USD Received 10 April 2006; revised 7 July 2006; accepted 31 July 2006
(C) 2006 OSA 30 October 2006 / Vol. 14, No. 22 / OPTICS EXPRESS 10868
circuit (ESC) or a magnetic short-circuit (MSC) on each boundary of this region [9]. The polarization of the computed field then depends on the nature of the applied short-circuits.
To take into account the confinement loss, complex surface impedance Zs, adapted to the wave impedance of the considered mode, is set on the outer boundary of the spatially sampled domain. To avoid numerical reflections, Zs is set far enough from the guiding zone. The use of this complex impedance makes it possible to evaluate the relative confinement loss between different modes and to determine those able to propagate over significant distances.
3. Potential performances of standard erbium doped MOFs amplifiers
3.1 Spectral evolution of the overlap factors in single mode Er-MOFs
In order to allow a further evaluation of the potential performances of standard erbium doped MOFs amplifiers, we first intend to compare the overlap factors in such a single mode Er-MOF and in a standard Er-doped step index fiber (Er-SIF) chosen as reference. The opto-geometrical parameters of this reference fiber are typical ones of amplifying fibers used by the main telecommunication operators: doped core radius=1.5µm, core-cladding index difference Δn=21.10-3 and erbium concentration in the core=150ppm. Concerning the Er-MOFs, we first consider a fiber with a regular triangular array of air holes as presented in Fig. 1 b). The radius of the erbium doped area is Λ/2 as explained above. The pitch is fixed to Λ=3µm to obtain the same doped cross-sectional area as in the reference Er-SIF. The diameter of the solid core of the MOF is consequently larger than that of the SIF. We arbitrarily choose d=0.9µm (d/Λ=0.3) to comply with the endlessly single mode propagation condition. The electric field distribution of the fundamental mode versus wavelength in both fibers is computed with our FEM software. The overlap factors between these modes and the doped zone are plotted in Fig. 3.
Fig. 3. Evolution of overlap factors versus wavelength for the reference Er-SIF (grey curve) and the MOF with Λ=3µm d=0.9µm (black curve). Inset: electric field distribution of the fundamental mode of the MOF at 1550nm.
The core/cladding index difference in the MOF increases as the wavelength increases,
whereas it remains constant in the SIF [7]. This results in a weaker variation of the extend of the electric field (and thus of Γ) in the MOF than in the SIF when the wavelength is increased. This comparison shows that Γ decreases from ∼0.85 (λ=980nm) to ∼0.56
#69850 - $15.00 USD Received 10 April 2006; revised 7 July 2006; accepted 31 July 2006
(C) 2006 OSA 30 October 2006 / Vol. 14, No. 22 / OPTICS EXPRESS 10869
(λ=1550nm) in the SIF, and from ∼0.53 to ∼0.46 in the MOF. The decrease of Γ in the MOF is four times lower than in the SIF. However, higher values of Γ are obtained in the SIF all over the considered range of wavelengths. This is simply due to the fact that only the central part of the solid core of the MOF is Er-doped whereas the core of the SIF is entirely Er-doped.
Fig. 4. Evolution of the overlap factor in MOFs at 1550nm versus the ratio d/Λ (Λ=2 to 5µm). We now compute Γ at λ=1550nm, versus the ratio d/Λ in different structures of MOFs,
with a pitch varying from 2µm to 5µm. For each structure, we verify that only fundamental mode is guided into the core at the pump and the signal wavelengths. This condition imposes to keep the ratio d/Λ lower than 0.4. As shown in Fig. 4, the value of Γ in the Er-MOF is enhanced when increasing the pitch Λ and/or the ratio d/Λ. For example, for d/Λ=0.35, Γ is about 0.4 for Λ=2µm whereas it reaches 0.6 for Λ=5µm. Nevertheless, even with the highest possible value of d/Λ, Γ in the MOF with Λ=3µm is at the most equal to 0.58, that is to say approximately the same value as in the reference Er-SIF. In order to increase Γ in the Er-MOF at 1550nm, the only remaining solution is to consider a MOF with a larger pitch.
At this step of the study, it is necessary to consider possible loss at connections between the upstream SMF and the downstream doped fiber. When the doped fiber is a classical Er-SIF, the large mismatch between the modes radii of the two fibers should lead to high connecting loss. However, thanks to refusion techniques, an adiabatic transition may be achieved and loss is typically limited to less than 0.2dB at 1550nm [5].
When splicing standard SMF with MOFs, additional specific causes of loss may occur. First of all, the energy distribution of the fundamental mode of a MOF is not gaussian but it exhibits a symmetry of π/3. For the MOFs considered in our study, we can notice that this azimutal dependence of the electric field is weak, allowing to suitably match of the modes of the two fibers (inset of Fig. 3). Another possible drawback is that holes of the MOF could collapse when splicing fibers and this could obviously causes some distortions within the splice region. However, recent works show that, by carefully controlling the splicer parameters, holes of the MOF may be maintained open, leading to loss lower than 0.25dB [10, 11]. Nevertheless, for paying acceptable connecting loss, the effective area of the fundamental mode of the MOF must be close to that of the standard SMF (∼54µm2 at 980nm and ∼86µm2 at 1550nm). We have already mentioned that variations of the effective area of
0
0.1
0 .2
0 .3
0 .4
0 .5
0 .6
0 .7
0 .8
0 .25 0.27 0.29 0.31 0.33 0.35 0.37 0.39 0.41
d/ L d/Λ
#69850 - $15.00 USD Received 10 April 2006; revised 7 July 2006; accepted 31 July 2006
(C) 2006 OSA 30 October 2006 / Vol. 14, No. 22 / OPTICS EXPRESS 10870
the fundamental mode versus wavelength are much smaller in a MOF than in a SIF. Then the effective areas cannot be matched in the two fibers at both the pump and the signal wavelengths. Looking for a better efficiency, we chose to optimize the transfer of the pump power into the MOF. Then we designed a fiber in which the effective area of the fundamental mode at 980nm is close to 54µm2. It is the reason why we focus our attention on a MOF with Λ=6µm and d=2.4µm (d/Λ=0.4) in which the effective area of the fundamental mode has been found equal to ∼50µm2 at 980nm and 55µm2 at 1550nm. The performances of this amplifying fiber are detailed in the next section.
3.2 Gain performances of the Er-MOF with Λ=6µm and d=2.4µm
The overlap factor is computed for this new Er-MOF versus wavelength from 950nm to 1650nm (Λ=6µm, d=2.4µm). The results are presented in Fig. 5. As expected, Γ is significantly enhanced, whatever the wavelength. It now decreases from 0.68 at 980nm to 0.65 at 1550nm, with a slope remaining much smaller than in the Er-SIF. We can note that Γ is now higher in the Er-MOF than in the Er-SIF at the signal wavelength (0.65 and 0.57 respectively) but it remains significantly lower at the pump wavelength (0.67 and 0.85 respectively).
Fig. 5. Overlap factors versus wavelength for the reference Er-SIF and the Er-MOF (Λ=6µm, d=2.4µm).
To evaluate the potential performances of the Er-MOF as an amplifier, we now compare
them to those of the Er-SIF. The geometrical parameters of the Er-SIF amplifier are those given above (core radius=1.5µm, Δn = 21.10-3). The doped radius of the Er-MOF is Λ/2=3µm. The erbium ion concentration in each fiber is 150ppm. To comply with Wavelength Division Multiplexing (WDM) applications, the gain must be optimized over the usual 1530-1560nm range of signal wavelengths, with a maximum ripple ΔG/G (ΔG = Gmax-Gmin) around 21% and the same gain at 1530nm and 1560nm. Thus, we consider the case of alumino-germanosilicate erbium co-doping because it provides emission cross sections with the lowest variations over the considered range. Concerning the index doping, the concentration of Al/Ge ions is supposed to be high enough in the Er-SIF to create the necessary Δn=21.10-3 index difference. In the MOF, a low concentration of Al/Ge is required for allowing Er-doping. However, the index change induced by the Er and Al/Ge dopants do
#69850 - $15.00 USD Received 10 April 2006; revised 7 July 2006; accepted 31 July 2006
(C) 2006 OSA 30 October 2006 / Vol. 14, No. 22 / OPTICS EXPRESS 10871
not exceed 4.10-4 and is neglected in the modeling. Guiding properties of the Er-MOF are then the same as those of the corresponding undoped MOF.
The total signal power is -10dBm, equally distributed onto 60 channels from 1520nm to 1580nm. The pump power is arbitrarily fixed at 190mW which is a common value in single-mode optical fiber amplifiers. The optimization of each amplifier finally consists in determining its optimal length for which the highest gain is obtained over the 1530-1560nm range, with ΔG/G∼21%.
The gain curves of the optimum Er-MOF (MOF1) and of the Er-SIF are plotted in Fig. 6. The maximum gain values obtained with each amplifier are very close to each other. They are both higher than 25dB in the [1530-1560]nm bandwidth with a maximum value at 1530nm and 1560nm of about 32dB. The optimal length of the Er-SIF is 52m, with a gain variation equal to 21.7%. It is only equal to 44m for the MOF1, with a gain variation of 21%. This corresponds to a reduction of the necessary length of fiber of 15.4%.
10
15
20
25
30
35
1520 1530 1540 1550 1560 1570 1580
Wavelength (nm)
Gai
n (
dB
)
44m MOF1
52m typical SIF amplifier
28m MOF2
Fig. 6. Theoretical gain curves obtained for a typical SIF amplifier, the considered Er-MOF (MOF1) and an idealized Er-MOF (Λ=6µm, d=2.4µm) (MOF2).
3.2
3.4
3.6
3.8
4
4.2
4.4
4.6
4.8
1520 1530 1540 1550 1560 1570 1580
Wavelength (nm)
No
ise
Fig
ure
(d
B)
44m MOF1
52m typical SIF amplifier
28m MOF2
Fig. 7. Theoretical noise figure curves obtained for a typical SIF amplifier, the considered Er-MOF (MOF1) and an idealized Er-MOF (Λ=6µm, d=2.4µm) (MOF2).
#69850 - $15.00 USD Received 10 April 2006; revised 7 July 2006; accepted 31 July 2006
(C) 2006 OSA 30 October 2006 / Vol. 14, No. 22 / OPTICS EXPRESS 10872
We can see in Fig. 7 that the amplification with the MOF1 do not suffer from a
significant degradation of the noise figure that remains at the most 0.1dB higher than that of the Er-SIF all over the C band [1530-1560]nm. By only considering overlap factors between fundamental modes, we find that connecting loss between MOF1 and a standard single mode fiber is potentially negligible at 980nm. It is around 0.25dB at 1550nm. These values are significantly lower than the corresponding expected losses between the Er-SIF and a standard fiber that are higher than 2dB at the two wavelengths because of the large discrepancy between the effective areas of the modes. Fortunately, as mentioned above, the use of multirefusion techniques allows a significant reduction of this loss [5].
A complementary calculation concerning an ideal Er-MOF (MOF2) with the same geometrical parameters as MOF1, but with a larger doped region in which the overlap factors would be equal to 1 at both the pump and the signal wavelengths, has been carried out. The optimal gain curve for the MOF2 is obviously the maximum attainable gain with a Er- MOF having the same geometrical parameters. It is very similar to that of the MOF1, but it should be obtained with a length of fiber reduced to only 28m (reduction of ∼45% compared to the Er-SIF).
In order to propose an Er-MOF amplifier with an efficiency closer to that of MOF2, a new structure with enhanced overlap integrals must be designed. This work is carried out in the following section.
3.3 Design of MOFs for increasing the overlap factors
The fabrication process of MOFs offers new possibilities to design novel structures. In the considered case, we propose to significantly enlarge the core of the Er-MOF. This can be done by replacing the first ring of air holes by seven Er-doped silica rods in the preform. However, to maximize the dimensions of the doped zone, we chose to replace those seven rods by a single one with a hexagonal shape, as presented in Fig. 8.
Fig. 8. Schematic structure of the preform of a large core MOF (LCMOF) and structure of the final fiber.
In this large core holey fiber (LCMOF), the d/Λ<0.4 condition for single mode
propagation at the two wavelengths is no more valid. To determine the optimal geometrical parameters d and Λ of a LCMOF operating in the single mode regime, we have computed the confinement loss of the fundamental mode and of the higher order modes in different LCMOF, with various values of d and Λ. However, we must notice that, to keep the ratio d/Λ lower than a given value, the pitch Λ cannot be reduced below a threshold value, due to practical limitations imposed by the rheology of fused silica tubes and rods during the drawing process. So, to keep d/Λ<0.3, we cannot consider values of Λ lower than Λmin =
#69850 - $15.00 USD Received 10 April 2006; revised 7 July 2006; accepted 31 July 2006
(C) 2006 OSA 30 October 2006 / Vol. 14, No. 22 / OPTICS EXPRESS 10873
2µm. Considering that the confinement loss of the modes is dramatically enhanced when the number of rings of holes is decreased [12], our calculations show that the optimal number of rings for the LCMOF is equal to 5 in order to provide proper single mode propagation conditions at the signal wavelength (i.e., both low confinement loss of the fundamental mode and high confinement loss of the higher order modes). The confinement loss computed for each mode à λp and λs, considering different values of d and Λ and 5 rings of holes, are reported respectively in Table 1(a) and Table 1(b). For each mode the confinement loss dramatically increases when d is decreased or/and when Λ is increased. The differential loss between the fundamental mode and the higher order modes exhibits the same behavior. Even if the higher order mode can theoretically propagate, the fiber can be considered as practically single mode provided that the confinement loss of the fundamental mode is negligible while that of the higher order modes is high. This is clearly the case when d=0.6µm and Λ=2µm at λ=1550nm, where the loss of the fundamental mode and of the higher order modes are respectively <0.1dB/m and >14dB/m (Table 2). With the same geometrical parameters, the confinement loss of the higher order modes at 980nm is somewhat low. However, in practical conditions, the LCMOF is supposed to be carefully well-aligned and spliced with the output single mode fiber of a multiplexer propagating both the pump and the signal, and the fundamental mode at the pump wavelength is generally selectively excited in the LCMOF. In these conditions, the designed fiber operates in the single-mode regime at both wavelengths.
Table 1. Confinement losses of the fundamental mode and of the first higher order modes for different pitch Λ and hole diameters d; (a) at 980nm, (b) at 1550nm.
(a)
(b)
#69850 - $15.00 USD Received 10 April 2006; revised 7 July 2006; accepted 31 July 2006
(C) 2006 OSA 30 October 2006 / Vol. 14, No. 22 / OPTICS EXPRESS 10874
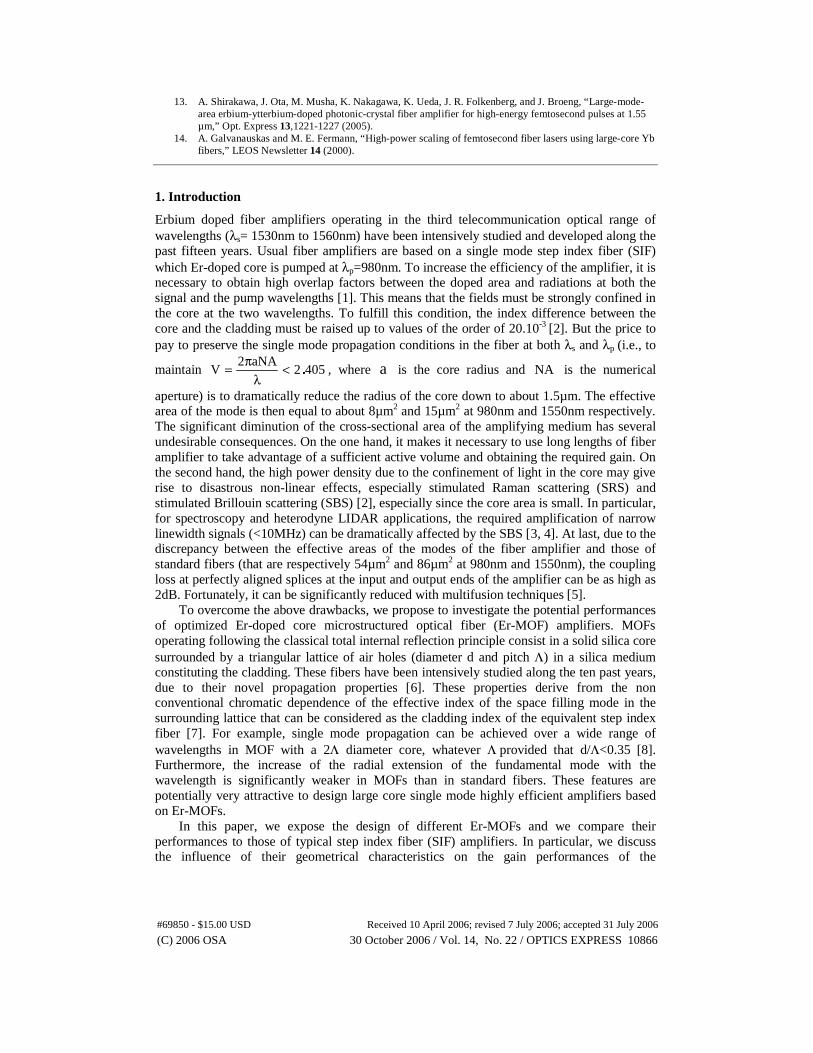
Table 2. Distribution of the electric field of different low order modes with their confinement loss in the designed LCMOF at 980nm and 1550nm.
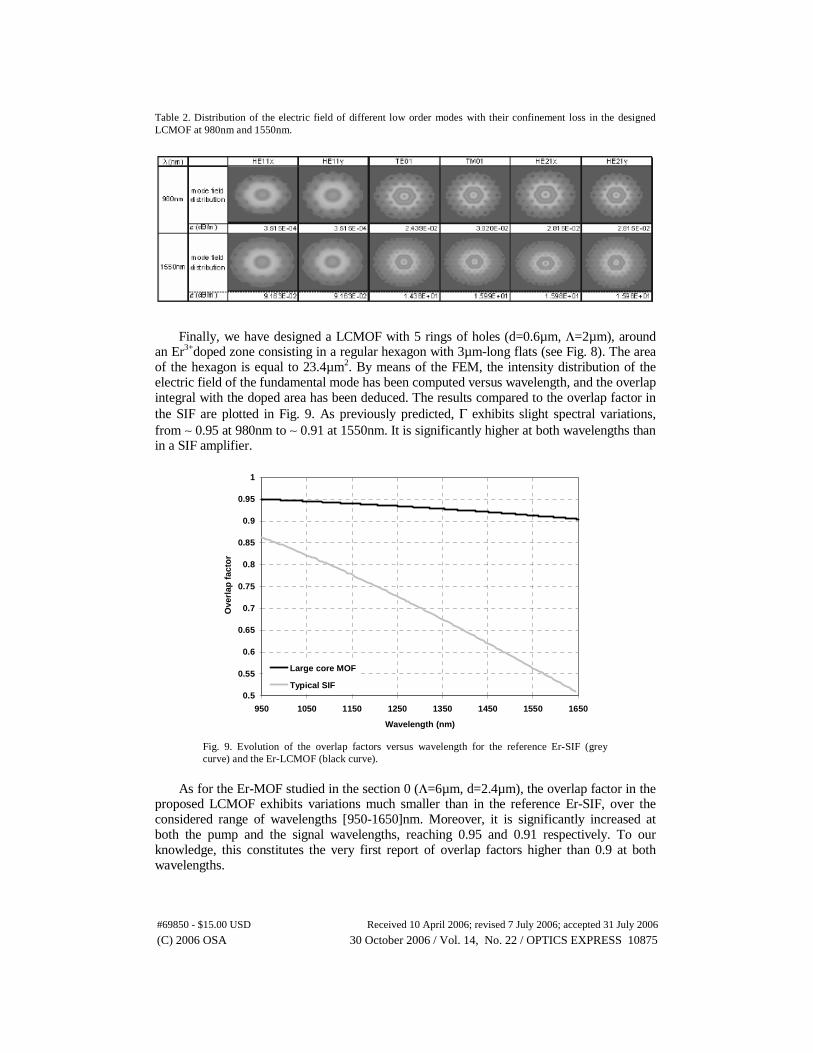
Finally, we have designed a LCMOF with 5 rings of holes (d=0.6µm, Λ=2µm), around
an Er3+doped zone consisting in a regular hexagon with 3µm-long flats (see Fig. 8). The area of the hexagon is equal to 23.4µm2. By means of the FEM, the intensity distribution of the electric field of the fundamental mode has been computed versus wavelength, and the overlap integral with the doped area has been deduced. The results compared to the overlap factor in the SIF are plotted in Fig. 9. As previously predicted, Γ exhibits slight spectral variations, from ∼ 0.95 at 980nm to ∼ 0.91 at 1550nm. It is significantly higher at both wavelengths than in a SIF amplifier.
0.5
0.55
0.6
0.65
0.7
0.75
0.8
0.85
0.9
0.95
1
950 1050 1150 1250 1350 1450 1550 1650
Wavelength (nm)
Ove
rlap
fac
tor
Large core MOF
Typical SIF
Fig. 9. Evolution of the overlap factors versus wavelength for the reference Er-SIF (grey curve) and the Er-LCMOF (black curve).
As for the Er-MOF studied in the section 0 (Λ=6µm, d=2.4µm), the overlap factor in the
proposed LCMOF exhibits variations much smaller than in the reference Er-SIF, over the considered range of wavelengths [950-1650]nm. Moreover, it is significantly increased at both the pump and the signal wavelengths, reaching 0.95 and 0.91 respectively. To our knowledge, this constitutes the very first report of overlap factors higher than 0.9 at both wavelengths.
#69850 - $15.00 USD Received 10 April 2006; revised 7 July 2006; accepted 31 July 2006
(C) 2006 OSA 30 October 2006 / Vol. 14, No. 22 / OPTICS EXPRESS 10875
These data are then used to compute the gain of the LCMOF, assuming the same operating conditions as previously: maximum gain variations over the [1530-1560]nm bandwidth =21%; erbium concentration=150ppm; pump power=190mW; total signal input power=-10dBm distributed onto 60 channels from 1520nm to 1580nm. The maximum spectral gain of the LCMOF fulfilling the above condition on ΔG/G and the corresponding noise figure are plotted in Fig. 10 and Fig. 11 respectively, together with those of the reference Er-doped SIF, for comparison.
10
15
20
25
30
35
1520 1530 1540 1550 1560 1570 1580
Wavelength (nm)
Gai
n (
dB
)
52m SIF
31m LCMOF
Fig. 10. Theoretical gain curves obtained for the considered Er-LCMOF and the typical SIF amplifier.
3.2
3.4
3.6
3.8
4
4.2
4.4
4.6
1520 1530 1540 1550 1560 1570 1580Wavelength (nm)
No
ise
fig
ure
(d
B)
52m SIF31m LCMOF
Fig. 11. Theoretical noise figure obtained for the considered Er-LCMOF and the typical SIF amplifier.
#69850 - $15.00 USD Received 10 April 2006; revised 7 July 2006; accepted 31 July 2006
(C) 2006 OSA 30 October 2006 / Vol. 14, No. 22 / OPTICS EXPRESS 10876
Fig. 10Figure 10 shows that the optimum gain obtained with the LCMOF is exactly the same as those obtained with the reference Er-doped SIF and with the classical MOF of the section 0. However, as expected, the necessary length of fiber is considerably reduced from 52m (Er-doped SIF) and 44m (MOF1) to only 31m for the LCMOF. This reduction in length of 40% denotes the high efficiency of the proposed amplifier based on the LCMOF structure. Furthermore, thanks to the large doped core, the power threshold for non-linear effects is increased. Both features are of great interest for applications in the field of short pulse amplification and lasers [13, 14]. As shown in Fig. 11, the noise factor of the LCMOF amplifier suffers from a slight increase that does not constitute a significant drawback as it remains lower than 0.2dB over the whole signal range of wavelengths. The effective area of the fundamental mode computed at λp and λs is equal to 22.5µm2 and 25.6µm2, respectively. It is significantly smaller than in a standard SIF but much larger than in the reference Er-SIF. This means that the splicing loss between a standard SIF and the LCMOF may be lower than that involving a standard SIF and the reference Er-doped SIF. This constitutes a noticeable advantage for amplifiers based on LCMOFs.
4. Conclusion
In this paper we have evaluated the potential performances of different single-mode Er-doped MOF amplifiers. We showed that the spectral decrease of the overlap factor between the doped core and the guided fundamental mode is much slower in a MOF than in a classical reference Er-doped SIF. We first considered a single mode MOF with a usual structure which doped core has the same area as the reference Er-doped SIF (Λ=3µm, d=0.9µm). In this case, the overlap factors remain smaller in the MOF at both the pump (λp =980nm) and the signal (λs=1550nm) wavelengths and this structure is shown to be of poor efficiency. Then, we designed a single mode MOF with a larger Er-doped core, i.e., with a larger pitch (Λ=6µm, d=2.4µm). For this fiber, the overlap factors are increased and they become higher than in the reference Er-doped fiber at the signal wavelengths. Thus, a gain as high as in the reference Er-doped SIF can be obtained with such a MOF which length is 15% shorter. At last, we designed a large core MOF in which the central rod and the first ring of holes are replaced by an Er-doped hexagon. The pitch is Λ=2µm and the hole diameter is d=0.6µm. In this novel structure, the overlap factor exceeds 0.9 at both the pump and the signal wavelengths. The same gain as in the reference Er-doped SIF is obtained in the LCMOF which length is 40% shorter. This demonstrates the potential high efficiency of the amplification in the proposed fiber. The increase of the noise figure is limited to less than 0.2dB over the whole amplification bandwidth [1530-1560]nm. Furthermore, the splicing loss between the LCMOF and a standard single mode fiber may be as low as that occurring between reference Er-doped SIF and the same standard single mode fiber, thanks to a higher overlap integral between the upstream and downstream modes. This efficient fiber is then demonstrated to be an attractive candidate for telecommunication amplification. But its main domain of application is in the fields of short pulse fiber lasers that require both length of amplifiers as short as possible and limited non-linear effects. This latter condition is clearly compatible with the proposed LCMOF thanks to the large effective area of the fundamental mode in this fiber.
Acknowledgments
We are grateful to the MINACOM department of Xlim for allowing us to make use of the Finite Element Method software (EMXD). We also thank researchers from Alcatel Research and Innovation Center at Marcoussis (France) and in particular Dominique BAYART, for fruitful discussions about optical amplifier technology.
#69850 - $15.00 USD Received 10 April 2006; revised 7 July 2006; accepted 31 July 2006
(C) 2006 OSA 30 October 2006 / Vol. 14, No. 22 / OPTICS EXPRESS 10877