Numerical Study of Steady Turbulent Flow through Bifurcated Nozzles in Continuous Casting FADY M. NAJJAR, BRIAN G. THOMAS, and DONALD E. HERSHEY Bifurcated nozzles are used in continuous casting of molten steel, where they influence the quality of the cast steel slabs. The present study performs two-dimensional (2-D) and three-dimensional (3- D) simulations of steady turbulent (K-e) flow in bifurcated nozzles, using a finite-element (FIDAP) model, which has been verified previously with water model experiments. The effects of nozzle design and casting process operating variables on the jet characteristics exiting the nozzle are inves- tigated. The nozzle design parameters studied include the shape, angle, height, width, and thickness of the ports and the bottom geometry. The process operating practices include inlet velocity profile and angle as well as port curvature caused by erosion or inclusion buildup. Results show that the jet angle is controlled mainly by the port angle but is steeper with larger port area and thinner walls. The degree of swirl is increased by larger or rounder ports. The effective port area, where there is no recirculation, is increased by smaller or curved ports. Flow asymmetry is more severe with skewed or angled inlet conditions or unequal port sizes. Turbulence levels in the jet are higher with higher casting speed and smaller ports. I. INTRODUCTION SEVERAL million tons of liquid metal flow through nozzles every year during the processing of semifinished metal products. The continuous casting mold for solidifying steel slabs is one example of a process in which the bifur- cated nozzle plays a critical role. This process is important because, over the past decade, the fraction of steel produced in the United States through continuous casting has grown from 29 pct to over 67 pct.ll] Continued viability of the steel industry depends upon improved efficiency and con- sistent quality of steel production. Improving the sub- merged entry nozzle (SEN), which controls the delivery of steel into the mold, is one step toward this goal. A schematic of part of the continuous casting process is depicted in Figure 1. Steel flows through the "tundish," and then it exits down through a ceramic SEN and into the mold. Here, the steel freezes against the water-cooled cop- per walls to form a solid shell, which is continuously with- drawn from the bottom of the mold at a rate or "casting speed" that matches the flow of incoming metal. Flow through the SEN is gravity driven by the pressure differ- ence between the liquid levels of the tundish and mold top free surfaces. Thus, the flow rate depends upon the amount of steel in the tundish and the flow characteristics inside the SEN. The flow rate of molten steel is controlled to maintain a constant liquid level in the mold in several ways. In one method, a simple "stopper rod" pushes down through the tundish to partially plug the exit (not pictured). Alternatively, a "slide gate" blocks off a portion of the SEN pipe section by moving a disk-shaped plate through a horizontal slit across the entire SEN, as pictured in Figure Liquid Steel slag layer Slide Gale " (flow contzol) Copper Solid Mold Powder Mold I Liquid MoldFlux [ iii! :i:i !iii %%, ContinuousWithdrawal ~dEntryNozzle (SEN) e~ence Depth %, Fig. 1--Schematic of the continuous casting process showing tundish, SEN, and mold. FADY M. NAJJAR, formerly Research Assistant, Department of Mechanical and Industrial Engineering, is with the National Center for Supercomputing Applications, University of Illinois, Urbana, IL 61801. BRIAN G. THOMAS, Associate Professor, is with the Department of Mechanical and Industrial Engineering, University of Illinois, Urbana, IL 61801. DONALD E. HERSHEY, formerly Research Assistant in the same department, is with G.E. Aircraft Engines, Cincinnati, OH 45215. Manuscript submitted June 23, 1994. 1. This flow-adjustment method allows for independent control of casting speed and metal level and is also essential for stopping the flow of molten steel if the operation must be abruptly terminated. The primary functions of the SEN are to protect the mol- ten steel from reoxidation as the steel is delivered from the tundish to the mold and to control the flow of steel within METALLURGICALAND MATERIALSTRANSACTIONS B VOLUME 26B, AUGUST 1995--749
Transcript
Numerical Study of Steady Turbulent Flow through Bifurcated Nozzles in Continuous Casting
FADY M. NAJJAR, BRIAN G. THOMAS, and DONALD E. HERSHEY
Bifurcated nozzles are used in continuous casting of molten steel, where they influence the quality of the cast steel slabs. The present study performs two-dimensional (2-D) and three-dimensional (3- D) simulations of steady turbulent (K-e) flow in bifurcated nozzles, using a finite-element (FIDAP) model, which has been verified previously with water model experiments. The effects of nozzle design and casting process operating variables on the jet characteristics exiting the nozzle are inves- tigated. The nozzle design parameters studied include the shape, angle, height, width, and thickness of the ports and the bottom geometry. The process operating practices include inlet velocity profile and angle as well as port curvature caused by erosion or inclusion buildup. Results show that the jet angle is controlled mainly by the port angle but is steeper with larger port area and thinner walls. The degree of swirl is increased by larger or rounder ports. The effective port area, where there is no recirculation, is increased by smaller or curved ports. Flow asymmetry is more severe with skewed or angled inlet conditions or unequal port sizes. Turbulence levels in the jet are higher with higher casting speed and smaller ports.
I. INTRODUCTION
SEVERAL million tons of liquid metal flow through nozzles every year during the processing of semifinished metal products. The continuous casting mold for solidifying steel slabs is one example of a process in which the bifur- cated nozzle plays a critical role. This process is important because, over the past decade, the fraction of steel produced in the United States through continuous casting has grown from 29 pct to over 67 pct.ll] Continued viability of the steel industry depends upon improved efficiency and con- sistent quality of steel production. Improving the sub- merged entry nozzle (SEN), which controls the delivery of steel into the mold, is one step toward this goal.
A schematic of part of the continuous casting process is depicted in Figure 1. Steel flows through the "tundish," and then it exits down through a ceramic SEN and into the mold. Here, the steel freezes against the water-cooled cop- per walls to form a solid shell, which is continuously with- drawn from the bottom of the mold at a rate or "casting speed" that matches the flow of incoming metal. Flow through the SEN is gravity driven by the pressure differ- ence between the liquid levels of the tundish and mold top free surfaces. Thus, the flow rate depends upon the amount of steel in the tundish and the flow characteristics inside the SEN. The flow rate of molten steel is controlled to maintain a constant liquid level in the mold in several ways. In one method, a simple "stopper rod" pushes down through the tundish to partially plug the exit (not pictured). Alternatively, a "slide gate" blocks off a portion of the SEN pipe section by moving a disk-shaped plate through a horizontal slit across the entire SEN, as pictured in Figure
Liquid Steel
slag layer
Slide Gale " (flow contzol)
Copper Solid Mold Powder Mold I
Liquid Mold Flux [
iii! :i:i
!iii %%,
Continuous Withdrawal
~d Entry Nozzle (SEN)
e~ence Depth
% ,
Fig. 1--Schematic of the continuous casting process showing tundish, SEN, and mold.
FADY M. NAJJAR, formerly Research Assistant, Department of Mechanical and Industrial Engineering, is with the National Center for Supercomputing Applications, University of Illinois, Urbana, IL 61801. BRIAN G. THOMAS, Associate Professor, is with the Department of Mechanical and Industrial Engineering, University of Illinois, Urbana, IL 61801. DONALD E. HERSHEY, formerly Research Assistant in the same department, is with G.E. Aircraft Engines, Cincinnati, OH 45215.
Manuscript submitted June 23, 1994.
1. This flow-adjustment method allows for independent control of casting speed and metal level and is also essential for stopping the flow of molten steel if the operation must be abruptly terminated.
The primary functions of the SEN are to protect the mol- ten steel from reoxidation as the steel is delivered from the tundish to the mold and to control the flow of steel within
METALLURGICAL AND MATERIALS TRANSACTIONS B VOLUME 26B, AUGUST 1995--749
the mold. The SEN has an important influence on steel quality through its effect on the flow pattern in the mold. The SEN should deliver steel uniformly into the mold while preventing problems such as surface waves, meniscus freez- ing, and crack formation. Impingement of hot liquid metal with high momentum against the solidifying shell can con- tribute to shell thinning and costly "breakouts," in which liquid steel bursts from the shell, t2J In addition, the SEN should be designed to deliver steel with the optimum level of superheat to the meniscus while preventing both detri- mental surface turbulence and shell erosion or thinning due to excessive impingement of the hot molten steel jets. In some operations, it is also important for the flow pattern to aid in the flotation of detrimental alumina inclusions into the protective molten slag layer. Plant observations have found that many serious quality problems are directly as- sociated with SEN operation and the flow pattern in the mold. TM For example, surface waves and turbulence near the top free surface can entrain some of the slag or gas bubbles into the steel, causing dangerous large inclusions and sur- face slivers, r3] Furthermore, plant experience has demon- strated the importance of the SEN on breakouts, surface inclusions from mold slag or argon entrapment, subsurface inclusions, and cracks of various types. Finally, clogging due to inclusion buildup on the SEN walls redirects the flow through the SEN and, hence, affects the jet character- istics exiting from the SEN ports.
Past experimental work to understand how SEN design affects flow in the mold and associated phenomena has been performed primarily using water models of the SEN and moldy -u] Mills and BarnhardtU2] conducted experi- ments in freezing water models to study the effect of nozzle design on the alumina entrapment mechanism inside the mold cavity. They investigated two- and multiport nozzles and found a significant improvement in the flow pattern inside the mold cavity with multiport nozzles. Saito et aL u3j studied the flow patterns inside the mold cavity from four- port nozzles using water-modeling techniques. DawsonV41 investigated inlet curvature of the bore using water-mod- eling and steel-casting experiments. Recently, Gupta and LahiritlS~ performed water-modeling experiments for noz- zles with different port angles and bore diameters in free- fall and submerged jets. Honeyands et aL u61 performed water-modeling experiments for SEN with various bore di- ameters, port angles, and heights and measured the jet angle and the effective port area. Further, numerical studies have been performed on the complex geometry of the SEN to complement the experiments, v~~ Wangt2~ has formulated a three-dimensional (3-D) finite-element model to study the asymmetrical flow through the SEN ports as a result of the slide gate position. Hershey et aL t221 have assessed the ac- curacy of the 3-D and two-dimensional (2-D) finite-element simulations of the flow in the SEN, through comparison with velocity measurements and water model observations. They demonstrated the feasibility and the reasonable ac- curacy of this approach, including the separation of the noz- zle, mold calculations, and the use of 2-D simulations.
The present work extends the model of Hershey et a lY 2~ to investigate the influences of the nozzle geometry and the effects of operating conditions on flow inside the SEN. The SEN geometry is one of the few variables in continuous casting that is easy and inexpensive to change and also has an important influence on both productivity and product
quality. Using the commercial finite-element code (FIDAP), 2-D and 3-D simulations are performed to provide insights into the parameters that control the flow of liquid steel in the nozzle. These parameters are classified as SEN geom- etry (or design) and casting operation practices. The geo- metric parameters include the port angle, port height, port width, port dispersion angle, nozzle wall thickness, port curvature, and bottom shape. The process variables include the inlet velocity profile and angle as well as the port cur- vature due to nozzle erosion or inclusion buildup. The re- suits focus on the jet characteristics exiting the nozzle, including flow asymmetry, which is suspected to adversely influence the flow dynamics inside the caster. Finally, the results obtained from the finite-element model of the SEN are necessary to provide inlet boundary conditions for the simulations of flow inside the mold. I231
II. MODEL FORMULATION
A. Governing Equations
The flow of molten steel through a bifurcated SEN into a continuous casting mold is inherently 3-D, time depend- ent, and turbulent. The Reynolds number, based on the noz- zle bore diameter (D), is typically of the order of 10 5. However, unsteady 3-D simulations are computationally in- tensive for the current geometrical configuration. As an in- itial step toward understanding the flow dynamics in bifurcated nozzles, the present work adopts a steady-state approach. Previous numerical studies [19,2~ have shown the feasibility and benefits of such an approach. The current numerical procedure solves the time-independent mass and momentum conservation equations for an incompressible single-phase Newtonian fluid given by the following:
0vi - - = 0 [ 1 ] Oxi
-
- - + " ) ", ox, ox, J
where the indices i and j = 1, 2, and 3 represent the x, y, and z directions and repeated indices indicate summation. The time-mean velocities are denoted by vi = {vx, Vy, Vz}. In Eq. [2], p is the fluid density, /.to represents the molecular viscosity, and tt, is the turbulent (or eddy) viscosity.
The two-equation K-e turbulence model is chosen to close the system of equations. This requires the solution of two additional transport equations to determine the turbulent ki- netic energy, K, and the turbulent dissipation, e, fieldsY 61
P ~J~jxj :"~j ~'~j ~ - C l K ~ J ~ t * i C 2 O g t4]
where
K 2 /x, : Cu p - - [6]
E
750~VOLUME 26B, AUGUST 1995 METALLURGICAL AND MATERIALS TRANSACTIONS B
Restricted Inlet \
Modelled Nozzle
Submerged
[ ] - "tz?,e
let Angle, O!
[] ~Nozzle Bore
Port Angle,~, ]~
1 ~ ~ ~PortHeight I-tp
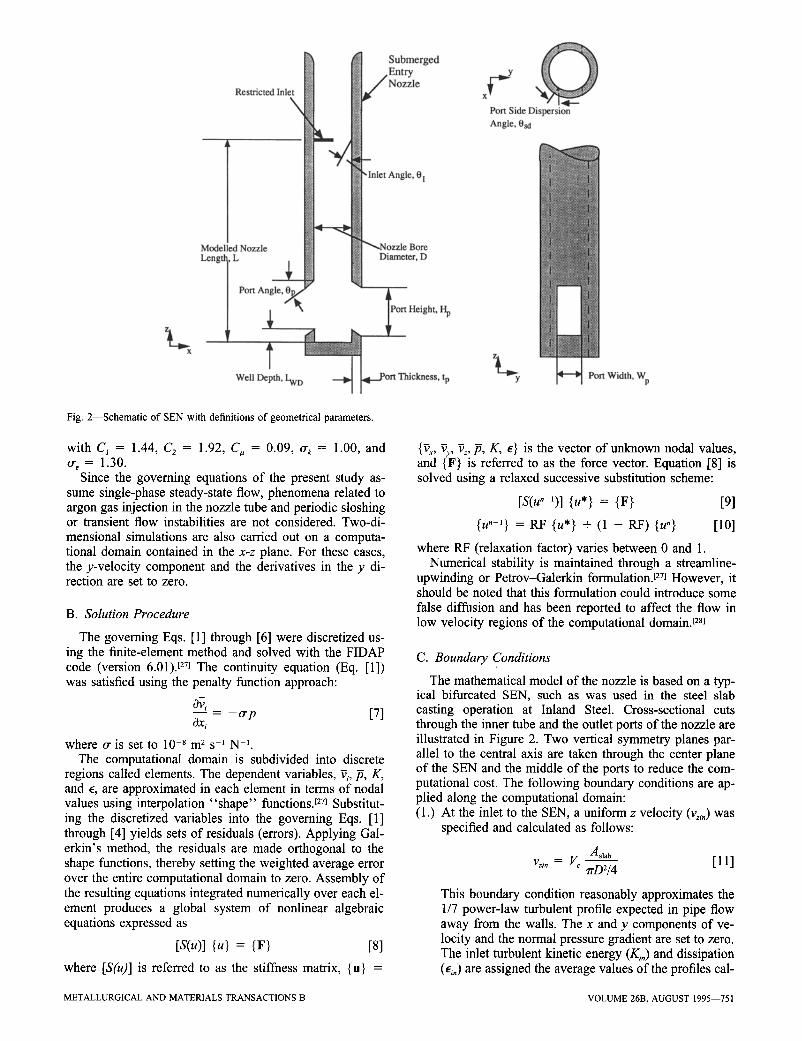
WollL o Fig. 2--Schematic of SEN with definitions of geometrical parameters.
Port Side Dispersion Angle, 0sd
~k..~y ~ - ~ Port Width, %
with C~ = 1.44, C2 = 1.92, C, = 0.09, o- k = 1.00, and ~, = 1.30.
Since the governing equations of the present study as- sume single-phase steady-state flow, phenomena related to argon gas injection in the nozzle tube and periodic sloshing or transient flow instabilities are not considered. Two-di- mensional simulations are also carried out on a computa- tional domain contained in the x-z plane. For these cases, the y-velocity component and the derivatives in the y di- rection are set to zero.
B. Solution Procedure
The governing Eqs. [1] through [6] were discretized us- ing the finite-element method and solved with the FIDAP code (version 6.01)F 7j The continuity equation (Eq. [1]) was satisfied using the penalty function approach:
0v, - - = - o - p [ 7 ] Ox~
where o- is set to 10 -8 m 2 s -1 N -~. The computational domain is subdivided into discrete
regions called elements. The dependent variables, ~, p, K, and e, are approximated in each element in terms of nodal values using interpolation "shape" functions, c271 Substitut- ing the discretized variables into the governing Eqs. [1] through [4] yields sets of residuals (errors). Applying Gal- erkin's method, the residuals are made orthogonal to the shape functions, thereby setting the weighted average error over the entire computational domain to zero. Assembly of the resulting equations integrated numerically over each el- ement produces a global system of nonlinear algebraic equations expressed as
IS(u)] {u} = {r} [8]
where [S(u)] is referred to as the stiffness matrix, {u} =
{~x, vy, v:, p, K, e} is the vector of unknown nodal values, and {F} is referred to as the force vector. Equation [8] is solved using a relaxed successive substitution scheme:
[S(u"-~)] {u*} = {F} [9]
{u "+~} = RF {u*} + (1 - RF) {u"} [10]
where RF (relaxation factor) varies between 0 and 1. Numerical stability is maintained through a streamline-
upwinding or Petrov-Galerkin formulation, t271 However, it should be noted that this formulation could introduce some false diffusion and has been reported to affect the flow in low velocity regions of the computational domain.t/8]
C. Boundary Conditions
The mathematical model of the nozzle is based on a typ- ical bifurcated SEN, such as was used in the steel slab casting operation at Inland Steel. Cross-sectional cuts through the inner tube and the outlet ports of the nozzle are illustrated in Figure 2. Two vertical symmetry planes par- allel to the central axis are taken through the center plane of the SEN and the middle of the ports to reduce the com- putational cost. The following boundary conditions are ap- plied along the computational domain: (1.) At the inlet to the SEN, a uniform z velocity (vzi,) was
specified and calculated as follows:
Aslab v~,. = v c - - [11]
rrD2/4
This boundary condition reasonably approximates the 1/7 power-law turbulent profile expected in pipe flow away from the walls. The x and y components of ve- locity and the normal pressure gradient are set to zero. The inlet turbulent kinetic energy (Ki,) and dissipation (Ei,) are assigned the average values of the profiles cal-
METALLURGICAL AND MATERIALS TRANSACTIONS B VOLUME 26B, AUGUST 1995--751
Table I. S t a n d a r d S imula t ion Condi t ions w h e r e
Nozzle dimensions: Bore diameter, D 76.0 mm Length - total 501.2 mm
modeled, L 300.0 mm Port angle, 0p -15 deg Side dispersion angle, Osa 0 deg Port height, Hp 90.0 mm Port thickness, tp 25.5 mm Port width, Wp 60.0 mm Recessed bottom depth, LwD 13.0 mm
Molecular viscosity,/z0 0.0056 kg m -1 s -l Density, p 7021 kg m -3 Casting speed, V c 0.01563 m s -1 Slab area, Aslab 1.422 • 0.203 m 2 Inlet conditions:
x velocity, (v~)g. 0.0 y velocity, (vy)~, 0.0 z velocity, (v~)~, -1.0 m s -~ Blockage ratio 0 pct Inlet flow angle, Oi 0 deg Turbulent kinetic energy, (K)~, 0.00425 m z s -z Dissipation, (e)~, 0.025 m z s -3 Turbulent viscosity, (/x,)~, 0,457 kg m -~ s -1
Initial guess Velocity 0.0 m s -l Turbulent kinetic energy 0.0035 m 2 s -: Dissipation 0.020 m 2 s 3
Inlet Reynolds number 95,285
culated from a mixing-length model for turbulent pipe flow. [29,3~ Further details have been described else- where.tl9]
(2.) The component of velocity normal to each symmetry plane is fixed to zero to prevent fluid from penetrating the surface. The normal gradients of the two remaining velocity components, the pressure, the turbulent kinetic energy, and the turbulent dissipation, are set to zero. These stress-free boundary conditions are also applied to all variables on the outlet plane of the port.
(3.) Since the K-E turbulence model is of the high Reynolds number type, it should not be applied in the near-wall regions. Thus, the "law-of-the-wall" approach has been applied by creating near-wall elements along all wall surfaces. This approach captures the steep gradi- ents in the near-wall region without using excessive mesh refinement. The near-wall elements employ spe- cial shape functions based on Reichardt's law. t31,321 Ve- locity components at the stationary wall side are set to zero. Boundary conditions on K and �9 are applied at the fluid side of the near-wall elements as follows:
OK - - = 0 [12] On
e = K)I ' [13] KA
where K is the von-K~mfin constant with a value of 0.41 and A is the element height. Since K and �9 are not defined within these elements, I.tt is based on van Driest's mixing length model given by
[ 0 ~ t. 0V// 0Vjj)] 1/2 [14]
and
lm = KA [1 -- exp ( --A+/26)] [15]
pcuO.25KO.S A A+ - [161
/Xo
Further details on the near-wall element formulation are given elsewhere. {22,27,33]
D. Computational Details
Table I summarizes the dimensions and the operating conditions for the base mathematical model. The 3-D finite- element mesh has 5415 nodes consisting of 4432 eight- node linear brick elements and 802 eight-node near-wall elements. The 2-D finite-element mesh has 1848 nodes con- sisting of 1740 four-node linear quadrilateral elements and 154 two-node wall elements. The solution procedure dis- cussed in Section II-13 uses an RF of 0.7 during the initial five iterations and 0.85 for the subsequent ones. This strat- egy is found to accelerate the convergence rate of the so- lution.V8~ The 2-D and 3-D simulations require approxi- mately 25 iterations for the residual of the velocity field and the K and E fields to reach less than 1.2 and 3.0 pct, respectively. The computational costs of the 2-D and 3-D simulations are approximately 14.3 and 510 seconds of cen- tral processing unit (CPU) time per iteration, respectively, on a CRAY-2.*
*CRAY is a trademark of Cray Research, Inc., Minneapolis, MN.
In describing the flow at the nozzle outlet port, several parameters including jet speed, jet angle, jet spread angle, and turbulence intensity are determined. At specific points, these variables are defined as follows:
(1.) the speed,
/Vx - - V = 2 + vy2 + v Z [17]
(2.) the local jet angle,
Ozx = tan- ' (Vz/Vx) [18]
(3.) the local spread angle in the horizontal plane,
Oyx = tan -l (vy/vx) [19]
and
(4.) the turbulence intensity,
~-(v K) [20] I = 2
Mean quantities are based on a weighted average of the area or the outflow mass rate and are defined as follows:
(1.) the mean jet speed, /~,
fz = ~/fzx: + ~-y2 + re2 [21]
where
752--VOLUME 26B, AUGUST 1995 METALLURGICAL AND MATERIALS TRANSACTIONS B
1 . 0 r n / s
Z
1 I I I 1 I
II I I i I i I
t �9 o .
I t . .
, . I I , .
I i �9 . .
~tl II1 t t t l l l ~tt Ill
- x \ \ \ ~
" - ~ \ \ \
I 1 . \
I i ~ , "x I I I ,,~ i x , , , , .
1.0 mls
i , , �9 i I I I
I I I f I I I
I I I I I l l
I I I I I I I
' ' I III - / I / • 11
i , , . . . .
I i , , ,
I I I
I I ' I I
II II i I I I
" ~ z " /
(a) Co) (c) (d) (e)
Fig. 3 ~ a l c u l a t e d velocities for standard 3-D SEN. (a) 3-D view, y-z cross-sectional cuts at (b) x = 0 mm, (c) x = 20 mm, (d) x = 40 mm, and (e) x = 63.5 mm (outlet plane of port).
~ = , = (L), ~ (Ay), (,%),
2 (ae),(az), , = 1
k = x , y , o r z [22]
(2.) the mean jet angle, 0=,
0zx = tan -I ' ~ (vz)' V~ (Ay),
Z , = 1
[23]
(3.) the mean spread angle,/)~,
( ~ (~x)' Vi(Ay )i(Az)i) ~)~y = tan_ 1 , ~1
i ~=1 (~y)' wi (Ay)i (Az)i
[24]
(4.) the mean turbulence intensity, i,
]=?(R Vz,~ 2
where
[25]
Z /q v, (Ay), (a=), /s = ' =N~E [26]
Z Vi (hy)i (Az) i i = I
(5.) the effective area fraction,/3, is defined as the fraction of the outlet port area where the flow has a positive x component of velocity, so it exits the nozzle domain.
The rest of the port contains a recirculation region, where flow re-enters the nozzle.
(6.) the mass flow rate ratio is defined as the ratio between the total mass flow rates exiting through the right and left ports and indicates asymmetry in the flow pattern.
In Eqs. [21] through [26], ~ is the speed in one element (Eq. [17]), N E is the number of elements in that portion of the plane of the port outlet with positive x velocity, and Ay and A z are the element sizes in the y and z directions, re- spectively. It was found that ] almost doubles if a simple average is employed instead of the weighted average based on mass flow rate defined here.
III. RESULTS
Figure 3 presents velocity vectors for the flow field com- puted from the base problem in Table I. It is seen that the fluid exits the nozzle ports at a steeper downward angle than the - 1 5 deg port angle. The mean jet angle, 0=, is calculated to be - 2 4 deg, and the computed mean jet speed, I 7, is 0.94 m s -1. Further, it is observed that the flow exits from the bottom half of the outlet port, and a low- velocity recirculation region is present in the upper half of the port. The effective area fraction,/3, is computed to be 0.60. Other published work [221 has verified that the current results agree with experimental observations and measure- ments in a full-scale water model of the slab casting pro- cess. The mean turbulence intensity, [, at the port outlet is calculated to be 0.15 and is found to be slightly underes- timated compared with the experimental measurements, t22]
The results obtained from 3-D simulations predict very slight spreading of the jet as it crosses the plane of the nozzle outlet ports. The mean spread angle, 0~, is computed to be less than 1 deg. However, the local spread angle, 0 H, reaches a maximum value of 18 deg at the bottom of the
METALLURGICAL AND MATERIALS TRANSACTIONS B VOLUME 26B, AUGUST 1995--753
port. This indicates that the jet exits the outlet port with a swirling velocity component, as shown in Figure 3. The exit vortex in the lower comer of the port emphasizes the three-dimensionality of the flow. However, based on a pre- vious study,t22~ the results obtained from the 2-D simula- tions are found to satisfactorily capture the mean flow characteristics. Hence, the predominant flow features are confined to the 2-D (x-z) plane. In the current study, 2-D numerical simulations are performed as appropriate to de- crease the computational requirements.
IV. EFFECT OF NOZZLE DESIGN
The design of the SEN geometry is crucial to the control and quality of the continuous casting process. One task is to maintain the desired flow rate of molten steel through the nozzle. Since casting operating conditions may span a wide range from start-up to shutdown, the final SEN design should be appropriately optimized.
The direction of the jet discharge into the mold cavity should be designed to avoid both shallow and deep jet an- gles according to the mold width, casting speed, and other casting conditions. A shallow mean jet angle may deliver the molten steel directly to the meniscus, resulting in sur- face turbulence and promoting the entrainment of mold slag into the liquid steel. This disrupts solidification near the meniscus, which is critical to surface quality. Then, after solidification, entrained mold slag can cause the formation of detrimental complex aluminum-, silicon-, and calcium- based oxide inclusions. When these oxides are present near the surface of the steel slab, critical line defects (slivers) are formed in the rolled product.
A steep jet angle may drive the steel too deep into the mold and inhibit the flotation of inclusions and their re- moval by the slag layer. It may also cause the molten steel to lose its superheat by the time it reaches the meniscus. This promotes freezing of the meniscus, which may cause deep oscillation marks, consistent poor quality problems, and even "bridging" (in which the top surface of the steel freezes across the distance between the SEN and the wide face of the mold). These problems likely explain the poor performance of "straight-through" nozzle tubes with open bottoms.[lOl
Furthermore, driving the jet of hot molten steel at high speed directly toward the solidifying shell can be detrimen- tal. If the superheat and casting speed are high, then the heat delivered by the impinging jet to the inside of the narrow face shell may exceed the heat extraction from the shell exterior, which results in shell erosion in local thin spots and may cause a breakout. High-speed flow toward the narrow face also increases the extent of surface level variations r341 and encourages detrimental vortex formation and the accompanying entrainment of mold slag. High- speed flow from the nozzle also inhibits the flotation of inclusions and argon bubbles, which leads to serious sur- face defects in the final product.
Finally, temporal variation and spatial inhomogeneity of the flow exiting the port may cause surface turbulence, rapid surface level fluctuations, sloshing, and entrainment of mold slag into the liquid steel. Although these phenom- ena are difficult to predict with steady-state computations, high turbulence intensity (large 1) and a large recirculation zone in the top portion of the nozzle (small /3) are two
strong indicators of turbulent fluctuations, which may lead to these causes of severe quality problems. Similarly, a large degree of swirl (as indicated by the local dispersion angle) may be detrimental. In addition, the ineffective area of the port may be more prone to detrimental inclusion buildup and clogging of the nozzle.
This section studies the relative contribution of various nozzle geometric design variables on the important char- acteristics of the jet exiting the nozzle. The investigated parameters include port angle, height, width, thickness, side dispersion angle, port shape, number of ports, and bottom geometry.
A. Port Angle, 0 v
The primary function of the angle built into the SEN ports is to direct the molten steel jet at a desired angle from the SEN into the mold cavity. Plant observations and full- scale water experiments report a close relation between the exit jet flow characteristics and the SEN outlet port an- gle. tS,15.17j The present simulations are performed for port angles varying from +30 to -30 deg (upward and down- ward port angles are denoted with + and - sign, respec- tively). Other modeling parameters are set to the values in Table I. Figure 4(a) shows the velocity vector field for a nozzle with + 15 deg port angle. It is observed that the jet has a predominant negative (or downward) x-velocity com- ponent with 0= of -10 deg. Table II summarizes the jet mean speed, angle, effective area fraction, and mean tur- bulence intensity for port angles of -30 deg, -15 deg, 0 deg, +15 deg, +30 deg.
It is seen that, for all the port angles investigated, the jet discharges from the nozzle with a larger downward angle than the port edges. Similar observations were made by Gupta and Lahiri.t15~ In their water-modeling experiments, jet angles of -32, -15, and - 9 deg were measured for nozzle port angles of -25, 0, and +15 deg, respectively. The present computed jet angles closely agree with these experimental values. Due to the slow-moving fluid in the recirculation region in the upper ineffective portion of the port, the angle of the top edge of the port does not affect the jet direction. This corroborates the water-modeling ex- periments of McPherson, t8~ who varied the upper and lower port angles independently and fotmd that the jet direction is not influenced by the angle of the top edge of the port.
Although the average spread angle remains fairly con- stant at 0.8 deg for several port angles, the maximum local spread angle, (OaT)max , increases from 18 deg for a -15 deg port angle to 24 deg for a + 15 deg port angle. This indi- cates that the swirling component increases with the port angle. The experimental measurements of Gupta and La- hiritlsJ report similar trends. Finally, the mean jet speed de- creases, and the effective area fraction increases with decreasing port angle, while the mean turbulence intensity remains nearly constant.
B. Port Height, Hp
The influence of port height was investigated for various port angles using the 2-D model. Figure 4(b) presents the velocity vector field for + 15 deg SEN with port height, lip, of 45 mm. Comparing the velocity vectors in Figures 4 (a) and (b) shows that the jet aligns itself closer to the nominal
754---VOLUME 26B, AUGUST 1995 METALLURGICAL AND MATERIALS TRANSACTIONS B
l tltllllllllllllllJll . 11111 lll lt
1.0 m/
: :'. ~
: ;z : ~,',4
(a) ] (b) X
Fig, 4--4Salculated velocities in the port vicinity for a +15 deg SEN: (a) Hp = 90 mm and (b) lip = 45 mm.
port angle when the port height is smaller. The mean jet angle is +2.5 deg for Hp = 45 mm compared with - 1 0 deg for Hp = 90 mm (Table II).
The mean jet velocities (17) are 0.99 and 1.6 m s -1, and the turbulence intensities (/) are 0.12 and 0.18 for 90- and 45-mm port heights, respectively. These increases in /? and ] for Hp = 45 mm are caused by the greater constriction imposed on the flow through a port with a smaller height. The current results agree with the measurements of Honey- ands et aL [161 The computations performed o n a SEN with - 15 deg port angle show similar trends where 0= decreased from - 2 4 deg to - 1 8 deg and ] increased from 0.12 to 0.19 for 90-mm and 45-mm ports, respectively.
The effective area fraction (/3) is also found to increase to 0.75 for the smaller port height, as seen in Figure 4 (b). This is expected to reduce alumina buildup and SEN block- age. Based on water-modeling experiments on a nozzle with round ports and an inner nozzle (bore) diameter of 250 mm, Honeyands et aLt~6j have correlated/3 to the ratio of the total port area to the bore area. They found that, below a port-to-bore ratio of 1, /3 is 1; while for port-to- bore ratios above 1,/3 decreases. In Figure 4, the port-to- bore ratio is 1.2 for Hp = 45 mm and 2.4 for the base conditions, Hp = 90 mm. The presence of the detrimental recirculation zone (/3 < 1) is predicted for both port heights, which is consistent with Honeyands.t~61 In Section IV-F, it is shown using 3-D simulations that nozzles with port-to-bore ratios less than 1 have /3 = 1. This provides further agreement with Honeyands et aL t~6]
C. Port Thickness, tp
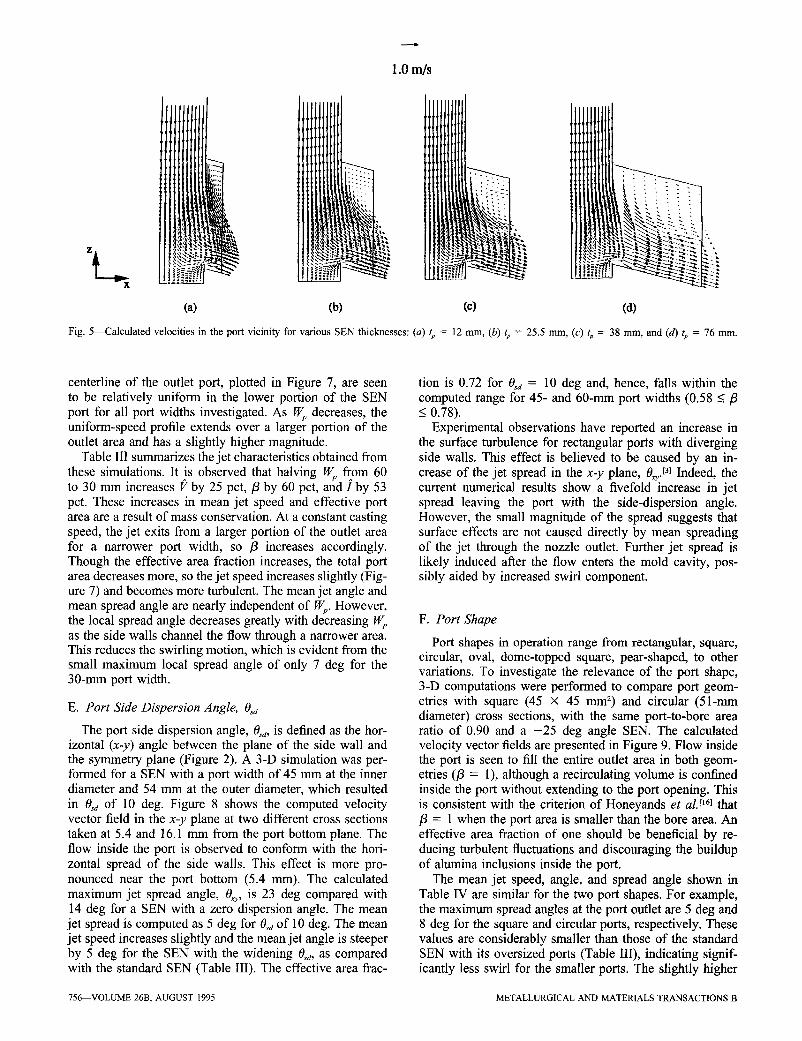
The bore diameter limits the maximum attainable casting speed while the outer diameter must fit easily inside the mold cavity. Half the difference between these two diam- eters corresponds to the port thickness, tp, and represents another SEN design variable influencing the exit jet. Two- dimensional simulations were performed for the port heights of 45 and 90 mm and port angles of ___ 15 deg with v a r y i n g tp from 12 to 76 mm.
Figure 5 illustrates the velocity vector field obtained with
Table II. Mean Jet Characteristics for Various Port Angles Based on Two-Dimensional Simulations
increasing tp for the otherwise base conditions of Table I. It is observed that the jet becomes more aligned with the port angle as ~ increases. Specifically, as tp increases from 12 to 76 mm, 0~ changes from -29.6 deg to -16.1 deg, tending asymptotically toward the port angle of - 15 deg. Figure 6(a) illustrates this trend, showing that 0zx converges to the port angle even faster for the shorter 45-mm port height.
Figures 6(b) and (c) present the variation of mean tur- bulence intensity and effective area fraction with tp at dif- ferent port heights and angles. The mean turbulence intensity decreases slightly with increasing port thickness and is not affected by the port angle (Figure 6(b)). The effective area fraction does not change much with tp in the 90-mm port height but increases to 1 at 76-mm thickness in the 45-mm port height.
The local jet angle (0~) is almost constant for large tp, as compared to small tp, where it could vary up to 25 deg (Figures 5(a) and (d)). This result implies that thicker ports reduce spreading of the jet. This finding explains the prac- tice of adding "ears" (extensions) to the sides and bottom of the nozzle ports. Ears act to increase the effective port thickness and, therefore, should induce the jet to follow the angle of the ports more closely and reduce its spread.
D. Port Width, Wp
Three-dimensional simulations were carried out to study the effects of the port width, Wp, on the jet characteristics. Specifically, port widths of 30, 45, and 60 mm were studied for the conditions in Table I. The speed profiles down the
METALLURGICAL AND MATERIALS TRANSACTIONS B VOLUME 26B, AUGUST 1995--755
(a)
1.0 m/s
,"N}#% iifN
(b)
~ ' . : . .
(e)
! ,ii+i>
Fig. 5 ~ a l c u l a t e d velocities in the port vicinity for various SEN thicknesses: (a) tp = 12 mm, (b) tp = 25.5 mm, (c) tp = 38 mm, and (d) tp = 76 mm.
centerline of the outlet port, plotted in Figure 7, are seen to be relatively uniform in the lower portion of the SEN port for all port widths investigated. As Wp decreases, the uniform-speed profile extends over a larger portion of the outlet area and has a slightly higher magnitude.
Table III summarizes the jet characteristics obtained from these simulations. It is observed that halving W e from 60 to 30 mm increases I > by 25 pct,/3 by 60 pct, and ,? by 53 pct. These increases in mean jet speed and effective port area are a result of mass conservation. At a constant casting speed, the jet exits from a larger portion of the outlet area for a narrower port width, so /3 increases accordingly. Though the effective area fraction increases, the total port area decreases more, so the jet speed increases slightly (Fig- ure 7) and becomes more turbulent. The mean jet angle and mean spread angle are nearly independent of Wp. However, the local spread angle decreases greatly with decreasing Wp as the side walls channel the flow through a narrower area. This reduces the swirling motion, which is evident from the small maximum local spread angle of only 7 deg for the 30-mm port width.
E. Port Side Dispersion Angle, Osd
The port side dispersion angle, 0sa, is defined as the hor- izontal (x-y) angle between the plane of the side wall and the symmetry plane (Figure 2). A 3-D simulation was per- formed for a SEN with a port width of 45 mm at the inner diameter and 54 mm at the outer diameter, which resulted in 0,~ of 10 deg. Figure 8 shows the computed velocity vector field in the x-y plane at two different cross sections taken at 5.4 and 16.1 mm from the port bottom plane. The flow inside the port is observed to conform with the hori- zontal spread of the side walls. This effect is more pro- nounced near the port bottom (5.4 mm). The calculated maximum jet spread angle, 0~y, is 23 deg compared with 14 deg for a SEN with a zero dispersion angle. The mean jet spread is computed as 5 deg for 0sa of 10 deg. The mean jet speed increases slightly and the mean jet angle is steeper by 5 deg for the SEN with the widening 0s~, as compared with the standard SEN (Table III). The effective area frac-
tion is 0.72 for 0sa = 10 deg and, hence, falls within the computed range for 45- and 60-mm port widths (0.58 < 13 < 0.78).
Experimental observations have reported an increase in the surface turbulence for rectangular ports with diverging side walls. This effect is believed to be caused by an in- crease of the jet spread in the x-y plane, 0,~,. [31 Indeed, the current numerical results show a fivefold increase in jet spread leaving the port with the side-dispersion angle. However, the small magnitude of the spread suggests that surface effects are not caused directly by mean spreading of the jet through the nozzle outlet. Further jet spread is likely induced after the flow enters the mold cavity, pos- sibly aided by increased swirl component.
F. Port Shape
Port shapes in operation range from rectangular, square, circular, oval, dome-topped square, pear-shaped, to other variations. To investigate the relevance of the port shape, 3-D computations were performed to compare port geom- etries with square (45 • 45 mm 2) and circular (51-mm diameter) cross sections, with the same port-to-bore area ratio of 0.90 and a -25 deg angle SEN. The calculated velocity vector fields are presented in Figure 9. Flow inside the port is seen to fill the entire outlet area in both geom- etries (/3 = 1), although a recirculating volume is confined inside the port without extending to the port opening. This is consistent with the criterion of Honeyands et aLtO61 that /3 = 1 when the port area is smaller than the bore area. An effective area fraction of one should be beneficial by re- ducing turbulent fluctuations and discouraging the buildup of alumina inclusions inside the port.
The mean jet speed, angle, and spread angle shown in Table IV are similar for the two port shapes. For example, the maximum spread angles at the port outlet are 5 deg and 8 deg for the square and circular ports, respectively. These values are considerably smaller than those of the standard SEN with its oversized ports (Table III), indicating signif- icantly less swirl for the smaller ports. The slightly higher
756 VOLUME 26B, AUGUST 1995 METALLURGICAL AND MATERIALS TRANSACTIONS B
40.0
30.0
20.0
< ~ 10.0 _o-
< 0.0
-10.0
-20.0
-30.0
-40.0 10
. . . . ~ . . . . i . . . . i . . . . i . . . . i . . . . i . . . .
.I H =~rnm. 0 =-15~ P P I
+ H = 4 5 r a m ' 0 =-15 ~ I p , p .... z~---H =90turn. 0 =+15~ --.-c.--. H: = 45 ram; 0: = +15 ~ ....... . ..... o
.o-- . ....................
.......--"'"" .....-""
20 30 40 50 60 70 80 Port T h i c k n e s s
(a)
N
0.40
0.35
0.30
0.25
0.20
0.15
0.10
0.05
, , i . . . . i . . . . i . . . . i . . . . ! . . . . i . . . .
] ~ H p = 9 0 m m ; 0 p = - 1 5 * [
�9 Hp=45 mm ;0p=-15~
.... t~--. Hp= 90mm;0p=+15 ~
----c..-- Hp=45 ram; 0p=+15 ~
0.00 . . . . t , , , , I . . . . J . . . . I . . . . t . , r ~ I r , ~ l
10 20 30 40 50 60 70 80 Port T h i c k n e s s
(b)
<
m
1 . 6 0
1 . 4 0
1 . 2 0
1 . 0 0
0.80
0.60
0.40
0.20
0.00
A H =90ram'0 =-150 I p ' p
�9 H =45mm'O =-15 ~ I P p .... ~ - H =9om.o =+150l P " P I
. . . . I . . . . I . . . . i . . . . i , , , i l l J , , I . . . .
10 20 30 40 50 60 70 80 Port Thickness
(e)
F ig . 6 ~ D i s t r i b u t i o n o f (a) 0=, (b) Z and (c) /3 for v a r i o u s S E N
th i cknesses .
maximum spread angle for the circular port suggests that the swirling flow generated in the well of the SEN tube is maintained inside the port. The comers of the square port break up the swirl, which results in higher turbulence lev- els.
G. Bottom Design
Common SEN bottom configurations include flat, pointed, and recessed designs. Plant operations have ex-
91)
80 ..----o--- Wp = 45 ram
70 =
~ 50
i~ 30
20
10
0 , , i . , i i i i t I i i i [ i L i I i i i I i ~ i I i i *
0.00 0.20 0.40 0.60 0.80 1.00 1.20 1.40 1.60
Speed, V (ms "1)
F ig . 7 - - S p e e d prof i les d o w n por t cen te r l ine (x = 63.5 r a m , y = 0) for
v a r i o u s por t wid ths .
Table IlL Jet Characterist ics with Various Port Widths for 0p = - 1 5 deg Based on Three-Dimensional Simulat ions
perimented extensively with different types of SEN bot- toms, and although differences have been observed, problems related to flow behavior, wear, clogging, refrac- tory failure, and start-up splashing have been associated with every des ign . [4,5,8.9] To gain insight into the importance of the bottom design, computations were performed for three different bottom designs (shown in Figure 10): flat, pointed, and recessed wells.
The velocity vectors for the three bottom designs with -15 deg port angle are displayed in Figure 10. It is seen that the results are generally independent of the bottom ge- ometry. Table V presents the jet characteristics for the three bottom designs at two port angles of -15 deg and + 15 deg. The calculated mean jet speeds, angles, and effective area fractions are similar between designs. The only no- ticeable trend is a progressively higher turbulence intensity found for changing the bottom design from fiat to pointed to recessed, particularly for downward-angled ports. The relative indifference to bottom design was also found with asymmetric inlet conditions.t25~
According to several plant repor t s [4,35~ a recessed bottom design produces slower recirculation, which leads to fewer surface waves and decreased swirling at the top surface of the mold. This result appears to disagree with the present results. It is possible that the 2-D steady-state flow as- sumption may render the mathematical model incapable of predicting the differences between bottom designs observed in experiments. First, the recessed bottom might help re- duce the swirling component of the flow, which is not cap- tured by the 2-D simulations. Second, the bottom design
METALLURGICAL AND MATERIALS TRANSACTIONS B VOLUME 26B, AUGUST 1995 757
S
~ -" eSO = I0"
".'.:: ,
5.4 m m
. . �9 ~, \ \ \
~ , , ' , \ \ \ \ \ , \ \ \ \ \ \
t I (a) (b)
Fig. 8--Calculated velocities above the port bottom for a 10 deg side dispersion SEN: (a) 5A mm from bottom of port and (b) 16.1 mm from bottom of port.
..:' l': j" i,'h
Fig. 9-~;alculated velocities at port outlet for different port geometries: (a) circular and (b) square.
may influence the propensity to generate sudden fluctua- tions, especially when accompanied by unsteady operating conditions such as start-up transients and changes in the casting speed. Further numerical analysis and experimental data are needed to quantify these issues.
H. Number of Ports
In attempting to alleviate problems related to nozzle per- formance, many innovative SEN designs have been sug- gested to improve the jet characteristics exiting from the ports. [5,1~ Increasing the effective port area and enhancing the effectiveness of the port edges in directing the jet are two possible criteria for SEN design. Sections IV-B and IV-C have shown that the jet tends to align itself closer with the port angles as the ports become thicker and shorter. The results of this work suggest that increasing the aspect ratio of port thickness (tp) to height (Hp) could improve the
Table IV. Jet Characteristics for Various Port Geometries Based on Three-Dimensional Simulations
Port Shape (rn s -1) (Deg) (Beg) (Beg)
Square (45 • 45 mm 2) 1.37 -23 0.27 1 5
Circular (51-mm ID*) 1.34 -25 0.20 1 8
*ID = inside diameter
effectiveness of the SEN in directing the flow (other factors remain constant). However, ports with oversized dimen- sions are widely used in casting plants because they have a high safety margin before total blockage of the SEN by inclusion buildup. One way to satisfy both of these requi- rements simultaneously is to employ more than two ports.
758--VOLUME 26B, AUGUST 1995 METALLURGICAL AND MATERIALS TRANSACTIONS B
I I
1.0 m/s i /
X <
...:::,,, i; "". "#l
(a) (b)
Fig. l ~ a l c u l a t e d velocities for various bottom designs: (a) recessed, (b) flat, and (c) pointed.
(c)
Table V. Mean Jet Characteristics for SEN Bottom Design Based on Two-Dimensional Simulations
Op Bottom Design 17 ~x i (Deg) (m s 1) (Deg)
flat 0.90 -23.8 0.06 - 15 pointed 0.95 -23.7 0.08
recessed 0.97 -24.0 0.12
flat 1.04 -6.0 0.10 +15 pointed 1.05 -5.6 0.12
recessed 0.99 - 10 0.12
Evidently, the four-port funnel SEN can control the jet direction more effectively than the standard two-port bifur- cated nozzle. It does not eliminate the recirculation zones at the port exits, and the 15 deg funnel angle is not enough to achieve equal flow through the top and bottom ports. However, the peak velocity at port exit is decreased from 1.6 m s -1 (standard two-port) to 1.2 m s -x (upper four-port) and 1.3 m s -~ (lower four-port). Success achieved in plant operations with four-port submerged entry nozzlest~31 might be attributed to the longer flotation time available in the mold for inclusions and bubbles at these lower velocities.
Uniformly distributing multiple ports around the nozzle perimeter has been experimentally investigated in the past. t121 The port angle of a multiport SEN is able to direct the flow more effectively than the port angle of a bifurcated SEN with the same total outlet area. However, these mul- tiport nozzles are more prone to generate meniscus turbu- lence because they direct some of their flow toward the nearby wide faces. Another feasible multiport SEN design is to place additional ports directly above the existing ports of a conventional bifurcated design. This was successfully implemented in plant operations by Saito. t131
Two-dimensional simulations were carried out for a four- port SEN. The port heights and thicknesses are 20 mm. The bore diameter is 120 mm at the inlet and 26 mm at the bottom, which gives the nozzle a funnel shape with a 15 deg funnel angle. Figures 1 l(a) and (b) illustrate the veloc- ity vector field and mean port exit parameters for - 15 deg and + 15 four-port funnel nozzles (only half the model is shown). Flow is seen to exit the lower ports at a slightly lower mean jet angle with higher effective area fraction than the upper ports. It is observed that 70 pct of the inlet mass flow rate exits from the lower port. The mean tur- bulence intensity is higher in the lower port than in the upper one.
V. EFFECT OF CASTING OPERATION VARIABLES
The amount of steel fed through the SEN and subse- quently into the mold is controlled by either a slide gate valve or a stopper rod (Figure 1). Flow patterns in the tun- dish and the position of the slide gate or stopper rod can greatly vary the inlet boundary conditions to the SEN. Wa- ter-modeling experiments and plant operations often en- counter surface turbulence and quality problems that have been associated with highly asymmetrical flow patterns at the outlet ports. These asymmetrical flows might be attrib- uted to high casting speed, asymmetric inlet conditions, and partial clogging of the SEN bore and ports. This section investigates the effects of operating practices on the flow through the SEN including inlet opening area, inlet flow angle, casting speed, port curvature, and size asymmetry caused by nozzle erosion and clogging. Simulations are per- formed on the full section through the SEN with the 2-D model and are based on the conditions given in Table I.
A. Restricted Inlet Opening Area
Flow control mechanisms, such as slide gates and stopper rods, are installed at the inlet of the nozzle tube and operate
METALLURGICAL AND MATERIALS TRANSACTIONS B VOLUME 26B, AUGUST 1995--759
^
0zx -- -14.9 ~
=0 .07
13 = 0.65
A
Ozx = -18.5 ~
=0 .10
[3 =0.89
til A Ozx = +12.0 ~
=0 .10
p = 0.65
^
Ozx = +9.6 ~
=0.18
=0 .74
(a) fb)
z ~ . 4 ~ x
Fig. 11--Velocity vector field of a four-port funnel nozzle: (a) 0p = - 1 5 deg and (b) 0, = +15 deg.
in a fully open or partially closed position according to the process requirements. To numerically model a restricted in- let, velocity is set to zero across a fraction of the inlet (referred to as the blockage ratio), while velocity is in- creased over the rest of the inlet to conserve the mass flow rate. The inlet boundary conditions are based on velocity profiles referred to as skewed and centered.
In the skewed configuration, flow is restricted to enter the SEN through only a fraction of the inlet from the right side. Figure 12(a) presents the calculated velocity vector field for a skewed inlet profile restricted to 50 pct of the nozzle bore diameter. Recirculation zones develop near the inlet inside the nozzle bore. This is potentially detrimental to the nozzle performance because nonmetallic inclusions tend to adhere more easily to the nozzle walls in separated flow regions and can lead to nozzle clogging.V41 Simula- tions undertaken with different blockage ratios of the inlet diameter show that the length of the upper recirculating zone extends farther inside the tube with increasing block- age of the inlet area.
Asymmetrical profiles in the velocity at the nozzle port exits are also induced as a result of the skewed inlet profile. Table VI summarizes the mean jet angles, the mass flow rate fractions, and the mean turbulence intensities from the right and left ports for different inlet blockage ratios. The flow leaving the left port has a shallower jet angle and a
higher mass flow rate as compared with the right port. It is interesting to note that the flow enters the nozzle from the right side but exits predominantly from the left port. The asymmetry in the flow exiting the ports is greatly accen- tuated with increasing port blockage. The high blockage ratio of 75 pct is commonly encountered in plant operations during casting slowdowns. For this extreme operating con- dition, twice as much flow exits the left port than the fight port. These trends agree qualitatively with the numerical simulations of W a n g [361 o n slide gate designs. The mean turbulence intensity is higher for the left port (where more flow discharges) and also increases with higher blockage ratios.
In the centered configuration, the flow is restricted to enter the SEN symmetrically through the center of the inlet. Figure 12(b) illustrates the velocity vector field with a 50 pet centered blockage ratio. As opposed to the skewed inlet, the flow exiting the ports is perfectly symmetrical and the recirculation zones near the inlet do not extend as far into the SEN tube. The jet characteristics are similar for both ports and match the results for the base conditions.
B. Inlet Angle
The effect of varying the inlet angle of the flow into the SEN was studied by introducing a velocity component in
760---VOLUME 26B, AUGUST 1995 METALLURGICAL AND MATERIALS TRANSACTIONS B
.0 m/s
Table VII. Effect of Inlet Flow Angle on Jet Characteristics
Blockage t~= Mass Flow (Pct) Ratio Inlet Angle Left Port Right Port Left Right (Pct) (Deg) (Deg) (Deg) Port Port
0 5 -20 -18 48 52 20 -22 -16 44 56
50 5 -20 -25 54 46 20 -24 -21 47 53
z
(a) (b)
Fig. 12~a lcu la ted velocities for various inlet conditions: (a) skewed with 50 pet blockage ratio and (b) centered with 50 pct blockage ratio.
Table VI. Effects of Blockage Ratio for Skewed Inlet Profiles on Jet Characteristics
Blockage 0= Mass Flow (Pct) ] Ratio Left Port Right Port Left Right Left Right (Pet) ( D e g ) (Deg) Port Port Port Port
Fig. 13~a lcu la t ed velocity vector for (a) 0z = 20 deg with no blockage and (b) 01 = 5 deg with 50 pct blockage ratio.
METALLURGICAL AND MATERIALS TRANSACTIONS B
the x direction (vx) to the inlet velocity. This could arise in the plant from nonsymmetric flow in the tundish or while passing through the slide gate. Two-dimensional simula- tions with inlet angles of 5 and 20 deg were perfgrmed. The inlet angle is measured in the clockwise direction from the positive z-axis.
Figure 13(a) shows the effect of an inlet angle of 20 deg on the velocity vector field with a fully opened inlet. It is seen that flow through the nozzle outlet ports is asymmet- rical. This is further evident from the jet characteristics summarized in Table VII. It is observed that the right port has a shallower mean jet angle ( -16 deg) than the left port ( -22 deg) and an increased mass rate (as indicated by the mass flow rate ratio between the right and left ports of 1.27). Furthermore, increasing the inlet angle tends to am- plify this effect, which enhance the mass rate through the right port. This is roughly equal and opposite to the effect of increasing the blockage ratio through a skewed, re- stricted inlet, which increases flow through the lef[ port. Thus, comparing Figures 12(a) and 13(a) reveals that the flow patterns exiting the ports are asymmetrical in a reverse manner. The corresponding mass flow rate ratio for the 0 deg inlet angle with 50 pct skewed blockage is 0.75.
Figure 13(b) displays the combined effect of a 5 deg angled inlet flow and 50 pct skewed blockage on the ve- locity vectors. The left port has only a slightly steeper mean jet angle ( -24 deg) than the right port,(-21 deg) and the mass flow rate ratio is 0.85. This is slightly more symmet- rical than the 50 pct blocked inlet with zero angle (Figure 12(a)). Thus, the flow asymmetry introduced by the 5 deg inlet angle has partly compensated the skewed inlet profile. This is significant because the actual slide gate geometry (modeled by Wang t361) appears to introduce both the block- age and the inlet angle. It is evident from the current sim- ulations that small variations in the inlet conditions to the SEN, especially those that vary the inlet angle, can produce large differences in the jet characteristics and asymmetry at the outlet ports.
DawsonV4J conducted experiments on fully open round nozzles with tilted inlet flow angles and has shown the pres- ence of flow separation near the top of the SEN. This sep- aration zone was observed to expand with increasing tilt angle. In the current study, this presence of a separation zone was observed with partly blocked nozzles but could not be captured with a fully opened inlet. The disagreement of the mathematical model with these experiments might be attributed to the two-dimensionality assumption, an in- complete priming of the nozzle tube, differences in the inlet boundary conditions, or deficiencies in the K-e turbulence model.
Periodic variations in the SEN inlet conditions, such as
VOLUME 26B, AUGUST 1995--761
those caused by slide gate movement, could be associated with flow instabilities at the steel surface in the mold. Downstream flow instabilities are more likely when small disturbances in the inlet conditions grow and are sustained at the outlet. Based on current simulations, these instabili- ties are more prone to develop for the partly blocked inlet. However, many other potential factors likely interact with these inlet effects to induce the observed surface turbulence phenomena. These factors include flow instabilities in the mold, the effects of argon gas, and the inherent dynamic nature of turbulent flow in both the SEN and the mold. These phenomena remain to be investigated.
C. Port Curvature
Nozzle erosion and inclusion buildup are problems com- monly encountered during casting. They ultimately lead to
p o o r nozzle performance and corresponding quality and production losses. To simulate erosion of the port walls and inclusion buildup, a smooth curve is introduced along the upper edge of the outlet ports. The curvature chosen is typ- ical of that observed in partially clogged nozzle ports. Fig- ure 14(a) shows the velocity vector field for a 90-mm port height. The effective area fraction increases to 0.72, as compared with 0.65 for the standard SEN. As discussed in Section IV-A, the jet angle is not influenced by the cur- vature of the top edge when a large recirculation zone is present.is]
The velocity vectors are plotted in Figure 14(b) for a curved port with a 53-mm height. In this case, the flow does not separate from the top comer, and the full area of the port is effectively used (/3 = 1). Smooth curved surfaces delay (Figure 14(a)) or eliminate (Figure 14(b)) the flow separation from the tube walls by decreasing the adverse pressure gradient. Preventing the formation of the recircu- lation region near the top edge of the port should be ben- eficial by reducing inclusion buildup, transient surging, and suction of mold fluid back inside the nozzle port.
D. Asymmetrical Port Size
The SEN is designed for steel casting applications, with the combined area of the ports being larger than bore area. This is done to reduce the flow restriction caused by the ports and to accommodate some inclusion buildup in the port without affecting the flow of molten steel into the mold. However, the current study has showed that over- sized ports decrease the effective area fraction and cause the formation of a detrimental low-velocity recirculation zone (Figure 4). This may contribute to inclusion buildup in the upper port edge. When the inclusion buildup occurs at a faster rate on one port than the other, the effective outlet area of the two ports differs.
Simulations were conducted to model the asymmetrical clogging effect, first by considering unequally sized ports; the left port height was decreased to 81 mm and the right port height was increased to 99 mm. It was observed that the jet characteristics were very similar for the two ports, since only the top recirculation zone was affected. [25] Water- modeling experiments have reported increased surface tur- bulence problems associated with unequally sized ports. Current model results suggest that differences in port size
o . - �9 " .oo . ' l i - . . ' f l
l;;,,:; '///, j;:,JT/?/h
x i I i I
1.0 m/s
! !:
(a) (b)
Fig. 14~Ca lcu la t ed velocities for (a) H e = 90 mrn with curved upper edge and (b) H e = 53 mm with curved upper edge.
are only important when the effective area fraction is af- fected, which occurs for small ports or large changes in port size.
Next, the effects of more severe clogging of a 53-mm left port are investigated with square and curved upper edges. The height of the right port is 90 ram. Figures 15(a) and (b) present the velocity vectors for the square and curved edges, respectively. The mean jet angle is computed to be -16 deg from the clogged left port with a sharp square comer and -21 deg from the right port (Figure 15(a)). The mass flow ratio between the right and left ports is 1.19. For the clogged port with a curved comer (Figure 15(b)), the flow separation region is eliminated inside the left port. The mean jet angle is -23 deg from the left port and -17 deg from the right port, and the mass flow rate ratio is 0.81. Hence, it is evident that the flow asymmetry has ben switched between the configurations in Figures 15(a) and (b). This occurred because the flow did not sep- arate from the top edge of the curved port, so the effective area fraction increased which resulted in increased flow rate. This finding suggests that the curvature of the upper edge of the port is a very important variable influencing the flow, which may be affected by both the initial design and the operating conditions, such as erosion and inclusion buildup.
E. Casting Speed
The present model predicts that increasing the casting speed does not modify the mean jet angle, spread angle, or the effective area fraction, but does increase the mean jet speed and the mean turbulent kinetic energy. This empha- sizes that the simulated flow is fully developed and turbu- lent and should not depend greatly on the Reynolds number. Experiments, such as those conducted by Mc- Pherson,t~J show that high surface turbulence and quality problems accompany increased casting speed. To avoid these problems, SEN ports can be angled at a steeper down- ward angle during high-speed casting. The present model results indicate that these problems are not associated with
762--VOLUME 26B, AUGUST 1995 METALLURGICAL AND MATERIALS TRANSACTIONS B
. . . . . ::~/ : : . - - : : , t
(a)
1.0 m/,'
Z
(b)
Fig. 15--Calculated flow field in the port area with nontmiform port openings: (a) sharp upper comer and (b) curved upper comer.
changes in the mean jet angle leaving the nozzle but instead arise from increased turbulence, flow dynamics in the mold cavity, reduced time for inclusion flotation, or transient ef- fects and other phenomena not considered by the model.
F. Discussion
Sudden changes in the jet characteristics during operation probably increase the likelihood of detrimental surface waves and transient flow conditions. Asymmetry in the time-mean velocities between the left and right ports is a likely source of potential sudden changes, which could be driven by the slide gate position (among other factors). Be- cause the slide gate opening position varies with the casting speed, sudden variations in the casting speed are likely to prompt surges and level fluctuations due to the fluid mo- mentum changes leaving the nozzle. This suggests that changes in casting speed should be gradual to control changes in flow asymmetry at the nozzle outlet. Based on the present results, symmetrical flow control devices, such as stopper rods or concentric disks, would be expected to show less susceptibility to flow instabilities from this cause.
VI. SUMMARY
A finite-element model has been developed to investigate the steady turbulent fluid flow in submerged-entry nozzles using FIDAP. These nozzles are primarily designed to con- trol liquid steel flow inside the continuous casting mold for producing steel slabs. Numerical simulations offer a useful tool to complement water-modeling experiments in order to improve the understanding of nozzle performance. The model has been used to gain insights into the effects of a variety of design and process parameters on flow leaving a bifurcated SEN.
1. The angle of the bottom of the port is the most influ- ential variable-controlling jet angle entering the mold, although the jet always leaves at a steeper downward angle than the SEN port angle.
2. The mean jet angle conforms more closely to the port angle when the effective area fraction is large, making the recirculation region at the top of the port smaller.
3. Shorter, thicker, and narrower ports (relative to the nozzle bore area) force the flow to conform more closely to the shape of the port walls. This increases the influence of the port angle, producing shallower jet angles, higher velocities, smaller spread angles, in- creased turbulence intensity, less swirling flow, and higher effective area fractions.
4. Increasing the port side dispersion angle from 0 to 10 deg increases the mean horizontal spread angle of the jet from 1 to 5 deg.
5. Round ports increase the swirling component of the jet relative to square ports, as indicated by the maximum spread angle. Swirl also appears to increase with port area.
6. A four-port, funnel-shaped SEN produces shallower jet angles, lower peak velocities, and a greater effective area fraction, as compared with the standard bifurcated nozzle.
7. Port curvature promotes a smoother transition from the nozzle tube to the port regions, which consequently increases the effective area fraction and reduces both the peak velocities and the detrimental recirculation zone.
8. A recirculation zone appears at the top of the port (ef- fective area fraction less than 1), unless the combined area of both ports is smaller than the bore area or the port edges are curved.
9. Upstream flow disturbances at the SEN inlet, such as
METALLURGICAL AND MATERIALS TRANSACTIONS B VOLUME 26B, AUGUST 1995--763
those caused by a sliding gate flow controller, generate flow asymmetry at the outlet ports. This asymmetry could be effectively controlled with a centered, sym- metrical flow-control mechanism.
10. Significant flow asymmetry is achieved by either blocking part of the inlet area or directing the flow through the inlet at an angle. Each effect decreases the mass flow and increases jet angle at one port with cor- responding opposite change at the other port. The ef- fects may partly cancel each other. Varying the relative port size or the curvature of the upper port walls in- duces similar asymmetric effects.
11. Casting speed increases only the jet speed and the tur- bulence levels; it does not affect the jet angle or any other characteristic of the jet.
VII. CONCLUSIONS
This article quantifies the effects of different nozzle shape and casting conditions on the time-averaged flow conditions exiting a bifurcated SEN, using 2-D and 3-D turbulent fluid flow models. The mathematical models pre- dict the mass flow rates, jet angles, spread angles, and ve- locities for each configuration, including the extent of recirculation and flow asymmetry at the port outlet. These results are necessary as input to enhance models investi- gating flow-related behavior in the mold pool. They can also be used to design a nozzle to deliver steel into the mold cavity at a desired angle and flow condition, if these flow criteria are known.
This work represents a critical first step toward a system- atic approach to the design of submerged-entry nozzles for the improvement of the productivity and quality of the con- tinuous casting of steel slabs. Additional work must be done, however, before this goal can be achieved. Several additional phenomena remain to be investigated in the noz- zle, including the effects of nonuniform argon gas bubble injection, incomplete filling of the nozzle, heat transfer, and the transient nature of the turbulent flow as well as inclu- sion buildup and clogging. Next, sophisticated models of flow behavior in the mold cavity are needed to determine how the conditions at the nozzle exit affect important phe- nomena, such as the transport of gas bubbles, solid inclu- sion particles, superheat and turbulence to the solidifying steel shell, dynamic sloshing and wave behavior, and in- teraction with and entrainment of the liquid slag layer. This work presents many challenges for future mathematical models. The results must still be interpreted, with the help of experimental studies, to quantify how these flow phe- nomena generate steel quality problems. Criteria must be established to relate the jet characteristics at nozzle exit to steel quality before a nozzle can be optimized to control flow in a given continuous casting operation.
Finally, SEN design criteria involve several other im- portant considerations in addition to flow control. These include wear resistance to withstand the corrosive steel- slag-ceramic interface, thermal shock resistance to avoid catastrophic fracture (especially during start-up transients), low porosity to avoid air aspiration and resistance to clog- ging, and low cost. Meeting all of these demands simulta- neously makes the SEN design one of modem casting technology's greatest challenges.
A C K N O W L E D G M E N T S
The authors wish to thank ARMCO Inc., Inland Steel, BHP, LTV Steel, and NSF (Grant 8957195-PYI), whose support made this research possible. Thanks are also due to NCSA for the provision of time on the CRAY-2 supercom- puter and to Fluid Dynamics Inc. for the FIDAP program.
REFERENCES
1. I.I.S. Institute: in Percentage of crude steel continuously cast, 1981- 1990, 1991, vol. 18 (13), 16.
2. H. Nakato, M. Ozawa, K. Kinoshita, Y. Habu, and T. Emi: Trans. Iron Steel Inst. Jpn, 1984, vol. 24 (11), pp. 957~5.
3. J. Herbertson, O.L. He, P.J. Flint, and R.B. Mahapatra: in 74th Steelmala'ng Conference, Iron Steel Soc, Warrendale, PA, 1991, pp. 171-85.
4. A.K. Das, A.S. Mukherjee, and A. Chatterjee: Trans. Ind. Inst. Met., 1984, vol. 37 (4), pp. 383-91.
5. A. Ferretti, M. Podrini, and G. Di Schino: in 68th Steelmaking Conference, Iron Steel Soc, Warrendale, PA, 1985, vol. 68, pp. 49- 57.
6. L.J. Heaslip, A. McLean, and I.D. Somrnerville: in Continuous Cast, Edwards Brothers, Inc., AnnArbor, MI, 1983, vol. 1, pp. 93-98.
7. E. Hoflken, H. Lax, and G. Pietzko: 4th Int. Conf. Continuous Casting Stahleisen, Duesseldorf, Germany, 1988, vol. 2, pp. 461-73.
8. N.A. McPherson: 68th Steelmaking Proceedings, Iron Steel Soc, Warrendale, PA, 1985, vol. 68, pp. 49-57.
9. R. Sobolewski and D.J. Hurtuk: Proc. 2nd Process Technology Conf., Iron Steel Soc, Warrendale, PA, 1982, vol. 2, pp. 160-65.
10. M.-C. Tai, C.-H. Chen, and C.-L. Chou: Continuous Cast., 1985, pp. 19.1-19.6.
11. W. Tianxiu: Steel Iron, 1984, vol. 19 (7), pp. 46-52. 12. N.T. Mills and L.F. Barnhardt: Continuous Cast., 1983, vol. 1, pp.
85-92. 13. K. Saito, H. Nakato, H. Yamasaki, N. Bessho, T. Fujii, T. Nozaki,
and Y. Oguchi: Proc. 9th Process Technology Conf., Iron Steel Soc, Warrendale, PA, 1990, vol. 9, pp. 153-63.
14. S. Dawson: in 73rd Steelmaking Conference, Iron Steel Soc Warrendale, PA, 1990, pp. 15-31.
15. D. Gupta and A.K. Lahiri: Steel Res., 1992, vol. 63 (5), pp. 201-04. 16. T. Honeyands, J. Lucas, J. Chambers, and J. Herberston: 75th
Steelmaking Conference Iron Steel Soc, Warrendale, PA, 1992, pp. 451 59.
17. B.G. Thomas, L.M. Mika, and F.M. Najjar: Metall, Trans. B, 1990, vol. 21B, pp. 387-400.
18. B.G. Thomas and F.M. Najjar: ApplMath. Model., 1991, vol. 15, pp. 226-43.
19. F.M. Najjar: M.S. Thesis, University of Illinois, Urbana, IL, 1990. 20. S. Hintikka, J. Konttinen, K. Leiviska, and M. Tolvanen: 75th
Steelmaking Conference, Iron Steel Soc, Warrendale, PA, 1992, pp. 88741.
21. Y.H. Wang: Proc. lOth Process Technology Conf., Iron Steel Soc., Warrendale, PA, 1992, pp. 271-78.
22. D.E. Hershey, B.G. Thomas, and F.M. Najjar: Int. J. Num. Meth. Fluids, 1993, vol. 17, pp. 23-47.
23. X. Huang, B.G. Thomas, and F.M. Najjar: Metall. Trans. B, 1992, vol. 23B, pp. 339-56.
24. P.J. Flint: 73rd Steelmala'ng Conference, Iron Steel Soc Warrendale, PA, 1990, vol. 73, pp. 481-90.
25. D.E. Hershey: M.S. Thesis, University of Illinois, Urbana, IL, 1992. 26. B.E. Launder and D.B. Spalding: Mathematical Models of
Turbulence, Academic Press, New York, NY, 1972. 27. M.S. Engleman: FIDAP Manual, Fluid Dynamics International, Inc.,
Evanston, IL, 1991. 28. J.L. Sohn: Int. J. Num. Meth. Fluids, 1988, vol. 8, pp. 1469-90. 29. H. Schlichting: Boundary-Layer Theory, 7th ed., McGraw Hill, Inc.,
New York, NY, 1955. 30. J. Nikuradse: Forsehg. Arb. lng. Wed., 1932, vol. 356. 31. W. Rodi: Turbulence Models and Their Application in Hydraulics--
A State of the Art Review, University of Karlsruhe, Karlsruhe, Germany, 1980.
32. B.E. Launder and D.B. Spalding: Comp. Meth. Appl. Mech. Eng., 1974, vol. 13, pp. 269-89.
764--VOLUME 26B, AUGUST 1995 METALLURGICAL AND MATER/ALS TRANSACTIONS B
33. V. Haroutunian and M.S. Engelman: Technical Report, Fluid Dynamics International, Inc., Evanston, IL, 1989.
34. J. Kubota, K. Okimoto, A. Shirayama, and H. Murakami: in Mold Operation for Quality and Productivity, A.W. Cramb and E. Szekeres, eds., Iron Steel Soc, Warrendale, PA, 1991, pp. t97-205.
35. J.Y. Lamant, M. Larrecq, A. Mouchette, Y. Codur, J. Gancarz, and A. Leclercq: 6th Int. Iron and Steel Congress, Iron Steel Inst. Japan, Tokyo, Japan, 1990, vol. 3, pp. 317-24.
36. Y.H. Wang: 73rd Steelmaking Conference, Iron Steel Soc, Warrendale, PA, 1990, vol. 73, pp. 473-80.
METALLURGICAL AND MATERIALS TRANSACTIONS B VOLUME 26B, AUGUST 1995--765