Journal of Advanced Research in Fluid Mechanics and Thermal Sciences 43, Issue 1 (2018) 149-157
149
Journal of Advanced Research in Fluid
Mechanics and Thermal Sciences
Journal homepage: www.akademiabaru.com/arfmts.html
ISSN: 2289-7879
Numerical Study of the Entrance Effects in an Oscillatory Flow
of a Standing-Wave Thermoacoustics
Siti Hajar Adni Mustaffa1, Fatimah Al-Zahrah Mohd Saat
1,2,∗, Ernie Mattokit
1
1 Faculty of Mechanical Engineering Universiti Teknikal Malaysia Melaka, Hang Tuah Jaya, 76100 Durian Tunggal, Melaka, Malaysia
2 Centre of Advanced Research on Energy, Universiti Teknikal Malaysia Melaka, Hang Tuah Jaya, 76100 Durian Tunggal, Melaka, Malaysia
ARTICLE INFO ABSTRACT
Article history:
Received 5 February 2018
Received in revised form 6 March 2018
Accepted 7 March 2018
Available online 24 March 2018
Entrance effect and formation of the vortex structure play a vital role in
understanding the flow physics at the channel entry especially in oscillatory flow
inside the channel between thermoacoustic stack plates. The aims of the current
study are to investigate the effect of flow frequency on the structure of the vortex
shedding at the end of the stack plates and also the effect of the vortex formation at
the end of the plates associated with “entrance effect”. The methods used are CFD
simulation with ANSYS FLUENT as a solver. The flow was solved using laminar model
and two-equation Shear-Stress Transport (SST) k-ω turbulence model. The “entrance
effect” and vortex flow phenomena has been studied for two drive ratios, DR
(defined as ratio of maximum pressure amplitude to mean pressure) which are 0.65%
and 1.0% at two frequencies of 13.1 Hz and 23.1 Hz. The results shows that at higher
frequency, the entrance length becomes shorter. This can be emphasized that flow
frequency plays a significant role as it affected the entrance length and vortex
formation and structure of the flow.
Keywords:
Oscillatory flow, entrance region,
turbulence, standing-wave,
thermoacoustics Copyright © 2018 PENERBIT AKADEMIA BARU - All rights reserved
1. Introduction
Since the breakthrough of potential energy in sound which was made by Byron Higgins in 1777,
who first observed the heat induced acoustic oscillations, many researchers have now turn their
interest into a technology called thermoacoustics. Thermoacoustics is a technology that can be
used to produce power or energy system by harnessing energy from sound. The basis of
thermoacoustic principle is an interaction between sound wave and solid surface inside an
environment which at the correct setting would produce either power (heat engine) or cooling
effect (refrigerator). This technology offers an alternative green technologies due to the lack of
moving parts in the thermodynamic process, which makes them simple, reliable and low cost [1].
Examples of thermoacoustics systems may be found in [2-4]. In thermoacoustics, the flow that
govern the system are called oscillatory flow. Oscillatory flow is a cyclic flow where the fluid is
∗ Corresponding author.
E-mail address: [email protected] (Fatimah Al-Zahrah Mohd Sa'at)
Penerbit
Akademia Baru
Open
Access
Journal of Advanced Research in Fluid Mechanics and Thermal Sciences
Volume 43, Issue 1 (2018) 149-157
150
Penerbit
Akademia Baru
flowing in bidirectional ways as it moves in forward and reverse directions. The unique behaviour of
flows require special attention because the fluid dynamics phenomena such as turbulence [5,6],
vortex shedding [7,8], thermal-driven flow [9,10], friction losses [11] and streaming [12] are not
behaving exactly the same as the conventional unidirectional flow. For instance, modelling
turbulence in the conventional unidirectional flow in itself is already a challenge when new fluids
(i.e. nanofluids) are used in the system [13,14]. This condition could be complicated further should
the newly introduced fluids are used in systems with oscillatory flow.
The oscillation of flow into and out of any channel could also alters the fluid behaviour in that
channel. The development of the flow at the channel entry, which is also known as “entrance
effects”, associated with turbulent transition has become a subject of study in thermoacoustics as it
affects the behaviour of the oscillatory flow caused by discontinuities of the cross-sectional area of
the important components of the system such as stacks, regenerators and heat exchangers.
Yamanaka et al., [15] defined the “entrance effect” for unidirectional pipe flow and it is described
as the region where the transition from a uniform velocity profile to the fully developed profile
takes place. In unidirectional flow, the entrance effect is very much relying on the velocity that
represents the speed of flow. In thermoacoustics, the fluid flows is bidirectional. An important
parameter that is often used in representing thermoacoustic’s amplitude of flow is known as a drive
ratio, DR. The drive ratio is defined as a ratio of maximum pressure amplitude to the mean
pressure. Jaworski and his co-worker [16] studied vortex formation and shedding and also the
“entrance length” during the suction phase; when the fluid enters the channel from outside using
the combination of experimental data obtained from PIV and CFD solutions. They defined the
equation for “entrance length” as a function of time (or phase), as follows:
refnutouttLu 01.0),,(),0),(( =∞− (1)
where n is a “tolerance number” and refu is a reference velocity. They revealed the “entrance
length”, in normalised term, as equal to 2.29 (based on equation (1)). Equation (1) was derived
based on results taken at the DR = 0.3%, for the plate thickness = 5 mm and plate spacing = 10 mm.
However, their studies only reported the entrance length at DR = 0.3%. The flow at DR = 0.3% may
be treated as laminar. Earlier investigation have reported that turbulence may starts at drive ratio
as early as 0.45%. Turbulence may alters the entrance region and therefore further investigations
are needed here.
In the classical fluid dynamics analysis of unidirectional flow inside a pipe, entrance length
equation was defined based on whether the flow is laminar or turbulence. These two conditions of
“entrance region” are described in equations (2) and (3) [17]:
hL (laminar) DRe05.0≈ (2)
hL (turbulent) D10≈ (3)
The terms Re and D in equations (2) and (3) are the Reynolds number and the diameter of the
pipe. The diameter is the characteristic length that represents the hydraulic diameter for pipe.
Depending on the type of flow, equations (2) and (3) may be used to estimate entrance length for
flow inside an object/channel/pipe.
The motivation for current study is to understand the behaviour of oscillatory flow at higher
drive ratios and the “entrance effects” related to that conditions. Entrance effect was quite
established for unidirectional flow. However, as fluid flows in bi-directional, the entrance effect
Journal of Advanced Research in Fluid Mechanics and Thermal Sciences
Volume 43, Issue 1 (2018) 149-157
151
Penerbit
Akademia Baru
may be altered. In oscillatory flow, the study of entrance effect was reported in [16] but that was
only for one drive ratio that represents laminar condition. The results reported in this paper is an
extension of study that involves higher drive ratios and an increase of flow frequency.
2. Methodology
In the current numerical study, two-dimensional (2D) computational domain is developed using
ANSYS FLUENT software based on the experimental rig built at Universiti Teknikal Malaysia Melaka
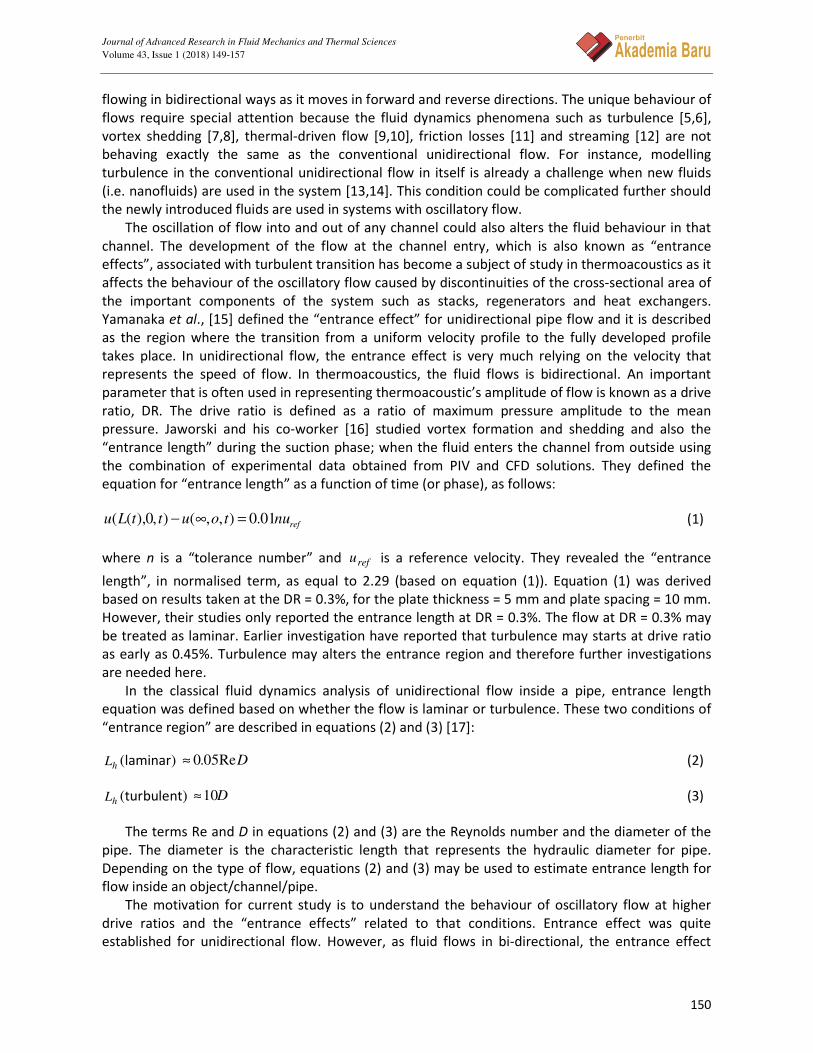
[18]. Figure 1 shows the computational domain, the enlarge view of the stack area and the
definition of phases in one flow cycle. The computational domain was built at 600 mm length and
144.4 mm width as shown on top of Figure 1. A larger view of the parallel-plates stack (only 3 plates
shown) was also shown in Figure 1. Each plate is 3.0 mm thick (d), 200 mm long (l) and the plates
are evenly-spaced with gap between each plate, D = 6 mm. The plates are made of Aluminium. In
standing-wave thermoacoustic systems, the stack is placed at 0.17λ from the pressure antinode at
the end of the resonator so that a better thermoacoustic effect can be gained.
Fig. 1. Schematic diagram of the computational domain (top)
the enlarge view of geometry of the stack (middle, with only
three plates shown as illustration) and the oscillatory flow
defined in twenty phases (bottom)
In this study, the models has been solved for two flow frequencies of 13.1 Hz and 23.1 Hz. The
wavelength depends on frequency so does the stack’s location. Hence for a fair comparison
between studies, the stack has been placed both at 0.17λ which corresponds to the distance of 4.5
m and 2.6 m from the pressure antinode for frequencies of 13.1 Hz and 23.1 Hz, respectively. At
this two locations, the flow amplitude within the quarter standing wavelength resonator are
theoretically the same. As for requirement for standing-wave thermoacoustic systems, the pressure
and velocity was set 90° out of phase. The mean pressure was set to 0.1 MPa. The working medium
is air at atmospheric pressure and room temperature and was modelled as an ideal gas. Data are
recorded in 20 phases (φ1 to φ20) of a flow cycle as illustrated at the bottom of Figure 1. The first ten
phases (φ1 to φ10) represent forward direction of flow while the last ten phases (φ11 to φ20)
represent the reversed flow.
Journal of Advanced Research in Fluid Mechanics and Thermal Sciences
Volume 43, Issue 1 (2018) 149-157
152
Penerbit
Akademia Baru
The flow was modelled using Navier-Stokes equation for laminar model and Reynolds-averaged
Navier-Stokes (RANS) equation for turbulence model [19]. The RANS turbulence model chosen in
this study is a two-equation Shear Stress Transport (SST) k-ω turbulence model as suggested in [6].
The unsteady models were solved using a time step size of 1/1200f and each solution was
monitored until convergence takes place at every time step. The pressure-based solver with the
applications of Pressure-Implicit with Splitting Operators (PISO) scheme for the pressure-velocity
coupling was selected. The PISO scheme was chosen because it provides faster convergence for
unsteady flow cases.
Table 1 shows the boundary conditions for cases reported in this work. The boundary
conditions were calculated using lossless equations of quarter-wavelength device [6]. As shown in
Figure 1, oscillating pressure, P1, is placed at the inlet, at x1 location, while oscillating mass flux, m’2,
is placed at the outlet, at x2 location. For turbulence model, additional parameters such as turbulent
intensity, 8/1(Re)16.0
−=I and turbulent length scale, D07.0=l are assigned at the boundaries. The
Reynolds number, defined as vUD /Re ρ= , where ρ is a density, U is a velocity, D is a gap spacing
between plate and v is a viscosity. The velocity, U, was obtained from theoretical calculations for
both frequencies.
Table 1
Boundary conditions
Frequency,
f (Hz)
Drive ratio, DR
(%)
Oscillating pressure,
P1 (Pa)
Oscillating mass
flux, m’2 (kg/m2)
13.1
23.1
0.65
1.0
0.65
1.0
351.68
541.03
370.22
569.57
1.7084
2.6284
1.7619
2.7107
The model has been tested at three different grid sizes which are 59880, 78780 and 97680 cell
counts. The type of meshing used in this study is quadrilateral structured mesh. As shown in Figure
1, the mesh was made denser near the plate’s surface to capture boundary layer effects. The
quadrilateral mesh was designed with a growth ratio of 1.2. The smallest mesh was recorded with
the size of 0.21 mm. It was found that 78780 number of cell counts (corresponding to a 98.0=+y ) is
sufficient enough to solve the flow solutions. The quality mesh can also be presented in terms of
orthogonal quality (close to one for good quality) and skewness factors (close to zero for good
quality). The minimum orthogonal quality for the current model is 0.95 and the maximum skewness
is 101031.1
−× , which show that the mesh is in good quality conditions. Data are processed after
steady oscillatory flow condition is achieved (i.e. oscillating pressure and velocity are not changing
with oscillation cycle).
3. Results and Discussion
3.1 Validation with Experimental Data
The values of axial velocity, Ue (m/s), at the location 4d (where d is a thickness of the plate as
shown in Figure 1) has been obtained from numerical models. The data has been validated with
theoretical and experimental data at the same exact location. The experimental data was collected
using experimental rig reported in [18] and the theoretical solution was based on the the Rott’s
linear equation [20]. The porosity (defined as the cross-sectional area of the stack occupied by the
plates over the cross-sectional area of the resonator) at the location of 4d where axial velocity, Ue
Journal of Advanced Research in Fluid Mechanics and Thermal Sciences
Volume 43, Issue 1 (2018) 149-157
153
Penerbit
Akademia Baru
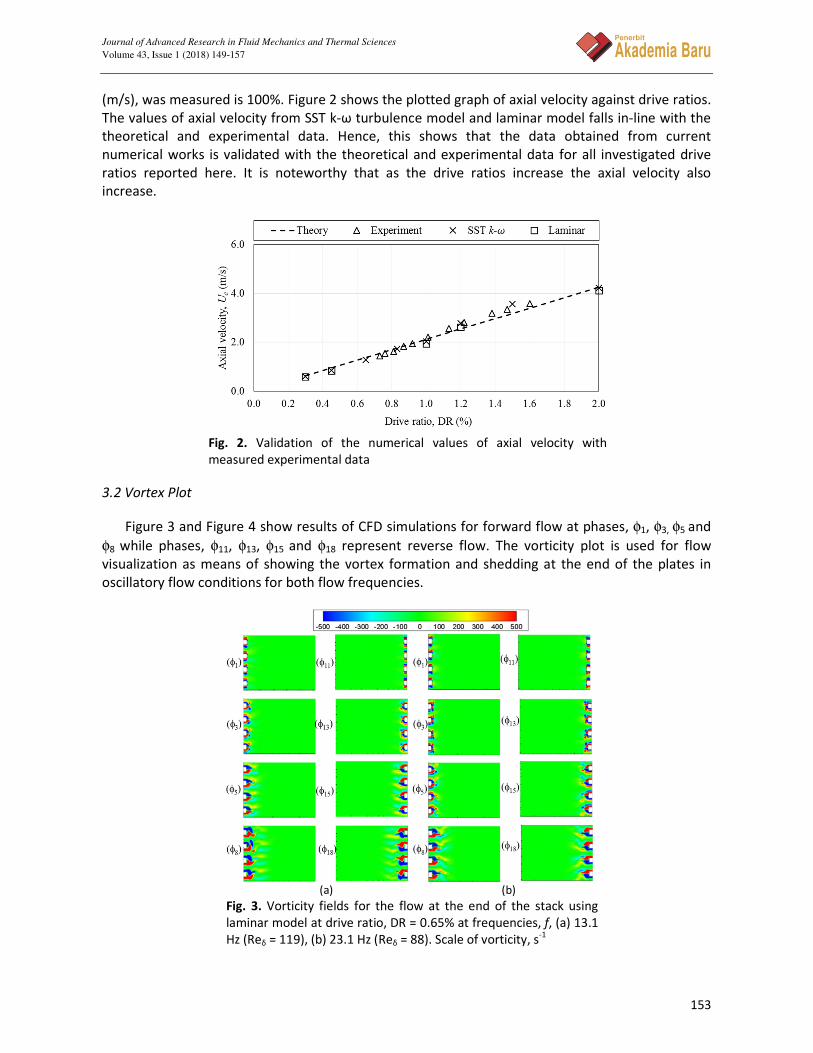
(m/s), was measured is 100%. Figure 2 shows the plotted graph of axial velocity against drive ratios.
The values of axial velocity from SST k-ω turbulence model and laminar model falls in-line with the
theoretical and experimental data. Hence, this shows that the data obtained from current
numerical works is validated with the theoretical and experimental data for all investigated drive
ratios reported here. It is noteworthy that as the drive ratios increase the axial velocity also
increase.
Fig. 2. Validation of the numerical values of axial velocity with
measured experimental data
3.2 Vortex Plot
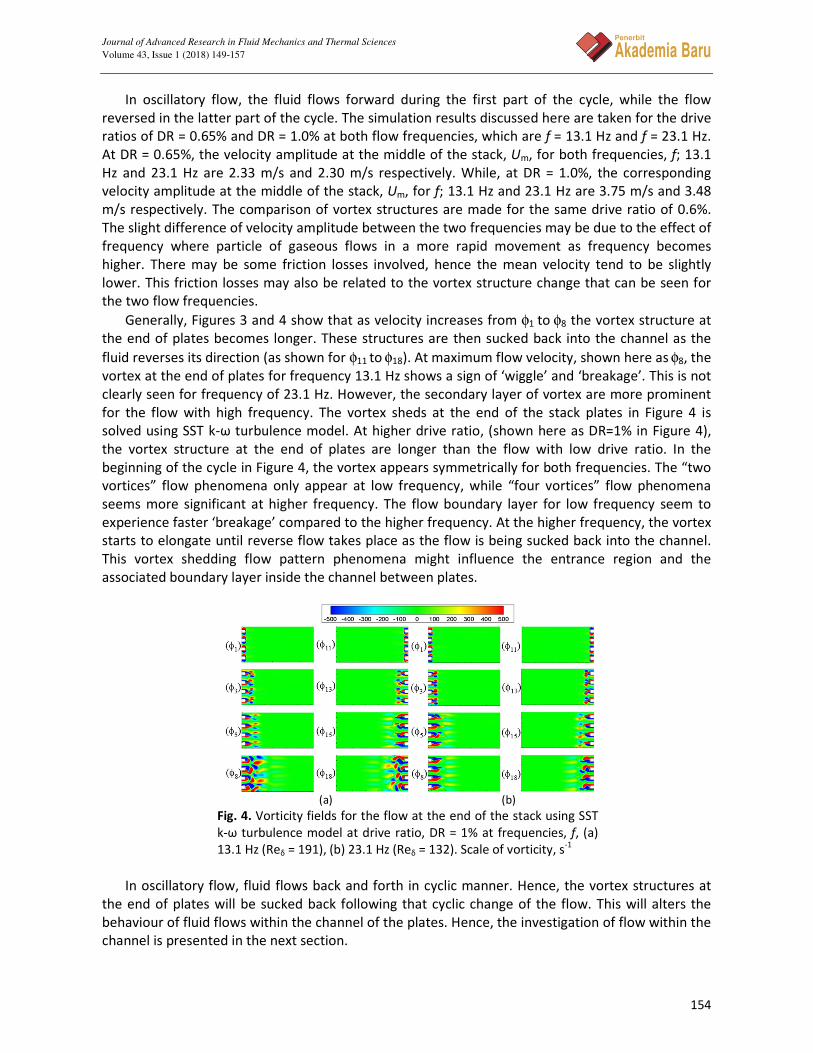
Figure 3 and Figure 4 show results of CFD simulations for forward flow at phases, φ1, φ3, φ5 and
φ8 while phases, φ11, φ13, φ15 and φ18 represent reverse flow. The vorticity plot is used for flow
visualization as means of showing the vortex formation and shedding at the end of the plates in
oscillatory flow conditions for both flow frequencies.
(a) (b)
Fig. 3. Vorticity fields for the flow at the end of the stack using
laminar model at drive ratio, DR = 0.65% at frequencies, f, (a) 13.1
Hz (Reδ = 119), (b) 23.1 Hz (Reδ = 88). Scale of vorticity, s-1
Journal of Advanced Research in Fluid Mechanics and Thermal Sciences
Volume 43, Issue 1 (2018) 149-157
154
Penerbit
Akademia Baru
In oscillatory flow, the fluid flows forward during the first part of the cycle, while the flow
reversed in the latter part of the cycle. The simulation results discussed here are taken for the drive
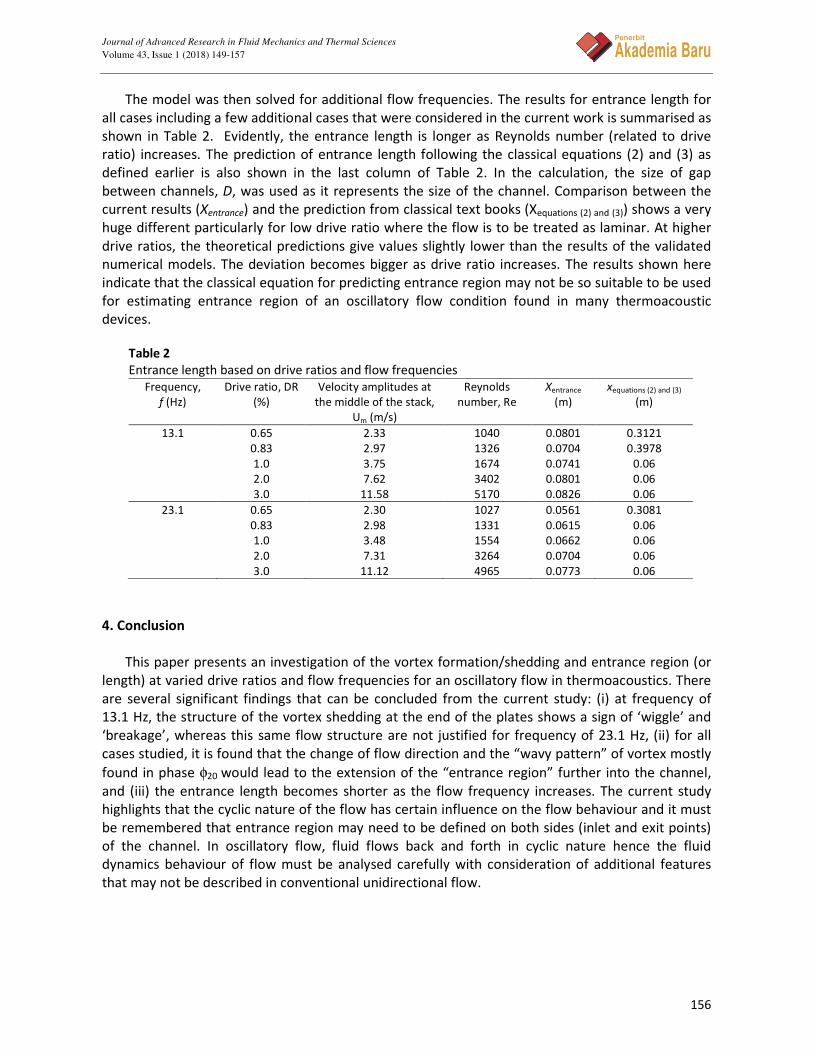
ratios of DR = 0.65% and DR = 1.0% at both flow frequencies, which are f = 13.1 Hz and f = 23.1 Hz.
At DR = 0.65%, the velocity amplitude at the middle of the stack, Um, for both frequencies, f; 13.1
Hz and 23.1 Hz are 2.33 m/s and 2.30 m/s respectively. While, at DR = 1.0%, the corresponding
velocity amplitude at the middle of the stack, Um, for f; 13.1 Hz and 23.1 Hz are 3.75 m/s and 3.48
m/s respectively. The comparison of vortex structures are made for the same drive ratio of 0.6%.
The slight difference of velocity amplitude between the two frequencies may be due to the effect of
frequency where particle of gaseous flows in a more rapid movement as frequency becomes
higher. There may be some friction losses involved, hence the mean velocity tend to be slightly
lower. This friction losses may also be related to the vortex structure change that can be seen for
the two flow frequencies.
Generally, Figures 3 and 4 show that as velocity increases from φ1 to φ8 the vortex structure at
the end of plates becomes longer. These structures are then sucked back into the channel as the
fluid reverses its direction (as shown for φ11 to φ18). At maximum flow velocity, shown here as φ8, the
vortex at the end of plates for frequency 13.1 Hz shows a sign of ‘wiggle’ and ‘breakage’. This is not
clearly seen for frequency of 23.1 Hz. However, the secondary layer of vortex are more prominent
for the flow with high frequency. The vortex sheds at the end of the stack plates in Figure 4 is
solved using SST k-ω turbulence model. At higher drive ratio, (shown here as DR=1% in Figure 4),
the vortex structure at the end of plates are longer than the flow with low drive ratio. In the
beginning of the cycle in Figure 4, the vortex appears symmetrically for both frequencies. The “two
vortices” flow phenomena only appear at low frequency, while “four vortices” flow phenomena
seems more significant at higher frequency. The flow boundary layer for low frequency seem to
experience faster ‘breakage’ compared to the higher frequency. At the higher frequency, the vortex
starts to elongate until reverse flow takes place as the flow is being sucked back into the channel.
This vortex shedding flow pattern phenomena might influence the entrance region and the
associated boundary layer inside the channel between plates.
(a) (b)
Fig. 4. Vorticity fields for the flow at the end of the stack using SST
k-ω turbulence model at drive ratio, DR = 1% at frequencies, f, (a)
13.1 Hz (Reδ = 191), (b) 23.1 Hz (Reδ = 132). Scale of vorticity, s-1
In oscillatory flow, fluid flows back and forth in cyclic manner. Hence, the vortex structures at
the end of plates will be sucked back following that cyclic change of the flow. This will alters the
behaviour of fluid flows within the channel of the plates. Hence, the investigation of flow within the
channel is presented in the next section.
Journal of Advanced Research in Fluid Mechanics and Thermal Sciences
Volume 43, Issue 1 (2018) 149-157
155
Penerbit
Akademia Baru
3.3 Entrance Region
The “entrance region/ length” is a region (or length) where the velocity profile is changing until
it reached a “fully developed flow” where the velocity profile remains constant. Jaworski et al. [16]
defined the “entrance length” as the distance from the channel entry to the point where centreline
velocity deviates 1% from the fully developed profile. This definition of the “entrance length” have
been adopted in the current study as a way to identify the length of the “entrance region”. Figures
5(a) – 5(d) shows the plotted graph of the distribution of velocity amplitude at the centre of the
channel for DR = 0.65% and DR = 1% at low flow frequency (f = 13.1 Hz) and high flow frequency (f
= 23.1 Hz).
The “wavy pattern” as can be seen in all plotted graph in Figures 5(a) until 5(d) reveals the
extent of the “entrance length” phase-by-phase. Interestingly, it is found that the “wavy pattern” in
phase φ20 having the “entrance region” extends the furthest into the channel for all cases in the
current study. This is the phase where the reverse flow is at its maximum amplitude and the flow is
about to change its’ direction. Thus the ‘wavy pattern’ appearing in φ20 is not only representing the
effect of the ‘sucked’ vortices but also the effect of the reversing nature of particles that happens at
all levels and locations of the channel.
Fig. 5. Distribution of velocity amplitude at the centre of the channel for DR =
0.65% (a) f = 13.1 Hz, (b) f = 23.1 Hz and DR = 1%, (c) f = 13.1 Hz, (d) f = 23.1
Hz. The results are plotted for all twenty phases in the flow cycle. The vertical
line serves as a guide for entrance length
Figure 5 also shows that the entrance length for low frequency (Figure 5 (a) and (c)) is longest
compared to the higher frequency (Figure 5 (b) and (d)). This might be related to the rapidness of
flow. At low frequency, the fluid flows to a longer distance and the time taken to complete one
cycle is long. At high frequency, fluid flows in a more rapid nature where the air particles travel to a
shorter distance and the cycle is completed in a shorter period. Hence, the entrance length tends to
be shorter as the frequency increases.
Journal of Advanced Research in Fluid Mechanics and Thermal Sciences
Volume 43, Issue 1 (2018) 149-157
156
Penerbit
Akademia Baru
The model was then solved for additional flow frequencies. The results for entrance length for
all cases including a few additional cases that were considered in the current work is summarised as
shown in Table 2. Evidently, the entrance length is longer as Reynolds number (related to drive
ratio) increases. The prediction of entrance length following the classical equations (2) and (3) as
defined earlier is also shown in the last column of Table 2. In the calculation, the size of gap
between channels, D, was used as it represents the size of the channel. Comparison between the
current results (Xentrance) and the prediction from classical text books (Xequations (2) and (3)) shows a very
huge different particularly for low drive ratio where the flow is to be treated as laminar. At higher
drive ratios, the theoretical predictions give values slightly lower than the results of the validated
numerical models. The deviation becomes bigger as drive ratio increases. The results shown here
indicate that the classical equation for predicting entrance region may not be so suitable to be used
for estimating entrance region of an oscillatory flow condition found in many thermoacoustic
devices.
Table 2
Entrance length based on drive ratios and flow frequencies
Frequency,
f (Hz)
Drive ratio, DR
(%)
Velocity amplitudes at
the middle of the stack,
Um (m/s)
Reynolds
number, Re
Xentrance
(m)
xequations (2) and (3)
(m)
13.1 0.65
0.83
1.0
2.0
3.0
2.33
2.97
3.75
7.62
11.58
1040
1326
1674
3402
5170
0.0801
0.0704
0.0741
0.0801
0.0826
0.3121
0.3978
0.06
0.06
0.06
23.1 0.65
0.83
1.0
2.0
3.0
2.30
2.98
3.48
7.31
11.12
1027
1331
1554
3264
4965
0.0561
0.0615
0.0662
0.0704
0.0773
0.3081
0.06
0.06
0.06
0.06
4. Conclusion
This paper presents an investigation of the vortex formation/shedding and entrance region (or
length) at varied drive ratios and flow frequencies for an oscillatory flow in thermoacoustics. There
are several significant findings that can be concluded from the current study: (i) at frequency of
13.1 Hz, the structure of the vortex shedding at the end of the plates shows a sign of ‘wiggle’ and
‘breakage’, whereas this same flow structure are not justified for frequency of 23.1 Hz, (ii) for all
cases studied, it is found that the change of flow direction and the “wavy pattern” of vortex mostly
found in phase φ20 would lead to the extension of the “entrance region” further into the channel,
and (iii) the entrance length becomes shorter as the flow frequency increases. The current study
highlights that the cyclic nature of the flow has certain influence on the flow behaviour and it must
be remembered that entrance region may need to be defined on both sides (inlet and exit points)
of the channel. In oscillatory flow, fluid flows back and forth in cyclic nature hence the fluid
dynamics behaviour of flow must be analysed carefully with consideration of additional features
that may not be described in conventional unidirectional flow.
Journal of Advanced Research in Fluid Mechanics and Thermal Sciences
Volume 43, Issue 1 (2018) 149-157
157
Penerbit
Akademia Baru
Acknowledgements
This work is jointly supported by Ministry of Higher Education Malaysia
(FRGS/1/2015/TK03/FKM/03/F00274) and Universiti Teknikal Malaysia Melaka (UTeM).
References [1] Zolpakar, Nor Atiqah, Normah Mohd-Ghazali, and Mawahib Hassan El-Fawal. "Performance analysis of the
standing wave thermoacoustic refrigerator: A review." Renewable and Sustainable Energy Reviews 54 (2016):
626-634..
[2] Zhang, S., Z. H. Wu, R. D. Zhao, G. Y. Yu, W. Dai, and E. C. Luo. "Study on a basic unit of a double-acting
thermoacoustic heat engine used for dish solar power." Energy Conversion and Management 85 (2014): 718-726.
[3] Sharify, Esmatullah Maiwand, and Shinya Hasegawa. "Traveling-wave thermoacoustic refrigerator driven by a
multistage traveling-wave thermoacoustic engine." Applied Thermal Engineering 113 (2017): 791-795..
[4] Abdoulla-Latiwish, Kalid OA, Xiaoan Mao, and Artur J. Jaworski. " Abdoulla-Latiwish, Kalid OA, Xiaoan Mao, and
Artur J. Jaworski. "Thermoacoustic micro-electricity generator for rural dwellings in developing countries driven
by waste heat from cooking activities." Energy 134 (2017): 1107-1120.
[5] Mao, Xiaoan, and Artur J. Jaworski. "Application of particle image velocimetry measurement techniques to study
turbulence characteristics of oscillatory flows around parallel-plate structures in thermoacoustic
devices." Measurement Science and Technology 21, no. 3 (2010): 035403.
[6] Mohd Saat, Fatimah AZ, and Artur J. Jaworski. "Numerical Predictions of Early Stage Turbulence in Oscillatory
Flow across Parallel-Plate Heat Exchangers of a Thermoacoustic System." Applied Sciences 7, no. 7 (2017): 673.
[7] Shi, Lei, Zhibin Yu, Artur J. Jaworski, and Abdulrahman S. Abduljalil. "Vortex shedding at the end of parallel-plate
thermoacoustic stack in the oscillatory flow conditions." World Academy of Science, Engineering and
Technology 49 (2009).
[8] Mao, Xiaoan, Zhibin Yu, Artur J. Jaworski, and David Marx. "PIV studies of coherent structures generated at the
end of a stack of parallel plates in a standing wave acoustic field." Experiments in Fluids 45, no. 5 (2008): 833-
846.
[9] Mohd Saat, Fatimah AZ, and Artur J. Jaworski. "The effect of temperature field on low amplitude oscillatory flow
within a parallel-plate heat exchanger in a standing wave thermoacoustic system." Applied Sciences 7, no. 4
(2017): 417.
[10] Shi, Lei, Zhibin Yu, and Artur J. Jaworski. "Application of laser-based instrumentation for measurement of time-
resolved temperature and velocity fields in the thermoacoustic system." International Journal of Thermal
Sciences 49, no. 9 (2010): 1688-1701.
[11] Mohd Saat, Fatimah AZ, and Artur J. Jaworski. "Friction Factor Correlation for Regenerator Working in a
Travelling-Wave Thermoacoustic System." Applied Sciences 7, no. 3 (2017): 253.
[12] Matveev, Konstantin, Scott Backhaus, and Greg Swift. "On some nonlinear effects of heat transport in thermal
buffer tubes." In AIP Conference Proceedings, vol. 838, no. 1, pp. 371-378. AIP, 2006.
[13] Azwadi, CS Nor, and I. M. Adamu. "Turbulent force convective heat transfer of hybrid nano fluid in a circular
channel with constant heat flux." J. Adv. Res. Fluid Mech. Therm. Sci. 19, no. 1 (2016): 1-9.
[14] Abdulwahab, Mohammed Raad. "A numerical investigation of turbulent magnetic nanofluid flow inside square
straight channel." J. Adv. Res. Fluid Mech. Therm. Sci. 1, no. 1 (2014): 44-52.
[15] Yamanaka, G., H. Kikura, Y. Takeda, and M. Aritomi. "Flow measurement on oscillating pipe flow near the
entrance using the UVP method." Experiments in fluids 34, no. 3 (2003): 307-315.
[16] Jaworski, Artur J., Xiaoan Mao, Xuerui Mao, and Zhibin Yu. "Entrance effects in the channels of the parallel plate
stack in oscillatory flow conditions." Experimental Thermal and Fluid Science 33, no. 3 (2009): 495-502.
[17] Cengel, Yunus. Heat and mass transfer: fundamentals and applications. McGraw-Hill Higher Education, 2014.
[18] S. H. A. Mustaffa., F. A. Z. Mohd Sa’at, E. Mat Tokit. "Design of experimental test-rig to investigate turbulence in
oscillatory flow used in thermoacoustics." Proceeding of Postgraduate Symposium on Green Engineering and
Technology (2016).
[19] Versteeg, Henk Kaarle, and Weeratunge Malalasekera. An introduction to computational fluid dynamics: the
finite volume method. Pearson Education, 2007.
[20] Rott, Nikolaus. "Thermoacoustics." In Advances in applied mechanics, vol. 20, pp. 135-175. Elsevier, 1980.