3 Numerical Study on the Effect of the Ocean on Tropical-Cyclone Intensity and Structural Change Akiyoshi Wada Meteorological Research Institute Japan 1. Introduction The ocean is an indispensable source of energy for tropical cyclones (TCs). TCs enable extraction of heat and moisture from the sea surface through the transfer of turbulent heat energy in the atmospheric boundary layer. TCs are often generated where sea-surface temperature (SST) is higher than 26.5ºC (Palmén, 1948), and they intensify in areas that have high SST and deep oceanic mixed layer, thus having high upper-ocean heat content. Previous studies reported that TC intensity is related to ‘tropical-cyclone heat potential’, which is oceanic heat content integrated from the surface to the depth of the 26°C-isotherm (Wada & Usui, 2007; Wada, 2010). However, most of people believe that TCs intensify when SST is higher than 26-28ºC. The oceans affect both the genesis and intensification of TCs, which in turn apply wind stresses to the ocean that induce sea-surface cooling (SSC) during their passages (Ginis, 1995). Numerous numerical modeling studies leave no doubt that SSC affects both the evolution of TCs and prediction of their intensities (Bender & Ginis, 2000; Wada et al., 2010). Nevertheless, uncertainties remain in the use of numerical models to predict TC intensity: these are related to initial atmospheric and oceanic conditions, the spatial and temporal resolution of the models, and the physical processes incorporated into the models (Wang & Wu, 2004; Wada, 2007). It may appear that a sophisticated model such as an atmosphere- wave-ocean coupled model can produce valid predictions of TC intensity when TC intensity predicted by that model matches best-track intensity derived from satellite observations. However, best-track intensity is not always valid, particularly in the western North Pacific where there is a lack of direct observation such as aircraft observations for measuring TC intensity directly. Furthermore, a coupled model that has successfully calculated TC intensities in one situation may provide erroneous results in another situation because of unexpected interactions among the specifications, physical processes, and initial and boundary conditions used in the model. One particular combination of model specifications and parameters may thus not always be valid for other TC predictions. However, studies using a numerical model provide us scientific explanations on dynamical and physical processes associated with TC intensification. (Wada, 2009) explained the effects on TC intensification of atmospheric dynamics such as filamentation, the formation of www.intechopen.com
Transcript
3
Numerical Study on the Effect of the Ocean on Tropical-Cyclone
Intensity and Structural Change
Akiyoshi Wada Meteorological Research Institute
Japan
1. Introduction
The ocean is an indispensable source of energy for tropical cyclones (TCs). TCs enable extraction of heat and moisture from the sea surface through the transfer of turbulent heat energy in the atmospheric boundary layer. TCs are often generated where sea-surface temperature (SST) is higher than 26.5ºC (Palmén, 1948), and they intensify in areas that have high SST and deep oceanic mixed layer, thus having high upper-ocean heat content. Previous studies reported that TC intensity is related to ‘tropical-cyclone heat potential’, which is oceanic heat content integrated from the surface to the depth of the 26°C-isotherm (Wada & Usui, 2007; Wada, 2010). However, most of people believe that TCs intensify when SST is higher than 26-28ºC.
The oceans affect both the genesis and intensification of TCs, which in turn apply wind stresses to the ocean that induce sea-surface cooling (SSC) during their passages (Ginis, 1995). Numerous numerical modeling studies leave no doubt that SSC affects both the evolution of TCs and prediction of their intensities (Bender & Ginis, 2000; Wada et al., 2010). Nevertheless, uncertainties remain in the use of numerical models to predict TC intensity: these are related to initial atmospheric and oceanic conditions, the spatial and temporal resolution of the models, and the physical processes incorporated into the models (Wang & Wu, 2004; Wada, 2007). It may appear that a sophisticated model such as an atmosphere-wave-ocean coupled model can produce valid predictions of TC intensity when TC intensity predicted by that model matches best-track intensity derived from satellite observations. However, best-track intensity is not always valid, particularly in the western North Pacific where there is a lack of direct observation such as aircraft observations for measuring TC intensity directly. Furthermore, a coupled model that has successfully calculated TC intensities in one situation may provide erroneous results in another situation because of unexpected interactions among the specifications, physical processes, and initial and boundary conditions used in the model. One particular combination of model specifications and parameters may thus not always be valid for other TC predictions.
However, studies using a numerical model provide us scientific explanations on dynamical and physical processes associated with TC intensification. (Wada, 2009) explained the effects on TC intensification of atmospheric dynamics such as filamentation, the formation of
www.intechopen.com
Atmospheric Model Applications
44
mesovortices and vortex Rossby waves. Mesovortices and vortex merger events are directly affected by SSC, which slows the formation of an annular potential-vorticity (PV) ring, whereas SST changes have little effect on the radius of maximum wind speed (MWS) at the mature phase of a TC when the annular PV ring is completely formed, even though mature TCs continue to cool the underlying ocean (Wada, 2009).
TC-induced SSC is caused mostly by vertical turbulent mixing in the oceanic mixed layer and upwelling below a seasonal thermocline. In addition, strong wind stresses that accompany TCs cause variations in sea state or surface roughness length, leading to changes in frictional velocity and exchange coefficients for drag and enthalpy. Breaking surface waves are caused by variations of sea state under high winds and the resultant high waves. The breaking surface waves play an essential role in mechanical mixing near the surface (Wada et al., 2010). However, improvement of vertical turbulent mixing schemes and parameterizations in the ocean model is a challenging issue owing to a lack of in situ observations under high winds.
Changes in exchange coefficients lead to changes in surface wind stresses and turbulent heat fluxes from the ocean to the atmosphere. The change in turbulent heat fluxes, particularly latent heat flux, enhances the secondary circulation of a TC through a planetary-boundary-layer process (Emanuel, 1986; Smith, 2008). In particular, turbulent heat fluxes vertically transferred from the warm ocean affect cloud microphysics and atmospheric radiation in the middle to upper troposphere, causing latent heat release through condensation, thus resulting in the formation of a warm core within the inner core of a TC.
These atmospheric dynamics are confined to within the inner core of a TC. We need also to consider the role of atmospheric and oceanic environmental influences, such as vertical shear, synoptic thermal stratification, and warm-core oceanic eddies with a few hundred kilometers, in the evolution of a TC. (Wada & Usui, 2010) reported that changes in pre-existing oceanic conditions are synoptically related to the formation of spiral rainbands that accompanied Typhoon Hai-Tang in 2005 and are thus important for predictions of the intensity of Hai-Tang.
This chapter explores the effect of the ocean on TC intensity, intensification and structural change from the viewpoints of internal dynamical and pre-existing external atmospheric and oceanic environmental conditions. Section 2 describes the numerical model used in this study, and section 3 describes the experimental design. Section 4 provides the results of numerical experiments of an idealized TC and simulations of Typhoon Choi-Wan in 2009. The effect of the ocean on TC evolution at the mature phase and associated numerical issues are discussed in section 5. Section 6 presents the conclusion of this study.
2. Numerical model
A nonhydrostatic model (NHM) has been developed jointly by the Numerical Prediction Division (NPD) and Meteorological Research Institute (MRI) of the Japan Meteorological Agency (JMA) (hereafter JMANHM). The NHM, which has been equipped with two-way triply nested movable functions, was developed at MRI and was coupled with a multilayer ocean model (MRINHM) developed by (Wada, 2009). The physical processes in JMANHM and MRINHM include cloud physics expressed in an explicit three-ice bulk microphysics scheme based on the work of (Lin et al., 1983), a resistance law assumed for momentum and
www.intechopen.com
Effect of the Ocean on TC
45
enthalpy fluxes in the atmospheric surface-boundary layer, exchange coefficients for momentum and enthalpy transfers over the sea based on the bulk formulas of (Kondo, 1975), a turbulent closure model in the atmospheric boundary layer formulated from the work of (Klemp & Wilhelmson, 1978) and (Deardorff, 1980), and an atmospheric radiation scheme based on (Sugi et al., 1990).
The JMANHM used here for numerical simulations of Typhoon Choi-wan in 2009 is an older version of the current nonhydrostatic mesoscale model of (Wada et al., 2010), but it is coupled with not only a multilayer ocean model but also a third-generation ocean-wave model developed for operational use at JMA (Wada et al., 2010). No cumulus parameterization was used in either MRINHM or JMANHM in this study.
A reduced-gravity approximation, a hydrostatic approximation, and Boussinesq fluid are assumed in the multilayer ocean model. The model has three layers and four levels. The uppermost layer represents a mixed layer where density is vertically uniform, the middle layer represents a seasonal thermocline where the vertical temperature gradient is greatest, and the bottom layer is assumed to be undisturbed by entrainment. Entrainment is calculated by using a multi-limit entrainment formulation proposed by (Deardorff, 1983) and modified by (Wada et al., 2009). The model calculates water temperature and salinity at the surface and at the base of the mixed layer, and calculates layer thickness and 2-dimentional flows for all three layers.
The JMA third-generation ocean-wave model is coupled with JMANHM to estimate changes in surface roughness lengths, drag coefficients and enthalpy coefficients. The method of (Taylor & Yelland, 2001) in which surface roughness length over the ocean depends on wave steepness is adopted here. The detailed wave-ocean coupling procedure is as described by (Wada et al., 2010).
The atmosphere-ocean coupling procedure in MRINHM and JMANHM is as follows. Short-wave and long-wave radiation, sensible and latent heat fluxes, wind stresses, and precipitation are provided to the ocean model for every time step of the ocean model. Land and sea distributions extracted from GTOPO30 digital elevation data from the US Geological Survey are provided from the atmosphere model to the ocean model only at the initial time in order to adjust the land and sea distributions between the atmosphere and ocean models. Oceanic topography is provided by ETOPO-5 data from the National Oceanic and Atmospheric Administration (NOAA) National Geophysical Data Center; these elevations are spaced at 5-minute intervals of latitude and longitude. Conversely, SST calculated by the ocean model is provided to MRINHM and JMANHM for every time step of the ocean model.
3. Experimental design
This study presents the results of two numerical experiments. One is a series of idealized numerical experiments applying MRINHM. MRINHM covers a 600 km x 600 km square computational domain with a horizontal grid spacing of 2 km. The other is a series of numerical simulations of Typhoon Choi-Wan in 2009 performed using JMANHM. JMANHM covers a 2700 km x 3600 km rectangular domain with a horizontal grid spacing of either 6 km or 12 km. Both MRINHM and JMANHM have 40 vertical levels with variable intervals from 40 m for the lowermost (near-surface) layer to 1180 m for the uppermost
www.intechopen.com
Atmospheric Model Applications
46
layer. Both MRINHM and JMANHM have maximum height approaching nearly 23 km. The time step of MRINHM is 6 s and that of JMANHM is 15 s (6 km grid spacing) or 30 s (12 km grid spacing). The length of the time step of the ocean model is six times those of both MRINHM and JMANHM. The Coriolis parameter is uniformly set to 5.0 x 10⁻⁵ (nearly 20ºN) in MRINHM and varies in JMANHM depending on the grid latitude.
Water depth in the multilayer ocean model coupled with MRINHM is uniformly set to 1000 m. Initial SST is set to 30ºC, the initial temperature at the base of the mixed layer to 29ºC, the initial temperature at the base of the thermocline to 18ºC and the initial temperature at the bottom to 5ºC. Initial salinity is set to 35 at all levels. The initial mixed-layer depth is set to be 30 m, the initial thermocline thickness to 170 m and the initial third-layer thickness to 800 m. The third layer thickness is assumed to be unaffected by entrainment. In JMANHM, the initial depth of the mixed layer is determined from oceanic reanalysis data by assuming a difference in the value of density from the surface of no more than 0.25 kg m-3 and the depth of the mixed layer is limited to 200 m. The base of the thermocline is limited to 600 m and water depth is limited to 2000 m. The oceanic reanalysis data are calculated using the MRI ocean variational estimation (MOVE) system (Usui et al., 2006).
3.1 Idealized experiment
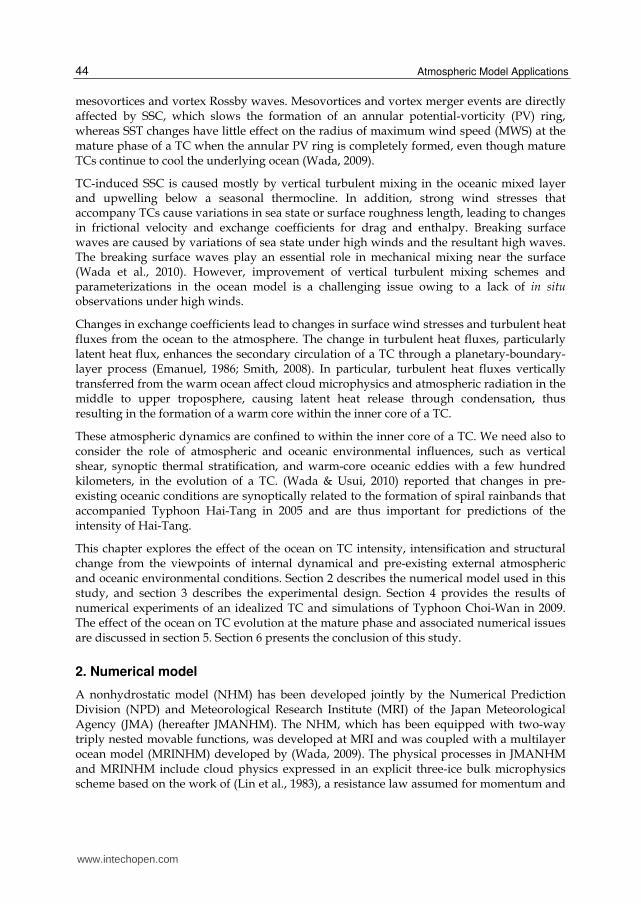
Table 1 summarizes the idealized numerical experiments performed using MRINHM with and without coupling with the ocean model. The initial TC-like vortex and thermal conditions were as given by (Wada, 2009). The integration time was 81 h with results output every 30 min. The sensitivity of vertical turbulent mixing in the ocean model was evaluated using two tuning parameters: md = 17.5 and md = 175. Parameter md is associated with turbulent kinetic energy flux produced by breaking surface waves.
Table 1. Summary of key parameters of idealized MRINHM numerical experiments with and without coupling with the ocean model.
Experiment CTL was a control run. ’D2’ in the experiment index indicates that the representative mixing-length scale was determined as a two-dimensional geometric mean, and ‘K35’ indicates that drag coefficients leveled off when 10-m wind speed exceeded 35 m s-1, This saturation of drag coefficients has been reported by (Powell et al., 2003) and (Donelan et al., 2004). Drag coefficients and mixing-length scales were as given by (Deardorff, 1980).
www.intechopen.com
Effect of the Ocean on TC
47
3.2 Typhoon Choi-Wan in 2009
Typhoon Choi-Wan in 2009 was simulated during its mature and decaying phases. Choi-Wan was initiated when a tropical depression evolved into a TC around 15.4ºN, 150.9ºE at 18:00 UTC on 12 September 2009. Choi-Wan moved initially west-northwestward but changed to a northwestward track as it rapidly intensified. From 12:00 UTC on 15 September to 18:00 UTC on 16 September, the minimum central pressure (MCP) was 915 hPa and MWS was 105 knots (~54 m s-1). At a location around 23.2˚N, 138.9˚E, Choi-Wan gradually slowed and changed to a north-northeastward track as it began to decay.
Table 2. Key data used for numerical simulations of Typhoon Choi-Wan in 2009
The initial time for all simulations was 00:00 UTC on 17 September 2009, when Choi-Wan entered its mature phase. Two sets of atmospheric initial and boundary conditions were used. One was derived from six-hourly global objective analysis data (GA data hereafter) from JMA with a grid spacing of 20 km. The other was derived from six-hourly data from the JMA Climate Data Assimilation System (JCDAS hereafter) with latitude and longitude grid spacings of 1.25º. Daily oceanic reanalysis data with two grid spacings (0.1º and 0.5º ) calculated using the MOVE system were used as initial oceanic conditions.
Table 2 provides the key specifications of the JMANHM numerical simulations of Choi-Wan. Both NHM and coupled NHM-wave-ocean models were used to investigate the effect of the ocean on TC simulations from viewpoints of existence or non-existence of Choi-Wan-induced SSC. Warm-rain experiments did not take snow and ice-cloud phases into consideration in cloud physics.
www.intechopen.com
Atmospheric Model Applications
48
4. Results
4.1 Intensity and structural change
4.1.1 Vortex intensity
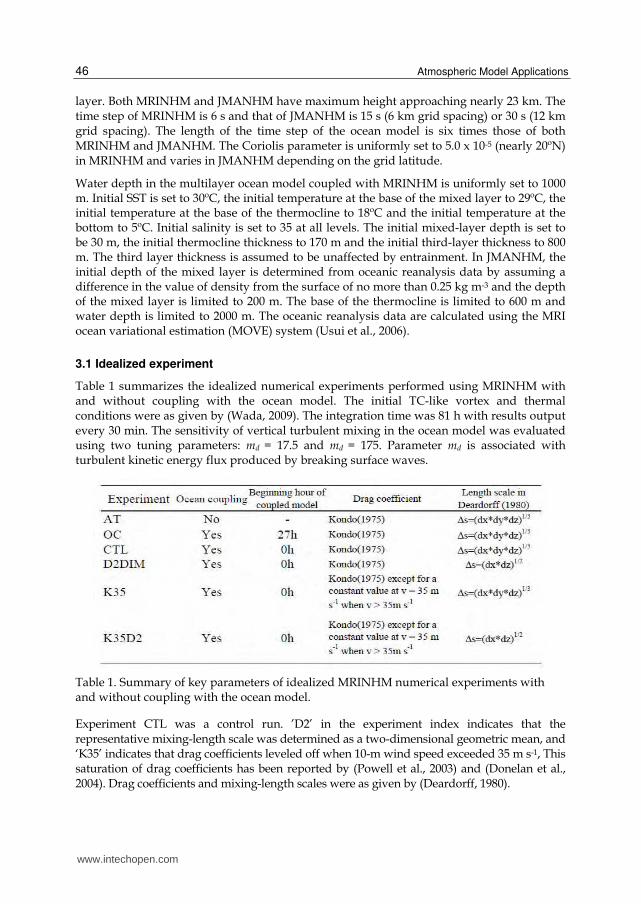
Figure 1a indicates that central pressure (CP) is high during the integration when the MRINHM is coupled with the ocean model. Figure 1b indicates that a higher value of md (175) greatly reduces intensification, resulting in high CP. A difference in CP between the OC and CTL experiments is evident after 24 h and is unrelated to the values of md. The vortex intensifies slowly in experiment CTL, whereas intensification is rapid in experiment OC. CP maintains their values within ranges of 950-960 hPa (md = 17.5) and 980-990 hPa (md = 175) during the mature phase (except in experiment AT). These results indicate minimal intensification of the mature vortex despite continued vortex-induced SSC.
Fig. 1. Time series of CP of the idealized TC-like vortex at 30 min intervals for (a) md = 17.5 and (b) md = 175 for each experiment shown in Table 1.
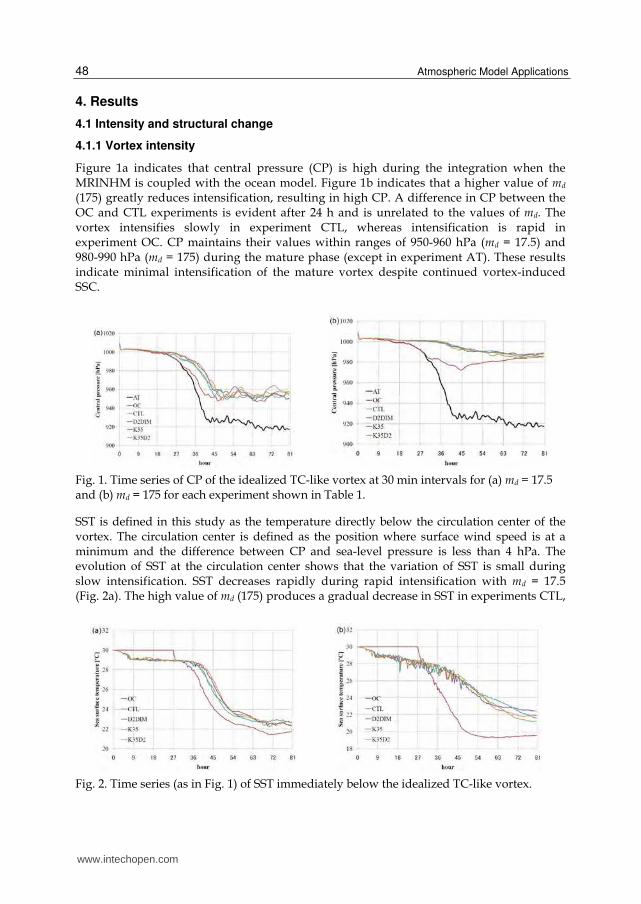
SST is defined in this study as the temperature directly below the circulation center of the vortex. The circulation center is defined as the position where surface wind speed is at a minimum and the difference between CP and sea-level pressure is less than 4 hPa. The evolution of SST at the circulation center shows that the variation of SST is small during slow intensification. SST decreases rapidly during rapid intensification with md = 17.5 (Fig. 2a). The high value of md (175) produces a gradual decrease in SST in experiments CTL,
Fig. 2. Time series (as in Fig. 1) of SST immediately below the idealized TC-like vortex.
www.intechopen.com
Effect of the Ocean on TC
49
D2DIM, K35, and K35D2 but a rapid decrease in SST in experiment OC (Fig. 2b). The decrease in SST becomes small when the vortex reaches its mature phase. It should be noted that SST in experiment OC at 81 h (i.e., at the mature phase) is the smallest among all experiments (Table 1), but CP at that time is almost the same in all experiments except AT. This suggests that neither the evolution of the idealized vortex nor the final value of CP is dependent on SST directly below the circulation center.
Intensification of the vortex is more suppressed with md = 175 (Fig. 1b) than with md = 17.5. A difference in CPs for each experiment begins to appear after around 15 h, when the vortex undergoes slow intensification in experiment CTL, whereas rapid intensification of the vortex is apparent at this time in experiment OC. The vortices in experiments CTL, D2DIM, K35 and K35D2 begin to intensify rapidly at 36 h, later than in the experiments AT and OC. It is interesting that CP in experiment OC eventually reaches a value similar to those reached in experiments CTL, D2DIM, K35 and K35D2 at 81 h, suggesting that the evolution of SSC and the final value of SST may not be related to final TC intensity.
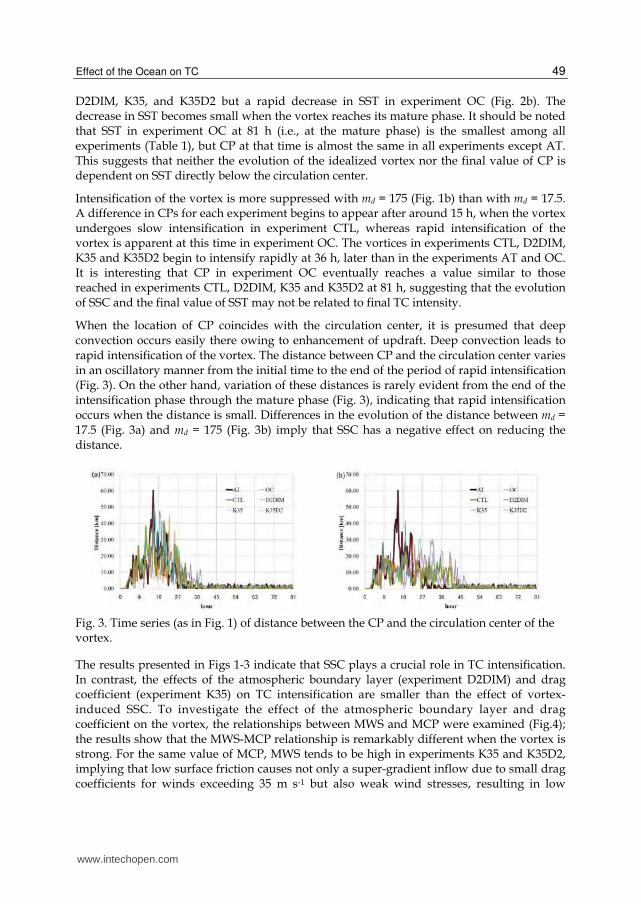
When the location of CP coincides with the circulation center, it is presumed that deep convection occurs easily there owing to enhancement of updraft. Deep convection leads to rapid intensification of the vortex. The distance between CP and the circulation center varies in an oscillatory manner from the initial time to the end of the period of rapid intensification (Fig. 3). On the other hand, variation of these distances is rarely evident from the end of the intensification phase through the mature phase (Fig. 3), indicating that rapid intensification occurs when the distance is small. Differences in the evolution of the distance between md = 17.5 (Fig. 3a) and md = 175 (Fig. 3b) imply that SSC has a negative effect on reducing the distance.
Fig. 3. Time series (as in Fig. 1) of distance between the CP and the circulation center of the vortex.
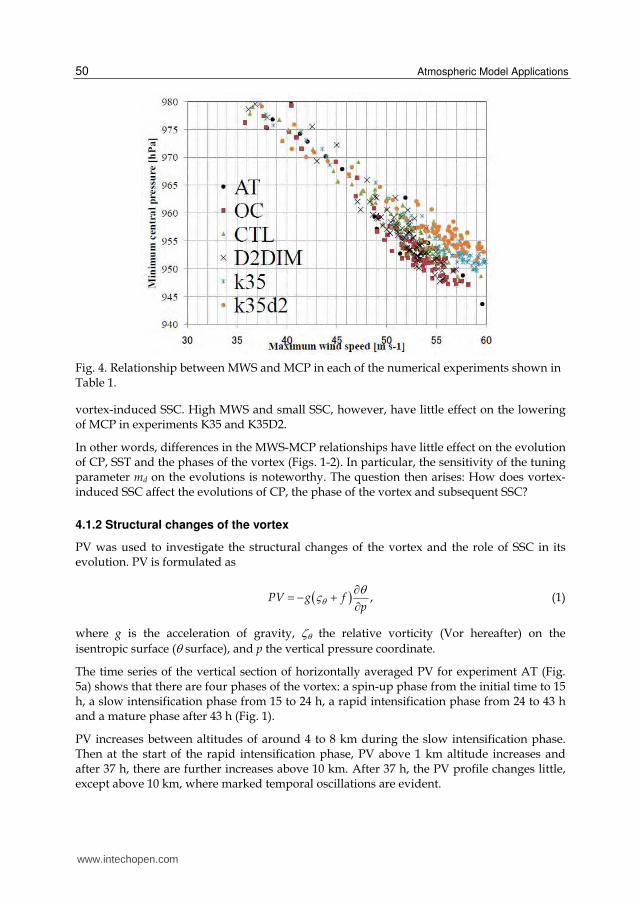
The results presented in Figs 1-3 indicate that SSC plays a crucial role in TC intensification. In contrast, the effects of the atmospheric boundary layer (experiment D2DIM) and drag coefficient (experiment K35) on TC intensification are smaller than the effect of vortex-induced SSC. To investigate the effect of the atmospheric boundary layer and drag coefficient on the vortex, the relationships between MWS and MCP were examined (Fig.4); the results show that the MWS-MCP relationship is remarkably different when the vortex is strong. For the same value of MCP, MWS tends to be high in experiments K35 and K35D2, implying that low surface friction causes not only a super-gradient inflow due to small drag coefficients for winds exceeding 35 m s-1 but also weak wind stresses, resulting in low
www.intechopen.com
Atmospheric Model Applications
50
Fig. 4. Relationship between MWS and MCP in each of the numerical experiments shown in Table 1.
vortex-induced SSC. High MWS and small SSC, however, have little effect on the lowering of MCP in experiments K35 and K35D2.
In other words, differences in the MWS-MCP relationships have little effect on the evolution of CP, SST and the phases of the vortex (Figs. 1-2). In particular, the sensitivity of the tuning parameter md on the evolutions is noteworthy. The question then arises: How does vortex-induced SSC affect the evolutions of CP, the phase of the vortex and subsequent SSC?
4.1.2 Structural changes of the vortex
PV was used to investigate the structural changes of the vortex and the role of SSC in its evolution. PV is formulated as
,PV g fp
(1)
where g is the acceleration of gravity, the relative vorticity (Vor hereafter) on the
isentropic surface ( surface), and p the vertical pressure coordinate.
The time series of the vertical section of horizontally averaged PV for experiment AT (Fig. 5a) shows that there are four phases of the vortex: a spin-up phase from the initial time to 15 h, a slow intensification phase from 15 to 24 h, a rapid intensification phase from 24 to 43 h and a mature phase after 43 h (Fig. 1).
PV increases between altitudes of around 4 to 8 km during the slow intensification phase. Then at the start of the rapid intensification phase, PV above 1 km altitude increases and after 37 h, there are further increases above 10 km. After 37 h, the PV profile changes little, except above 10 km, where marked temporal oscillations are evident.
www.intechopen.com
Effect of the Ocean on TC
51
The time series of the vertical section of horizontally averaged Vor (Fig. 5b) shows that Vor below 1 km altitude increases after 15 h. Vor increases markedly at around 24 h when the vortex starts to rapidly intensify. The rapid increase of Vor continues until around 43 h, after which the profile changes little through the mature phase. These results indicate that variations of PV are controlled mainly by variations of Vor. In addition, the vertical gradient of horizontally averaged potential temperature becomes low from around 2 to 9 km altitude, corresponding temporally with the change of Vor (not shown). Thus, the evolution of the Vor profile depends on the phase of the vortex and affects both the thermal and PV profiles.
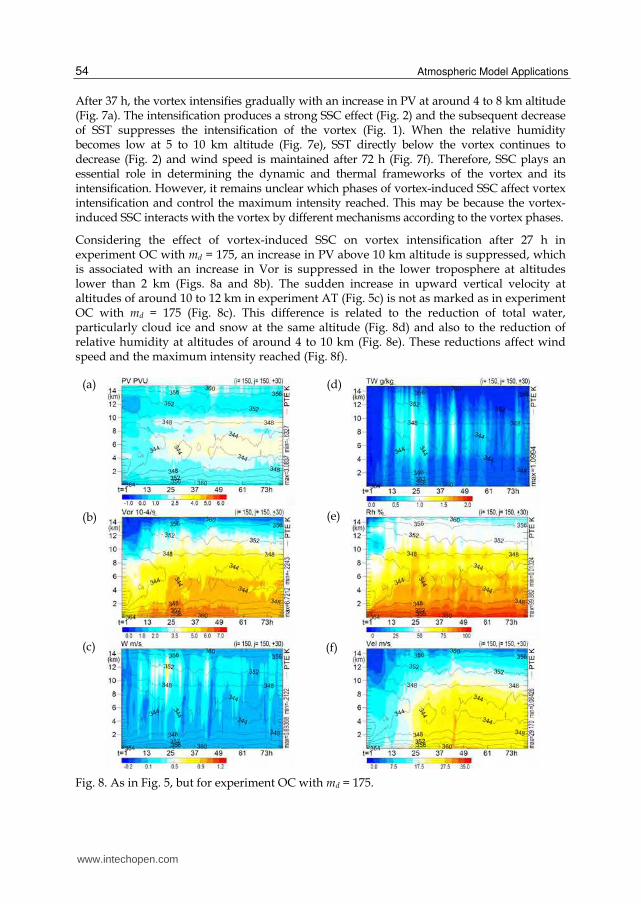
Fig. 5. Time series for experiment AT of the vertically averaged profiles of (a) PV, (b) Vor, (c) vertical velocity, (d) total water, (e) relative humidity and (f) horizontal wind speed. Averages are calculated over a 120 km x 120 km domain (corresponding to the scale of the initial vortex) centered in the computational domain. Black solid contours indicate equivalent potential temperature.
Upward vertical velocity increases suddenly between 10 to 12 km altitudes at 24, 43 and 51 h (Fig. 5c), corresponding temporally to sudden increases in total water (Fig. 5d) due to the production of cloud ice and snow. Total water in this study is defined as the sum of cloud water, rain, cloud ice, snow and graupel. The sudden increase in total water causes a sudden increase in relative humidity (Fig. 5e) at around 9 km altitude. The sudden increase in
(a)
(b)
(c)
(d)
(e)
(f)
www.intechopen.com
Atmospheric Model Applications
52
upward vertical velocity and relative humidity corresponds temporally to strengthening of horizontal wind speed (Fig. 5f). Because the increase in wind speeds is linked to increases in Vor, the intensification of the vortex can be explained by vertical transfers of heat and moisture due to the sudden increase of Vor and the production of cloud ice and snow around 10 to 12 km altitude, which in turn causes a sudden increase in Vor.
The horizontal distributions of Vor at altitudes of 1 and 4 km show clear differences for the slow intensification, rapid intensification and mature phases of experiment AT (Fig. 6). At the start of the slow intensification phase (Figs. 6a and 6d), Vor at the center of the vortex is low with mesovortices with horizontal diameters of up to 10 km scattered around the circulation center. At the start of the rapid intensification phase, the surviving mesovortices are concentrated closer to the circulation center at both 1 and 4 km altitudes (Figs. 6b and 6e) and those at 4 km altitude begin to show a spiral distribution as the vortex merger events far from the circulation center become enhanced by the eyewall-shrinking process (Fig. 3). After the rapid intensification phase, the vortex merger events cause the formation of an annular ring in the Vor distribution (Figs. 6c and 6f), with high Vor values also along the spirally bands at 4 km altitude. After formation of the annular ring, vortex intensification ceases during the mature phase (Fig. 1).
Fig. 6. Horizontal distributions of Vor at 4 km altitude for experiment AT at (a) 15 h, (b) 24 h, and (c) 43 h, and at 1 km altitude at (d) 15 h, (e) 24 h, and (f) 43 h. Black solid contours indicate positive Vor and black dashed lines indicate negative Vor. Pink contours indicate equivalent potential temperature at the same altitudes and times.
In other words, when the vortex merger events are extensive before formation of the annular ring of Vor, the mesovortices (high relative vorticity at 10 km scale accompanied by updraft) play a crucial role in the vertical transfer of heat and moisture. The locally-scattered horizontal distributions of equivalent potential temperature at 15 and 24 h are also strongly affected by the formation and enhancement of mesovortices (Fig. 6). Thus, the results of the
(d) (e) (f)
(a) (b) (c)
www.intechopen.com
Effect of the Ocean on TC
53
numerical experiments suggest that the activity of the mesovortices that accumulated around the circulation center during the intensification phase contributes to formation of the complete annular ring, which is closely related to the warm-core structure of the vortex. This relationship is similar to that between TC intensity and accumulated tropical cyclone heat potential (Wada & Usui, 2007) in that the vortex merge effect coincides with accumulation of upper-ocean heat content directly below the vortex. The annular ring of Vor is accompanied by a robust warm-core structure even at 4 km altitude, which is lower than the general warm-core altitude (nearly 12 km).
In experiment CTL, the differences of horizontally averaged profiles of PV, Vor, vertical velocity, total water, relative humidity and horizontal wind speed are smaller during the spin-up phase than those in experiment AT (Fig. 7), except that the total water and wind speed in experiment CTL are even lower at around 10 h. A dry-air feature at around 6 to 8 km altitude at the initial time is maintained during the spin-up phase in both experiments AT and CTL (Figs. 5e and 7e). In contrast, distant differences between the AT and CTL experiments begin to appear after the slow intensification phase. Slow intensification continues until 36 h in experiment CTL (Figs 1 and 5), which is longer than that in experiment AT.
Fig. 7. As in Fig. 5, but for experiment CTL with md = 175.
(a)
(b)
(c)
(d)
(e)
(f)
www.intechopen.com
Atmospheric Model Applications
54
After 37 h, the vortex intensifies gradually with an increase in PV at around 4 to 8 km altitude (Fig. 7a). The intensification produces a strong SSC effect (Fig. 2) and the subsequent decrease of SST suppresses the intensification of the vortex (Fig. 1). When the relative humidity becomes low at 5 to 10 km altitude (Fig. 7e), SST directly below the vortex continues to decrease (Fig. 2) and wind speed is maintained after 72 h (Fig. 7f). Therefore, SSC plays an essential role in determining the dynamic and thermal frameworks of the vortex and its intensification. However, it remains unclear which phases of vortex-induced SSC affect vortex intensification and control the maximum intensity reached. This may be because the vortex-induced SSC interacts with the vortex by different mechanisms according to the vortex phases.
Considering the effect of vortex-induced SSC on vortex intensification after 27 h in experiment OC with md = 175, an increase in PV above 10 km altitude is suppressed, which is associated with an increase in Vor is suppressed in the lower troposphere at altitudes lower than 2 km (Figs. 8a and 8b). The sudden increase in upward vertical velocity at altitudes of around 10 to 12 km in experiment AT (Fig. 5c) is not as marked as in experiment OC with md = 175 (Fig. 8c). This difference is related to the reduction of total water, particularly cloud ice and snow at the same altitude (Fig. 8d) and also to the reduction of relative humidity at altitudes of around 4 to 10 km (Fig. 8e). These reductions affect wind speed and the maximum intensity reached (Fig. 8f).
Fig. 8. As in Fig. 5, but for experiment OC with md = 175.
(a)
(b)
(c)
(d)
(e)
(f)
www.intechopen.com
Effect of the Ocean on TC
55
The value of md represents the amount of turbulent kinetic energy flux produced by breaking surface waves. When md is low, vortex-induced SSC becomes low. Therefore, the calculated SST may be relatively high directly beneath the vortex. Strengthening of the vortex due to low SSC is greater than that caused by the high SSC induced by vertical turbulent mixing enhanced by high md (Figs. 1 and 2). However, the evolution of the calculated SST is not determined simply by the value of md because the intensity of the vortex also affects the turbulent kinetic energy flux produced by breaking surface waves (Wada et al., 2010), which then affects subsequent vortex-induced SSC. The high value of md causes a rapid decrease in SST soon after the MRINHM-ocean coupled model starts to run.
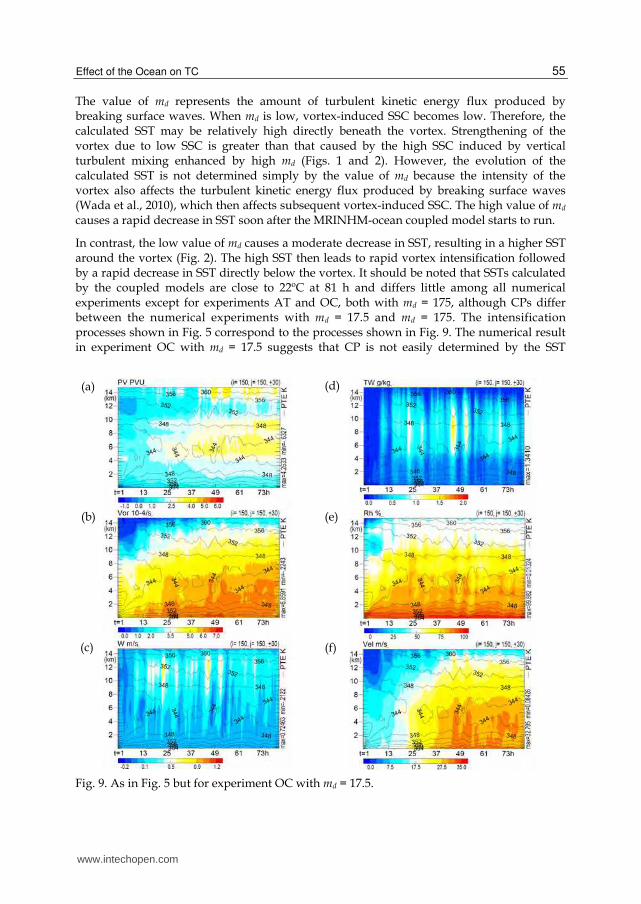
In contrast, the low value of md causes a moderate decrease in SST, resulting in a higher SST around the vortex (Fig. 2). The high SST then leads to rapid vortex intensification followed by a rapid decrease in SST directly below the vortex. It should be noted that SSTs calculated by the coupled models are close to 22ºC at 81 h and differs little among all numerical experiments except for experiments AT and OC, both with md = 175, although CPs differ between the numerical experiments with md = 17.5 and md = 175. The intensification processes shown in Fig. 5 correspond to the processes shown in Fig. 9. The numerical result in experiment OC with md = 17.5 suggests that CP is not easily determined by the SST
Fig. 9. As in Fig. 5 but for experiment OC with md = 17.5.
(a)
(b)
(c)
(d)
(e)
(f)
www.intechopen.com
Atmospheric Model Applications
56
directly below the vortex, but is influenced by the background effects of CP and SST evolution.
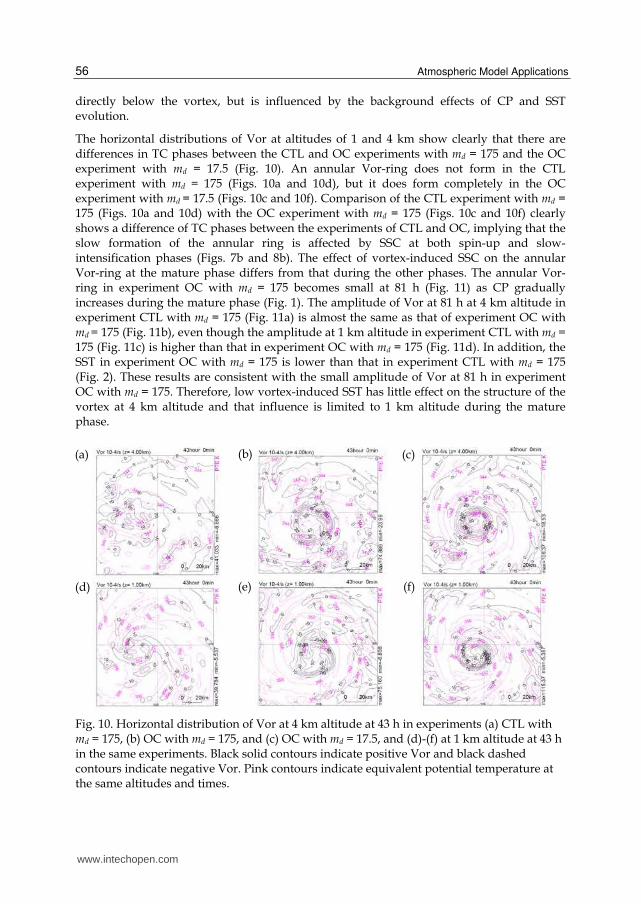
The horizontal distributions of Vor at altitudes of 1 and 4 km show clearly that there are differences in TC phases between the CTL and OC experiments with md = 175 and the OC experiment with md = 17.5 (Fig. 10). An annular Vor-ring does not form in the CTL experiment with md = 175 (Figs. 10a and 10d), but it does form completely in the OC experiment with md = 17.5 (Figs. 10c and 10f). Comparison of the CTL experiment with md = 175 (Figs. 10a and 10d) with the OC experiment with md = 175 (Figs. 10c and 10f) clearly shows a difference of TC phases between the experiments of CTL and OC, implying that the slow formation of the annular ring is affected by SSC at both spin-up and slow-intensification phases (Figs. 7b and 8b). The effect of vortex-induced SSC on the annular Vor-ring at the mature phase differs from that during the other phases. The annular Vor-ring in experiment OC with md = 175 becomes small at 81 h (Fig. 11) as CP gradually increases during the mature phase (Fig. 1). The amplitude of Vor at 81 h at 4 km altitude in experiment CTL with md = 175 (Fig. 11a) is almost the same as that of experiment OC with md = 175 (Fig. 11b), even though the amplitude at 1 km altitude in experiment CTL with md = 175 (Fig. 11c) is higher than that in experiment OC with md = 175 (Fig. 11d). In addition, the SST in experiment OC with md = 175 is lower than that in experiment CTL with md = 175 (Fig. 2). These results are consistent with the small amplitude of Vor at 81 h in experiment OC with md = 175. Therefore, low vortex-induced SST has little effect on the structure of the vortex at 4 km altitude and that influence is limited to 1 km altitude during the mature phase.
Fig. 10. Horizontal distribution of Vor at 4 km altitude at 43 h in experiments (a) CTL with md = 175, (b) OC with md = 175, and (c) OC with md = 17.5, and (d)-(f) at 1 km altitude at 43 h in the same experiments. Black solid contours indicate positive Vor and black dashed contours indicate negative Vor. Pink contours indicate equivalent potential temperature at the same altitudes and times.
(a) (b) (c)
(d) (e) (f)
www.intechopen.com
Effect of the Ocean on TC
57
Fig. 11. Horizontal distribution of Vor at 4 km altitude at 81 h in experiments (a) CTL with md = 175 and (b) OC with md = 175 and (c)-(d) at 1 km altitude at 81 h in the same experiments. Black solid contours indicate positive Vor and black dashed contours indicate negative Vor. Pink contours indicate equivalent potential temperature at the same altitudes and times.
4.1.3 Absolute angular momentum analysis
The location of the circulation center differs clearly from that of CP during the slow intensification phase, but these locations are almost the same after the rapid intensification phase (Fig. 3). These spatial differences may be related to a change of the budget of absolute angular momentum (AAM) for the vortex with a diameter of almost 100 km, which is given as the initial TC-like vortex (Wada, 2009). This subsection addresses the relation of the deepening of CP and intensification of vortex circulation to the budget of AAM.
AAM (a) is the sum of Vor and the Coriolis parameter (f):
a
v uf
x y , (2)
where x and y are zonal and meridional directions, and u and v are wind velocities in the x
and y directions, respectively. The variation of AAM with time is expressed as
a ah h a a
u v w v w uw
t z x y x z y z
v , (3)
where z is the vertical direction and w the vertical wind velocity. The upward direction for z
and w are indicated by positive values. The four terms on the right-hand side of Eq. (3)
indicate (from left to right) horizontal advection, vertical advection, divergence and titling.
(a) (b)
(c) (d)
www.intechopen.com
Atmospheric Model Applications
58
The divergence term expresses vertical intensification (suppression) of a vertical vortex in
response to stretching (compression); the tilting term expresses transformation from a
horizontal vortex to a vertical vortex. The averages of these terms were calculated over a 120
km square at the center of the computational domain.
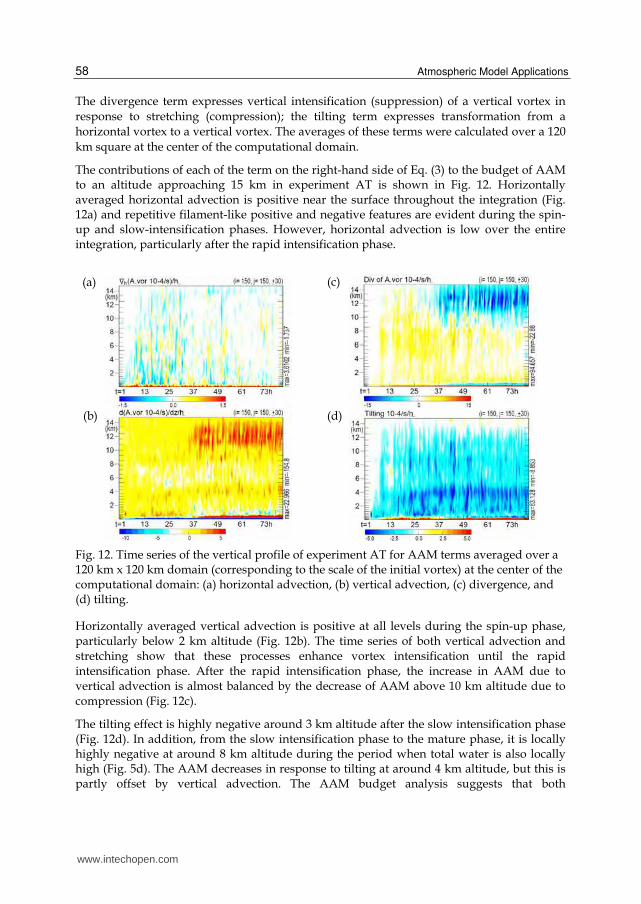
The contributions of each of the term on the right-hand side of Eq. (3) to the budget of AAM to an altitude approaching 15 km in experiment AT is shown in Fig. 12. Horizontally averaged horizontal advection is positive near the surface throughout the integration (Fig. 12a) and repetitive filament-like positive and negative features are evident during the spin-up and slow-intensification phases. However, horizontal advection is low over the entire integration, particularly after the rapid intensification phase.
Fig. 12. Time series of the vertical profile of experiment AT for AAM terms averaged over a 120 km x 120 km domain (corresponding to the scale of the initial vortex) at the center of the computational domain: (a) horizontal advection, (b) vertical advection, (c) divergence, and (d) tilting.
Horizontally averaged vertical advection is positive at all levels during the spin-up phase, particularly below 2 km altitude (Fig. 12b). The time series of both vertical advection and stretching show that these processes enhance vortex intensification until the rapid intensification phase. After the rapid intensification phase, the increase in AAM due to vertical advection is almost balanced by the decrease of AAM above 10 km altitude due to compression (Fig. 12c).
The tilting effect is highly negative around 3 km altitude after the slow intensification phase (Fig. 12d). In addition, from the slow intensification phase to the mature phase, it is locally highly negative at around 8 km altitude during the period when total water is also locally high (Fig. 5d). The AAM decreases in response to tilting at around 4 km altitude, but this is partly offset by vertical advection. The AAM budget analysis suggests that both
(a)
(b)
(c)
(d)
www.intechopen.com
Effect of the Ocean on TC
59
compression in the upper troposphere and tilting in the lower troposphere play significant roles in suppressing the vortex at the mature phase.
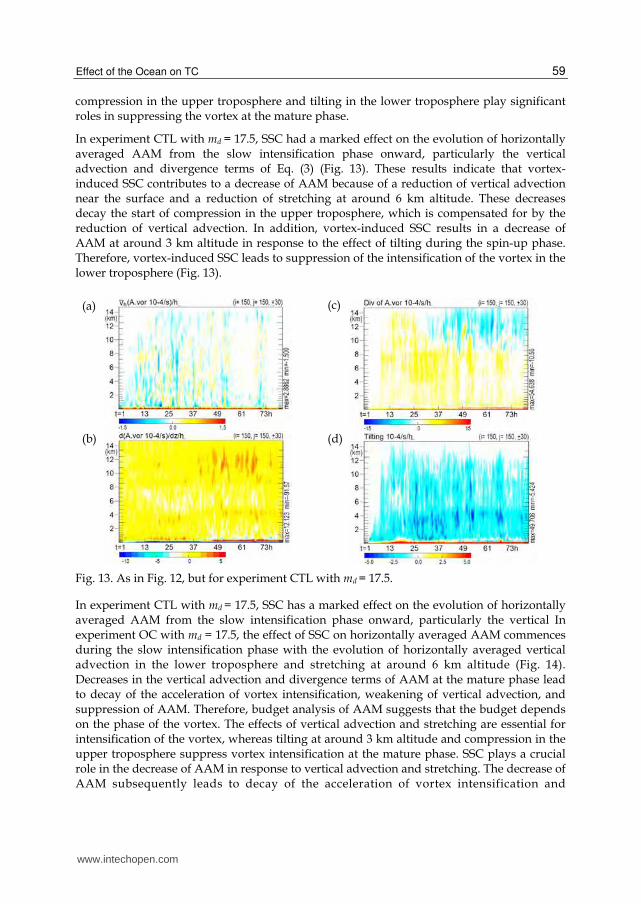
In experiment CTL with md = 17.5, SSC had a marked effect on the evolution of horizontally averaged AAM from the slow intensification phase onward, particularly the vertical advection and divergence terms of Eq. (3) (Fig. 13). These results indicate that vortex-induced SSC contributes to a decrease of AAM because of a reduction of vertical advection near the surface and a reduction of stretching at around 6 km altitude. These decreases decay the start of compression in the upper troposphere, which is compensated for by the reduction of vertical advection. In addition, vortex-induced SSC results in a decrease of AAM at around 3 km altitude in response to the effect of tilting during the spin-up phase. Therefore, vortex-induced SSC leads to suppression of the intensification of the vortex in the lower troposphere (Fig. 13).
Fig. 13. As in Fig. 12, but for experiment CTL with md = 17.5.
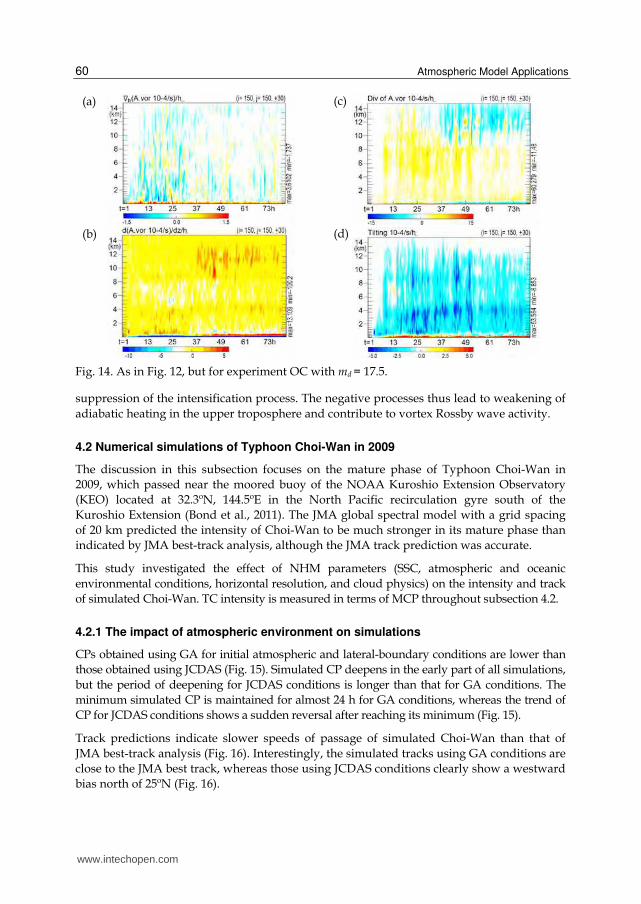
In experiment CTL with md = 17.5, SSC has a marked effect on the evolution of horizontally averaged AAM from the slow intensification phase onward, particularly the vertical In experiment OC with md = 17.5, the effect of SSC on horizontally averaged AAM commences during the slow intensification phase with the evolution of horizontally averaged vertical advection in the lower troposphere and stretching at around 6 km altitude (Fig. 14). Decreases in the vertical advection and divergence terms of AAM at the mature phase lead to decay of the acceleration of vortex intensification, weakening of vertical advection, and suppression of AAM. Therefore, budget analysis of AAM suggests that the budget depends on the phase of the vortex. The effects of vertical advection and stretching are essential for intensification of the vortex, whereas tilting at around 3 km altitude and compression in the upper troposphere suppress vortex intensification at the mature phase. SSC plays a crucial role in the decrease of AAM in response to vertical advection and stretching. The decrease of AAM subsequently leads to decay of the acceleration of vortex intensification and
(a)
(b)
(c)
(d)
www.intechopen.com
Atmospheric Model Applications
60
Fig. 14. As in Fig. 12, but for experiment OC with md = 17.5.
suppression of the intensification process. The negative processes thus lead to weakening of
adiabatic heating in the upper troposphere and contribute to vortex Rossby wave activity.
4.2 Numerical simulations of Typhoon Choi-Wan in 2009
The discussion in this subsection focuses on the mature phase of Typhoon Choi-Wan in
2009, which passed near the moored buoy of the NOAA Kuroshio Extension Observatory
(KEO) located at 32.3ºN, 144.5ºE in the North Pacific recirculation gyre south of the
Kuroshio Extension (Bond et al., 2011). The JMA global spectral model with a grid spacing
of 20 km predicted the intensity of Choi-Wan to be much stronger in its mature phase than
indicated by JMA best-track analysis, although the JMA track prediction was accurate.
This study investigated the effect of NHM parameters (SSC, atmospheric and oceanic
environmental conditions, horizontal resolution, and cloud physics) on the intensity and track
of simulated Choi-Wan. TC intensity is measured in terms of MCP throughout subsection 4.2.
4.2.1 The impact of atmospheric environment on simulations
CPs obtained using GA for initial atmospheric and lateral-boundary conditions are lower than
those obtained using JCDAS (Fig. 15). Simulated CP deepens in the early part of all simulations,
but the period of deepening for JCDAS conditions is longer than that for GA conditions. The
minimum simulated CP is maintained for almost 24 h for GA conditions, whereas the trend of
CP for JCDAS conditions shows a sudden reversal after reaching its minimum (Fig. 15).
Track predictions indicate slower speeds of passage of simulated Choi-Wan than that of
JMA best-track analysis (Fig. 16). Interestingly, the simulated tracks using GA conditions are
close to the JMA best track, whereas those using JCDAS conditions clearly show a westward
bias north of 25ºN (Fig. 16).
(a)
(b)
(c)
(d)
www.intechopen.com
Effect of the Ocean on TC
61
Fig. 15. Evolution of CPs for various simulations of Typhoon Choi-Wan in 2009 from 00:00 UTC 17 September and JMA best-track CP. Model specifications are (a) 6 km horizontal grid spacing and GA, (b) 6 km horizontal grid spacing and JCDAS, (c) 12 km horizontal grid spacing and GA and (d) 12 km horizontal grid spacing and JCDAS. Results shown include those obtained by both the NHM and NHM-wave-ocean coupled model in combination with the oceanic reanalysis dataset with a horizontal grid spacing of 0.1º or 0.5º (see Table 2).
Fig. 16. Various simulated tracks for Typhoon Choi-Wan in 2009 from 00:00 UTC 17 September and the JMA best track. Model specifications are (a) 6 km horizontal grid spacing and GA, (b) 6 km horizontal grid spacing and JCDAS, (c) 12 km horizontal grid spacing and GA and (d) 12 km horizontal grid spacing and JCDAS. Results shown include those obtained by both the NHM and NHM-wave-ocean coupled model in combination with the oceanic reanalysis dataset with a horizontal grid spacing of 0.1º or 0.5º (see Table 2).
(a) (c)
(b) (d)
(a) (c)
(b) (d)
www.intechopen.com
Atmospheric Model Applications
62
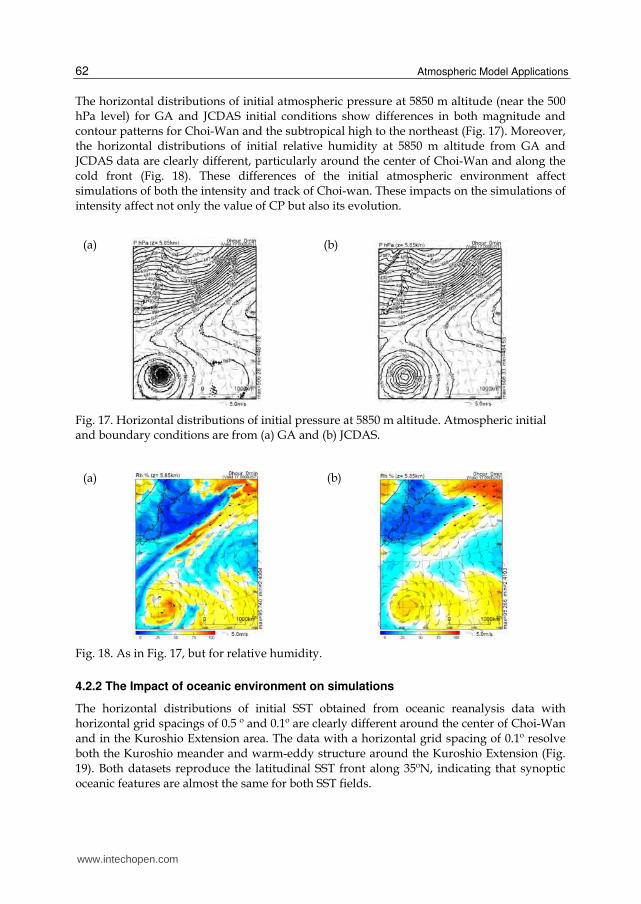
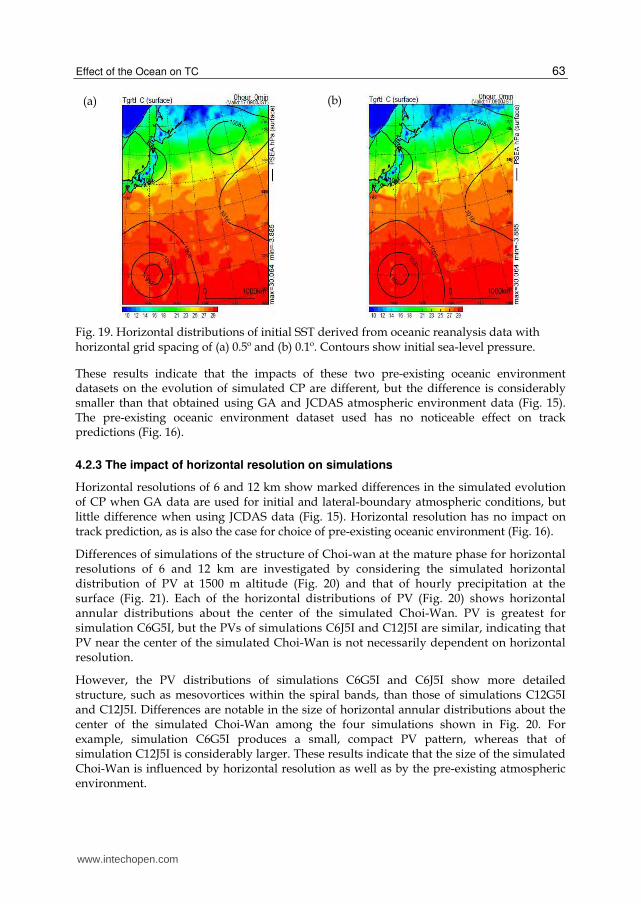
The horizontal distributions of initial atmospheric pressure at 5850 m altitude (near the 500 hPa level) for GA and JCDAS initial conditions show differences in both magnitude and contour patterns for Choi-Wan and the subtropical high to the northeast (Fig. 17). Moreover, the horizontal distributions of initial relative humidity at 5850 m altitude from GA and JCDAS data are clearly different, particularly around the center of Choi-Wan and along the cold front (Fig. 18). These differences of the initial atmospheric environment affect simulations of both the intensity and track of Choi-wan. These impacts on the simulations of intensity affect not only the value of CP but also its evolution.
Fig. 17. Horizontal distributions of initial pressure at 5850 m altitude. Atmospheric initial and boundary conditions are from (a) GA and (b) JCDAS.
Fig. 18. As in Fig. 17, but for relative humidity.
4.2.2 The Impact of oceanic environment on simulations
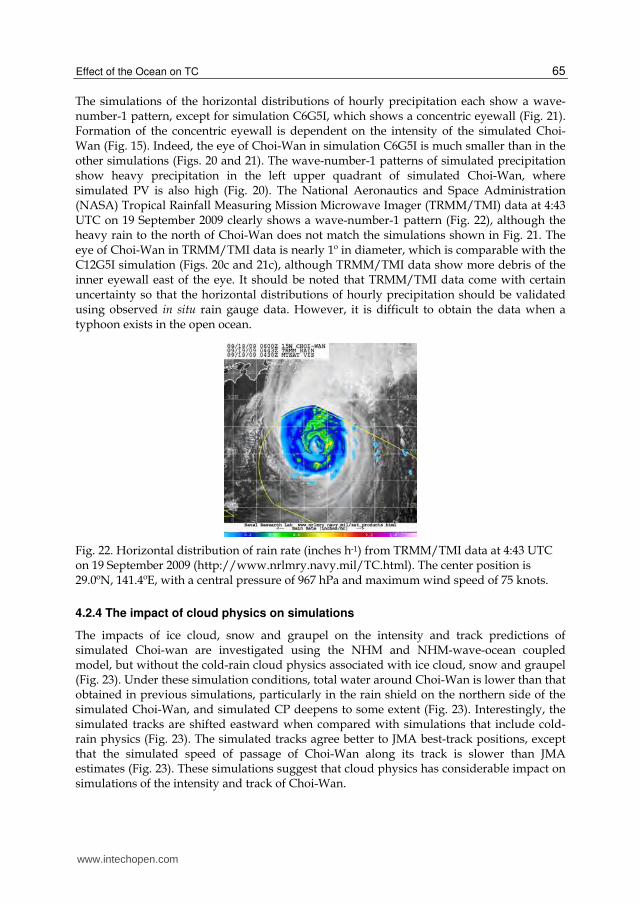
The horizontal distributions of initial SST obtained from oceanic reanalysis data with horizontal grid spacings of 0.5 º and 0.1º are clearly different around the center of Choi-Wan and in the Kuroshio Extension area. The data with a horizontal grid spacing of 0.1º resolve both the Kuroshio meander and warm-eddy structure around the Kuroshio Extension (Fig. 19). Both datasets reproduce the latitudinal SST front along 35ºN, indicating that synoptic oceanic features are almost the same for both SST fields.
(a) (b)
(a) (b)
www.intechopen.com
Effect of the Ocean on TC
63
Fig. 19. Horizontal distributions of initial SST derived from oceanic reanalysis data with horizontal grid spacing of (a) 0.5º and (b) 0.1º. Contours show initial sea-level pressure.
These results indicate that the impacts of these two pre-existing oceanic environment datasets on the evolution of simulated CP are different, but the difference is considerably smaller than that obtained using GA and JCDAS atmospheric environment data (Fig. 15). The pre-existing oceanic environment dataset used has no noticeable effect on track predictions (Fig. 16).
4.2.3 The impact of horizontal resolution on simulations
Horizontal resolutions of 6 and 12 km show marked differences in the simulated evolution of CP when GA data are used for initial and lateral-boundary atmospheric conditions, but little difference when using JCDAS data (Fig. 15). Horizontal resolution has no impact on track prediction, as is also the case for choice of pre-existing oceanic environment (Fig. 16).
Differences of simulations of the structure of Choi-wan at the mature phase for horizontal resolutions of 6 and 12 km are investigated by considering the simulated horizontal distribution of PV at 1500 m altitude (Fig. 20) and that of hourly precipitation at the surface (Fig. 21). Each of the horizontal distributions of PV (Fig. 20) shows horizontal annular distributions about the center of the simulated Choi-Wan. PV is greatest for simulation C6G5I, but the PVs of simulations C6J5I and C12J5I are similar, indicating that PV near the center of the simulated Choi-Wan is not necessarily dependent on horizontal resolution.
However, the PV distributions of simulations C6G5I and C6J5I show more detailed structure, such as mesovortices within the spiral bands, than those of simulations C12G5I and C12J5I. Differences are notable in the size of horizontal annular distributions about the center of the simulated Choi-Wan among the four simulations shown in Fig. 20. For example, simulation C6G5I produces a small, compact PV pattern, whereas that of simulation C12J5I is considerably larger. These results indicate that the size of the simulated Choi-Wan is influenced by horizontal resolution as well as by the pre-existing atmospheric environment.
(a) (b)
www.intechopen.com
Atmospheric Model Applications
64
Fig. 20. Horizontal distributions of PV at 1500 m altitude at 60 h (12:00 UTC on 19 September 2009) for simulations (a) C6G5I, (b) C6J5I, (c) C12G5I, and (d) C12J5I.
Fig. 21. Horizontal distribution of precipitation (mm h-1) at the surface at 60 h (12:00 UTC on 19 September 2009) for simulations (a) C6G5I, (b) C6J5I, (c) C12G5I, and (d) C12J5I.
(a) (c)
(b) (d)
(a) (c)
(b) (d)
www.intechopen.com
Effect of the Ocean on TC
65
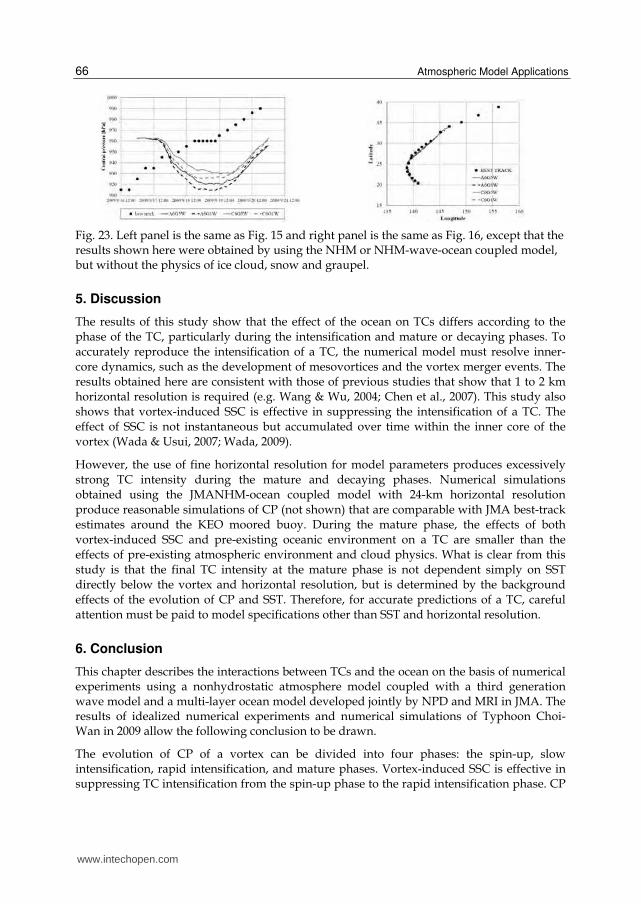
The simulations of the horizontal distributions of hourly precipitation each show a wave-number-1 pattern, except for simulation C6G5I, which shows a concentric eyewall (Fig. 21). Formation of the concentric eyewall is dependent on the intensity of the simulated Choi-Wan (Fig. 15). Indeed, the eye of Choi-Wan in simulation C6G5I is much smaller than in the other simulations (Figs. 20 and 21). The wave-number-1 patterns of simulated precipitation show heavy precipitation in the left upper quadrant of simulated Choi-Wan, where simulated PV is also high (Fig. 20). The National Aeronautics and Space Administration (NASA) Tropical Rainfall Measuring Mission Microwave Imager (TRMM/TMI) data at 4:43 UTC on 19 September 2009 clearly shows a wave-number-1 pattern (Fig. 22), although the heavy rain to the north of Choi-Wan does not match the simulations shown in Fig. 21. The eye of Choi-Wan in TRMM/TMI data is nearly 1º in diameter, which is comparable with the C12G5I simulation (Figs. 20c and 21c), although TRMM/TMI data show more debris of the inner eyewall east of the eye. It should be noted that TRMM/TMI data come with certain uncertainty so that the horizontal distributions of hourly precipitation should be validated using observed in situ rain gauge data. However, it is difficult to obtain the data when a typhoon exists in the open ocean.
Fig. 22. Horizontal distribution of rain rate (inches h-1) from TRMM/TMI data at 4:43 UTC on 19 September 2009 (http://www.nrlmry.navy.mil/TC.html). The center position is 29.0ºN, 141.4ºE, with a central pressure of 967 hPa and maximum wind speed of 75 knots.
4.2.4 The impact of cloud physics on simulations
The impacts of ice cloud, snow and graupel on the intensity and track predictions of simulated Choi-wan are investigated using the NHM and NHM-wave-ocean coupled model, but without the cold-rain cloud physics associated with ice cloud, snow and graupel (Fig. 23). Under these simulation conditions, total water around Choi-Wan is lower than that obtained in previous simulations, particularly in the rain shield on the northern side of the simulated Choi-Wan, and simulated CP deepens to some extent (Fig. 23). Interestingly, the simulated tracks are shifted eastward when compared with simulations that include cold-rain physics (Fig. 23). The simulated tracks agree better to JMA best-track positions, except that the simulated speed of passage of Choi-Wan along its track is slower than JMA estimates (Fig. 23). These simulations suggest that cloud physics has considerable impact on simulations of the intensity and track of Choi-Wan.
www.intechopen.com
Atmospheric Model Applications
66
Fig. 23. Left panel is the same as Fig. 15 and right panel is the same as Fig. 16, except that the results shown here were obtained by using the NHM or NHM-wave-ocean coupled model, but without the physics of ice cloud, snow and graupel.
5. Discussion
The results of this study show that the effect of the ocean on TCs differs according to the phase of the TC, particularly during the intensification and mature or decaying phases. To accurately reproduce the intensification of a TC, the numerical model must resolve inner-core dynamics, such as the development of mesovortices and the vortex merger events. The results obtained here are consistent with those of previous studies that show that 1 to 2 km horizontal resolution is required (e.g. Wang & Wu, 2004; Chen et al., 2007). This study also shows that vortex-induced SSC is effective in suppressing the intensification of a TC. The effect of SSC is not instantaneous but accumulated over time within the inner core of the vortex (Wada & Usui, 2007; Wada, 2009).
However, the use of fine horizontal resolution for model parameters produces excessively strong TC intensity during the mature and decaying phases. Numerical simulations obtained using the JMANHM-ocean coupled model with 24-km horizontal resolution produce reasonable simulations of CP (not shown) that are comparable with JMA best-track estimates around the KEO moored buoy. During the mature phase, the effects of both vortex-induced SSC and pre-existing oceanic environment on a TC are smaller than the effects of pre-existing atmospheric environment and cloud physics. What is clear from this study is that the final TC intensity at the mature phase is not dependent simply on SST directly below the vortex and horizontal resolution, but is determined by the background effects of the evolution of CP and SST. Therefore, for accurate predictions of a TC, careful attention must be paid to model specifications other than SST and horizontal resolution.
6. Conclusion
This chapter describes the interactions between TCs and the ocean on the basis of numerical experiments using a nonhydrostatic atmosphere model coupled with a third generation wave model and a multi-layer ocean model developed jointly by NPD and MRI in JMA. The results of idealized numerical experiments and numerical simulations of Typhoon Choi-Wan in 2009 allow the following conclusion to be drawn.
The evolution of CP of a vortex can be divided into four phases: the spin-up, slow intensification, rapid intensification, and mature phases. Vortex-induced SSC is effective in suppressing TC intensification from the spin-up phase to the rapid intensification phase. CP
www.intechopen.com
Effect of the Ocean on TC
67
evolution is thus sensitive to vertical turbulent mixing in the oceanic mixed layer caused by breaking surface waves. In contrast, the effects of processes in the surface-boundary and planetary-boundary layers are found in the relationship between MCP and MWS, although the impact of these on TC intensity and intensification is smaller than that of vortex-induced SSC. After formation of the annular ring within the inner core of the vortex, TC intensity is less sensitive to vortex-induced SSC. Budget analysis of AAM averaged over a 120 km x 120 km square at the center of the computational domain shows that vortex-induced SSC is effective in decreasing AAM due to vertical advection and stretching. This decrease leads to decay of the acceleration of vortex intensification and affects adiabatic heating processes in the upper troposphere.
Numerical simulations of Choi-Wan show that the effects of Choi-Wan-induced SSC and pre-existing oceanic conditions on simulations of TC track and intensity are smaller than those of pre-existing atmospheric conditions and cloud physics. Fine horizontal resolution of model parameters provides excessive simulations of TC intensity for the mature and decaying phases. Even though the excessive simulations of TC intensity are reduced by the effect of Choi-Wan-induced SSC, the improvement may have led to the simulation of excessive SSC induced by the passage of Choi-Wan. These results suggest that a model parameter, horizontal resolution of 1 to 2 km, is not always needed for TC simulations at the mature and decaying phases, or that both the atmosphere-wave-ocean coupled model and atmospheric reanalysis data will require further development.
7. Acknowledgment
This work was supported by the Japan Society for the Promotion of Science (JSPS) through the Grant-in-Aid for Scientific Research (C) (22540454) and by the Japanese Ministry of Education, Culture, Sports, Science and Technology (MEXT) under Grant-in-Aid for Scientific Research on Innovative Areas #2205 (in proposed research area 23106505).
8. References
Bender, M. & Ginis, I. (2000). Real-time simulation of hurricane-ocean interaction. Monthly Weather Review, Vol.128, pp. 917-946.
Bond, N. A.; Cronin, M. F.; Sabine, C.; Kawai, Y.; Ichikawa, H.; Freitag, P. & Ronnholm, K. (2011). Upper ocean response to Typhoon Choi-Wan as measured by the Kuroshio Extension Observatory mooring. Journal of Geophysical Research, Vol. 116, C02031.
Chen, S. S.; Price, J. F.; Zhao, W.; Donelan, D. A. & Walsh, E. J. (2007). The CBLAST-Hurricane program and the next-generation fully coupled atmosphere-wave-ocean models for hurricane research and prediction. Bulletin of American Meteorological Society, Vol. 88, pp.311-317.
Deardorff, J. W. (1980). Stratocumulus-capped mixed layers derived from a three-dimensional model. Boundary-Layer Meteorology, Vol. 18, pp.495-527.
Deardorff, J. W. (1983). A multi-limit mixed-layer entrainment formulation. Journal of Physical Oceanography, Vol.13, pp. 988-1002.
Donelan, M. A.; Haus, B. K.; Reul, N.; Plant, W. J.; Stiassnie, M.; Graber, H. C.; Brown, O. B. & Saltzman, E. S. (2004). On the limiting aerodynamic roughness of the ocean in very high winds. Geophysical Research Letters, Vol.31, L18306.
www.intechopen.com
Atmospheric Model Applications
68
Emanuel, K. A., (1986). An air-sea interaction theory for tropical cyclones. Part I: Steady-state maintenance. Journal of the Atmospheric Sciences. Vol.43, pp. 585-604.
Ginis, I., (1995). Ocean response to tropical cyclone. In: Global Perspective on Tropical Cyclones, Elsberry, R. L., pp. 198-260. World Meteorological Organization, Geneva, Switzerland.
Klemp, J. B. & Wilhelmson R. B. (1978). The simulation of three-dimensional convective storm dynamics. Journal of the Atmospheric Sciences. Vol.35, pp. 1070-1096.
Kondo, J. (1975). Air-sea bulk transfer coefficients in diabatic conditions. Boundary-Layer Meteorology, Vol. 9, pp.91-112.
Lin, Y. G.; Farley, R. D. & Orville, H. D. (1983). Bulk parameterization of the snow field in a cloud model. Journal of Climate and Applied Meteorology, Vol.22, pp.1065-1092.
Palmén, E. (1948). On the formation and structure of tropical cyclones. Geophysica, Vol. 3, pp. 26-38.
Powell, M. D.; Vickery, P. J. & Reinhold, T. A. (2003). Reduced drag coefficient for high wind speeds in tropical cyclones. Nature, Vol. 422, pp. 279-283.
Smith, R. K.; Montgomery, M. T. & Vogl, S. (2008). A critique of Emanuel’s hurricane model and potential intensity theory. Quarterly Journal of Royal Meteorological Society, Vol. 134, pp. 551-561.
Sugi, M.; Kuma, K.; Tada, K.; Tamita, K.; Hasegawa, N.; Iwasaki, T.; Yamada, S. & Kitade, T. (1990). Description and performance of the JMA operational global spectral model (JMA-GSM88). Geophysical Magazine, Vol. 43, pp.105-130.
Taylor, P. K. & Yelland, M. J. (2001). The dependence of sea surface roughness on the height and steepness of the waves. Journal of Physical Oceanography, Vol.31, pp. 572-590.
Usui, N.; Ishizaki S.; Fujii Y.; Tsujino H.; Yasuda T. & Kamachi M. (2006). Meteorological Research Institute multivariate ocean variational estimation (MOVE) system: Some early results. Advances in Space Research, Vol. 37, pp.896-822.
Wada, A. (2007). Numerical problems associated with tropical cyclone intensity prediction using a sophisticated coupled typhoon-ocean model. Papers in Meteorology and Geophysics, Vol. 58, pp.103-126.
Wada, A. & Usui, N. (2007). Importance of tropical cyclone heat potential for tropical cyclone intensity and intensification in the Western North Pacific. Journal of Oceanography, Vol.63, pp.427-447.
Wada, A. (2009). Idealized numerical experiments associated with the intensity and rapid intensification of stationary tropical cyclone-like vortex and its relation to initial sea-surface temperature and vortex-induced sea-surface cooling. Journal of Geophysical Research, Vol. 114, D18111.
Wada, A.; Niino, H. & Nakano, H. (2009). Roles of vertical turbulent mixing in the ocean response to Typhoon Rex (1998). Journal of Oceanography, Vol.65, pp. 373-396.
Wada, A. (2010). Tropical-cyclone-ocean interaction: Climatology. In: Advances in Energy Research. Volume 1, pp. 99-132, Acosta M. J., NOVA Publishers, ISBN:978-1-61668-994-0.
Wada, A. & Usui, N. (2010). Impacts of Oceanic preexisting conditions on predictions of Typhoon Hai-Tang in 2005. Advances in Meteorology, Vol. 2010, 756071.
Wada, A.; Kohno, N. & Kawai, Y. (2010). Impact of wave-ocean interaction on Typhoon Hai-Tang in 2005. Scientific Online Letters on the Atmosphere, Vol. 6A, pp.13-16.
Wang, Y. & Wu, C.-C. (2004). Current understanding of tropical cyclone structure and intensity change – a review. Meteorological and Atmospheric Physics, Vol. 87, pp.257-278.
www.intechopen.com
Atmospheric Model ApplicationsEdited by Dr. Ismail Yucel
ISBN 978-953-51-0488-9Hard cover, 296 pagesPublisher InTechPublished online 04, April, 2012Published in print edition April, 2012
InTech ChinaUnit 405, Office Block, Hotel Equatorial Shanghai No.65, Yan An Road (West), Shanghai, 200040, China
Phone: +86-21-62489820 Fax: +86-21-62489821
This book covers comprehensive text and reference work on atmospheric models for methods of numericalmodeling and important related areas of data assimilation and predictability. It incorporates various aspects ofenvironmental computer modeling including an historical overview of the subject, approximations to landsurface and atmospheric physics and dynamics, radiative transfer and applications in satellite remote sensing,and data assimilation. With individual chapters authored by eminent professionals in their respective topics,Advanced Topics in application of atmospheric models try to provide in-depth guidance on some of the keyapplied in atmospheric models for scientists and modelers.
How to referenceIn order to correctly reference this scholarly work, feel free to copy and paste the following:
Akiyoshi Wada (2012). Numerical Study on the Effect of the Ocean on Tropical-Cyclone Intensity andStructural Change, Atmospheric Model Applications, Dr. Ismail Yucel (Ed.), ISBN: 978-953-51-0488-9, InTech,Available from: http://www.intechopen.com/books/atmospheric-model-applications/numerical-study-on-the-effect-of-the-ocean-on-tropical-cyclone-intensity-and-structural-change