Numerical test for singleconcrete armour layeron breakwatersEleni Anastasaki PhDCoastal and Maritime Engineer, Imperial College London (ICL), London, UK(corresponding author: [email protected])
John-Paul Latham PhD, CGeolReader, Department of Earth Science and Engineering, Imperial CollegeLondon (ICL), London, UK
Jiansheng Xiang PhDResearch Fellow, Department of Earth Science and Engineering,Imperial College London (ICL), London, UK
The ability of concrete armour units for breakwaters to interlock and form an integral single layer is important for
withstanding severe wave conditions. In reality, displacements take place under wave loading, whether they are
small and insignificant or large and representing serious structural damage. In this work, a code that combines finite-
and discrete-element methods which can simulate motion and interaction among units was used to conduct a
numerical investigation. Various concrete armour layer structures were built using a carefully researched placement
technique and then subjected to a boundary vibration. By analysing the displacements and assessing the number of
units that were displaced by more than one-third their nominal size, the numerical test programme indicated clearly
that the initial build packing density was the most important parameter influencing the stability of concrete armour
layers under vibration. The size of the underlayer rock and the type of unit also affected the numerical performance
of the single-layer concrete armour systems under vibration. The results presented are for full-scale systems and
therefore add further insights into simple laboratory ‘shake tests’, although the oscillatory loading in this study is
acknowledged to be profoundly different to wave action.
Notationcf coefficient of frictioncfnp coefficient of friction for numerical placementD net downslope displacements of units after vibration (m)Dh horizontal distance between units in a row (m)Dn nominal size of the unit (i.e. cube root of the unit’s
volume) (m)Dv upslope/downslope distance of units between rows (m)H characteristic height of the unit (m)N number of vibration cyclesNmax maximum number of vibration cycles before a loss of
single-layer integrity observedVxy maximum velocity in the upslope direction, in (m/s) of
the sinusoidally displaced boundary vibration(xy simply signifies it has components in thehorizontal (x) and vertical (y) directions)
Wa/Wr armour unit weight divided by underlayer rock weight
1. IntroductionConcrete armour layers have been extensively investigated sincetheir introduction in the construction of breakwaters as aninnovative alternative to quarried rock. However, their designstill relies on empirical formulae in current design codes – for
example, CIRIA/CUR/CETMEF (2007) and the US CoastalEngineering Manual (USACE, 2002) – or in the specific con-crete unit designer’s manual where special placement methodsand packing densities are given as additional vital criteriafor acceptable practice with the unit. Physical modelling of theproposed structure together with experience from previous prac-tice is considered essential for structures with significant capitalcost. Although the hydraulic performance of concrete armourlayers can be studied experimentally, the way the units areplaced, interact and behave as a whole system is not yet wellunderstood and certainly not at full scale. Numerical methodsmay overcome some of the limitations of physical models andprovide the opportunity to investigate some of the properties ofconcrete armour layers with different ‘as-built’ geometry charac-teristics that could most beneficially be under greater control ofthe designer if provided with greater knowledge. Following onfrom a previous study by the authors, the long-term aim isto provide a numerical tool that complements or replaces lab-oratory experiments. Here, the focus is to accommodate stochas-tic variability in the armour layer response to an oscillatoryloading more realistically than hitherto, and later to adapt themethods step-by-step to the hydraulic context of breakwaterdesign.
174
Maritime EngineeringVolume 169 Issue MA4
Numerical test for single concrete armourlayer on breakwatersAnastasaki, Latham and Xiang
Proceedings of the Institution of Civil EngineersMaritime Engineering 169 December 2016 Issue MA4Pages 174–187 http://dx.doi.org/10.1680/jmaen.2014.25Paper 201425Received 15/01/2015 Accepted 07/10/2016Published online 10/11/2016Keywords: coastal engineering/mathematical modelling/sea defences
In this study, a numerical methodology that combinesthe finite-element method and the discrete-element method,named FemDem, is used. The research code used in thisstudy employs similar methods to the ‘Y3D’ code developedby Jiansheng Xiang, which subjected to verification test cases(Xiang et al., 2009). It is launched on the VGeST website(VGeST, 2009). It now provides the foundation for numericalmodelling of concrete armour layers (Xiang et al., 2012) andhas many additional features such as a three-dimensional frac-ture model (Guo et al., 2015). The gigantic and complex-shaped concrete units can be represented in detail togetherwith their mechanical interactions at full scale (i.e. with proto-type dimensions). It also allows for these systems of units to beboth built and analysed with a new set of methods and toolscustomised for coastal structure applications (Anastasaki et al.,2015; Latham et al., 2013).
Although the multi-body solids code has been coupled withthe powerful multi-purpose fluids code ‘Fluidity’ (Viré et al.,2012), further research is needed either to add numerical wavetank capability to ‘Fluidity’ or to fully couple the FemDemsolver code with other general-purpose computational fluiddynamics codes, which poses the type of ‘numerical wavetank tool box’ required for wave–structure interactions – forexample, OpenFoam (Higuera et al., 2013; Jensen et al., 2014;Richardson et al., 2013), Flow3D (Dentale et al., 2009, 2015).By applying vibration to the foundation of the armour layer (inthis case the breakwater underlayer and toe row of units), theconcrete units can be subjected to a disturbance of controlledintensity.
A major preliminary part of this research on armour layersimulation was devoted to the development of a methodfor the numerical placement of CORE-LOC units (referredto in this paper as Core-Loc or CL) on a single layer of abreakwater as first described by Anastasaki et al. (2013) andLatham et al. (2013) and further illustrated by Anastasakiet al. (2015). The placement method was designed so that itcould be applied to all types of single-layer concrete units forwhich an ‘irregular’ placement pattern, in terms of orientationsand interlocking, is critical or high priority for the conceptunderlying the unit’s design. It may also have practical use ifthe numerical placement configuration is found to be a simpleand effective one to adopt for orienting units during crane-operated construction of real breakwaters on site.
The new placement method (Anastasaki et al., 2015) wasapplied to the creation of a single armour layer consisting of21 rows (including the toe row) of Core-Loc units of 8 m3 witha target average dimensionless packing density (PD) of 0·60and where the ratio of the average armour unit size to the sizeof the underlayer rocks was Wa/Wr = 10. In this work, thiscombination of design parameters is taken as the reference
armour layer. It is presented in Figure 1. In recent years, agrowing set of analysis tools has also been developed for theextraction of useful information about the performance ofsuch layer systems, including a new method for the accuratecalculation of PD on a local (per unit or per row) basis(Anastasaki et al., 2015; Latham et al., 2013).
To compare performance, all the different armour layers weretested under vibration conditions. For this study, the vibrationconditions were as follows: vibration was applied parallel tothe slope direction (termed x′) with an upslope and downslopeboundary displacement and with maximum vibration velocityVx′=5 m/s and vibration frequency= 2·5 Hz. When applyingvibration, the boundary geometry that is moved as a rigidfoundation with prescribed oscillatory velocity includes therock underlayer, the side-walls and the toe row while theunits are left free to respond, which is the point of the tests.In contrast to previous work (Anastasaki et al., 2015), whereconcrete armour layers were subjected to a ‘mild vibration’ often cycles, the vibration cycling in this work was applied con-tinuously up to the stage when the concrete armour layer
3 10
4 6 8
Contact number
y
xz
Figure 1. Concrete armour layer consisting of 20 rows of
Core-Loc units of 8 m3 (and a toe row of units) numerically
created with PD=0·601 (reference case). The coordination
number (CN) of units (i.e. number of contacts with neighbouring
solids) is illustrated
175
Maritime EngineeringVolume 169 Issue MA4
Numerical test for single concrete armourlayer on breakwatersAnastasaki, Latham and Xiang
reached a maximum placement density for which the layerintegrity remained intact. This is by analogy with the ‘nodamage criterion’ that is applied in the new generation ofsingle-layer concrete armour unit systems.
Having developed the numerical unit placement and vibrationmethods, which were presented in detail by Anastasaki et al.(2015), in this work, single-layer concrete armour layers withdifferent characteristics such as PD, underlayer roughness andunit type form the basis of the numerical study. The effects ofvarying these characteristics on the performance under avibration disturbance are investigated. The numerical modeltests are presented in Section 2. Results are discussed inSection 3. The different armour layers are analysed mainly interms of centroid positioning, from which measures of displa-cement are derived together with details of how the PDevolves during vibration cycles. In some cases, the averagecoordination number (CN) (average number of contacts eachunit makes with the neighbouring units) provides a meaningfulparameter to illustrate mechanical tightening of the layer.Section 3 introduces the tests with ACCROPODE II units(referred to in this paper as Accropode II or AS) and this isfollowed with a discussion of the responses under vibrationtogether with concluding remarks.
2. Numerical model testsThe performance of concrete armour layers with differentPDs, underlayer and shape characteristics was investigated asfollows.
2.1 Relative performance as a function of PDSeveral additional armour layers of 20 rows were numericallyconstructed to supplement those reported by Anastasaki et al.(2015). Due to the staggered pattern this can be written as20 rows� 12 (11) columns. The same size units (8 m3) were
placed on the same rough underlayer (with armour to rockunit weight ratio of Wa/Wr = 10) but with different horizontaland upslope spacing design grid (Dh and Dv) and/or differentinitial numerical coefficient of friction during numerical place-ment (cfnp values, see Anastasaki et al. (2015)). In all cases,units were brought to rest with a friction coefficient cf = 0·9,regarded to be a possibly reasonable estimate for prototypescenarios although lower values are possible for wet smoothconcrete (see Latham et al. (2013) and Mohamad et al. (2015)for discussion and experimental data). The seven resultingPDs are listed together with the input design parameters inTable 1.
2.2 Relative performance as a function of the sizeof the underlayer
One underlayer numerical model was created by packingrealistic rock shapes on the slope and thereafter linear dimen-sional scaling was applied to this underlayer model to produceunderlayers with different sizes of rocks. The choice of exactscaling requires careful consideration in order to provide ameaningful test range to investigate the effect of armour tounderlayer mass ratio in isolation from other factors. Theunderlayer of the reference case (with Wa/Wr = 10) was suitablefor the placement of exactly 12 Core-Loc units on each row(actually 11 on each alternate row) between the side-walls.Key to setting the scaling factor was the requirement thatwhen placing the 8 m3 units in rows and columns, the units inthe first and last columns should fit snugly against the side-walls. This helped to ensure that no model would be moreprone to a ‘side-wall collapse’ than any of the others. In thisway, the different numbers of units per row for the fournew models were: 13 (12) units, 14 (13), 11 (10) and 10 (9).Note that alternate rows were designed to have one unit less,as signified by the lower number in brackets (a good exampleof this alternating number of units per row is also plain to see
Tests of different PDs Design grid of positions of units
Friction coefficient forthe numericalplacement of units, cfnp
in the placement pattern of Accropode II (AS) units shown inFigure 8). The scaling factors chosen to give these preciseinteger values for number of units per row, while retaining thesnug fit requirement, were determined by a combination of cal-culation and model application. The five models thus con-structed gave a test series with a range of Wa/Wr from 6·9to 19, as shown in Table 2. The vibration energy applied wasthe same regardless of the extent to which the underlayer hadbeen re-scaled. Therefore, the five models created and dis-turbed with this scaling methodology can provide a compari-son for a study of underlayer size effects even though theunderlayers were built with the same geometric model.
2.3 Relative performance of Core-Loc andAccropode II layers
Tests were conducted using the placement of Accropode II,both the standard form with and modified form without ‘sacri-ficial friction studs’ (tests AS and AM, respectively). For theplacement of a different unit type, the initial target distancesbetween units were: Dh = 1·10H and Dv = 0·55H. Four differenttypes of orientations – two with axes normal to the slope andtwo which are oblique – were selected for this type of unit inorder to apply the placement method presented by Anastasakiet al. (2015). The units enter the domain and fall verticallywith the initial friction coefficient cfnp = 0·25. Then, they arebrought to rest with cf = 0·9. The resulting PD values for eachof the armour layers AS and AM are presented in Table 3.
2.4 Test programmeThe test programme and selected results are presented inTable 3. Once the different concrete armour layers werenumerically created they were vibrated under the same con-ditions (maximum velocity Vxy=5 m/s and frequency 2·5 Hz)in the plane of the armour layer (up and down the slope).Typically, increments of ten vibration cycles were applied andthen the models were analysed. Further vibration cycles werefound to lead to tighter packs but only up to a critical periodin the layer’s evolution when further vibration led to the start
of deterioration of layer integrity. This stage was approximatelycaptured to within the nearest ten cycles, as denoted by Nmax
in Table 3. Nmax is determined for each different armour layerwhen it has been transformed to a very tight pack but has notlost the main functions of a single concrete armour layer –
that is, it is determined semi-quantitatively (see further discus-sion in the last paragraph of Section 3.1). This is the‘maximum’ PD that a particular armour layer can reach.
For all the tests, the characteristics of the armour layers testedtogether with the results, in terms of average PD beforevibration and the maximum number of vibration cycles (Nmax)needed to achieve a ‘maximum’ PD after vibration are pre-sented in Table 3. The performance of the armour layer is alsodescribed in terms of the unit downslope displacement distance(D) normalised by the nominal size of units (Dn), D/Dn.A stability measure can be defined by setting a ‘safe’ displace-ment threshold D/Dn < 0·3 and counting the proportion ofunits that are ‘safe’ in the sense that their centroids are dis-placed less that this ‘acceptable’ value. The safe displacementnumber or safe displacement percentage (SDP) is the numberor percentage of units with D/Dn < 0·3. The SDP describes aform of relative stability for a given disturbance and is used inthis paper to compare performance in terms of displacements.Values for D/Dn < 0·5 are discussed later in the paper and arealso presented in Table 3.
3. Results analysisTests for the first series are named with the following conven-tion: the test identifier letters refer to the unit type – forexample, CL is for Core-Loc, AS is for Accropode II standardgeometry and AM is for a specially modified geometry ofAccropode II. This is followed by a number representing thePD before the vibration and then the weight ratio between thearmour and the underlayer Wa/Wr. Note that the resultsreported in this paper do not represent values that would beobserved on site (or in the laboratory) for a hydraulic waveloading but might well be matched by a shake test. Forexample, wave action is focused at still water level whereasthe response to vibration is an approximately even downslopejostling with maximum movements at the top and zero at afixed toe. However, since the methods used for the creationand analysis of the different armour layers are all the same,the influence of their characteristics on performance undervibration can be cautiously compared as a possible indicatorto rank design variables.
3.1 Armour layers of different initial PDIn addition to the reference armour layer (CL_0·601), twotests started looser (CL_0·584 and CL_0·594) and four starteddenser (CL_0·604, CL_0·618, CL_0·628 and CL_0·631)making seven layers of different PDs in all. These structuresare heterogeneous and perform differently under disturbance.
Wa/Wr
Planned number of units perrow (alternate rows have one
fewer unit, as shown)Scaling factors forthe underlayer
In general, due to the vibration applied in the upslope anddownslope directions, units move mainly downwards and findnew tighter positions, resulting in an increase in PD which ismore significant in the lower part of the armour layer thanin the upper part. This is shown in Figure 2, which comparesthe average per row PD before and after vibration for thePD=0·628 case and the reference case PD=0·601. Most ofthe armour layers reached a maximum PD value of around0·64 before losing their single-layer integrity, but after slightlydifferent periods of vibration (Table 3). Understandably, the
loose packs need more vibration cycles than the tight ones totighten up to a given new PD. This may be an indication ofthe better performance of the denser armour layers comparedwith the looser ones. However, this is not necessarily always thecase. Each unique armour layer, irrespective of its difference orsimilarity in average initial PD, was found to perform differ-ently. One immediately obvious way of tracking the behaviouris to assess it in terms of average PD, as in Figure 2. Anotherway is to consider the displacement magnitudes statisticallyusing a measure like SDP for the percentage of ‘safe’ units.
Test nameArmour unittype
Underlayer rockweight, Wr (Wa is theweight of the armour
cf = 0·9 in all cases except the last test in the first series; for the second test in the second series, the tightest packing before lossof integrity was pinpointed more accurately at 38 cycles.
Table 3. Numerical simulation test programme and results after
vibration of the concrete armour layers with 8 m3 concrete units
(bold font represents the reference armour layer)
178
Maritime EngineeringVolume 169 Issue MA4
Numerical test for single concrete armourlayer on breakwatersAnastasaki, Latham and Xiang
In general, the looser the initial pack, the larger were thetypical displacements of units. Regarding the number of unitswith safe displacements, the best performance was achievedwith the tightest pack of units, CL_0·631 (SDP=94%, i.e. 94%of units moved by D/Dn < 0·3) followed by CL_0·628(SDP=74%) and CL_0·618 (SDP=51%). For the cases ofPD equal to 0·601, 0·604 and 0·594, the values dropped to24, 22 and 19%, respectively. For the very loose pack test(CL_0·584) at the early stage where compaction had reachedonly PD=0·612, already, only a few units had safe displace-ments (SDP=26%) and further vibrations caused numericalextractions to occur (i.e. where units are lifted in order to sitabove the main layer).
A new method of visualising such results without limitingoneself to the precise threshold of D/Dn < 0·3 is presented inFigure 3, where the range of displacements of units indicatedby different threshold levels is illustrated row by row. It is con-firmed that the denser the armour layers, the less significantare the displacements of units as assessed by all the thresholdvalues. In this plot, the height in the structure – that is, rownumbers with high SDP values (many units with D/Dn < 0·3) –can be identified by the light grey areas. Although the refer-ence armour layer (CL_0·601) has almost the same PD value
as CL_0·604, it may be considered marginally more stable dueto the more vibration cycles needed to reach PD=0·640 andthe smaller number of units with the very large displacements(D/Dn > 2). The best performing layers in terms of SDP arethose with the tightest initial packs CL_0·631 and CL_0·628.In the CL_0·618 test, there were a few units with displacementsD/Dn > 1. However, significant displacements of D/Dn > 2 wereobserved mainly in the looser layer tests, CL_0·604, CL_0·601and CL_0·594. These plots also indicate that the largest displa-cements occurred in the upper rows of the structure, while forthe lower rows the movements of units may be considered onthe safe side.
The performance of an armour layer may also be related tothe ‘quality’ of the placement of units. In this paper, the stat-istics for the number of contacts each unit makes with itsneighbour (CN) is considered an indication of the effectivenessof interlocking. Figure 4 highlights the profoundly differentproperties of the 0·584 pack compared with the others.Furthermore, the sequence of PD curves is found to shift insubtle ways as the curves cross each other – a portent that be-haviour may not simply follow the initial PD in a predictableway. Reassuringly, the results strongly confirm that the denserthe pack, the further the cumulative curve shifts to the right,resulting in a larger proportion of high CN values. Figure 5presents a cumulative frequency plot showing the spread of dis-placements after vibration to varying degrees needed for thatstructure to arrive at its limit of stability. Here, the curvesfurther to the left indicate the least mobile armour layers sothat the resulting data support the general conclusion that thelarger the initial PD of the armour system, the less vulnerableis the structure. The variation from this trend can be linked tomodels being run to different numbers of vibration cycles andthe natural variability that exists when two different layers arecreated with a similar average PD. The trend in CN statisticsgiven in Figure 4 approximately follows the displacement stat-istics given in Figure 5 for the stability performance of thearmour layers. Note that the D/Dn < 0·3 threshold appears tobe a very good discriminator for defining the stability indicatorSDP for the higher density packs but not for the lower ones,while D/Dn < 0·5 is perhaps capturing the entire range ofresponses most evenly.
The above discussion of results focused on vibration test runswhere, irrespective of the number of vibration cycles, the PDvalue signifying the beginning of single-layer integrity loss was0·64. However, there were two cases of simulated armourlayers where, before unit extraction and integrity loss were indi-cated, a very tight final PD of 0·65 was achieved (these areCL_0·594 after 40 cycles and CL_0·631 after 20 cycles; seeTable 3). Even though it was not within the main scope of thisstudy, in order to find the limiting average PD that an irregulararmour layer (of Core-Loc) can reach after a vibration
0
2
4
6
8
10
12
14
16
18
20
0·5 0·6 0·7
PD
0
2
4
6
8
10
12
14
16
18
20
0·5 0·6 0·7
PD
CL_0·601_10 (initial)
CL_0·601_10 (V50, 0·642)
CL_0·628_10 (initial)
CL_0·628_10 (V20, 0·644)
Row
Row
Figure 2. Effect of vibration on two different average PDs, shown
with PD calculated on a row by row basis. Thin black lines show
initial PD, while thick black lines indicate the PD after vibration.
The graph labelling gives further information – for example,
(V50, 0·642) indicates results were obtained after 50 vibration
cycles, the number of cycles for which the average PD was
determined to be 0·642. The same labelling is adopted in
subsequent figures
179
Maritime EngineeringVolume 169 Issue MA4
Numerical test for single concrete armourlayer on breakwatersAnastasaki, Latham and Xiang
disturbance but without units becoming extracted or squeezedout from the armour layer, the CL_0·631 model was vibratedunder the same conditions (20 cycles) but assigned a very lowCoulomb friction coefficient, cf = 0·1, to ease the resistance toreposition rotating and sliding movement of units. The armourlayer was transformed to an extremely tight pack with aPD=0·663. It has been suggested (W. F. Baird, personal com-munication, 2012) that an average PD value of 0·66 has alsobeen observed/deduced in a field survey and/or a laboratorysurvey after wave disturbance conditions and without clearsigns of layer integrity loss. However, whether the integritywithin one layer was retained in such observed cases orwhether the sample area used to calculate the PD had
un-knowingly become extended near the toe remains uncer-tain. It is interesting to speculate that a given unit does have acertain maximum PD for a truly irregular single layer and thatthis may well differ from a regular lattice-patterned placement.It does, however, seem reasonable to speculate that a damagemechanism operating under wave action could be one relatedto a similar one observed in these vibrated numerical testswhich showed a squeezing or buckling action causing unitslocally to rise up and hence become potentially vulnerable.Moreover, an average value higher than 0·66 might well indi-cate that units are not well locked down to the underlayer andmay have an uneven outer enveloping surface with more unitsvulnerable to greater instability.
3.2 Armour layers with different sizeunderlayer rock
How underlayer roughness affects the nature of the placedlayers is now discussed before moving on to the subject of itsresponse to a disturbance. A clear influence of the size ofunderlayer rocks during the placement of units can be seenand the precise results for the average PD of the resultingarmour are given in Table 3. It is worth noting that, for the
second test in this second series, the tightest packing beforeloss of integrity was pinpointed more accurately at 38 cycles,whereas all other results are reported as at 40 cycles. The refer-ence case, PD=0·601, sets the ratio Wa/Wr at 10. When theunderlayer rock sizes are increased, the ratio is decreased, theroughness is relatively greater and the initial PD created duringthe standard placement process decreases (Table 3), as onemight expect. The pack of units placed on the underlayer withthe smallest rock size (with ratio Wa/Wr = 19) became tightwith PD=0·611, while for the largest rocks (Wa/Wr = 6·9) waslower, PD=0·587.
Turning to the effect of vibration disturbance; despite theobservation that smoother underlayers promoted the construc-tion of tighter packs, the performance of the structure in termsof displacements of units after 40 cycles presents a ratherunclear trend (Figure 6) partly because the starting PDs werequite varied. When the rocks of the underlayer are large(Wa/Wr = 6·9), the SDP is larger than for smaller underlayerrock systems, despite the fact the other tests had an initial PDtighter than Wa/Wr = 6·9. The other significant observation isthat, for the smallest underlayer tested Wa/Wr = 19, movementsbetween 1·5Dn and 2Dn were much more common than in theother models (Figure 6).
A clearer expression of the underlayer’s influence can be foundby pairing tests where the initial PDs are nearly the same butwhere, for one test, Wa/Wr is not the reference value of 10(Figure 7). In these plots, the number of vibration cycles are ineach case the same and curves positioned further to the leftrepresent relatively more stable structures. It can be observedthat in all the cases, underlayer rocks larger than the referenceunderlayer with Wr =Wa/10 tend to prevent units from slidingdownslope, causing safer displacements in comparison withthe reference underlayer. When the underlayer rocks aresmaller than the reference size, the curves appear on the right,indicating larger displacements of units. In these cases, anincrease in the PD after disturbance due to the smootherunderlayer is clearly observed.
3.3 Armour layers made with a differenttype of unit
The placement method developed by Anastasaki et al. (2015)was applied to the new generation Accropode II units. Afterexperimentation with a trial and error approach, and in orderto adopt the new placement algorithm, the initial orientationsshown in Figure 8 were selected. A comparison of differenttypes of concrete units is far beyond the scope of this paper.However, one objective was to have an initial study with adifferent type of single-layer concrete unit. Given that theeffect of the ‘studs’, which are a key feature of the AccropodeII unit, is not immediately obvious, another objective was tocompare this unit’s behaviour with studs (AS) and without
0
20
40
60
80
100
0 1·0 2·0 3·0 4·0 5·0 6·0 7·0 8·0 9·0 10·0
Cum
ulat
ive
freq
uenc
y: %
CN
CL_0·584_10
CL_0·594_10
CL_0·601_10
CL_0·604_10
CL_0·618_10
CL_0·628_10
CL_0·631_10
Figure 4. Coordination number for the armour layers numerically
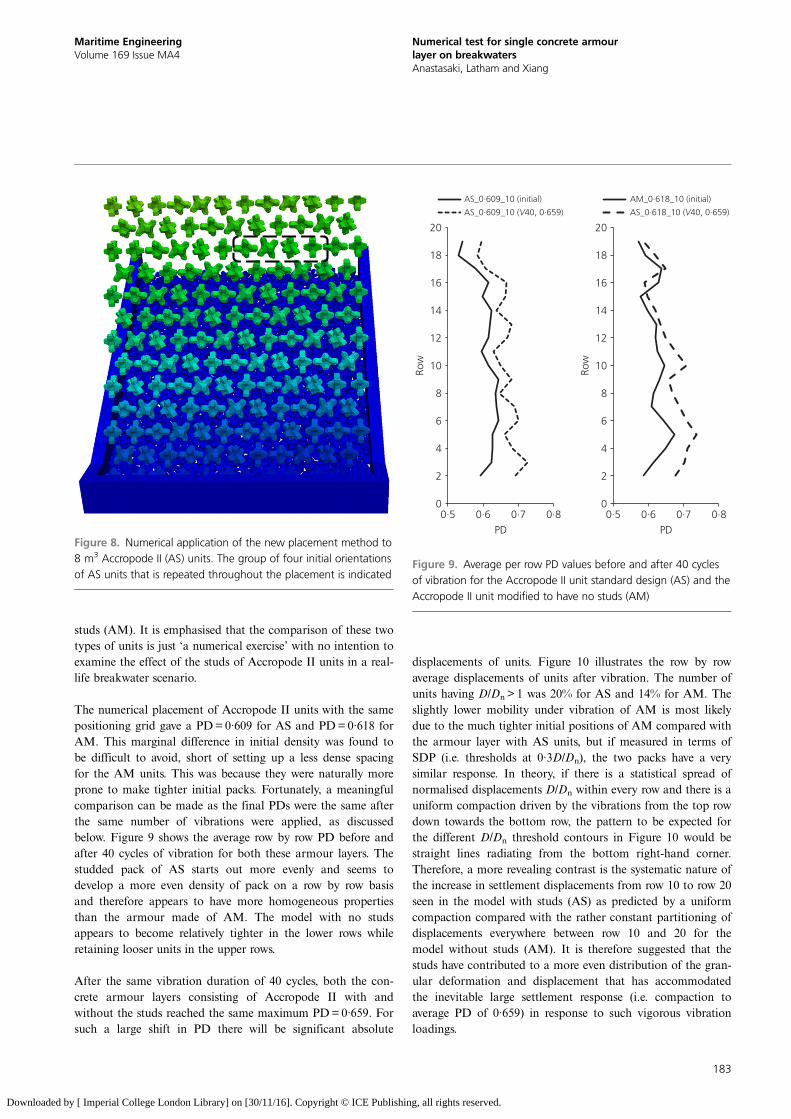
studs (AM). It is emphasised that the comparison of these twotypes of units is just ‘a numerical exercise’ with no intention toexamine the effect of the studs of Accropode II units in a real-life breakwater scenario.
The numerical placement of Accropode II units with the samepositioning grid gave a PD=0·609 for AS and PD=0·618 forAM. This marginal difference in initial density was found tobe difficult to avoid, short of setting up a less dense spacingfor the AM units. This was because they were naturally moreprone to make tighter initial packs. Fortunately, a meaningfulcomparison can be made as the final PDs were the same afterthe same number of vibrations were applied, as discussedbelow. Figure 9 shows the average row by row PD before andafter 40 cycles of vibration for both these armour layers. Thestudded pack of AS starts out more evenly and seems todevelop a more even density of pack on a row by row basisand therefore appears to have more homogeneous propertiesthan the armour made of AM. The model with no studsappears to become relatively tighter in the lower rows whileretaining looser units in the upper rows.
After the same vibration duration of 40 cycles, both the con-crete armour layers consisting of Accropode II with andwithout the studs reached the same maximum PD=0·659. Forsuch a large shift in PD there will be significant absolute
displacements of units. Figure 10 illustrates the row by rowaverage displacements of units after vibration. The number ofunits having D/Dn > 1 was 20% for AS and 14% for AM. Theslightly lower mobility under vibration of AM is most likelydue to the much tighter initial positions of AM compared withthe armour layer with AS units, but if measured in terms ofSDP (i.e. thresholds at 0·3D/Dn), the two packs have a verysimilar response. In theory, if there is a statistical spread ofnormalised displacements D/Dn within every row and there is auniform compaction driven by the vibrations from the top rowdown towards the bottom row, the pattern to be expected forthe different D/Dn threshold contours in Figure 10 would bestraight lines radiating from the bottom right-hand corner.Therefore, a more revealing contrast is the systematic nature ofthe increase in settlement displacements from row 10 to row 20seen in the model with studs (AS) as predicted by a uniformcompaction compared with the rather constant partitioning ofdisplacements everywhere between row 10 and 20 for themodel without studs (AM). It is therefore suggested that thestuds have contributed to a more even distribution of the gran-ular deformation and displacement that has accommodatedthe inevitable large settlement response (i.e. compaction toaverage PD of 0·659) in response to such vigorous vibrationloadings.
0
2
4
6
8
10
12
14
16
18
20
0·5 0·6 0·7 0·8
Row
PD
0
2
4
6
8
10
12
14
16
18
20
0·5 0·6 0·7 0·8
Row
PD
AS_0·609_10 (initial)
AS_0·609_10 (V40, 0·659)
AM_0·618_10 (initial)
AS_0·618_10 (V40, 0·659)
Figure 9. Average per row PD values before and after 40 cycles
of vibration for the Accropode II unit standard design (AS) and the
Accropode II unit modified to have no studs (AM)
Figure 8. Numerical application of the new placement method to
8 m3 Accropode II (AS) units. The group of four initial orientations
of AS units that is repeated throughout the placement is indicated
183
Maritime EngineeringVolume 169 Issue MA4
Numerical test for single concrete armourlayer on breakwatersAnastasaki, Latham and Xiang
4. DiscussionTo provide a graphical means to visualise the relative mobilityor instability of each armour layer system tested, there areseveral options. Simply examining the initial rate of change ofPD with vibration cycles provides very little ability to predictbehavioural differences between packs. Furthermore, the rela-tive ease of the transformation from an initial to a specificfinal desirable tight state is of interest. The statistical distri-bution of the normalised downslope displacements of all units,either presented on a cumulative plot or on an average per rowbasis plot, was considered the best graphical method to illus-trate the relative instability of the various packs.
Large individual unit displacements, which in some cases weretwice the unit nominal size D/Dn > 2, were observed, especiallyat the upper rows of the armour. The average lowering of thetop row after vibration did not exceed the nominal size Dn ofthe armour unit for any of the cases considered.
A single measure of stability, the SDP, was defined. Based on amovement threshold, SDP is the number of units (expressed asa percentage) that move by less than what is considered a safedistance (<0·3Dn). Using the SDP alone in a comparison ofperformance of the tested structures greatly oversimplifies theactual behaviour but provides a potentially suitable means tocompare performance. An SDP based on 0·5D/Dn was foundto tell much the same story. The initial PD is the most sensitivegeometric characteristic of the built layer, and is of first-ordersignificance. The SDP does not discriminate well the differentdamage patterns for each of the four loose structures with PDsbetween 0·584 and 0·604, each having a low SDP of �20.Systematic improvements for the tighter structures when theinitial PD increased from about 0·62 to 0·63 were reflectedin SDP increases from 50 to >80. Trends that might be con-sidered to be of second-order importance are those where,as the weight ratio of armour layer to rock armour increases,the SDP shows that the coarser underlayer (Wa/Wr = 6·9)
0 50 100
1
2
3
4
5
6
7
8
9
10
11
12
13
14
15
16
17
18
19
20
D/Dn
Row
0
0·3
0·5
1
2
D/Dn0
0·3
0·5
1
2
0 50 100
1
2
3
4
5
6
7
8
9
10
11
12
13
14
15
16
17
18
19
20
Row
AS_0·609_10 (V40, 0·659) AM_0·618_10 (V40, 0·659)
Number of units: % Number of units: %
Figure 10. Number of units (as a percentage in each row) with
displacements D/Dn less than a set value, as given in the key, after
40 cycles of vibration for the numerically created concrete armour
layers: comparison of Accropode II unit standard design (AS) and
the Accropode II unit modified to have no studs (AM)
184
Maritime EngineeringVolume 169 Issue MA4
Numerical test for single concrete armourlayer on breakwatersAnastasaki, Latham and Xiang
has stability advantages. For different reasons, there is alsoan apparent benefit from a relatively smooth underlayer(Wa/Wr = 19). This is as a consequence of facilitating the cre-ation of a tighter pack in the first place.
For a comparison of all the model cases, the cumulative fre-quency plots of displacements of units after disturbance canalso be used, as shown in Figure 11, where the curves furtherto the left indicate the more stable (least mobile) armourlayers. It is clear that the worst performance is for the loosearmour layers with PD=0·594 and 0·584. Best of all is the per-formance of the armour layer with the highest PD of 0·631,and its relative advantage over the other two tight packs withPD=0·628 and PD=0·618 is systematic and clear.
Smoother underlayers with armour to rock weight ratios ofWa/Wr = 14 and Wa/Wr = 19 are seen to be significantly lessstable than for the coarser underlayer. The use of the largestsize of rocks for the underlayer (Wa/Wr = 6·9) gave the moststable result for the reference pack of PD=0·60. As discussedearlier, this can be attributed to the greater resistance to sliding
during extended periods of vibration. However, the disadvan-tage of the rougher large rock underlayer is that the creation ofa tighter initial pack is problematic, even for a target density of0·60. Where the target density is 0·62, it is highly likely thatthis effect of overly coarse underlayer rocks during construc-tion is most critical. It can therefore be corroborated thatdesign code guidance set at Wa/Wr = 10 is a good compromisebetween buildability and performance.
For 8 m3 Core-Loc units, the developer’s guide table (CLI,2012) suggests a placed target value of PD=0·619 or greater.It has been independently confirmed in this study, throughnumerical modelling, that it is better to select a high density ofplacement of units as close to the apparent maximum of�0·640 as possible and that, for vibration disturbances, nomore than 50% of the units will be displaced by D/Dn > 0·3 ifthe initial PD is ≥0·618.
As mentioned earlier, hydrodynamic storm wave loading actingon the placed and free-to-move armour units is mechanicallydifferent to the action of vibration forces as modelled in this
0
10
20
30
40
50
60
70
80
90
100
0 0·5 1·0 1·5 2·0 2·5
Freq
uenc
y: %
D/Dn
CL_0·584_10 (V40, 0·619)
CL_0·601_10 (V50, 0·642)
CL_0·618_10 (V30, 0·640)
CL_0·631_10 (V10, 0·642)
CL_0·587_6·9 (V50, 0·634)
CL_0·602_14 (V50, 0·650)
CL_0·594_10 (V30, 0·646)
CL_0·604_10 (V30, 0·644)
CL_0·628_10 (V20, 0·644)
CL_0·631_10 (V20, 0·653)
CL_0·596_8·6 (V50, 0·654)
CL_0·611_19 (V38, 0·667)
Figure 11. Cumulative frequency of displacements of units D/Dn
for armour layers with different characteristics after applying the
maximum vibration Vmax for which no loss of single-layer integrity
is associated. Lines and represent the best performing
armour layers with different initial PD or different armour weight
to underlayer weight ratio
185
Maritime EngineeringVolume 169 Issue MA4
Numerical test for single concrete armourlayer on breakwatersAnastasaki, Latham and Xiang
paper. In the work reported here, the entire frozen underlayer,toe row of units and the surrounding toe and side-walls are dis-placed en masse in the upslope and downslope directionsbeneath free-to-move armour units. The reader may be think-ing it is possible to perform some kind of calibration. Whenthe chosen vibration intensity is applied for a given duration,in this case �40 cycles, the accumulated adjustment of unitsexhibits a structural response that, in certain respects, mayseem like a close match to the structural response under mod-elled storm wave action in a flume tank test. However, the reli-ability of such a calibration to show a hydrodynamic responseremains questionable even if high-quality flume test data forpacks of different initial PDs were available. This is becausethe two types of disturbance processes are quite different. Forthe vibration test, the units are more uniformly involved fromtop to bottom – the local PD is expected to be at its maximumnear the toe and varying (in a stochastic somewhat systematicway) to reach a minimum local PD in the upper rows with themaximum downslope displacement occurring to units in theseupper rows. The hydrodynamic disturbance from a stormwould involve more complex physics with reversing buoyancyuplift and drag forces. Due to the focus of wave energy aroundthe still water level, units in the relatively unsubmerged upperrows may have zero or only minor displacements. There is alsothe possibility that the lower units near to the toe units, whilesupporting the overlying rows of units, are not subject to sig-nificantly varying reversing hydraulic drag forces. The hydrau-lic forces combined with contact forces acting during stormaction in laboratory tests have been demonstrated in certaincases to actually loosen the pack just above and tighten thepack just below the sea water level (Garcia et al., 2014).Having said this, it is worth noting that downward migrationand settlement of an entire armour layer creating a gap at thewave wall with some breakage was reported by Jensen (2014)in a recent survey of breakwater damage focusing on single-layer armour systems. Understanding of settlement as well asunit extraction mechanisms remains a challenge.
5. Concluding remarksThe ability of concrete units to interlock and form an integralsingle layer is very important. If designed well, the armourstructure can withstand severe conditions. However, any dis-turbance tends to displace the armour units. This paper hasfocused on a numerical investigation of different geometriccharacteristics of the structure with the aim of understandinghow to improve the performance of different concrete armourlayers under oscillatory loading disturbances. The placementmethod, which was developed for the numerical creation ofsingle-layer concrete armour units using an in-house FemDemcode (described in detail by Anastasaki et al. (2015)), facili-tated the modelling of concrete armour layers with differentcharacteristics. The mechanical modelling solver was then ableto load the structures using oscillating/vibrating boundaries
and analyse the displacements of units after disturbance(Anastasaki et al., 2015).
Since vibration was used for the numerical disturbance andthis is not representative of real sea wave action, the displace-ment results reported in this paper do not correspond to realis-tic values to be expected on site and/or in the laboratory forstructures subjected to design sea-states. They may not be asource of data for designing real structures. However, since themethods used for the creation and analysis of the differentarmour layers are all essentially the same, the influence oftheir design and build characteristics under this type of dis-turbance makes for an interesting comparison.
The different characteristics referred to in this study includetwo of the main options open to the designer: initial PD andunit/underlayer weight ratio. From this study, it was concludedthat PD is the most important parameter influencing the per-formance of armour layers under disturbance. The tighter thepacks, the smaller are the displacements of units and the moreimproved is the performance of the armour layer under dis-turbance. The roughness of the underlayer influences the place-ment of units. It is easier for units placed on a relativelysmooth underlayer to slide downwards and find tighter pos-itions, causing higher values of total average PD. But whendisturbed, armour layers placed on a rough underlayer aremore stable (despite the high increase of their PD afterdisturbance).
Assuming units other than Core-Locs are an option, anotherkey design variable, perhaps the most important, is the unittype. This paper has shown the capability to model other unittypes with an illustration of Accropode II, but the comparativebehaviour of different unit types is well outside the intendedscope of this paper. This study of coastal structures armouredwith single-layer systems is based on vibration and is a firststep towards showing potentially important results for dis-turbed layers.
The next step is to develop a more realistic imposition ofthe hydraulic force–time history of a storm sequence for a 50-or 100-year design sea-state. These ‘wave proxy’ methods areundergoing active development and will be supported byfurther experimental validation in collaboration with OttawaUniversity and Baird Associates. These wave proxy modelsapply hydraulic lift and drag forces calibrated from numericalwave–structure interaction studies. Such force–time historiesfor wave action are ‘one-way coupled’ to the solids forces usingthe same FemDem methods that simulated the unit motionsfor boundary vibration/displacement histories in this paper.Progress with FemDem wave proxy models has been high-lighted in recent international conferences on coastal engineer-ing and coastal structures.
186
Maritime EngineeringVolume 169 Issue MA4
Numerical test for single concrete armourlayer on breakwatersAnastasaki, Latham and Xiang
AcknowledgementsThe authors thank Artelia Group and Baird Associates fortheir long-standing support and for sponsoring a part of thisstudy. They also acknowledge the support of the Engineeringand Physical Sciences Research Council (EPSRC) (grantsEP/H030123/1 and GR/S42699/01) for the funding of thisresearch and its extension to wave proxy methods (grantEP/K503733/1).
REFERENCES
Anastasaki E, Xiang J and Latham JP (2013) Building concreteunit armoured breakwaters in a numerical modelenvironment – a new placement technique. In Coasts,Marine Structures and Breakwaters 2013: From Sea toShore – Meeting the Challenges of the Sea (Allsop W andBurgess K (eds)). ICE Publishing, London, UK,pp. 1174–1183.
Anastasaki E, Latham JP and Xiang J (2015) Numericalmodelling of armour layers with reference to Core-Locunits and their placement acceptance criteria. Journal ofOcean Engineering 104: 204–218.
CIRIA/CUR/CETMEF (2007) The Rock Manual. The Use of Rockin Hydraulic Engineering, 2nd edn. CIRIA, London UK.
Dentale F, Russo SD and Carratelli E (2009) Innovative NumericalSimulation to Study the Fluid Motion within Rubble MoundBreakwaters and the Armour Stability. See http://www.flow3d.com/pdfs/tp/wat_env_tp/FloSci-Bib01-10.pdf(accessed 02/11/2016).
Dentale F, Donnarumma G, Carratelli EP and Reale F
(2015) A numerical method to analyse the interactionbetween sea waves and rubble mound emergedbreakwaters. WSEAS Transactions on Fluid Mechanics 10:106–116.
Garcia N, Richardson S and Rigden T (2014) Physical modeltesting of the hydraulic stability of single-layer armourunits. In Coasts, Marine Structures and Breakwaters 2013:From Sea to Shore – Meeting the Challenges of the Sea(Allsop W and Burgess K (eds)). ICE Publishing, London,UK, pp. 122–130.
Guo L, Latham JP and Xiang J (2015) Numerical simulationof breakages of concrete armour units using athree-dimensional fracture model in the context of thecombined finite-discrete element method. Computers &Structures 146: 117–142.
Higuera P, Lara JL and Losada IJ (2013) Simulating coastalengineering processes with OpenFOAM. CoastalEngineering 71: 119–134.
Jensen OJ (2014) Safety of breakwater armour layerswith special focus on monolayer armour units. In Coasts,Marine Structures and Breakwaters 2013: From Sea to
Shore – Meeting the Challenges of the Sea (Allsop W andBurgess K (eds)). ICE Publishing, London, UK, pp. 33–44.
Jensen B, Jacobsen NG and Christensen ED (2014) Investigationon the porous media equations and resistance coefficientsfor coastal structure. Coastal Engineering 84: 56–72.
Latham JP, Anastasaki E and Xiang J (2013) New modelling andanalysis methods for concrete armour unit systems usingFEMDEM. Coastal Engineering 77: 151–166.
Mohamad ME, Ibrahim IS, Abdullah R et al. (2015) Friction andcohesion coefficients of composite concrete-to-concretebond. Cement & Concrete Composites 56: 1–14.
Richardson S, Cuomo G, Dimakopoulos A and Longo D (2013)Coastal structure optimisation using advanced numericalmethods. In Coasts, Marine Structures and Breakwaters2013: From Sea to Shore – Meeting the Challenges ofthe Sea (Allsop W and Burgess K (eds)). ICE Publishing,London, UK, pp. 1184–1194.
USACE (US Army Corps of Engineers) (2002) CoastalEngineering Manual. USA Army Corps of Engineers,Washington, DC, USA.
Viré A, Xiang J, Milthaler F et al. (2012) Modelling offluid–solid interactions using an adaptive-mesh fluid modelcoupled with a combined finite-discrete element model.Journal of Ocean Dynamics 62(10): 1487–1501.
Xiang J, Munjiza A, Latham J-P and Guises R (2009) On thevalidation of DEM and FEM/DEM models in 2D and3D. Engineering Computations 26(6): 673–687.
Xiang J, Latham JP, Viré A, Anastasaki E and Pain C (2012)Coupled fluidity.Y3D technology and simulation tools fornumerical breakwater modeling. Coastal Engineering,ICCE 2012, Santander, Spain.
Xiang J, Latham JP, Viré A, Anastasaki E and Pain C (2013)Numerical modelling of wave–rubble mound breakwaterinteraction. In 6th International Conference on DiscreteElement Methods (DEM6) (Mustoe G (ed.)). ColoradoSchool of Mines, Golden, CO, USA.
HOW CAN YOU CONTRIBUTE?
To discuss this paper, please email up to 500 words to theeditor at [email protected]. Your contribution will beforwarded to the author(s) for a reply and, if consideredappropriate by the editorial board, it will be published asdiscussion in a future issue of the journal.
Proceedings journals rely entirely on contributions fromthe civil engineering profession (and allied disciplines).Information about how to submit your paper onlineis available at www.icevirtuallibrary.com/page/authors,where you will also find detailed author guidelines.
187
Maritime EngineeringVolume 169 Issue MA4
Numerical test for single concrete armourlayer on breakwatersAnastasaki, Latham and Xiang