46
Istituto Scientifico Romagnolo per lo Studio e la Cura dei Tumori IRST IRCCS Meldola Ugo De Giorgi Nuove possibilità terapeutiche di seconda linea
Istituto Scientifico Romagnolo per lo Studio e la Cura dei Tumori IRST IRCCS Meldola
Ugo De Giorgi
Nuove possibilità terapeutiche di seconda linea

ECCO-ESMO 2015
FirstAuthor RCC
PresentationType
ChoueiriCabozantinib versus everolimus in patients with advanced renal cell carcinoma: Results of the randomized phase 3 METEOR trial
PresidentialOral
SharmaInterim Results From CheckMate 025, a Randomized,Open-Label, Phase 3 Study of Nivolumab vs Everolimusin Advanced or Metastatic Renal Cell Carcinoma
Presidential Oral
European Cancer Congress (ECC) 2015Annual Meeting Presentations

Abstract 4LBA
Cabozantinib versus everolimus in patients with advanced
renal cell carcinoma: results of a randomized phase 3 trial
(METEOR)
T. Choueiri, B. Escudier, T. Powles, P. Mainwaring, B. Rini, F. Donskov, H. Hammers, T. Hutson, B. Roth, K. Peltola, J-L. Lee, D. Heng, M. Schmidinger, A. Borgman-Hagey,
C. Hessel, C. Scheffold, G. Schwab, N. Tannir, R. Motzerfor the METEOR investigators
Presented at the European Cancer Congress, Vienna, 26 September 2015
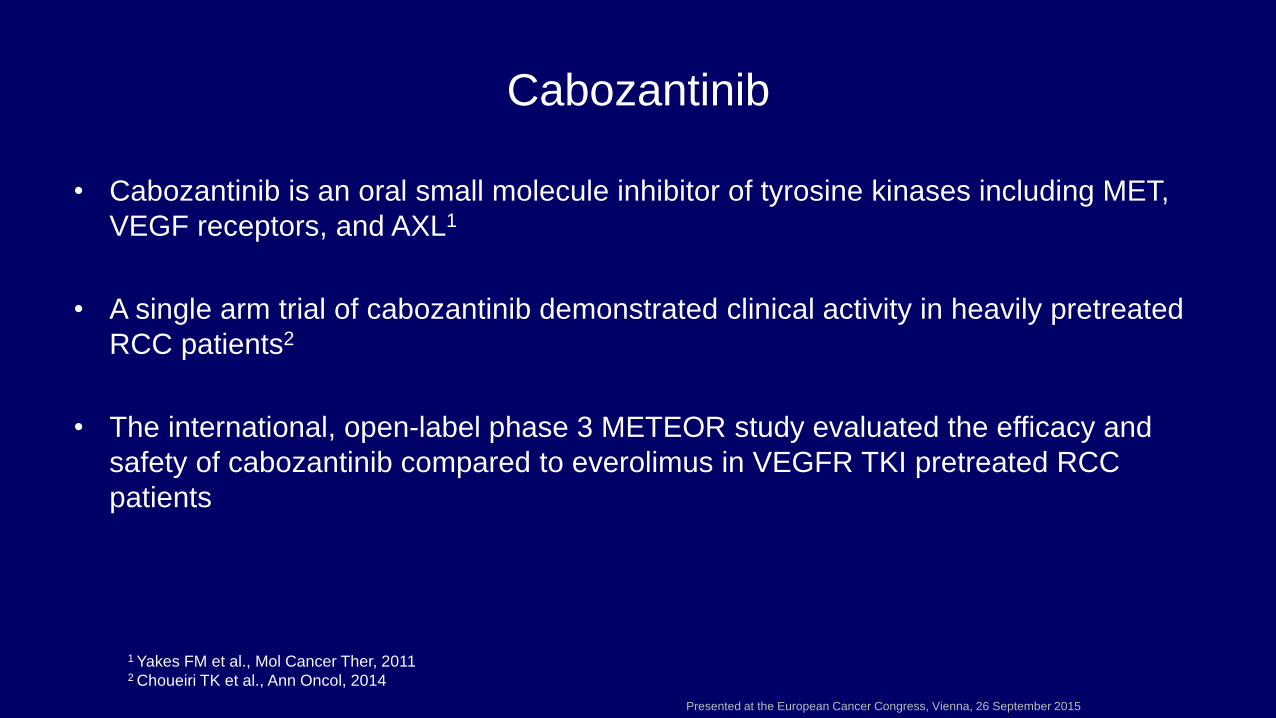
Cabozantinib
• Cabozantinib is an oral small molecule inhibitor of tyrosine kinases including MET,
VEGF receptors, and AXL1
• A single arm trial of cabozantinib demonstrated clinical activity in heavily pretreated
RCC patients2
• The international, open-label phase 3 METEOR study evaluated the efficacy and
safety of cabozantinib compared to everolimus in VEGFR TKI pretreated RCC
patients
1 Yakes FM et al., Mol Cancer Ther, 20112 Choueiri TK et al., Ann Oncol, 2014
Presented at the European Cancer Congress, Vienna, 26 September 2015

Study Design
Stratification:
• MSKCC1 risk groups: favorable, intermediate, poor
• Number prior VEGFR-TKIs: 1, 2 or more
Advanced RCC (N=650)• Clear cell histology
• Measurable disease
• Progression on prior VEGFR TKI within 6 months of
enrollment
• No limit to the number of prior therapies
• Antibodies targeting PD-1/PD-L1 allowed
• Brain metastases allowed if treated
Cabozantinib 60 mg qd orally
Everolimus 10 mg qd orally
Randomization 1:1No cross-over allowed
1 Motzer R. et al., J Clin Oncol, 2004
Tumor assessment by
RECIST 1.1 every 8 weeks
Treatment until loss of
clinical benefit or
intolerable toxicity
Presented at the European Cancer Congress, Vienna, 26 September 2015
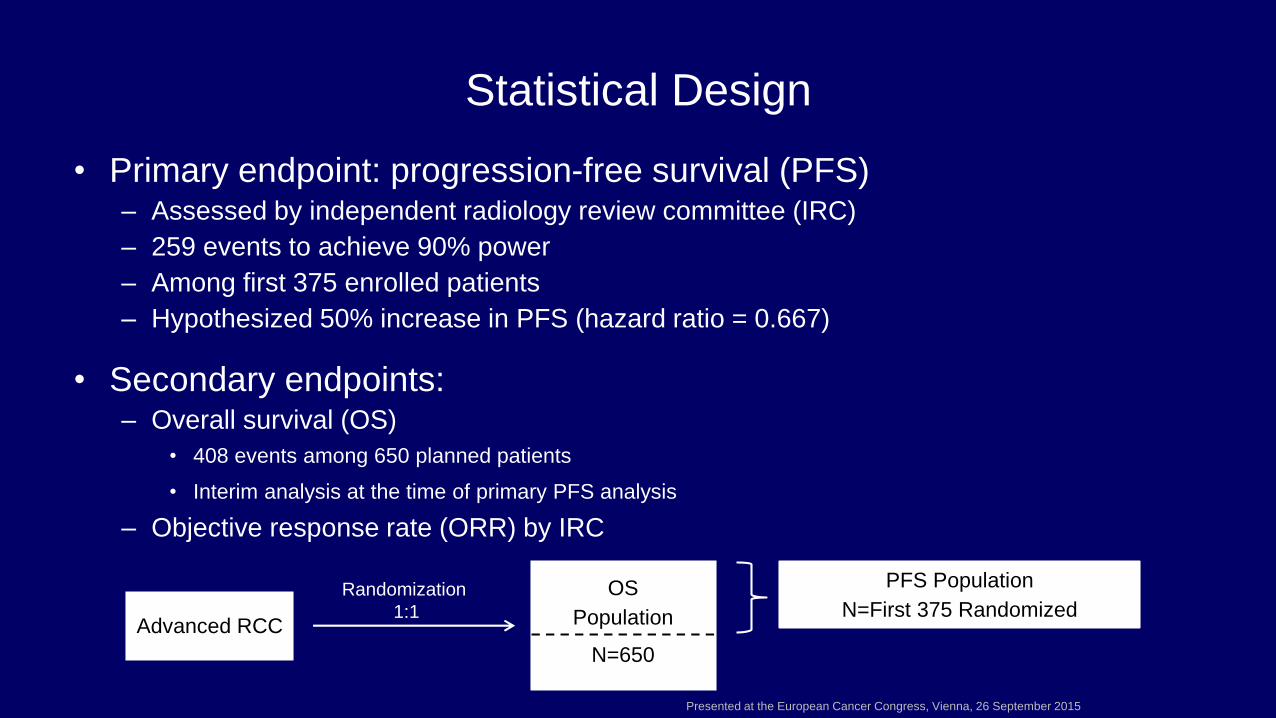
Statistical Design
• Primary endpoint: progression-free survival (PFS)– Assessed by independent radiology review committee (IRC)
– 259 events to achieve 90% power
– Among first 375 enrolled patients
– Hypothesized 50% increase in PFS (hazard ratio = 0.667)
• Secondary endpoints:– Overall survival (OS)
• 408 events among 650 planned patients
• Interim analysis at the time of primary PFS analysis
– Objective response rate (ORR) by IRC
Advanced RCC
OS
Population
N=650
PFS Population
N=First 375 RandomizedRandomization
1:1
Presented at the European Cancer Congress, Vienna, 26 September 2015

Baseline Characteristics
Characteristic* Cabozantinib (N=330) Everolimus (N=328)
Median age, years (range) 63 (32‒86) 62 (31‒84)
Male, % 77 73
Enrollment Region, %
Europe / North America 51 / 36 47 / 37
Asia-Pacific & Latin America 14 16
ECOG Performance Status, %
0 68 66
1 32 34
MSKCC risk group1, %
Favorable 45 46
Intermediate 42 41
Poor 12 13
Metastatic sites per IRC, %
Lung 58 61
Liver 25 30
Bone 23 19
* Characteristics were consistent with the PFS population1 Motzer R. et al., J Clin Oncol, 2004
Presented at the European Cancer Congress, Vienna, 26 September 2015

Progression-Free Survival Independent Central Radiology Review
8
M o n th s
Pro
gre
ss
ion
-fre
e S
urv
iva
l (%
)
0 3 6 9 1 2 1 5 1 8
0
2 0
4 0
6 0
8 0
1 0 0
No. at Risk Cabozantinib 187 152 92 68 20 6 2
Everolimus 188 99 46 29 10 2 0
Median PFS No. of
Events
mo (95% CI)
Cabozantinib (N=187) 7.4 (5.6-9.1) 121
Everolimus (N=188) 3.8 (3.7-5.4) 126
Hazard ratio, 0.58 (95% CI 0.45-0.75, P<0.001)
Presented at the European Cancer Congress, Vienna, 26 September 2015

Progression-free Survival in Subgroups Independent
Radiology Review Committee
Subgroup Cabozantinib Everolimus Hazard Ratio (95% CI) no. of patients (events)
All patients 187 (121) 188 (126) 0.58 (0.45 - 0.75)
Prior VEGFR TKIs
One 137 (87) 136 (95) 0.56 (0.42 - 0.75)
Two or more 50 (34) 52 (31) 0.67 (0.41 - 1.10)
MSKCC risk group
Favorable 80 (51) 83 (56) 0.54 (0.37 - 0.79)
Intermediate 80 (49) 75 (47) 0.56 (0.37 - 0.84)
Poor 27 (21) 30 (23) 0.84 (0.46 - 1.53)
0 .2 5 0 .5 1 2 4
E v e ro lim u s B e tte rC a b o z a n tin ib B e tte r
Presented at the European Cancer Congress, Vienna, 26 September 2015

Tumor Response – PFS PopulationIndependent Radiology Review Committee
Cabozantinib Everolimus
(N=187) (N=188)
Objective response rate, % 21 5
95% CI 16‒28 2‒9
P value < 0.001*
Best overall response, %
Complete response 0 0
Partial response 21 5
Stable disease 62 62
Progressive disease 14 27
Not evaluable or missing 3 6
* Cochran-Mantel-Haenszel test
The ORR was consistent in patients who received sunitinib as only prior VEGFR TKI
Presented at the European Cancer Congress, Vienna, 26 September 2015

M o n th s
Ov
era
ll S
urv
iva
l (%
)
0 3 6 9 1 2 1 5 1 8 2 1 2 4
0
2 0
4 0
6 0
8 0
1 0 0
C a b o z a n tin ib
E v e ro lim u s
No. at Risk Cabozantinib 330 317 294 189 101 32 6 1 0
Everolimus 328 306 260 156 88 24 5 1 0
Hazard ratio, 0.67 (95% CI 0.51-0.89, P=0.005)
Kaplan-Meier Estimates of Overall Survival Interim Analysis (49% Information Fraction)
The interim boundary to reach significance (P=0.0019) was not reached
Survival follow up is continuing to the planned final analysis
(Medians cannot yet be estimated due to frequent early censoring)
Presented at the European Cancer Congress, Vienna, 26 September 2015

Exposure and Dose ReductionsSafety Population
Cabozantinib
(N=331)
Everolimus
(N=322)
Median duration of exposure – months (range)7.6
(0.3‒20.5)
4.4
(0.21‒18.9)
Median average daily dose 44 mg 9 mg
Any dose reduction 60% 25%
Discontinued due to adverse event 9% 10%
Dose reductions were used to adjust to the individual patient’s tolerability
Presented at the European Cancer Congress, Vienna, 26 September 2015

All-causality Adverse Events
Cabozantinib (N=331) Everolimus (N=322)
Preferred Term, % All Grades Grade 3/4 All Grades Grade 3/4
Any adverse event* 100 68 >99 58
Diarrhea 74 11 27 2
Fatigue 56 9 46 7
Nausea 50 4 28 <1
Decreased appetite 46 2 34 <1
PPE syndrome 42 8 6 <1
Hypertension 37 15 7 3
Vomiting 32 2 14 <1
Weight decreased 31 2 12 0
Constipation 25 <1 19 <1
Anemia 17 5 38 16
Cough 18 <1 33 <1
Dyspnoea 19 3 28 4
Rash 15 <1 28 <1
Events of interest
Hyperglycaemia 5 <1 19 5
Pneumonitis 0 0 10 2
GI Perforation <1 <1 <1 <1
Fistula <1 <1 0 0
* Events reported in at least 25% of patients in either study group; PPE, palmar-plantar erythrodysesthesiaPresented at the European Cancer Congress, Vienna, 26 September 2015

METEOR Study Conclusions
• Cabozantinib significantly improves PFS compared to everolimus in RCC
patients after prior VEGFR TKI therapy
• Cabozantinib improved the objective response rate
• Overall survival results at the interim analysis show a strong trend favoring
cabozantinib
• Cabozantinib's safety profile is acceptable and tolerability is similar to other TKIs
in this population
• Cabozantinib represents a potential new treatment option for second or later line
therapy for RCC
Presented at the European Cancer Congress, Vienna, 26 September 2015
Presented at the European Cancer Congress, Vienna, 26 September 2015


ECCO-ESMO 2015ECCO-ESMO 2015
CheckMate 025: A Randomized, Open-Label,Phase III Study of Nivolumab
Versus Everolimus in AdvancedRenal Cell Carcinoma
Padmanee Sharma, Bernard Escudier, David F. McDermott, Saby George,Hans J. Hammers, Sandhya Srinivas, Scott S. Tykodi, Jeffrey A. Sosman, Giuseppe Procopio, Elizabeth R. Plimack, Daniel
Castellano, Howard Gurney, Frede Donskov, Petri Bono,John Wagstaff, Thomas C. Gauler, Takeshi Ueda, Li-An Xu, Ian M. Waxman,
Robert J. Motzer, on behalf of the CheckMate 025 investigators
ESMO (2015)
3LBA
21

CheckMate 025: Phase III Trial of Nivolumab versus Everolimus in 2L+ Advanced/Metastatic RCC
* Treatment beyond progression (RECIST 1.1) was allowed if investigator-assessed clinical benefit was achieved and treatment was well tolerated.
CNS, central nervous system; mTOR, mammalian target of rapamycin; ORR, objective response rate; OS, overall survival; PD-L1, programmed death ligand-1; PFS, progression-free survival; PS, performance status; qd, daily; q2w, every 2 weeks; R, randomized; RCC, renal cell carcinoma.Motzer RJ et al. N Engl J Med. 2015;373(19):1803-1813.
Nivolumab
3 mg/kg q2w Until progression*, unacceptable toxicity,
withdrawal of consent, or end of trial
Key Inclusion Criteria
• Advanced/metastatic clear cell RCC
• No more than 3 total prior regimens in advanced/metastatic setting
• 1 or 2 prior anti-angiogenic therapy regimens in advanced/metastatic setting
• No prior therapy with mTOR inhibitor
• Karnofsky PS ≥70%
• No CNS metastases
R
1:1
Everolimus
10 mg qd
Primary Outcome Measure: OSSecondary Outcome Measures: PFS, ORR, duration of objective response, duration of OS by PD-L1 status, safety, disease-related symptom progression rate
N=821

Checkmate 025: ORR1-3
* The proportion of patients achieving an overall response of complete response or partial response per RECIST version 1.1.† For patients without progression or death, duration of response was defined as the time from first response (CR/PR) date to the
date of censoring.CI, confidence interval; NE, not estimable; RECIST, response criteria in solid tumors.1. Motzer RJ et al. N Engl J Med. 2015;373(19): supplementary appendix. 2. Motzer RJ et al. N Engl J Med. 2015;373(19):1803-1813. 3. OPDIVO [package insert]. Princeton, NJ: Bristol-Myers Squibb; 2016.
Nivolumabn=410
Everolimusn=411
Confirmed Investigator Confirmed Investigator
Objective response rate, % (95% CI)* 21.5 25 3.9 5
Best overall response, %
Complete response 0.7 1 0.5 1
Partial response 20.7 24 3.4 5
Stable disease 35.9 34 54.5 55
Progressive disease 33.2 35 25.5 28
Not evaluated/unable to determine 9.5 6 16.1 12
Median duration of response, months (range)† 23.0 (12.0–NE) 12.0 (0–27.6) 13.7 (8.3–21.9) 12.0 (0–22.2)
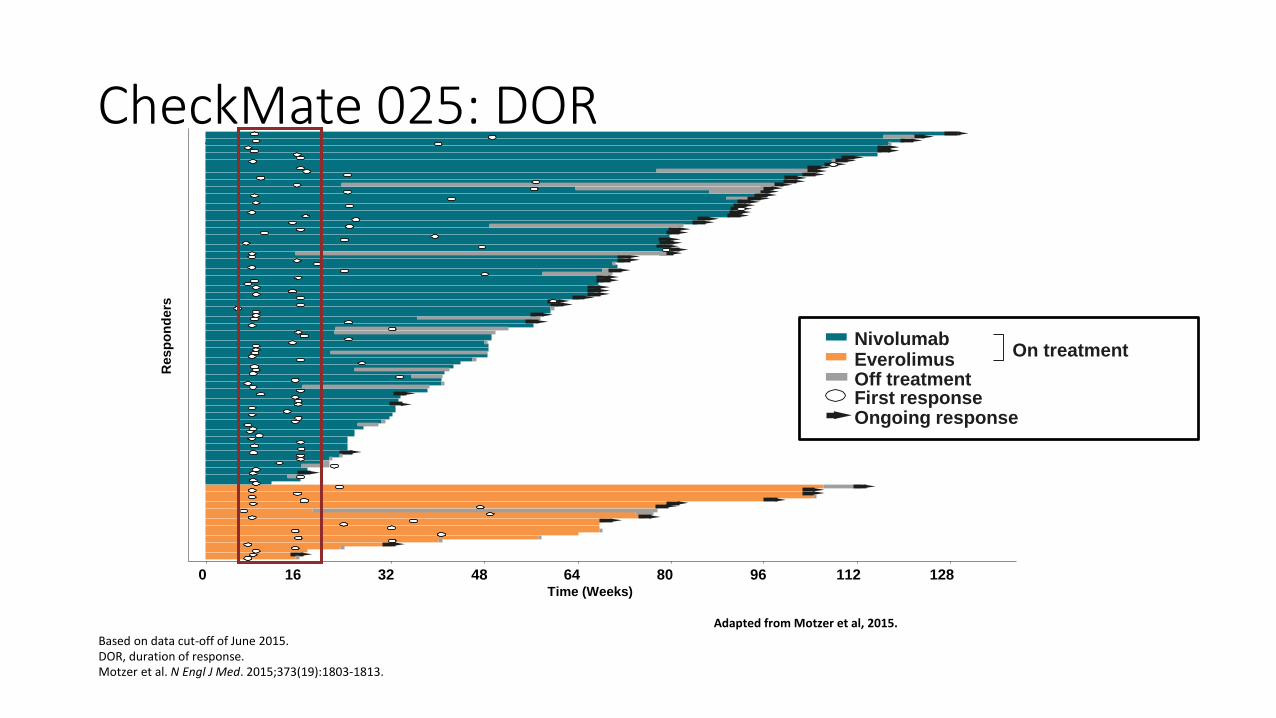
CheckMate 025: DOR
Adapted from Motzer et al, 2015.
Based on data cut-off of June 2015. DOR, duration of response.Motzer et al. N Engl J Med. 2015;373(19):1803-1813.
Ongoing responseFirst responseOff treatment
NivolumabEverolimus
On treatment
0 16 32 6448 80Time (Weeks)
96 112 128
Resp
on
ders
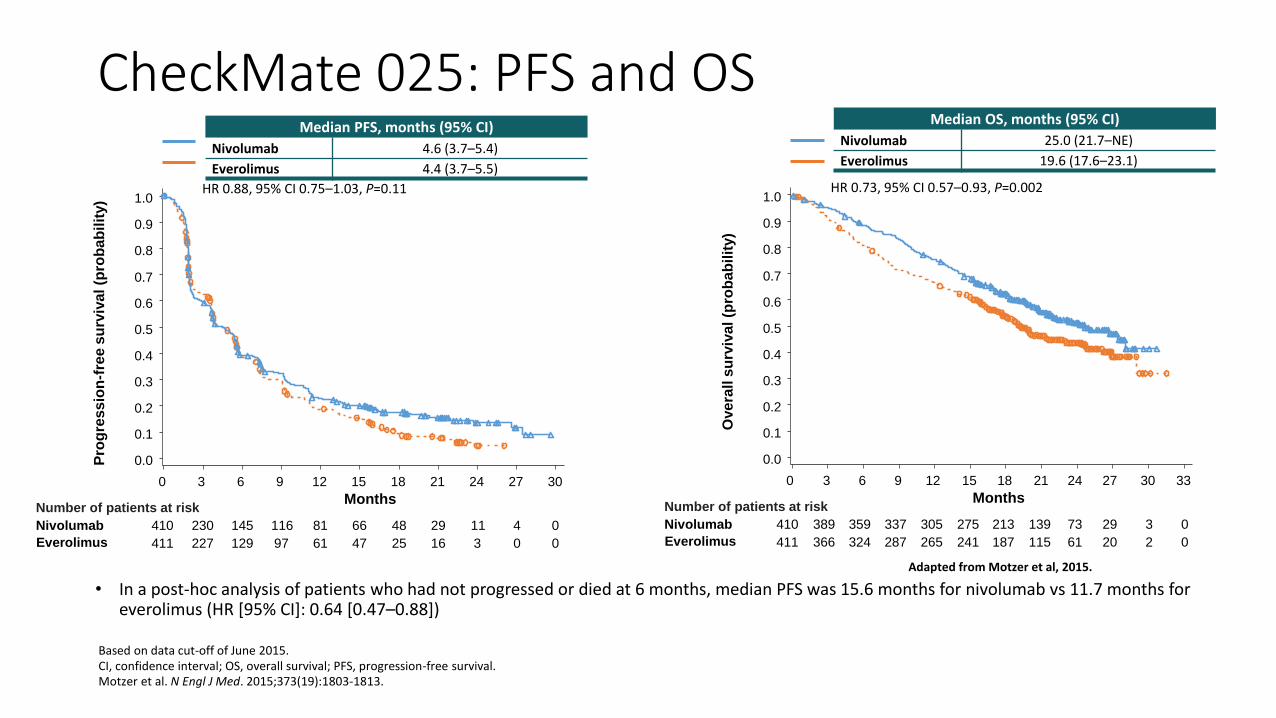
CheckMate 025: PFS and OS
• In a post-hoc analysis of patients who had not progressed or died at 6 months, median PFS was 15.6 months for nivolumab vs 11.7 months for everolimus (HR [95% CI]: 0.64 [0.47–0.88])
Number of patients at risk
Nivolumab 410 230 145 116 81 66 48 29 11 4 0
Everolimus 411 227 129 97 61 47 25 16 3 0 0
0 3 6 129 15
Months
18 21 24 27 30
0.0
0.3
0.1
0.2
0.4
0.5
0.6
0.7
0.8
0.9
1.0
Pro
gre
ss
ion
-fre
e s
urv
iva
l (p
rob
ab
ilit
y)
Median PFS, months (95% CI)
Nivolumab 4.6 (3.7–5.4)
Everolimus 4.4 (3.7–5.5)
HR 0.88, 95% CI 0.75–1.03, P=0.11
Based on data cut-off of June 2015. CI, confidence interval; OS, overall survival; PFS, progression-free survival.Motzer et al. N Engl J Med. 2015;373(19):1803-1813.
Adapted from Motzer et al, 2015.
Number of patients at risk
Nivolumab 410 389 359 337 305 275 213 139 73 29 0
Everolimus 411 366 324 287 265 241 187 115 61 20 0
0 3 6 129 15
Months
18 21 24 27 33
0.0
0.3
0.1
0.2
0.4
0.5
0.6
0.7
0.8
0.9
1.0
30
Ove
rall
su
rviv
al (p
rob
ab
ilit
y)
Median OS, months (95% CI)
Nivolumab 25.0 (21.7–NE)
Everolimus 19.6 (17.6–23.1)
HR 0.73, 95% CI 0.57–0.93, P=0.002
3
2
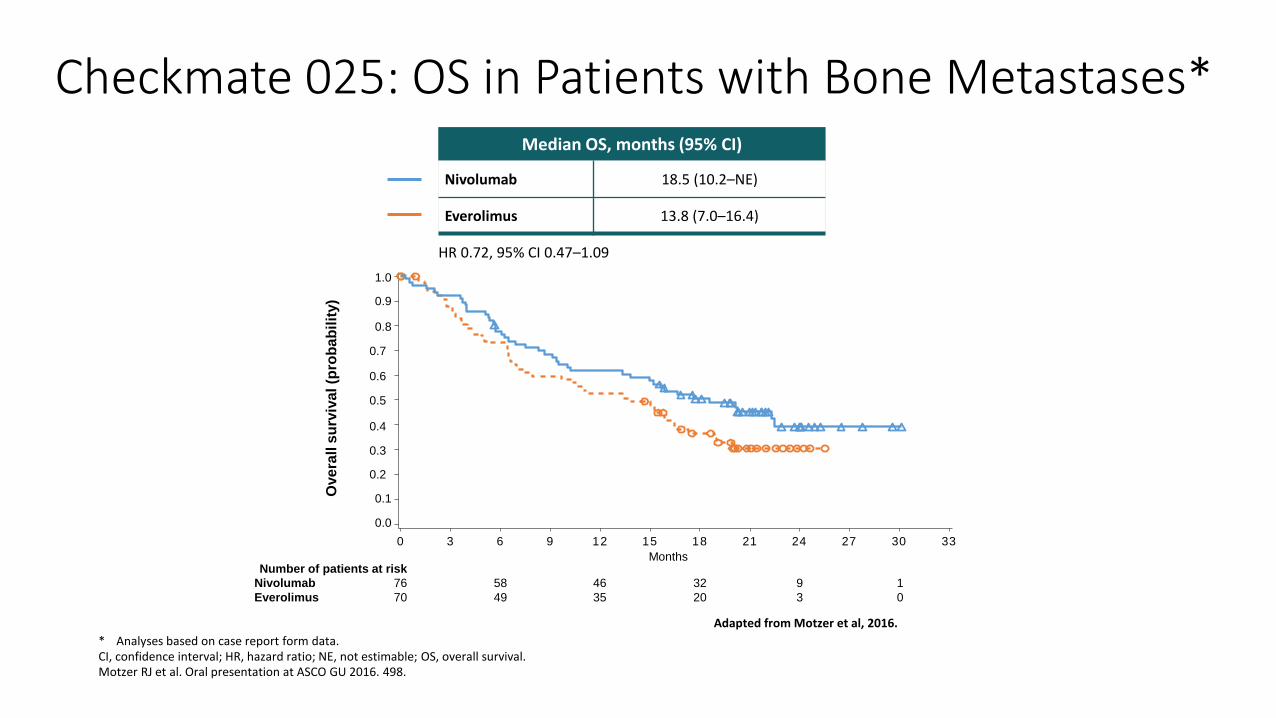
Median OS, months (95% CI)
Nivolumab 18.5 (10.2–NE)
Everolimus 13.8 (7.0–16.4)
HR 0.72, 95% CI 0.47–1.09
Checkmate 025: OS in Patients with Bone Metastases*
* Analyses based on case report form data.CI, confidence interval; HR, hazard ratio; NE, not estimable; OS, overall survival. Motzer RJ et al. Oral presentation at ASCO GU 2016. 498.
0 3 6 129 15
Months
18 21 24 27 30 33
Number of patients at risk
Nivolumab 76 58 46 32 9 1
Everolimus 70 49 35 20 3 0
0.0
0.1
0.8
0.9
0.2
0.3
0.4
0.5
0.6
0.7
1.0
Adapted from Motzer et al, 2016.
Ove
rall
su
rviv
al (p
rob
ab
ilit
y)

Checkmate 025: treatment beyond progression—best reduction in target lesions with Nivolumab
• Approximately 50% of patients who received treatment despite progression had a reduction in tumor burden post-progression
• 14% had a ≥30% reduction in tumor burden post-progression
Patients
*
* * *
** *
** *
*
****
50
25
0
-25
-50
-75
-100
Be
st
Re
du
cti
on
fro
m F
irs
t P
rog
ress
ion
in T
arg
et
Les
ion
(%
)
* **
**
*
* ** * ****
□ □ □ □
Asterisks represent responders before first progression. Square symbols represent % change truncated to 100%.nivo, nivolumab; q2w, every 2 weeks.Escudier B et al. Poster presentation at ASCO 2016. 4509.

Checkmate 025: treatment beyond progression—Overall Survival with Nivolumab
CI, confidence interval; HR, hazard ratio; NE, not estimable; NTBP, not TBP; OS, overall survival; TBP, treated beyond progression.Escudier B et al. Poster presentation at ASCO 2016. 4509.
Number of patients at risk
TBPNTBP
153 153 146 142 132 123 96 65 30 17 2 0145 131 113 101 84 69 54 29 16 3 0 0
Months
Ove
rall
su
rviv
al (p
rob
ab
ilit
y)
0.0
0 3 6 9 12 15 18 21 24 27 30 33
0.1
0.2
0.3
0.4
0.5
0.6
0.7
0.8
1.0
0.9
Median OS, months (95% CI)
Treated beyond progression 28.1 (23.2–NE)
Not treated beyond progression 15.0 (12.1–18.2)
HR 0.41, 95% CI 0.29–0.57
Adapted from Escudier et al, 20156.

0.0
0.1
0.2
0.3
0.4
0.5
0.6
0.7
0.8
0.9
1.0
Months
Pro
gre
ssio
n-F
ree S
urv
ival
(Pro
ba
bil
ity)
0 3 6 9 12
Progression-free survival
No. at RiskAll treated patients
aSimilar results were seen using the 5% PD-L1 tumor expression cutoff
265 110 48 17 0
Median PFS, Months (95% CI)a
All treated 2.00 (1.87–2.63)
All treated
patients
PD-L1 <1%
PD-L1 <1% 1.87 (1.77–2.04)
143 49 21 9 0PD-L1 <1%
PD-L1 ≥1% 3.55 (1.94–3.71)
122 61 27 8 0PD-L1 ≥1%
PD-L1 ≥1%

Overall survival
All treated patients
No. at RiskAll treated patients
PD-L1 <1%
PD-L1 ≥1%
PD-L1 ≥1%
Median OS, Months (95% CI)a
All treated 8.74 (6.05–NR)
PD-L1 <1% 5.95 (4.30–8.08)
PD-L1 ≥1% 11.30 (8.74–NR)
0.0
0.1
0.2
0.3
0.4
0.5
0.6
0.7
0.8
0.9
1.0
0 3 6 9 12 15
Overa
ll S
urv
ival
(Pro
ba
bil
ity)
Months
PD-L1 <1%
aSimilar results were seen using the 5% PD-L1 tumor expression cutoff; NR, not reached
265 198 148 63 5 0143 101 69 26 2 0
122 97 79 37 3 0

CheckMate 025: Treatment-Related AEsNivolumab
N=406Everolimus
N=397Any grade Grade 3 Grade 4* Any grade Grade 3 Grade 4†
Treatment-related AEs, % 79 18 1 88 33 4
Fatigue 33 2 0 34 3 0
Nausea 14 <1 0 17 1 0
Pruritus 14 0 0 10 0 0
Diarrhea 12 1 0 21 1 0
Decreased appetite 12 <1 0 21 1 0
Rash 10 <1 0 20 1 0
Cough 9 0 0 19 0 0
Anemia 8 2 0 24 8 <1
Dyspnea 7 1 0 13 <1 0
Edema peripheral 4 0 0 14 <1 0
Pneumonitis 4 1 <1 15 3 0
Mucosal inflammation 3 0 0 19 3 0
Dysgeusia 3 0 0 13 0 0
Hyperglycemia 2 1 <1 12 3 <1
Stomatitis 2 0 0 29 4 0
Hypertriglyceridemia 1 0 0 16 4 1
Epistaxis 1 0 0 10 0 0
Based on data cut-off of June 2015. * Grade 4 AEs not listed in table: increased blood creatinine (1), acute kidney injury (1), anaphylactic reaction (1). † Grade 4 AEs not listed in table: increased blood triglycerides (2), acute kidney injury (1), sepsis (1), chronic obstructive pulmonary disorder (1), increased blood cholesterol (1), neutropenia (1), pneumonia (1). AE, adverse event. Sharma P et al. Oral presentation at ESMO 2015. 3LBA.

CheckMate 025: HRQoLMean change from baseline in HRQoL scores by FKSI-DRS: descriptive analysis
a Significant improvement (P<0.05) from baseline in FKSI-DRS for nivolumab.b Significant improvement (P<0.05) in FKSI-DRS mean change from baseline scores between nivolumab and everolimus arms.c Significant deterioration (P<0.05) from baseline in FKSI-DRS for everolimus.Note: only time points where data were available for ≥5 patients are plotted.FKSI-DRS, Functional Assessment of Cancer Therapy-Kidney Symptom Index-Disease-Related Symptoms.Cella DF et al. Oral presentation at ASCO 2016. 4549.
-6
-4
-2
0
2
4
6
0 4 8 12 16 20 24 28 32 36 40 44 48 52 56 60 64 68 72 76 80 84 88 92 96 100 104
361 334 302 267 236 208 186 164 159 144 132 119 112 97 90 89 81 72 63 59 53 44 43 31 30 26 20Nivolumab
343 316 270 219 191 157 143 122 102 97 87 74 73 63 58 49 44 35 30 28 24 21 15 12 12 9 9Everolimus
Number of patients at risk
Treatment visit (week)
Mea
n c
han
ge f
rom
bas
elin
e
a
b
c c
Nivolumab
Everolimus
Be
tte
rW
ors
e
Adapted from Cella et al, 2016.

ASCO 2016
Long-term Overall Survival (OS) With Nivolumab in Previously Treated Patients
With Advanced Renal Cell Carcinoma (aRCC) From Phase I and Phase II Studies
David F. McDermott,1 Robert J. Motzer,2 Michael B. Atkins,3 Elizabeth R. Plimack,4
Mario Sznol,5 Saby George,6 Charles G. Drake,7 Brian Rini,8 Toni K. Choueiri,9 Timothy Kuzel,10
Jeffrey A. Sosman,11 David C. Smith,12 Ulka Vaishampayan,13 John D. Powderly,14
Suzanne L. Topalian,7 Huanyu Zhao,15 Ian M. Waxman,15 Hans J. Hammers7
1Beth Israel Deaconess Medical Center, Dana-Farber/Harvard Cancer Center, Boston, MA, USA; 2Memorial Sloan Kettering Cancer Center, New York, NY, USA; 3Georgetown-Lombardi Comprehensive Cancer Center, Washington, DC, USA; 4Fox Chase Cancer Center, Philadelphia, PA, USA; 5Yale
University School of Medicine and Smilow Cancer Center, Yale–New Haven Hospital, New Haven, CT, USA; 6Roswell Park Cancer Institute, Buffalo, NY, USA; 7Sidney Kimmel Comprehensive Cancer Center at Johns Hopkins, Baltimore, MD, USA; 8Cleveland Clinic Taussig Cancer Institute, Cleveland, OH, USA; 9Dana-Farber Cancer Institute/Brigham and Women’s Hospital, Boston, MA, USA; 10Northwestern University
Feinberg School of Medicine, Chicago, IL, USA; 11Vanderbilt University Medical Center, Nashville, TN, USA; 12University of Michigan Comprehensive Cancer Center, Ann Arbor, MI, USA; 13Karmanos Cancer Institute, Wayne State University, Detroit, MI, USA; 14Carolina
BioOncology Institute, Huntersville, NC, USA; 15Bristol-Myers Squibb, Princeton, NJ, USA
4507

ASCO 2016
Designs of Phase I and II Studies
Phase I Study (NCT00730639)
Phase II Study (NCT01354431)
• PD after 1–5 systemic therapies
• ECOG PS ≤2
Key criteria
1 or 10 mg/kg nivolumabIV Q2W (RCC)
8-week treatment cycle
• Treat until confirmed progressiona or unacceptable toxicity
• Treatment duration:
– 96 weeks if clinically stable
Endpoints
• Primary: Safety and tolerability
• Key secondary: ORR
Arm 10.3 mg/kg nivolumab IV Q3W
Arm 22 mg/kg nivolumab IV Q3W
Arm 310 mg/kg nivolumab IV Q3W
• 1–3 prior therapies
• ≥1 prior anti-angiogenic agent
• PD after last therapy and ≤6 months prior to enrollment
• KPS ≥70%
• Treat until confirmed progressiona or unacceptable toxicity
• Treatment duration:
– Continuous if clinically stable
Endpoints
• Primary: Dose response by PFS
• Key secondary: Response rate, OS, toxicities R
an
do
miz
e 1
:1:1
b
Key criteria
aTreatment beyond progression was permitted if nivolumab was tolerated and clinical benefit was noted.bRandomization stratified by MSKCC risk group and number of prior therapies in metastatic setting.
ASCO 2016
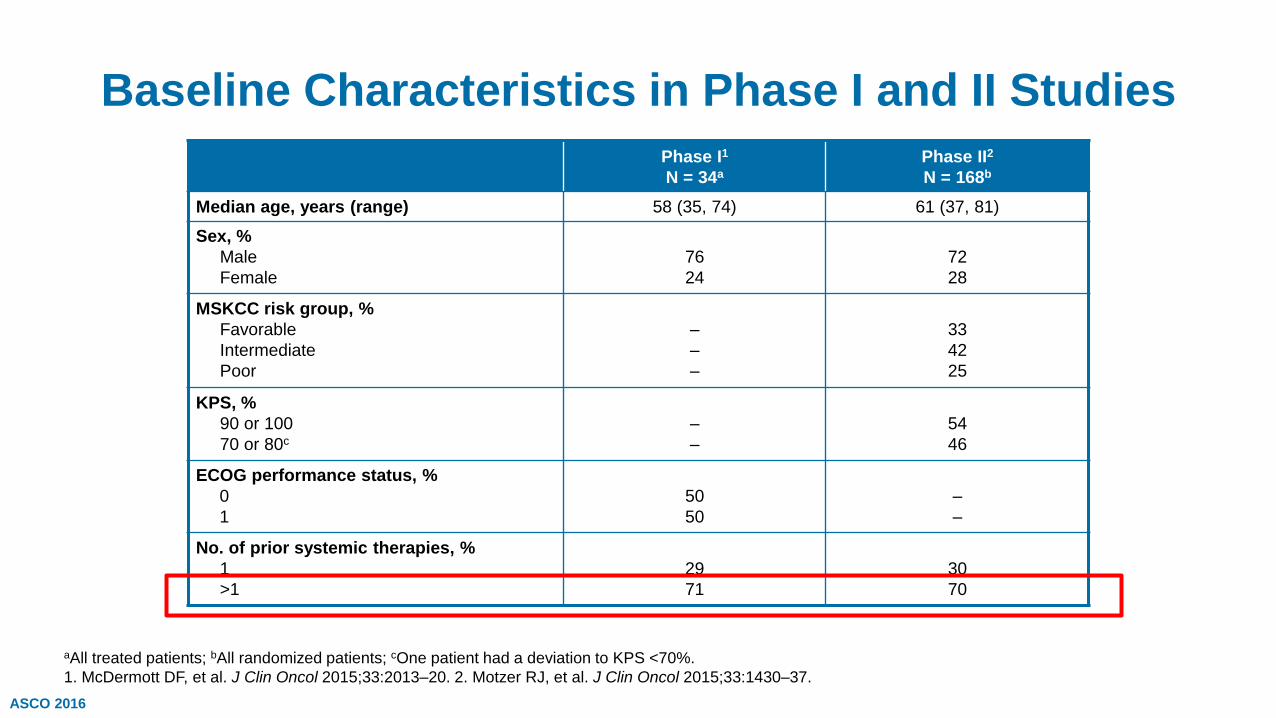
Baseline Characteristics in Phase I and II Studies
aAll treated patients; bAll randomized patients; cOne patient had a deviation to KPS <70%.
1. McDermott DF, et al. J Clin Oncol 2015;33:2013–20. 2. Motzer RJ, et al. J Clin Oncol 2015;33:1430–37.
Phase I1
N = 34a
Phase II2
N = 168b
Median age, years (range) 58 (35, 74) 61 (37, 81)
Sex, %
Male
Female
76
24
72
28
MSKCC risk group, %
Favorable
Intermediate
Poor
–
–
–
33
42
25
KPS, %
90 or 100
70 or 80c
–
–
54
46
ECOG performance status, %
0
1
50
50
–
–
No. of prior systemic therapies, %
1
>1
29
71
30
70

ASCO 2016
Overall Survival in Phase I and II Studies
NE, not estimable.
34 28 24 18 14 13 12 12 11 8 6 6 2 1 0
167 142 113 93 80 65 58 51 47 2 0 0 0 0 0
StudyMedian OS, months
(95% CI)
Phase I 22.4 (12.5–NE)
Phase II 23.4 (17.7–26.9)
0.0
0.1
0.2
0.3
0.4
0.5
0.6
0.7
0.8
0.9
1.0
0 6 12 18 24 30 36 42 48 54 60 66 72 78 84
No. of patients at risk
Phase I
Phase II
Overa
ll S
urv
ival
(Pro
bab
ilit
y)
Months
38%
29%
34%
• In phase I and II studies, minimum follow-up was 50.5 months and 49.2 months, respectively

ASCO 2016
Survival by MSKCC Risk Group in Phase II Study
1. Motzer RJ, et al. J Clin Oncol 2004;22:454–63.
56 52 47 40 36 28 25 22 18 1
70 59 45 38 33 28 25 23 23 1
42 32 22 15 11 9 8 6 6 0
0 6 12 18 24 30 36 42 48 54
MonthsNo. of patients at risk
Favorable
Intermediate
Poor
MSKCC risk group1
Median OS, months (80% CI)
Favorable (0) 35.5 (25.5–43.0)
Intermediate (1) 22.1 (17.7–26.9)
Poor (2–3) 12.5 (9.3–13.7)
0.0
0.1
0.2
0.3
0.4
0.5
0.6
0.7
0.8
0.9
1.0O
vera
ll S
urv
ival
(Pro
bab
ilit
y)
ASCO 2016
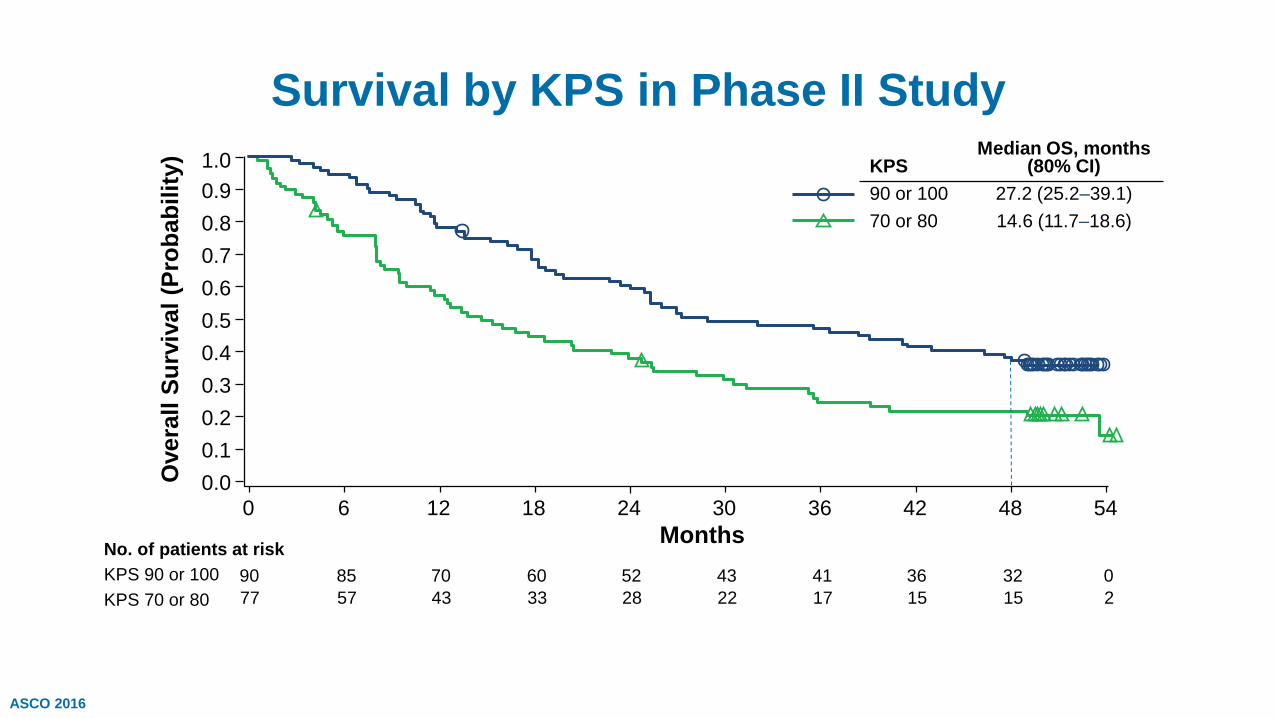
Survival by KPS in Phase II Study
KPSMedian OS, months
(80% CI)
90 or 100 27.2 (25.2–39.1)
70 or 80 14.6 (11.7–18.6)
77 57 43 33 28 22 17 15 15 2
0 6 12 18 24 30 36 42 48 54
MonthsNo. of patients at risk
KPS 90 or 100
KPS 70 or 80
90 85 70 60 52 43 41 36 32 0
0.0
0.1
0.2
0.3
0.4
0.5
0.6
0.7
0.8
0.9
1.0O
vera
ll S
urv
ival
(Pro
bab
ilit
y)

ASCO 2016
Survival by Response in Phase II Study
No. of patients at riska
CR/PR
SD
PD
4 10 16 22 28 34 40 46 52 58
Months
23 22 21 19 19 18 16 15 2 0
80 69 58 49 38 35 29 26 9 0
51 32 20 17 11 9 9 9 1 0
ResponseMedian OS, months
(95% CI)
CR/PR NR (34.3–NE)
SD 22.9 (18.7–31.8)
PD 9.0 (5.9–14.2)
0.0
0.1
0.2
0.3
0.4
0.5
0.6
0.7
0.8
0.9
1.0O
vera
ll S
urv
ival
(Pro
bab
ilit
y)
aAll treated patients evaluable for best overall response by 4 months.

ASCO 2016
Emergence of Select Treatment-related AEs (Any Grade) Over Time in Phase II Study
0
5
10
15
20
25
30
35
40
45
Overall ≤6 >6–≤12 >12–≤18 >18–≤24 >24–≤30 >30–≤36 >36
Months
Even
ts/p
ati
en
ts a
t ri
sk (
%)
167 167 88 62 44 36 25 21No. of patients at risk
• Select treatment-related AEs included endocrine, gastrointestinal, hepatic, pulmonary, renal, and skin

ASCO 2016
0
5
10
15
20
25
30
35
40
45
Overall ≤6 >6–≤12 >12–≤18 >18–≤24 >24–≤30 >30–≤36 >36
Months
Emergence of Select Treatment-related AEs (Any Grade) Over Time in Phase II Study
Even
ts/p
ati
en
ts a
t ri
sk (
%)
167 167 88 62 44 36 25 21No. of patients at risk
• Select treatment-related AEs included endocrine, gastrointestinal, hepatic, pulmonary, renal, and skin

ASCO 2016
Characteristics of Patients Alive at ≥4 Years in Phase II Study
• 15/48 patients alive at 4 years did not require subsequent therapy
N = 48
MSKCC risk group, %
Favorable
Intermediate
Poor
40
44
17
KPS, %
90 or 100
70 or 80
69
31
Best overall response, %
CR
PR
SD
PD
2
46
33
19

ASCO 2016
Long-term OS with Nivolumab
Conclusions
• This is the longest follow-up reported with PD-1/PD-L1 agent in mRCC
• After treatment with nivolumab in a second-line or later setting, these data show:
– Approximately one-third of patients are alive at 4 years (phase I and II) and 5 years (phase I)
– Long-term survival is achievable regardless of risk group, performance status, or best overall response (phase II)
– Safety profile is consistent with prior reports, and most select treatment-related AEs occur within 6 months

* MCBS-FT.ESMO, European Society for Medical Oncology; GR, recommendation grade; IFN, interferon; IL-2, interleukin-2; LE, level of evidence; MCBS, ESMO Magnitude of Clinical Benefit Scale v1.0; MCBS-FT, MCBS-field testing; RCC, renal cell carcinoma, TKI, tyrosine kinase inhibitor.1. Escudier B et al. Ann Oncol. 2016;27(supplement 5):v58-v68. 2, Kiesewetter B et al. ESMO Open. 2016;1:e000066. doi:10.1136/ esmoopen-2016-000066.
ESMO Guidelines: Treatment Algorithm for Advanced RCC1,2
Good or intermediate riskLE, GR, MCBS Poor risk
LE, GR, MCBS
First Line
StandardSuntinib
Bevacizumab + IFNPazopanib
I, A, 4I, A, 3*
I, ATemsirolimus II, A, 4*
OptionHigh dose IL-2
SorafenibBevacizumab + low dose IFN
III, CII, BIII, B
SunitnibSorafenibPazopanib
II, BIII, BIII, B
Post cytokinesLE, GR. MCBS Post TKIs
LE. GR, MCBS
Second Line
StandardAxitinib
SorafenibPazopanib
II, A, 3I, A, 3II, A, 3
NivolumabCabozantinib
I, A, 5*I, A, 3*
Option Suntinib III, AAxitinib
EverolimusSorafenib
II, B, 3II, B, 3III, B, 3
Post two TKIs LE, GR Post TKI & mTOR LE, GRPost TKI & nivolumab LE, GR
Post TKI & cabozantinib LE, GR
Third LineStandard
NivolumabCabozantinib
II, AII, A
SorafenibNivolumab
Cabozantinib
I, BV, AV, A
Cabozantinib V, A Nivolumab V, A
Option Everolimus II, BOther TKI
RechallengeIV, BIV, B
AxitinibEverolimus
IV, CIV, C
EverolimusAxitinib
V, BV, B
45

RingraziamentiSSD Oncologia Genito-urinariaUgo De GiorgiLuca BurgioCecilia MennaVincenza ConteducaCristian LolliGiuseppe SchepisiOrnella Carminati (sede Cesena) Lorena Rossi (specializzanda)
Laboratorio Bioscienze – T. GenitourinariValentina CasadioSamanta SalviGiorgia Gurioli
Biostatistica e data manager – T. GenitourinariSara TestoniValentina Gallà


