NUREG/CR-6864, Vol. 2 SAND2004-5901 Identification and Analysis of Factors Affecting Emergency Evacuations Appendices Sandia National Laboratories U.S. Nuclear Regulatory Commission Office of Nuclear Security and Incident Response Washington, DC 20555-0001
Transcript
NUREG/CR-6864, Vol. 2SAND2004-5901
Identification and Analysis ofFactors Affecting EmergencyEvacuations
Appendices
Sandia National Laboratories
U.S. Nuclear Regulatory CommissionOffice of Nuclear Security and Incident ResponseWashington, DC 20555-0001
AVAILABILITY OF REFERENCE MATERIALSIN NRC PUBLICATIONS
NRC Reference Material
As of November 1999, you may electronically accessNUREG-series publications and other NRC records atNRC's Public Electronic Reading Room athtto://www.nrc.pov/readina-rm.html. Publicly releasedrecords include, to name a few, NUREG-senespublications; Federal Register notices; applicant,licensee, and vendor documents and correspondence;NRC correspondence and internal memoranda;bulletins and information notices; inspection andInvestigative reports; licensee event reports; andCommission papers and their attachments.
NRC publications in the NUREG series, NRCregulations, and 1itle 10, Energy, in the Code ofFederal Regulations may also be purchased from oneof these two sources.1. The Superintendent of Documents
U.S. Government Printing OfficeMail Stop SSOPWashington, DC 20402-0001Internet bookstore.gpo.govTelephone: 202-512-1800Fax: 202-512-2250
2. The National Technical Information ServiceSpringfield. VA 22161-0002www.ntis.gov1-800-553-6847 or, locally, 703-605-6000
A single copy of each NRC draft report for comment isavailable free, to the extent of supply, upon writtenrequest as follows:Address: Office of the Chief Information Officer,
Reproduction and DistributionServices Section
U.S. Nuclear Regulatory CommissionWashington, DC 205554001
Some publications in the NUREG series that areposted at NRC's Web site addresshttp:/lwww.nrc.qov/readina-rm/doc-collections/nureasare updated periodically and may differ from the lastprinted version. Although references to material foundon a Web site bear the date the material was accessed,the material available on the date cited maysubsequently be removed from the site.
Non-NRC Reference Material
Documents available from public and special technicallibraries include all open literature items, such asbooks, journal articles, and transactions, FederalRegister notices, Federal and State legislation, andcongressional reports. Such documents as theses,dissertations, foreign reports and translations, andnon-NRC conference proceedings may be purchasedfrom their sponsoring organization.
Copies of industry codes and standards used in asubstantive manner in the NRC regulatory process aremaintained at-
The NRC Technical LibraryTwo White Flint North11545 Rockville PikeRockville, MD 20852-2738
These standards are available in the library forreference use by the public. Codes and standards areusually copyrighted and may be purchased from theoriginating organization or, if they are AmericanNational Standards, from-
American National Standards Institute11 West 42'd StreetNew York, NY 10036-8002www.ansi.org212-842-4900
Legally binding regulatory requirements are statedonly in laws; NRC regulations; licenses, includingtechnical specifications; or orders, not inNUREG-series publications. The views expressedIn contractor-prepared publications in this series arenot necessarily those of the NRC.
The NUREG series comprises (1) technical andadministrative reports and books prepared by thestaff (NUREG-XXXX) or agency contractors(NUREG/CR-XXXX), (2) proceedings ofconferences (NUREG/CP-XXXX), (3) reportsresulting from international agreements(NUREG/IA-XXXX), (4) brochures(NUREGIBR-XXXX), and (5) compilations of legaldecisions and orders of the Commission and Atomicand Safety Licensing Boards and of Directors'decisions under Section 2.206 of NRC's regulations(NUREG-0750).
DISCLAIMER: This report was prepared as an account of work sponsored by an agency of the U.S. Government.Neither the U.S. Government nor any agency thereof, nor any employee, makes any warranty, expressed orimplied, or assumes any legal liability or responsibility for any third party's use, or the results of such use, of anyinformation, apparatus, product, or process disclosed in this publication, or represents that its use by such thirdparty would not infringe privately owned rights.
NUREG/CR-6864, Vol. 2SAND2004-5901
Identification and Analysis ofFactors Affecting EmergencyEvacuations
AppendicesManuscript Completed: December 2004Date Published: January 2005
Prepared byL.J. Dotson, J. Jones
Sandia National LaboratoriesP.O. Box 5800Albuquerque, NM 87185
D. Schneck, NRC Project ManagerR. Sullivan, NRC Technical Lead
Prepared forDivision of Preparedness and ResponseOffice of Nuclear Security and Incident ResponseU.S. Nuclear Regulatory CommissionWashington, DC 20555-0001NRC Job Code J3056
ABSTRACT
Volume II contains the data and information that support Volume I. Appendix A contains adetailed listing of the 230 evacuations that comprise the universe of evacuations. Appendix Bcontains the evacuation form used to collect data for each of the 50 cases studied. Appendix Ccontains the results of the frequency analysis. The remaining appendices contain the SAS 8.02output for the regression analyses (Appendices F through K) and the correlation analyses(Appendix L).
.M
CONTENTS
Page
VOLUME I
ABSTRACT................................................................. iii
ABSTRACT................................................................. iii
A. Evacuation Universe .A-1B. Evacuation Form .B-IC. Statistical Summary Case Studies . C-ID. Case Studies .D-IE. Evacuation Frequency Analysis .E- 1F. Chi-Square Values for Likelihood Ratio Test of Association Between
Each Variable and Evacuation Efficiency Score .F-IG. Cross Tabulations with Evacuation Efficiency Score for Significantly
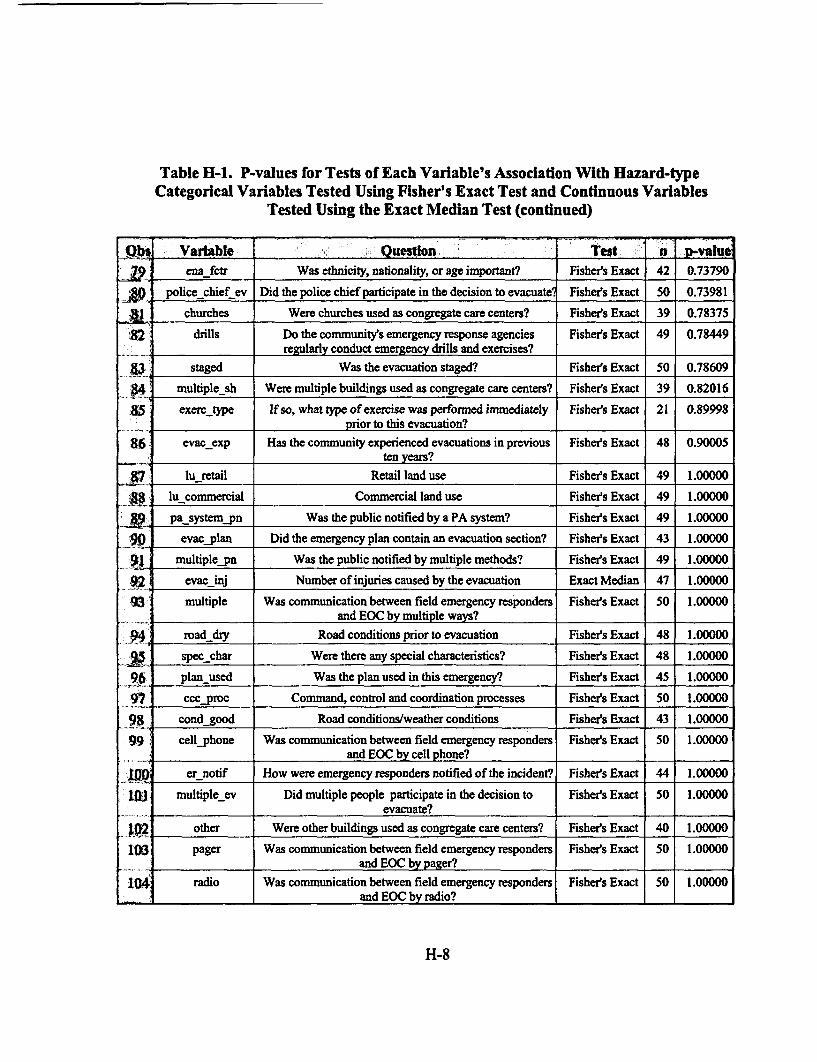
Associated Variables .G-1H. P-values for Tests of Each Variable's Association with Hazard-Type Categorical
Variables Tested Using Fisher's Exact Test and Continuous Variables TestedUsing the Exact Median Test .H-1
1. Chi-Square Values for Likelihood Ratio Tests of Association Between EachVariable and Evacuation Efficiency Score After Adjusting for Hazard Type .I-1
J. P-values for Tests of Association with Evacuation Efficiency Score forVariables with Significant or Marginally Significant Associations withEvacuation Efficiency Score .J-1
K. Cross Tabulations for Variables with Significant Interactions with HazardType Broken Down by Hazard Type .K-I
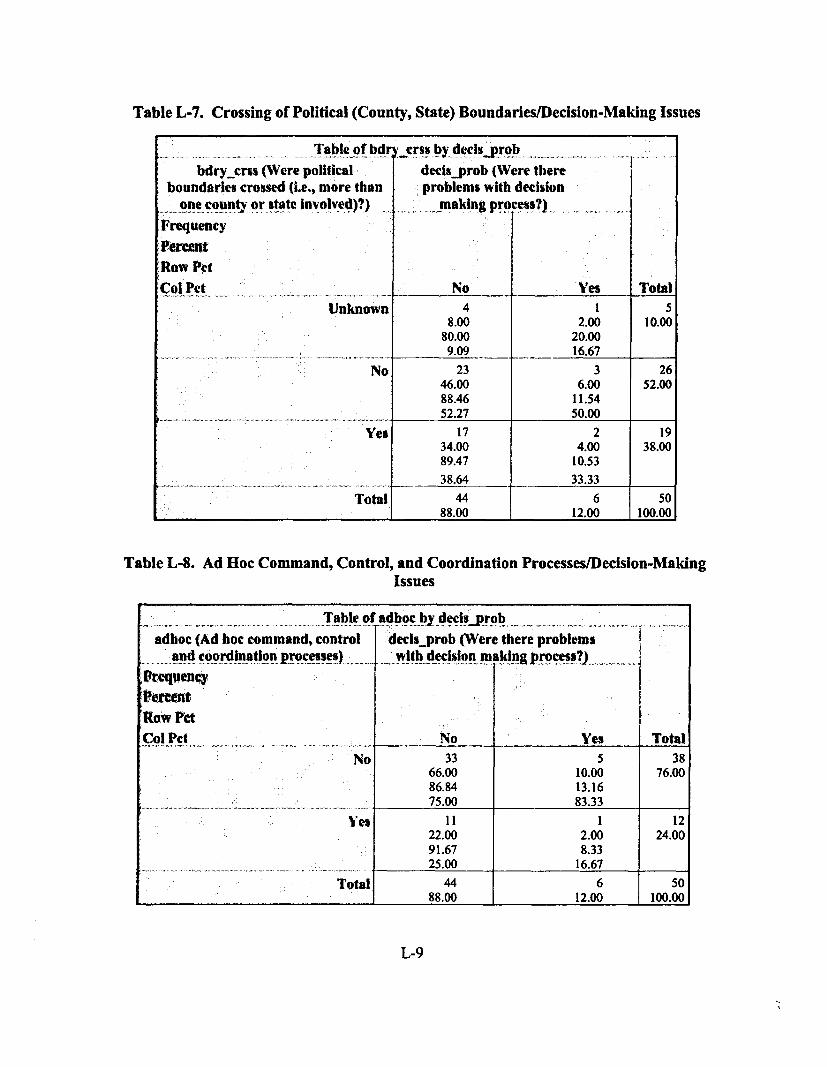
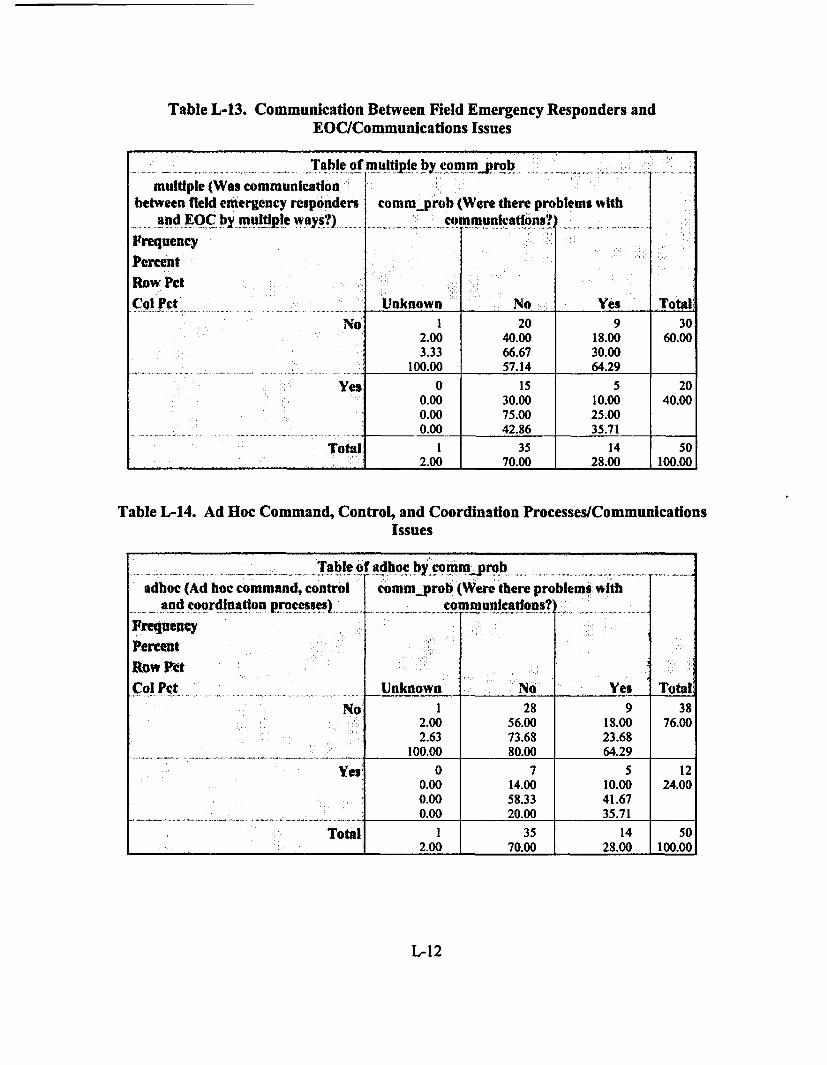
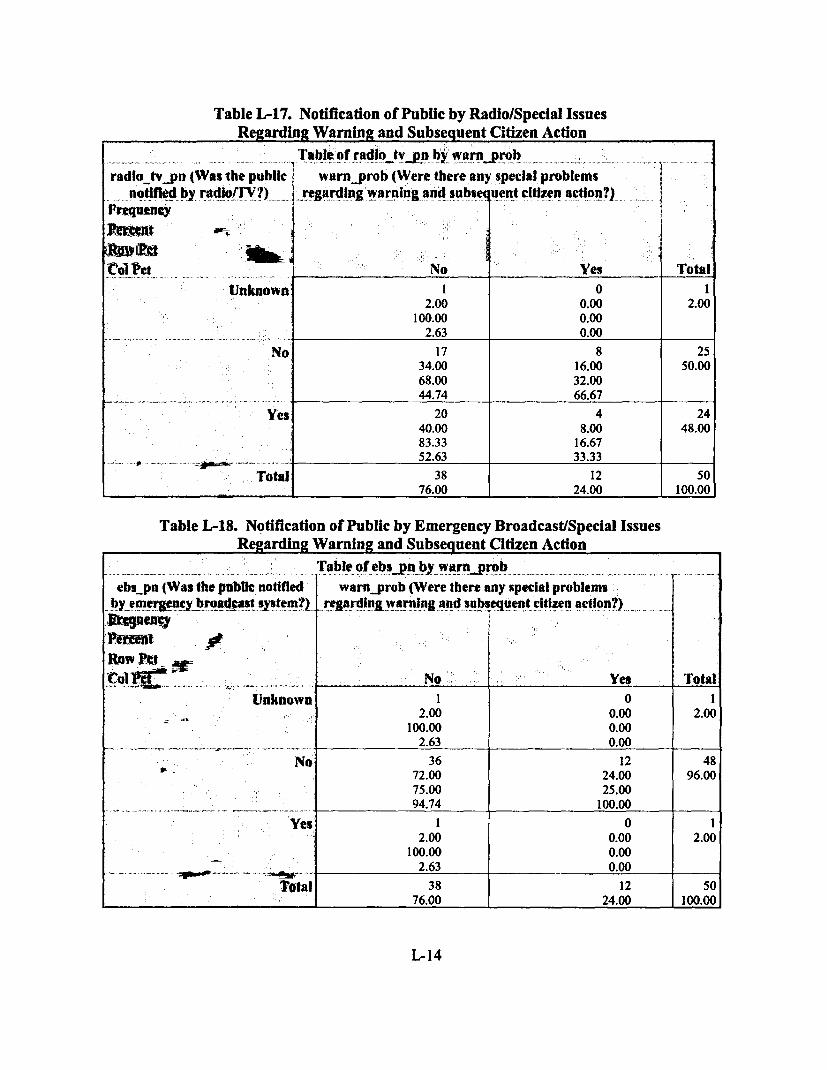
L. Cross Tabulations for Variables in the Correlation Analysis .L-1
Figures
Figure 4-1. Size Distribution of Large-Scale Evacuations in the United States,1/1/1990 - 6/30/2003 .14
Figure 4-2. Principal Causes of Large-Scale Evacuations in the United States1/1/1990 - 6/30/2003. 14
Figure 4-3. Total Number and Type of Large-Scale Evacuations in the United States,I/1/1990-6/30/2003 .16
Figure 4-4. Distribution of Large-Scale Evacuations in the U.S. Since 1990 ..... .......... 17
Tables
Table 3-1. Weights and Ratings Used to Rank the 230 Evacuation Incidents ..... .......... 8Table 3-2. Distribution of Evacuation Cases ............. .......................... 10
vi
Table 4-1. Elapsed Time Between Start of the Hazardand the Decision to Evacuate (Hours) .................................... 24
Table 4-2. Frequency of Spontaneous Early Evacuations by Hazard Type ..... ........... 27Table 4-3. Time to Complete the Evacuation (Hours) by Hazard Type ..... .............. 30Table 4-4. Evacuation Area (km2) by Hazard Type .................................. 31Table 4-5. Correlations and Associations with Law Enforcement Issues ................. . 31Table 4-6. Correlations and Associations with Warning and Subsequent Citizen
Action Issues ....................................................... 32Table 4-7. Correlations and Associations with Traffic Issues .......................... 32Table 4-8. Correlations and Associations with Emergency Communication Issues ... ....... 33Table 4-9. Correlations and Associations with the Decision-Making Process ..... ......... 33
vii
APPENDIX A
EVACUATION UNIVERSE
A-I
CONTENTS
Table A-1. Comprehensive List of Evacuation Incidents, January 1, 1990, throughJune 30, 2003 .................................................... A-5
A-3
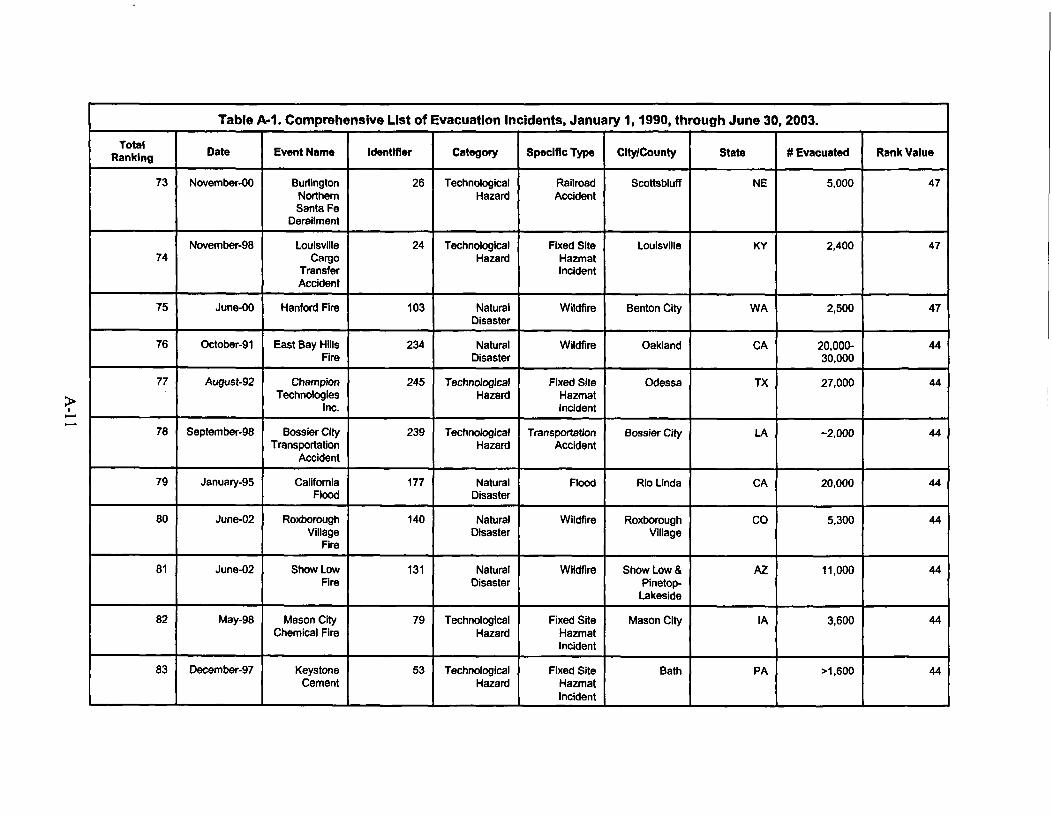
Table A-1. Comprehensive List of Evacuation Incidents, January 1, 1990, through June 30, 2003.
Total Date Event Name Identiffer Category Specific Type City/County State # Evacuated Rank ValueR anking__ _ _ _ _ _ __ _ _ _ _ _ __ _ _ _ _ _ __ _ _ _ _ ___ _ _ _ _ _
1 September-99 Hurricane 88B Natural Hurricane South to FL 373,144 78Floyd Disaster Broward
221 October-99 Belle Vista 205 Natural Wildfire Belle Vista CA >1,000 16Fire Disaster
222 September-97 Sierra Nevada 194 Natural Wildfire Oregon House CA 1,500 13Foothills Fire Disaster
223 May-98 Flood 168 Natural Flood Prineville OR 1,600 13Disaster
224 August-98 Tropical Storm 164 Natural Flood Del Rio and TX >1,000 13Charley Disaster Laredo
225 September-99 Kirk Complex 113 Natural Wildfire Near Big Sur CA -1,000 13Disaster
August-99 Dunn Glen 112 Natural Wildfire Near Battle NV >1,000 13226 Complex Disaster Mountain
227 August-99 Big Bear 111 Natural Wildfire Big Bear Lake CA >1,000 13Complex Disaster
228 August-95 Salinas River 221 Natural Flood Castroville CA >1,000 9Flood Disaster
229 March-93 Flood 12 Natural Flood U.S. Midwest NE 1,500 9Disaster .
230 January-93 Flood 14 Natural Flood U.S. CA, AZ 1.100 7I_________Disaster Southwest
APPENDIX B
EVACUATION FORM
B-1
EVACUATION FORM
TITLE
(Event Name, City, State, Date, Identifier)
INTRODUCTION
Brief introduction to the evacuation incident, including date and time, location, type of hazard,number of people evacuated, and special or unusual circumstances.
COMMUNITY CONTEXT
Community information summarized to include:
General community informationHistory or experience with hazards or emergenciesResources available, emergency preparedness activities (e.g., planning, training, drills andexercises, and community awareness)
Specific questions to be answered:GeneralCommunity: Urban, Rural, SuburbanPopulation:Number of people evacuated:Percent of population evacuated: _
Population density of area during evacuation (High, Low, Medium)Was ethnicity, nationality, or age important factor in evacuation (Yes, No)Size (sq. mi.; sq. km) of the community:Size (sq. mi.; sq. km) of evacuated area:Land uses in evacuation area (Residential, Commercial/Retail, Industrial, Agricultural, Other,Don't Know)Type of Community (Town, County, City, State, Other)Form of Government (Mayoral, City Manager, Commission/Board, Other)Community's main economic base (Farming, Tourism, Manufacturing/Industry,Commercial/Retail/Services, Other)Any special characteristics (e.g., tourism) that attract large number of non-residents (Yes(Explain ___), No, Don't Know, N/A)Proximity to a commercial nuclear power plant (0-10 mi., 11-50 mi., >50 mi.)Is community located in a state that contains a nuclear power plant (Yes, No, Don't Know)
B-3
. - -
History of EmergenciesIs area more prone to hazards than average (No, Yes-Natural Disasters, Yes-TechnologicalHazards, Yes-Both)Has community had any experience with the hazard that led to this evacuation (Yes, No, Don'tKnow, N/A)Has community experienced evacuations in previous ten years (Yes, No, Don't Know, N/A)Has the community had previous experience with the alerting mechanism used in this evacuation(Yes, No, Don't Know, N/A)
Emergencv PreparednessPlanningDid community have a written emergency plan (Yes, No, Don't Know, N/A)Did emergency plan contain an evacuation section (Yes, No, Don't Know, N/A)Was plan used in this emergency (Yes, No, Don't Know, N/A)Did plan conform to NUREG-0654 (Yes, No, Don't Know, N/A)Was there an Evacuation Time Estimate (ETE) in the plan (Yes, No, N/A)How did the actual evacuation time compare to the ETE (Over _%, Under_%, N/A)
TrainingIs training provided to emergency response personnel (Yes, No, Don't Know, N/A)Is joint training between industry and government regularly conducted (Yes, No, Don't Know,N/A)
Drills and Exercises
Do the community's emergency response agencies regularly conduct emergency drills andexercises (Yes, No, Don't Know, N/A)Was the emergency plan used in this evacuation previously tested in a full-scale field exercise(Yes, No, Don't Know, N/A)If so, what type of exercise was performed immediately prior to this evacuation (Full-scale fieldexercise, Functional Drill, Tabletop Exercise, Other)
Community Awareness
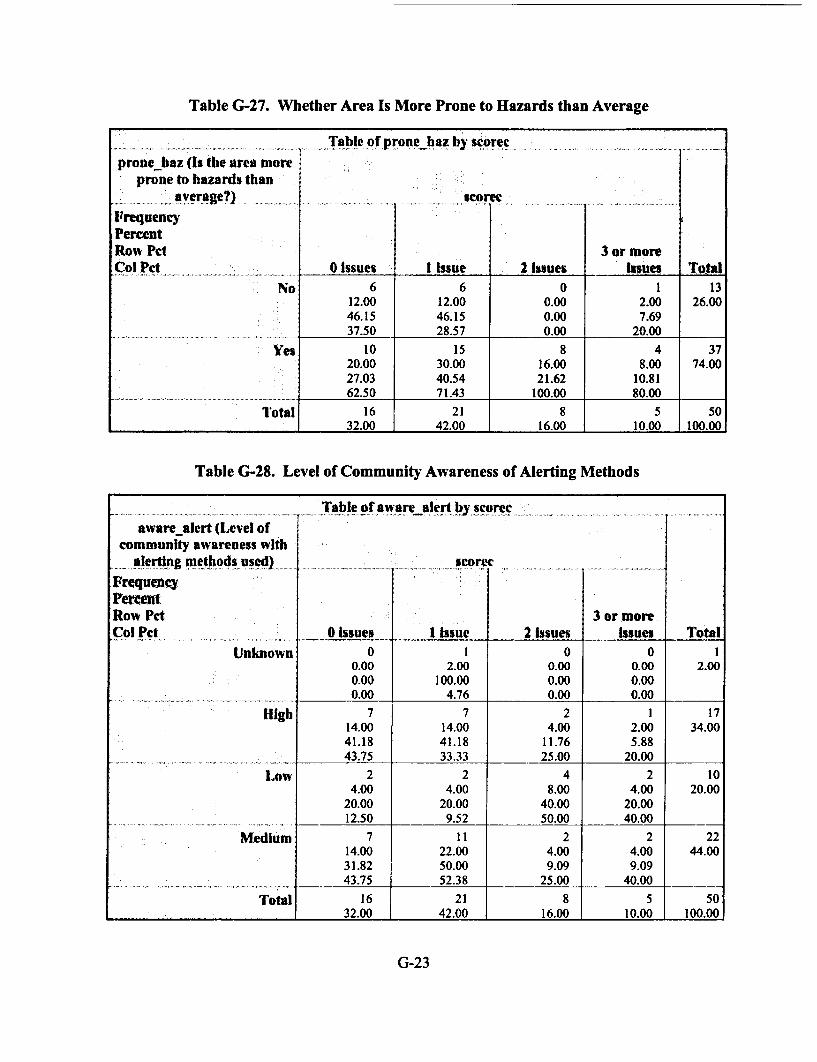
Level of community awareness of local hazards (High, Medium, Low)Level of community awareness of evacuation procedures (High, Medium, Low)Level of community awareness of hazard that caused evacuation (High, Medium, Low)Level of community awareness of alerting methods used (High, Medium, Low)
B-4
THREAT CONDITIONS
Brief summary of the threat or hazard that caused the evacuation, including weather, roadconditions, and unusual circumstances.
CONSEQUENCES
Brief summary of the consequences of the event, including, date, time and duration of the event,time to complete evacuation, statistics on the number of people evacuated, killed or injured, thedistance necessary to adequately evacuate from hazard, and cost information.
Specific questions to be answered:How many people evacuated:Number of deaths and injuries caused by the hazardNumber of deaths and injuries caused by the evacuationEstimated total cost of evacuation-related expenses and property damages (not damages due tohazard) incurred by the public:
EMERGENCY RESPONSE
Summary of the emergency response, including general information on the organization(s)responding, decision-making, communications, notification and warning (e.g., time to warn),traffic movement and control, shelters, law enforcement, and re-entry.
Specific questions to be answered:Hazard that led to evacuation (Technological Hazard, Natural Disaster, or Terrorism)Time of day (Night, Day, Don't Know)
Decision MakingLevel of cooperation between local, state, and federal agencies (high, low, moderate)Were political boundaries crossed (i.e., more than one county or state involved) (Yes, No)Command, control and coordination processes (Ad hoc or Pre-planned)Who made decision to evacuate (Mayor, Fire Chief, Police Chief, Emergency Manager,Governor, Other)Problems with decision making process (Yes (Explain), No, Don't Know, N/A)
CommunicationsEmergency Operations Center (EOC) used (Yes, No, Don't Know, N/A)
B-5
Field (incident) command post used (Yes, No, Don't Know, N/A)Communication between field emergency responders and EOC (Radio, Telephone, Cell Phone,Other (List))Problems with communications (Yes, No, Don't Know, N/A)
Notification and WarningHow were senior local officials notified of the incident:How were emergency responders notified of the incident:Elapsed time between discovery of the incident and mobilization of response personnel (0-15min., 15-30 min., 31-60 min., 60+min.)Elapsed time between start of hazard and decision to evacuate:Time to complete the evacuation:Problems with notification of emergency personnel or senior local official (Yes, No, Don'tKnow)How was the public notified (Sirens, Telephone, Radio/TV Broadcasts, EBS, Police/Fire PASystem, NOAA, Other)Was evacuation staged or all at once (Staged, All at Once)Any special problems regarding warning and subsequent citizen action (Yes (Explain), No,Don't Know, N/A)
Traffic Movement and ControlWere people given specific instructions about where to go when they evacuated (Yes (Explain),No, Don't Know, N/A)Were people told to use specific routes (Yes, No, Don't Know, N/A)How were these routes designated:How many special institutions (e.g. hospitals, prisons) were evacuated: (Explain)Road conditions prior to evacuation (Dry, Wet, Icy, Other)Were any major roadways unavailable for use due to construction, damage caused by the hazard,etc. (Yes, No, Don't Know, N/A)Were there any special traffic problems encountered (Yes (Explain), No, Don't Know, N/A)Did some people spontaneously evacuate before being told to do so (Yes (Explain), No, Don'tKnow, N/A)Was reverse-laning used (Yes, No, Don't Know, N/A)Were there any traffic accidents during the evacuations (Yes, No, Don't Know, N/A)Did anyone refuse to evacuate (Yes, No, Don't Know, N/A)
SheltersWere public shelters used (Yes, No, Don't Know, N/A)Who managed the shelters (Red Cross, Civil Defense, Other)What type of buildings were used as shelters (Schools, Churches, Public Buildings, Other (List))What percent of evacuees went to shelters:Did people evacuate from areas outside the designated evacuation area (Yes, No, Don't Know)Did this cause an impact on traffic (Yes, No, Don't Know)
B-6
Did this cause an impact on shelter capacity (Yes, No, Don't Know, N/A)
Law EnforcementHow was the area secured following the evacuation to prevent looting and vandalism (Police,National Guard, Other)Were there any instances of looting or vandalism (Yes, No, Don't Know, N/A)Any problems with law enforcement (Yes, No, Don't Know, N/A)
Re-EnrWho authorized re-entry (Mayor, Fire Chief, Police Chief, Emergency Manager, Governor,Other)Describe the Re-entry Process (Controlled Phased Reentry, No Special Controls, Other)Were evacuees compensated for their expenses (Yes (Explain), No, Don't Know, N/A)Any major problems during re-entry (Yes, No, Don't Know, N/A)
INVESTIGATOR COMMENTS
Specific questions asked of, or offered by, the Investigator to include, but not be limited to:What factors made the evacuation work well?What factors contributed to the evacuation's faults or problems?What were the lessons learned in this evacuation?Did the public's prior knowledge of the hazard, or prior evacuations, contribute to the success ofthe evacuation?
CONTACT INFORMATION AND REFERENCES
List of all personal contacts (e.g., fire chief, police chief, emergency manager) and otherreferences (e.g., news items, reports) used to answer the questionnaire and construct the casestudy narrative.
B-7
APPENDIX C
STATISTICAL SUMMARY CASE STUDIES
C-l
CONTENTSPage
Table C- 1. General Community Statistics .................................... C-5Table C-2. History of Emergencies Statistics . ................................... C-8Table C-3. Emergency Preparedness Statistics . ................................... C-9Table C-4. Emergency Response Statistics . ................................... C-i 1
C-3
Table C-1. General Community Statistics.
Question Response # of Cases % of Cases
Community type Urban 9 18
Rural 5 10
Suburban 36 72
Unknown 0 0
Population <2,000 2 4
2,000-5,000 4 8
>5,000 44 88
Unknown 0 0
Number of people <2,000 6 12evacuated
2,000-5,000 23 46
>5,000 21 42
Percent of population <10% 15 30evacuated
10-20% 8 16
20-50% 12 24
51-99% 3 6
100% 10 20
Unknown 2 4
Population density High 14 28
during evacuation Low 16
Medium 24 48
Unknown 4 8
Was ethnicity, Yes 10 20nationality, or age an
important factor in No 32evacuation? Unknown 8 16
C-S
Table C-i. General Community Statistics (continued).
Question Response # of Cases % of Cases
Community size <2.6 km2 (<I mi2) 1 2
2.6-13 km2 (1-5 mi 2 ) 5 10
>13 km2 (>5 mi2) 43 86
Unknown 1 2
Size of evacuated area <2.6 km2 (<1 mi2 ) 3 6
2.6-13 km2 (1-5 mi2) 24 48
>13 km2 (>5 mi2) 13 26
Unknown 10 20
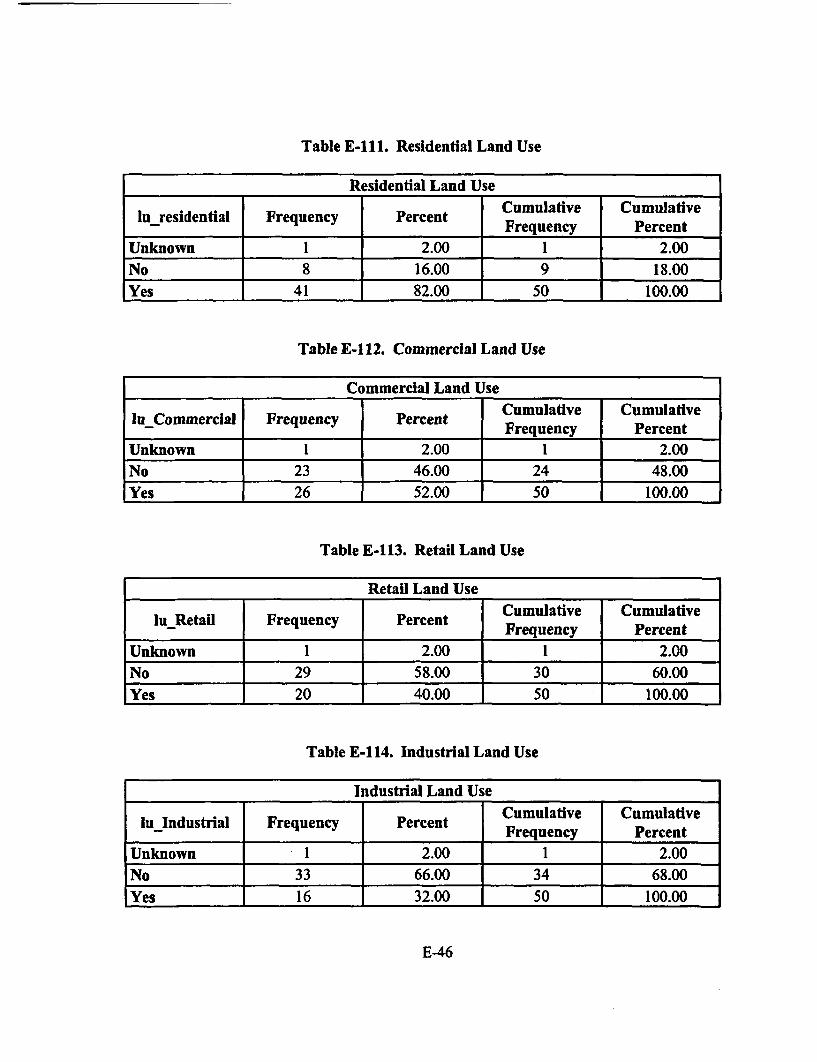
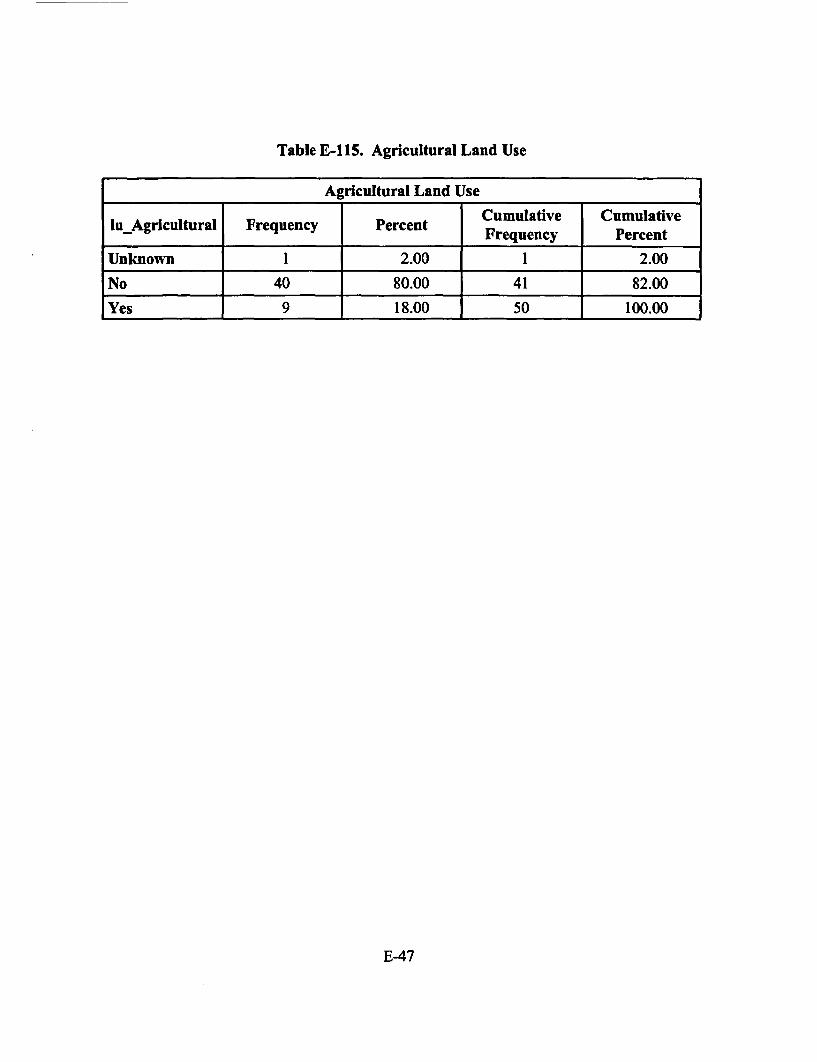
Land uses in Residential 41 82evacuation area
Commercial/Retail (plus 26 52other uses)
Industrial Agricultural 18 36
Multiple Land Use 30 60
Unknown 1 2
Type of community Town 9 18
County 8 16
City 31 62
State 0 0
Other 2 4
Form of government Mayoral 32 62
City Manager 2 4
Commission/Board 8 16
Other 8 16
Unknown 0 0
C-6
Table C-1. General Community Statistics (continued).
Question Response # of Cases % of Cases
Community's main Farming 9 18economic base
Tourism 14 28
Manufacturing/Industry 21 42
Government 1 2
Commercial/RetaiV 20 40Services
Other 13 26
Any special Yes 37 74characteristics (e.g.,tourism) that attract No 11 22
large number of non-residents? Unknown 2 4
Proximity to a 0-16 km (0-10 mi) 4 8commercial nuclear
power plant 17-80 kIa (1 1-50 mi) 11 22
>80 km (>50 mi) 35 70
Is the community Yes 39 78located in a state that
contains a nuclear No 11 22power plant?
C-7
Table C-2. History of Emergencies Statistics.
Question Response of cases % of cases
Is the area more prone to hazards No 13 26than average? Yes- Natural Disasters 8 16
Yes- Technological Hazards 9 18Yes- Both 20 40
Has the community had any Yes 25 50experience with the hazard that led No 24 48to this evacuation? Unknown 1 2Has the community experienced Yes 23 46evacuations in previous ten years? No 25 50
Unknown 2 4Has the community had previous Yes 22 44experience with the alerting No 18 36mechanism used in this Unknown 5 10evacuation? N/A 5 10
C-8
Table C-3. Emergency Preparedness Statistics.
Question Response # of cases % ofI I I cases
PlanningDid the community have a written emergency plan? Yes 47 94
No 3 6Did the emergency plan contain an evacuation Yes 40 80section? No 3 6
Unknown 4 8N/A 3 6
Was the plan used in this emergency? Yes 43 86No 1 2Unknown 2 4N/A 4 8
Did the plan conform to NUREG-0654? Yes 6 12No 16 32Unknown 23 46N/A 5 10
Was there an Evacuation Time Estimate (ETE) in the Yes 1 2plan? No 13 26
Unknown 2 4N/A 34 68
TrainingWas training provided to response personnel? Yes 50 100
No 0 0Was there joint training between industry and Yes 40 80government? No 8 16
_ N/A 2 4Drills and ExercisesDo the community's emergency response agencies Yes 42 84regularly conduct emergency drills and exercises? No 7 14
_ Unknown 1 2Was the emergency plan used in this evacuation Yes 20 40previously tested in a full-scale field exercise? No 20 40
Unknown 8 16N/A 2 4
If so, what type of exercise was performed Full-scale fieldimmediately prior to this? exercise 16 32
Question Response # of cases % of casesHow was the public notified? Sirens (plus other methods) 7 14
Telephone 9 18Radio/TV broadcasts (plusother methods) 24 48EBS (plus other methods) 2 4Police/Fire PA system 27 54Door-to-Door 31 62Multiple 34 68
Was the evacuation staged or all at once? Staged 20 40All at once 30 60
Were there any special problems Yes 12 24regarding warning and subsequent citizen No 38 76action? Unknown 0 0Traffic Movement and ControlWere people given specific Yes 39 78instructions about where to go and No 6 12when they evacuated? Unknown 4 8
N/A 1 2
Were people told to use specific Yes 31 62routes? No 15 30
Unknown3 6N/A 1 2
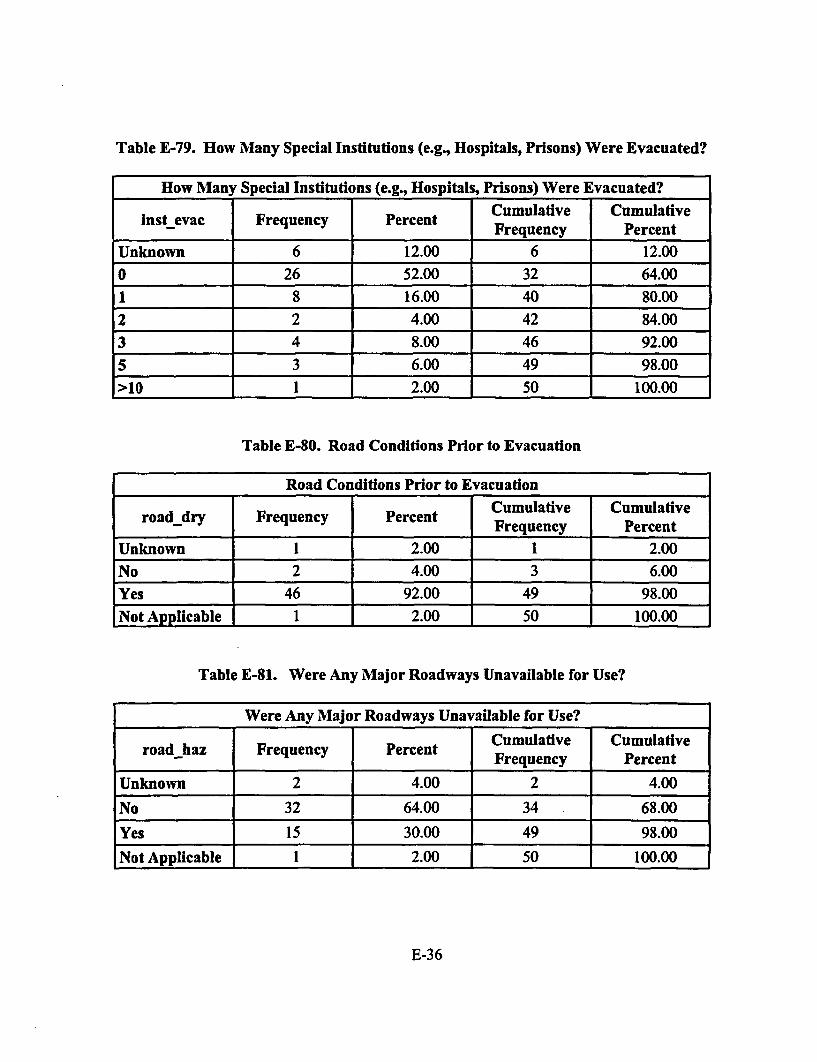
How many special institutions (e.g., 0 26 52hospitals, prisons) were evacuated? 1 8 16
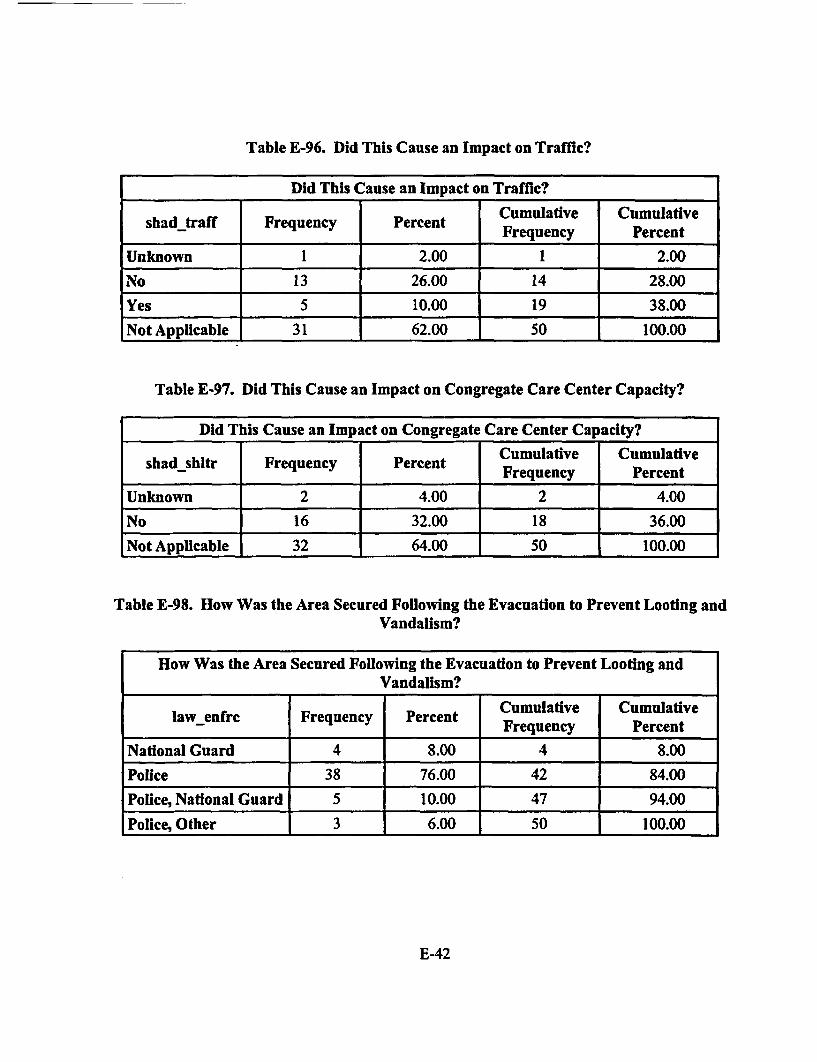
Question Response # of cases % of casesDid this cause an impact on congregate Yes 0 0care center capacity? No 17 34
Unknown 2 4N/A 31 62
Law EnforcementHow was the area secured following the Police only 38 76evacuation to prevent looting and National Guard only 4 8vandalism? Police and National Guard 5 10
Other 3 6Were there any instances of looting or Yes 5 10vandalism? No 45 90Were there any problems with law Yes 3 6enforcement? No 47 94Re-EntryWho authorized re-entry? Mayor 6 12
Describe the re-entry process Controlled phased re-entry 9 18No special controls 40 80Unknown 1 2
Were evacuees compensated for their Yes 14 28expenses? No 32 64
Unknown 4 8Were there any major problems during re- Yes 4 8entry? No 44 88
Unknown 2 4
C-15
APPENDIX D
CASE STUDIES
D-1
CONTENTS
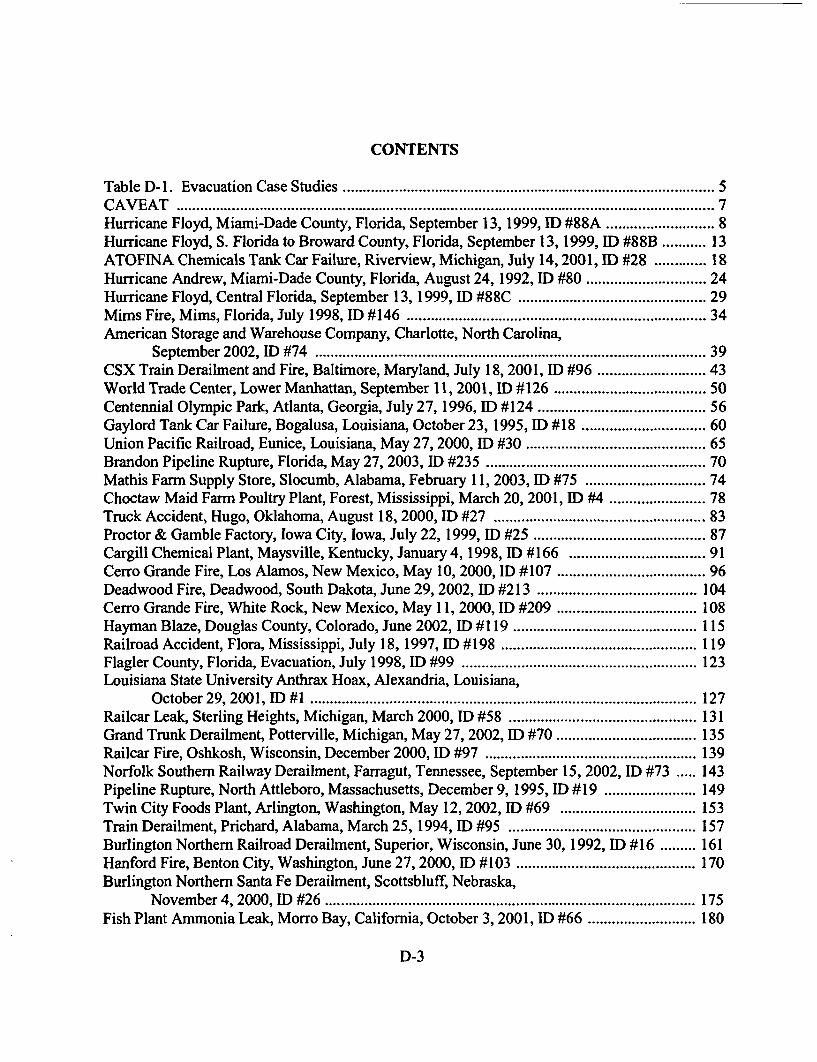
Table D-1. Evacuation Case Studies ................................................................ 5CAVEAT ............................................................... 7Hurricane Floyd, Miami-Dade County, Florida, September 13, 1999, ID #88A ............ ............... 8Hurricane Floyd, S. Florida to Broward County, Florida, September 13, 1999, ID #88B ........... 13ATOFINA Chemicals Tank Car Failure, Riverview, Michigan, July 14,2001, ID #28 ......... .... 18Hurricane Andrew, Miami-Dade County, Florida, August 24, 1992, ID #80 ............. ................. 24Hurricane Floyd, Central Florida, September 13, 1999, ID #88C .......................... ..................... 29Mims Fire, Mims, Florida, July 1998, ID #146 ...................................... ......................... 34American Storage and Warehouse Company, Charlotte, North Carolina,
September 2002, ID #74 ............................................................... 39CSX Train Derailment and Fire, Baltimore, Maryland, July 18, 2001, ID #96 ............ ............... 43World Trade Center, Lower Manhattan, September I1, 2001, ID #126 ................. ..................... 50Centennial Olympic Park, Atlanta, Georgia, July 27, 1996, ID #124 .................... ...................... 56Gaylord Tank Car Failure, Bogalusa, Louisiana, October 23, 1995, ID #18 ............. .................. 60Union Pacific Railroad, Eunice, Louisiana, May 27, 2000, ID #30 ....................... ...................... 65Brandon Pipeline Rupture, Florida, May 27, 2003, ID #235 ....................................................... 70Mathis Farm Supply Store, Slocumb, Alabama, February 11, 2003, ID #75 ............. ................. 74Choctaw Maid Farm Poultry Plant, Forest, Mississippi, March 20, 2001, ID #4 ........... ............. 78Truck Accident, Hugo, Oklahoma, August 18, 2000, ID #27 ..................................................... 83Proctor & Gamble Factory, Iowa City, Iowa, July 22, 1999, ID #25 ..................... ...................... 87Cargill Chemical Plant, Maysville, Kentucky, January 4, 1998, ID #166 ............... ................... 91Cerro Grande Fire, Los Alamos, New Mexico, May 10, 2000, ID #107 ................ ..................... 96Deadwood Fire, Deadwood, South Dakota, June 29, 2002, ID #213 .................. ...................... 104Cerro Grande Fire, White Rock, New Mexico, May 11, 2000, ID #209 ............... .................... 108Hayman Blaze, Douglas County, Colorado, June 2002, ID #119 ......................... ..................... 115Railroad Accident, Flora, Mississippi, July 18, 1997, ID #198 ............................. .................... 119Flagler County, Florida, Evacuation, July 1998, ID #99 ........................................................... 123Louisiana State University Anthrax Hoax, Alexandria, Louisiana,
October 29, 2001, ID #1 ............................................................... 127Railcar Leak, Sterling Heights, Michigan, March 2000, ID #58 .......................... ..................... 131Grand Trunk Derailment, Potterville, Michigan, May 27, 2002, ID #70 ............... .................... 135Railcar Fire, Oshkosh, Wisconsin, December 2000, ID #97 ..................................................... 139Norfolk Southern Railway Derailment, Farragut, Tennessee, September 15, 2002, ID #73 ..... 143Pipeline Rupture, North Attleboro, Massachusetts, December 9, 1995, ID #19 ........... ............ 149Twin City Foods Plant, Arlington, Washington, May 12, 2002, ID #69 .............. .................... 153Train Derailment, Prichard, Alabama, March 25, 1994, ID #95 .......................... ..................... 157Burlington Northern Railroad Derailment, Superior, Wisconsin, June 30, 1992, ID #16 ......... 161Hanford Fire, Benton City, Washington, June 27, 2000, ID #103 ....................... ...................... 170Burlington Northern Santa Fe Derailment, Scottsbluff, Nebraska,
November 4, 2000, ID #26 ............................................................... 175Fish Plant Ammonia Leak, Morro Bay, California, October 3, 2001, ID #66 ............ ............... 180
D-3
Louisville Cargo Transfer Accident, Louisville, Kentucky, November 19, 1998, ID #24 ........ 184Pesticide Tanker Truck Explosion, Balch Springs, Texas, April 14, 1994, ID #243 .......... ...... 188East Bay Hills Fire, Oakland, California, October 20, 1991, ID #234 ................... ................... 192Railroad Accident, Appleton and Grand Chute, Wisconsin, November 3, 1997, ID #52 ......... 197Keystone Cement, Bath, Pennsylvania, December 9, 1997, ID #53 ...................... .................... 201Propane Storage Facility Fire, Pascagoula, Mississippi, October 1998, ID #3 ............ .............. 205Transportation Accident, Bossier City, Louisiana, September 18, 1998, ID #239 .......... .......... 209Paint Plant Hazardous Materials Release, Chicago, Illinois, August 5, 1997, ID #51 .............. 213Plastics Plant Fire, Mason City, Iowa, May 1998, ID #79 ......................................................... 217Champion Technologies Inc., Odessa, Texas, August 20, 1992, ID #245 ............... .................. 220Liquified Chlorine Gas Leak, Henderson, Nevada, May 6, 1991, ID #36 ............... .................. 225Railroad Accident, Shepherdsville, Kentucky, November 19, 1991, ID #92 ............. ............... 231Rodeo-Chediski Fire, Show Low, Arizona, June 18, 2002, ID #116 ..................... ................... 235Biscuit Fire, Cave Junction, Oregon, July 13, 2002, ID #133 ................................................... 239
D-4
Table D-1. Evacuation Case Studies.
Identifier Date Category Specific Type clty/ State Rank_ _ _ _ _ _ _ _ _ _ _ _ _ _ _ _ _ _ _ _ _ _ _ County _ _ __ Evacuated Value
92 November-91 Technological Railroad Accident Sheperdsville KY 1,000 42____________ H azard _ _ _ _ _ _
116 June-02 Natural Disaster Wildfire Show Low AZ 20,000 42
133 July-02 Natural Disaster Wildfire Cave OR 1,000 33
D-6
CAVEAT
The following case study discussions frequently use relativistic terms such as low, medium, andhigh, below and above average, etc. In all such cases, "average" refers to the average U.S. cityor average U.S. community and does not refer to the "average" case among the 50 cases studied.
D-7
Hurricane Floyd, Miami-Dade County, Florida, September 13, 1999, ID #88A
On September 13, 1999, Hurricane Floyd caused the largest peacetime evacuation in U.S.history. Four states had evacuations in response to Hurricane Floyd (Florida, Georgia, NorthCarolina, and South Carolina). Although estimates vary, it was widely reported that two millionpeople were evacuated in the state of Florida alone. The following case study examines theevacuation in Miami-Dade County, Florida, where 270,403 people were evacuated. No deathsor injuries occurred during the evacuation. However, many people experienced near gridlock onthe major evacuation routes. Others expressed frustration over the lack of communication andpoor dissemination of emergency information by officials.
COMMUNITY CONTEXT
GeneralMiami-Dade County consists of suburban communities with a total population of 2,253,362people. Approximately 270,403 residents (12% of the population) were evacuated. Land use inthe evacuated area is residential, commercial, industrial, and agricultural. The total area ofMiami-Dade is 6,297 km2 (2,431 mi2 ) and the evacuated area covered 629 km2 (243 mi2). Thepopulation density of the area during the evacuation was variable (high in some places and lowin others). Nationality and age were important factors in the evacuation. Florida has a largeelderly population and there were some problems associated with evacuating elderly residentsfrom their own homes as well as from assisted-living facilities. Florida also has a large Hispanicpopulation, and there were some problems related to the language barrier.
Miami-Dade County has a commission form of government and its economic base is farming,tourism, manufacturing, and commercial. Tourism attracts a large number of non-residents. Aportion of the evacuated area is located within the EPZ of the Turkey Point Nuclear Power Plant,which is located 48 km (30 mi) south of Miami, Florida. Turkey Point sustained a direct hitfrom Hurricane Andrew in 1992. Florida has several commercial nuclear power plants.
D-8
History of EmergenciesThe Miami-Dade area is more prone to natural disasters, particularly storms, than the averageU.S. community. Miami-Dade residents had evacuated in response to Hurricane Andrew in1992 and had previous experience with the alerting mechanisms used for Hurricane Floyd.Evacuations are common in Florida because of its vulnerability to hurricanes and densepopulation along the coast. The communities involved in the Floyd evacuation were wellprepared for an evacuation event. Since the mid-1980s, the Department of Community Affairs,Division of Emergency Management has performed regional hurricane evacuation studies inorder to provide critical emergency management data to state and local officials who must makedecisions to evacuate. These studies have determined the extent of an expected hurricane stormsurge, the number of residents living in surge areas, the destinations of evacuees, evacuationroutes, and congregate care center locations. They have also calculated the amount of clearancetime needed to safely evacuate vulnerable residents to places of greater safety. Based on theseresults, state and local emergency management officials can determine how much advance timewill be needed to evacuate all vulnerable residents to safety, and plan accordingly.
Emergencv PreparednessThe community's emergency preparedness activities include planning, training, drills andexercises, and community awareness as described below.
PlanningThe community had a written emergency plan with an evacuation section that was used in thisemergency. The plan did not conform to NUREG-0654/FEMA-REP-1, Rev. 1, and did notcontain an ETE.
TrainingTraining is provided to emergency response personnel and joint training between industry andgovernment is regularly conducted.
Drills and ExercisesThe community's emergency response agencies regularly conduct emergency drills andexercises. The emergency plan used in this evacuation was previously tested in a full-scale fieldexercise.
Community AwarenessThe level of community awareness of local hazards and of evacuation procedures was medium.The level of community awareness about the hazard that caused this evacuation and with alertingmethods used was high.
THREAT CONDITIONS
On September 13, 1999, Hurricane Floyd threatened Florida as a massive Category 4 storm,equal in power to Hurricane Andrew (1992), but four times larger. The area of hurricane force
D-9
winds extended well over 150 miles from the eye of the storm, requiring hurricane warningsfrom south Florida to Massachusetts. Weather conditions during the evacuation were dry andwarm, and there were no unusual circumstances that occurred during this incident other than thehazard itself.
CONSEQUENCES
Over two million people in Florida evacuated in response to Hurricane Floyd. Approximately270,403 residents were evacuated from their homes and businesses in the Miami-Dade areaalone. No injuries or deaths were associated with the evacuation or the hurricane in Florida.However, there were 56 deaths in other states, mostly due to drowning from freshwater floods.Hurricane Floyd caused only minor property damage as it skirted the state of Florida. Theestimated total cost of evacuation-related expenses is unknown.
EMERGENCY RESPONSE
Decision MakingThe level of cooperation between local, state, and federal agencies was high and politicalboundaries were crossed. The command, control, and coordination process could best bedescribed as pre-planned. The decision to evacuate was made by the county commissioner, andthere were no problems with the decision-making process.
CommunicationsAn EOC was used but there was no ICP. Communication among emergency responders was byradio, and there were no problems with communication.
Notification and WarningSenior local officials were notified by radio. The elapsed time between the discovery of theincident and the mobilization of response personnel is unknown. The elapsed time between thestart of the hazard and the decision to evacuate was 108 hours. It took approximately 14 hours tocomplete the evacuation. There were no problems with notification of emergency responsepersonnel or senior local officials. The public was notified by radio and television broadcasts,police and fire department PA systems, and a reverse-91 I phone system. The evacuation wasstaged, and there were no problems regarding warning or subsequent citizen action.
Traffic Movement and ControlMajor evacuation routes were gridlocked because too many people tried to leave at the sametime. This study identified the need for reverse-laning along major evacuation routes.Mammoth traffic jams had left motorists stuck, in many instances, on bumper-to-bumperinterstate highways for ten hours or more, in order to complete drives to safety they expectedwould last two to three hours.
D-10
Evacuees were not given specific instructions about where to go when they evacuated, but a listof congregate care centers was provided. Special institutions were evacuated, includinghospitals and assisted living facilities. Road conditions prior to the evacuation were dry, and allmajor roadways were available to evacuees. There were special traffic problems encounteredinvolving very heavy traffic. Some people spontaneously evacuated and others refused toevacuate. There were no traffic accidents during the evacuation and reverse-laning was not used.
Congregate Care CentersThe Red Cross, Salvation Army, and local agencies set up congregate care centers in variousschools and churches. Approximately 6% of the evacuees made use of the congregate carecenters. There were shadow evacuations that did have an impact on traffic but did not impactcongregate care center capacity.
Law EnforcementPolice secured the area following the evacuation. There were no instances of looting orvandalism and no problems with law enforcement.
Re-EntryThe county commissioner authorized re-entry and there were no special controls in place.Insurance companies compensated evacuees for their expenses and there were no problemsduring re-entry. However, it was unclear to some evacuees when it was safe to go home(re-entry), which is one reason the Task Force recommended disseminating this type ofinformation over the internet.
INVESTIGATOR COMMENTS
County and state coordination and the public's prior knowledge of the hazard and evacuationsare factors that made the evacuation work well. Some lessons learned from the evacuation were:
* People need to be better informed about who does not need to evacuate.* Congregate Care Centers need to be very visible and made more public.* A better system needs to be developed to communicate with people on the road.
Some solutions that Florida has developed for these problems are:
* The community now has a system that counts and monitors the amount of traffic across thestate.
* Florida's public radio can now broadcast evacuation updates.* The community now has a plan that can implement reverse-laning.* The community now has an Evacuation Liaison Team* Transportation models were developed to show evacuation transportation information
systems and their impact on surrounding states and regions.
D-ll
* The federal highway administration is now involved in Florida's evacuations.* The community now has a state web site.
CONTACT INFORMATION AND REFERENCES
Contacts
State of Florida, All Hazards Planning Manager, Division of Emergency Management (Meeting,8/26/03)
FEMA Region IVAtlanta, GA(770) 220-5430(Personal communications, April and May 2003)
References
Dumont, Robert. "The Legacy of Hurricane Floyd-Inland Flooding and a Massive Evacuation."<http://www.ofcm.gov/fp-fyO 1 /pdf/sec l .pdf>
Federal Highway Administration (U.S.). "Evacuation Traffic Information System, SoutheastHurricane Evacuation Study." 2003.<http://www.fhwaetis.com/etis/ReportLinks/floydrpt.htm> (April 2003).
Florida Department of Transportation. "Governor's Hurricane Evacuation Task Force Report."<http://www 1 I.myflorida.com/publicinformationoffice/EvacuationStudy/HurricaneTaskForceReport.doc> (June 2003).
North Carolina Shore and Beach (U.S.). "Beach Nourishment for Hurricane Protection: NorthCarolina Project Performance In Hurricanes Dennis and Floyd." 2000.<http://www.ncshoreandbeach.org/Dennis-Floyd-Study.htm> (April 2003).
Hosock, H. "Safe But Annoyed: The Hurricane Floyd Evacuation in Florida." Case 1652.Kennedy School of Government Case Programs, Harvard University, Boston, Massachusetts.
The Disaster Center. "Hurricane Floyd Reports."<http://www.disastercenter.com/hurricf9.htm> (June 2003).
D-12
Hurricane Floyd, S. Florida to Broward County, Florida, September 13, 1999, ID #88B
On September 13, 1999, Hurricane Floyd was the cause of the largest peacetime evacuation inU.S. history. Four states had evacuations in response to Hurricane Floyd (Florida, Georgia,North Carolina, and South Carolina). Although estimates vary, it was widely reported that twomillion people were evacuated in the state of Florida alone. The following case study examinesthe evacuation of 373,144 people in the southern portion of Florida down to Broward County.No deaths or injuries occurred during the evacuation. However, many people experienced neargridlock on the major evacuation routes. Others expressed frustration over the lack ofcommunication and poor dissemination of emergency information by officials.
COMMUNITY CONTEXT
GeneralThe southern portion of Florida down to Broward County has a total population of 3,109,538people. Approximately 373,144 residents (or 12% of the population) were evacuated. Land usein the area is primarily residential, commercial, retail, and industrial. The total area of that partof the state is 6,039 mi2 (15,640 km2 ) and the evacuated area was 483 mi2 . The populationdensity of the area during the evacuation was high in some areas and low in others. Ethnicityand nationality were not important factors in the evacuation; however, age was an importantfactor because a large population of elderly residents was evacuated.
The form of government in the region includes a commission and a board. The region's maineconomic base includes farming, tourism, manufacturing, commercial, and retail. Tourismattracts a large number of non-residents to the area. The EPZ of the St. Lucie Nuclear PowerPlant is located in St. Lucie County, which is in the northern portion of the evacuated area.Florida has several commercial nuclear power plants.
History of EmergenciesSouth Florida to Broward County is more prone than average to both natural and technologicalhazards. It is located in a hurricane-prone region and it has a high volume of interstate andrailroad traffic, making it more prone to technological hazards as well. The community had
D-13
previous experience with hurricanes and evacuations in the last ten years and had priorexperience with the alerting mechanisms used in this evacuation.
Emergency PreparednessThe community's emergency preparedness activities included planning, training, drills andexercises, and community awareness as described below.
PlanningThe community had a written emergency plan, which contained an evacuation section, and wasthe plan used in this emergency. The plan did not conform to NUREG-0654/FEMA-REP- I,Rev. 1, and did not contain an ETE.
TrainingTraining is provided to emergency response personnel, and joint training between industry andgovernment is regularly conducted.
Drills and ExercisesThe community's emergency response agencies regularly conduct emergency drills andexercises. The emergency plan used in this evacuation was previously tested in a full-scale fieldexercise and a tabletop exercise.
Community AwarenessThe level of community awareness about local hazards and about evacuation procedures wasmedium. The level of community awareness about the hazard that caused this evacuation andabout the alerting methods used was high.
THREAT CONDITIONS
On September 13, 1999, Hurricane Floyd threatened Florida as a massive Category 4 storm,equal in power to Hurricane Andrew (I 992), but four times larger. The area of hurricane forcewinds extended well over 150 miles from the eye of the storm, requiring hurricane warningsfrom south Florida to Massachusetts. Weather conditions during the evacuation were dry andclear. However, some unusual traffic conditions (gridlock) occurred during the evacuation.
CONSEQUENCES
Over two million people in Florida evacuated in response to Hurricane Floyd. Approximately373,144 residents were evacuated from their homes and businesses in the southern portion ofFlorida down to Broward County. There were no injuries or deaths associated with theevacuation or the hurricane in Florida. However, there were 56 deaths in other states, mostlydue to drowning from freshwater floods. Hurricane Floyd caused only minor property damageas it skirted the state of Florida. The estimated total cost of evacuation related expenses isunknown.
D-14
EMERGENCY RESPONSE
Decision MakingThe level of cooperation between local, state, and federal agencies was high and politicalboundaries were crossed. The command, control, and coordination processes could best bedescribed as pre-planned. The decision to evacuate was made by the County Board ofCommissioners, and there were no problems with the decision-making process.
CommunicationsAn EOC was used but there was not an ICP. Communication between field emergencyresponders and EOC was by radio. There were no problems with communication.
Notification and WarningSenior local officials were notified by telephone. The elapsed time between the discovery of theincident and mobilization of response personnel is unknown. The elapsed time between the startof the hazard and the decision to evacuate was 108 hours. It took approximately 17 hours tocomplete the evacuation. There were no problems with notification of emergency personnel orsenior local officials. Radio and television broadcasts, police and fire department PA systems,and a reverse-91 1 phone system notified the public. The evacuation was staged and there wereno special problems regarding warning and subsequent citizen action.
Traffic and MovementEvacuees were not given any special instructions about where to go when they evacuated, but alist of available congregate care centers was provided. There were numerous special institutionsevacuated, including hospitals and nursing homes. Road conditions before the evacuation weredry and all major roadways were available to evacuees. Very heavy traffic congestion problemswere encountered. Some people spontaneously evacuated before being told to do so and somepeople refused to evacuate. Reverse-laning was not used and there were no traffic accidentsduring the evacuation.
Congregate Care CentersThe Red Cross, Salvation Army, and local agencies set up congregate care centers at schoolsand churches. About 7% of the evacuees used the congregate care centers. There were shadowevacuations and this did impact traffic but did not impact congregate care center capacity.
Law EnforcementPolice secured the area following the evacuation and there were no instances of looting orvandalism and no problems with law enforcement.
D-15
Re-EntryThe county commissioner authorized re-entry. There were no special controls during there-entry process. Insurance agencies compensated evacuees for their expenses. There were nomajor problems during re-entry.
INVESTIGATOR COMMENTS
County and state coordination and the public's prior knowledge of the hazard and evacuationsare factors that made the evacuation work well. Some lessons learned form the evacuation were:
* People need to be better informed about who does not need to evacuate.* Congregate Care Centers need to be very visible and made more public.* A better system needs to be developed to communicate with people on the road.
Some solutions that Florida has developed for these problems are:
* The community now has a system that counts and monitors the amount of traffic across thestate.
* Florida's public radio can now broadcast evacuation updates.* The community now has a plan that can implement reverse-laning.* The community now has an Evacuation Liaison Team.* Transportation models were developed to show evacuation transportation information
systems and their impact on surrounding states and regions.* The federal highway is now involved in Florida's evacuations.* The community now has a state web site.
CONTACT INFORMATION AND REFERENCES
ContactsState of Florida, All Hazards Planning Manager, Division of Emergency Management (Meeting,8/26/03)
References
Dumont, Robert. "The Legacy of Hurricane Floyd-Inland Flooding and a Massive Evacuation."<http://www.ofcm.gov/fp-fyO l /pdf/sec 1 .pdf>
Federal Highway Administration (U.S.). "Evacuation Traffic Information System, SoutheastHurricane Evacuation Study." 2003.<http://www.fhwaetis.com/etis/ReportLinks/floydrpt.htm> (April 2003).
D-16
Florida Department of Transportation. "Governor's Hurricane Evacuation Task Force Report."<http://wwwl 1.myflorida.com/publicinformationoffice/EvacuationStudy/HurnicaneTaskForceReport.doc> (June 2003).
North Carolina Shore and Beach (U.S.). "Beach Nourishment for Hurricane Protection: NorthCarolina Project Performance In Hurricanes Dennis and Floyd." 2000.<http://www.ncshoreandbeach.org/Dennis-Floyd-Study.htm> (April 2003).
Hosock, H. "Safe But Annoyed: The Hurricane Floyd Evacuation in Florida." Case 1652.Kennedy School of Government Case Programs, Harvard University, Boston, Massachusetts.
The Disaster Center. "Hurricane Floyd Reports."<http://www.disastercenter.com/hurricf9.htm> (June 2003).
D-17
ATOFINA Chemicals Tank Car Failure, Riverview, Michigan, July 14, 2001, ID #28
On July 14, 2001, a release of methyl mercaptan, a poisonous and flammable gas, occurred at theATOFINA Chemicals, Inc. (ATOFINA) plant in Riverview, Michigan, resulting in theevacuation of about 6,000 people. A pipe attached to a fitting on the unloading line of a railroadtank car fractured and separated, causing the release of methyl mercaptan, which is the odorantthat is used in natural gas. The Riverview Fire Department arrived within minutes and, shortlyafter their arrival, the methyl mercaptan ignited, engulfing the tank car in flames and sending afireball approximately 60 m (200 ft) into the air. Fire damage to cargo transfer hoses on anadjacent tank car resulted in the release of chlorine, another poisonous gas. Three plantemployees were killed in the incident and several others were injured. The evacuationproceeded smoothly and lasted approximately ten hours. However, there were communicationsissues associated with the length of time it took to notify the residents, local communities, andCanadian authorities on the far side of the Detroit River.
COMMUNITY CONTEXT
GeneralOn July 14, 2001, at 5:19 a.m. approximately 600 residences in Riverview, Trenton, Grosse Ile,and Wyandotte, Michigan, were ordered to evacuate. According to the Riverview Fire Marshalthere was approximately 90% compliance with the order. A total of 6,000 people wereevacuated, including approximately 2,000 residents from homes and industrial facilities withinthe area and an additional 4,000 people from the Trenton street fair located approximately 4.8km (3 mi) south of the incident.
Riverview is a suburb of Detroit with shopping centers, commercial retail centers, and industrialfacilities. The size of the community is 11.4 km2 (4.4 mi2 ) and the size of the evacuated area is10.4 km2 (4 mi2). The population density during the evacuation was low. Riverview is run by acity manager and its main economic base is retail trade and service industries. There was amidsummer festival (street fair) in Trenton on July 14, 2001, that drew approximately 250,000visitors. The start of this event was delayed, and individuals were evacuated from the area.There is one commercial nuclear plant, Fermi II, located in Newport, Michigan, approximately
D-18
24 km (15 mi) south of Riverview. The evacuation did not impact operations and took placeoutside the 10-mile emergency planning zone (EPZ) of the plant.
History of EmergenciesRiverview is more prone to hazards than the average community of its size. Trenton,Wyandotte, and Riverview each have a chemical plant, and local fire departments are familiarwith local hazards. The ATOFINA plant has been at this location for over 100 years, and this isthe first major catastrophe resulting in a large-scale evacuation.
Riverview has experienced evacuations in the previous ten years and has had prior experiencewith the alerting mechanism used in this evacuation, which included patrolmen going door-to-door and using loud speakers. Approximately six years ago, there was a train derailmentinvolving small evacuations, and minor evacuations associated with the chemical plant occurperiodically.
Emergency PreparednessThe community's emergency preparedness activities include planning, training, drills andexercises, and community awareness as described below.
PlanningATOFINA has implemented an extensive emergency plan for the Riverview facilities, whichincluded emergency procedures specific to the plant processes. The purpose of the plan is tominimize hazards to public health or the environment caused by fires, explosions, or releases ofhazardous constituents. A copy of the plan was given to the Riverview Fire Department inMarch 2000. Riverview has a local emergency plan and a county plan. The Riverview plan wasused in the emergency. It did not address evacuation organization, communication, or trafficrouting. It only addressed evacuations in terms of exposure limits that require evacuations. Thisevacuation covered multiple communities that were not addressed in sufficient detail in theRiverview or county emergency plans. There was no evacuation time estimate (ETE) in theplan, and it is difficult to estimate the total time for the evacuation because it covered multiplecommunities and was being conducted by separate police departments. The Riverviewemergency plan did not meet the requirements of NUREG-0654/FEMA-REP-1, Rev. 1.
TrainingATOFINA provides training to Riverview and Wyandotte Fire Departments and conductsperiodic tours of the facility.
Drills and ExercisesRiverview emergency response did not conduct emergency drills or exercises for the emergencyplan used in this evacuation.
D-19
Community AwarenessAlthough each of the surrounding communities of Riverview, Trenton, and Wyandotte havechemical plants, the local community had a low level of awareness of the hazards, of evacuationprocedures, and of alerting methods. Previous evacuations were much smaller in scale.
THREAT CONDITIONS
The Riverview chemical release began as a normal chemical transfer operation on July 14, 2001.A connecting pipe separated from a faulty valve on a railcar as two workers unloaded methylmercaptan. All 113,652 L (25,000 gal) of methyl mercaptan contained in the railcar wasreleased into the environment. In addition, approximately 11,794 kg (26,000 lb) of chlorine wasreleased from an adjacent railcar.
A total of 6,000 people were evacuated from Riverview and the surrounding communities. Theevacuations occurred during the early morning. The weather was hot and the roads were dry.The Riverview evacuation involved three unusual circumstances. First, the community ofGrosse Ile is located on an island in the river with only the southern bridge open to traffic.Second, the U.S. Coast Guard closed a 16.1 km (10 mi) stretch of the Detroit River. Finally,there was a street fair in Trenton, approximately 4.8 km (3 mi) south of the incident, thatrequired the evacuation of approximately 4,000 vendors and members of the public.
CONSEQUENCES
Within 15 minutes of the initial event, the first two units of the Riverview Fire Department wereon scene. Approximately ten minutes later, the methyl mercaptan ignited, resulting in a fireballthat extended an estimated 60 m (200 ft) into the air. When the fireball occurred, the Riverviewfire chief requested mutual aid from the surrounding communities. As the uncontrolled vaporcloud approached Riverview and the surrounding communities, portions of the communitieswere evacuated based on the wind direction. The initial incident resulted in the death of threeworkers in the immediate area and injuries to at least nine ATOFINA personnel. No reporteddeaths or injuries resulted from the evacuation. Residents voiced numerous complaints that theevacuation was too slow, resulting in inhalation of the chemical fumes and causing throatirritation and stinging eyes. However, there were no reports of anyone from the general publicbeing hospitalized. The overall cost to the public of the evacuation is difficult to estimatebecause the release covered multiple communities, each with its own implementation.
EMERGENCY RESPONSE
Decision MakingThe level of cooperation between local, state, and federal agencies was very high. Some of thelocal, state and federal agencies involved in this emergency included the Riverview FireDepartment, Wyandotte Fire Department, Grosse Ile Police Department, Downriver Mutual AidHazmat Team, U.S. Coast Guard, and the U.S. Environmental Protection Agency (EPA). The
D-20
evacuation crossed multiple political boundaries, including city, county, and the internationalborder with Canada. The command, control and coordination processes could best be describedas ad hoc.
The decision to evacuate was made by the Riverview fire chief. There was a delay in the initialorder to evacuate. At about 5:00 a.m., the Grosse Ile Police Department notified the Riverviewfire chief that there were strong odors detected in Grosse Ile and the fire chief advised residentsto shelter in place. However, at about 5:19 a.m., after re-evaluating the situation, he requestedthe evacuation of residents in parts of Riverview, Trenton, Grosse Ile, and Wyandotte.Approximately 6,000 people were evacuated from their homes, businesses, and the street fair.
CommunicationsThere was no Emergency Operations Center (EOC); however, the county EOC was on standby.An incident command post (ICP) was established near the event, complete with tents set up bythe ATOFINA personnel. Radio was the primary means of communication and, according to theRiverview fire marshal, the system worked flawlessly.
Notification and WarningThe public safety dispatcher notified the mayor and city manager via telephone. The citymanager was then responsible for notification of other senior local officials. Emergencyresponders were notified through the 91 1 system, which was likely being used as a generalalarm, since the first evidence of a fire was when the escaping gas ignited some 19 minutes later.There were no problems with notification of either local officials or responders.
Emergency response personnel mobilized and were onsite within 15 minutes of discovery of theincident, and the decision to evacuate was made approximately one hour after the start of theincident. The time to complete the evacuation was not known because multiple communitieswere involved. The public was notified by the police using a loudspeaker and going door-to-door to notify residents to evacuate. The evacuation was staged, beginning with a one-mileradius, and expanding as the fire chief received additional information from ATOFINA on thehazards.
There were no special problems with warning the public; however, approximately 10% of thepublic did not evacuate when requested. In addition, residents complained that the evacuationtook too long. The Riverview fire marshal stated that it took time to get accurate informationfrom the plant on the chemicals involved. The deaths and injuries due to this event resulted insome onsite confusion that delayed the flow of information.
Traffic Movement and ControlEvacuees were told what congregate care centers to go to and what routes to take. The routeswere designated with police barricades. No special institutions were evacuated. Roadconditions prior to the evacuation were clear and dry. The island of Grosse Ile has two bridges;however, only the southern bridge was open for access. This did not create any traffic problems,
D-21
as there were only about 400 homes evacuated from the island. Reverse-laning was not used.No traffic accidents were reported during the evacuations. A 16 km (10 mi) stretch of theDetroit River was shut down because of the fumes.
Congregate Care CenterA congregate care center was set up at the Riverview City Hall and was managed by the citystaff. Approximately 20% of evacuees stayed at the congregate care centers. The vast majorityof evacuees stayed with friends and relatives. There were no shadow evacuations.
Law EnforcementThe area was secured by barricades set up by the local police. There were no reported instancesof looting or vandalism or any other problems identified with law enforcement.
Re-EntryRe-entry was authorized by the Riverview fire chief at approximately 3 p.m. The media wereused to convey information to the public about when it was safe to return home. No specialcontrols were in place during the re-entry process. The total evacuation time was approximately10 hours. There is no report of costs being reimbursed to the public.
INVESTIGATOR COMMENTS
As a result of the accident, ATOFINA was required to provide financial support to thesurrounding communities to improve the emergency response capabilities. Improvements in thecapabilities and relevant lessons learned include:
I. The fire marshal stated that the evacuation went well with a few exceptions. First, there wasa delay in obtaining accurate information on the chemicals involved because threeATOFINA employees had been killed. Second, approximately 10% of the public did notwant to evacuate. Third, no large-scale exercises or drills had been conducted withsurrounding communities prior to the event.
2. Riverview has since been funded to increase the local sirens from one to four. In addition,they have sent out mass mailings to the public with detailed instructions on what to do whenthe sirens go off.
3. Riverview has now implemented a "first call" automated telephone citizen notificationsystem. However, experience in recent events has shown that residents hang up when therecording begins and do not listen to the full message.
4. Riverview has since been funded for a fully functional EOC, which is now in full operation.
D-22
CONTACT INFORMATION AND REFERENCES
Contacts
Riverview Fire Marshal(734) 281-4264(Personal Communication, July 2, 2003)
References
CNN (U.S.), "Chemical plant fire kills 3 in Michigan." 2001.<http://www.cnn.com/JU.S.7/14/01> (June 2003).
Potts, L. "Two Dead, One Missing in Chemical Fire Downriver." Associated Press. July 14,2001.
National Transportation Safety Board (U.S.) (NTSB). HZM-02-01, "Hazardous MaterialsRelease from Railroad Tank Car With Subsequent Fire at Riverview, Michigan." NTSB:Washington, D.C. July 2001.
SEMCOSH (Southeast Michigan Coalition on Occupational Safety and Health). "ATOFINAChemical Explosion." <http://www.semcosh.org/atofinaexplosion.htm> (June 2003).
D-23
Hurricane Andrew, Miami-Dade County, Florida, August 24, 1992, ID #80
Hurricane Andrew, which was initially classified as a Category 4 storm and later reclassified as aCategory 5 storm in 2002, was the most destructive and most expensive natural disaster in U.S.history. It forced the evacuation of approximately 1.9 million people. One-third, or 650,000 ofthose evacuated were in Miami-Dade County, Florida, which is the focus of this case study. Thehurricane hit south Florida on August 24, 1992, with violent winds that caused over $25 billionin property damages. In Miami-Dade County, Hurricane Andrew resulted in 15 deaths and leftup to 250,000 people temporarily homeless. However, there were no deaths or serious injuriesduring the evacuation. The estimated total cost of evacuation-related expenses is between $5and $8 million.
COMMUNITY CONTEXT
GeneralMiami-Dade County is in the southeastern portion of Florida. As of the 2000 census, thepopulation was 2,253,362 people. The county has a total area of 6,297 km2 (2,431 mi2) and is acombination of urban, rural, and suburban areas. Approximately 650,000 people, or 30% of thepopulation, were evacuated in August 1992 due to Hurricane Andrew. The evacuation coveredapproximately 2,600 km2 (1,000 mi2) in the southern portion of the county. Population densitywas relatively low at the time of the evacuation. Land use in the evacuated areas was primarilyresidential and agricultural. The community's main economic base is derived from multiplesources, including farming, tourism, manufacturing/industry, and commercial/retail. Tourismand colleges attract a large number of non-residents. Age was an important factor in theevacuation because the large population of elderly residents was less likely to heed theevacuation order.
The Turkey Point Nuclear Power Plant is located in Miami-Dade County near Homestead,approximately 40 to 48 km (25 to 30 mi) south of Miami. The Turkey Point Plant sustained adirect hit from Hurricane Andrew, causing extensive onsite and offsite damage. The nuclearreactors were shut down in anticipation of the hurricane, and 235 employees stayed at the plantand rode out the storm. The plant's exterior buildings suffered extensive damage, but the
D-24
reactors survived unharmed. A 30-meter (100-foot) tall smokestack at the plant was lost duringthe storm.
History of EmergenciesThe Miami-Dade area is more prone to both natural disasters, including hurricanes andtornadoes, and man-made hazards, including accidents at manufacturing plants, nuclear powerplants, and railroads. The community had prior experience with hurricanes and had experiencedevacuations in the previous 10 years, although not on the scale of this evacuation. Residents hadprior experience with the alerting mechanism used in this evacuation [i.e., radio and televisionbroadcasts, emergency broadcasting system (EBS)].
Emergency PreparednessThe community's emergency preparedness activities include planning, training, drills andexercises, and community awareness as described below.
PlanningMiami-Dade County had an emergency management plan, including an evacuation section,which was implemented during this emergency. The plan contains an annex for the TurkeyPoint Nuclear Power Plant, which contains an Evacuation Time Estimate (ETE) for the 16-km(10-mile) emergency planning zone (EPZ) of the plant. However, the broader plan, whichcovers all of Miami-Dade County, does not contain an ETE for the county.
TrainingTraining is provided to emergency response personnel and joint training is conducted betweenindustry and government. The frequency of training has increased since Hurricane Andrew.
Drills and ExercisesThe community's emergency response agencies regularly conduct emergency drills andexercises. However, it is unknown whether the emergency plan used in this evacuation waspreviously tested in a full-scale field exercise.
Community AwarenessCommunity awareness of local hazards and of evacuation procedures is approximately average.However, community awareness about the hazard that caused this evacuation (i.e., hurricanes) isvery high. In addition, community awareness about the alerting methods used in this evacuationwas high.
THREAT CONDITIONS
The threat condition that led to this evacuation was Hurricane Andrew, a Category 4 storm withwinds of 235 km per hour (145 miles per hour) as it approached south Florida. The NationalOceanic and Atmospheric Administration (NOAA) reclassified Andrew as a Category 5 storm in
D-25
2002. Andrew was (and as of this writing still is) the third strongest hurricane on record to hitthe U.S. It was the most destructive and most expensive natural disaster in U.S. history.
Conditions during the evacuation, prior to Andrew's landfall, were clear and calm and roadconditions were good. The evacuation took place during the day and there were no unusualcircumstances during the evacuation. However, there are some conflicting reports regarding theevacuation. For example, emergency response personnel describe the evacuation as going rathersmoothly while some reports, authored by citizen activist groups, claim that residents werecaught horribly off-guard by Hurricane Andrew. These groups claim that some local residentsdid not receive ample warning to evacuate, and their deaths were directly attributed to that lackof ample warning.
CONSEQUENCES
Hurricane Andrew was the most destructive and most expensive natural disaster in U.S. history,forcing the evacuation of 650,000 people in Miami-Dade County, Florida on and before August24, 1992. There were 15 deaths and hundreds of injuries due to the hurricane but no deaths orsignificant injuries due to the evacuation. Hurricane Andrew struck southern Miami-DadeCounty especially hard with violent winds that destroyed homes, buildings, and power lines.Florida Power and Light reported losing 1,900 transmission towers, 8.5 million feet ofdistribution lines, 18,700 utility poles, and 16,800 switches. Up to 1.4 million customers lostpower in Florida alone. The Turkey Point Nuclear Power Plant near Homestead also sustainedextensive onsite and offsite damage. The estimated total cost of evacuation-related expenses andproperty damages incurred by the public was between $5 to $8 million.
EMERGENCY RESPONSE
Decision MakingThe level of cooperation among local, state, and federal agencies was moderate since there wassome lack of coordination between federal agencies in the aftermath of Hurricane Andrew. TheDepartment of Defense, Federal Emergency Management Agency and National Guardparticipated in the evacuation process. Political boundaries were crossed since Broward Countywas also evacuated. Command, control and coordination processes could best be described aspre-planned. The decision to evacuate was made jointly by the Miami-Dade County managerand the emergency operations manager. There were no major problems with the decision-making process.
CommunicationsAn EOC and an ICP were both used in this emergency. Communication between fieldemergency responders and the EOC was via radio and telephone. Radio transmission waslimited but was still the primary means of communication. There were problems associated withcommunications because most radio towers were down, but telephone communications were stillworking.
D-26
Notification and WarningSenior local officials and emergency responders were well aware of the incident because of theextensive radio and television coverage, and there were no problems with notification.Evacuation of the county took approximately 12 hours to complete. The public was notifiedthrough radio and television broadcasts and by the EBS. The evacuation was ordered all at once.There were no special problems regarding warning and subsequent citizen action, although somecitizen activist groups claim that residents did not receive ample warning to evacuate and werecaught in the storm and died as a result.
Traffic Movement and ControlEvacuees were told which congregate care centers were open when they were ordered toevacuate but were not told to use specific routes. Most of the congregate care centers in thesouthern portion of Miami-Dade County had to be shut down because they were in theevacuation zone. The closest congregate care centers were in the northern part of the county.Five out of 30 area hospitals were evacuated. Road conditions were clear and dry during theevacuation; however, construction work on some of the major roads slowed evacuation traffic.In the future, all highway construction will cease, and roadways will operate at maximumcapacity. Reverse-laning was not used. There were no reported traffic accidents during theevacuation. Some people spontaneously evacuated prior to being told to do so and othersrefused to evacuate.
Congregate Care CentersCongregate care centers managed by the American Red Cross were used. Schools wereprimarily used as congregate care centers and approximately 20% of evacuees registered at thecongregate care centers. There were shadow evacuations; however, this did not impact eithertraffic movement or congregate care center capacity.
Law EnforcementPolice and National Guardsmen secured the evacuated area; however, there were some instancesof looting and vandalism. There were no other problems with law enforcement.
Re-EntryRe-entry was authorized by the mayor and the county commissioner. Re-entry was a controlledphased process (some areas were re-opened before others). Because this was a declaredevacuation, some evacuees were reimbursed for evacuation-related expenses by their insurancecompany. In addition, grant money was provided to cover damage to houses, vehicles, etc.Trailers were set up for people in public housing, and some people lived in recreational vehiclesin the driveways of their destroyed homes. Problems during re-entry included lack of water andpower. There was severe damage to many homes and tents and churches were used totemporarily house people.
D-27
INVESTIGATOR COMMENTS
What factors made the evacuation work well?
The public's awareness and knowledge of hurricanes, especially once Hurricane Andrew wasupgraded to a Category 4 storm, certainly contributed to the effectiveness of the evacuation.
What factors contributed to the evacuation's faults or problems?
Problems during the evacuation included:
* Evacuation zones were too broad;* Traffic pattern predictions and clearance times were "vague and undefined;"* The media tended to dramatize and exaggerate the situation, leading to public panic and
shadow evacuations.
CONTACT INFORMATION AND REFERENCES
Contacts
Miami-Dade Emergency Management CoordinatorFlorida International University ProfessorNational Oceanic and Atmospheric Administration (NOAA) (305) 229-4404
References
Akers, R. L., R. Dunham, and L. Lanza-Kaduce. "Policing the Wake of Hurricane Andrew:Comparing Citizens' and Police Priorities." Disaster Prevention and Management. Volume 7.Number 5. 1998: 413-419.
Issue 178: "Effect of Hurricane Andrew on Turkey Point" (Rev. 2).<http://www.nrc.gov/reading-rm/doc-collections/nuregs/staff/srO933/sec3/178r2.html>
Lepore, Frank. "After 10 Years, Hurricane Andrew Gains Strength." Online posting. 21 Aug.2002. United States Department of Commerce News. Jan. 29, 2003.<http://www.nhc.noaa.gov/NOAA_pr_8-21 -02.html>
Nuclear Power Plants Stand in Floyd's Path, September 14, 1999, CNN.<http://www.cnn.com/WEATHER/9909/14/hurricane.utilities/>
D-28
Hurricane Floyd, Central Florida, September 13, 1999, ID #88C
On September 13, 1999, Hurricane Floyd caused the largest peacetime evacuation in U.S.history. Four states had evacuations in response to Hurricane Floyd (Florida, Georgia, NorthCarolina, and South Carolina). Although estimates vary, it was widely reported that two millionpeople were evacuated in the state of Florida alone. The following case study examines theevacuation in central Florida where 665,969 people were evacuated. No deaths or injuriesoccurred during the evacuation. However, many people experienced near gridlock on the majorevacuation routes. Others expressed frustration over the lack of communication and poordissemination of emergency information by officials.
COMMUNITY CONTEXT
GeneralCentral Florida is a suburban community with a total population of 2,466,553 people.Approximately 665,969 residents (27% of the population) were evacuated. The area consists ofresidential, commercial, industrial, and agricultural land. The total area of central Florida is16,735 kan (6,461mi 2) and the evacuated area was 1,673 km2 (646 mi2). The population densityin the area during the evacuation was high in certain areas and low in others. Age was animportant factor in this evacuation.
Central Florida has a commission and board form of government, and its economic base isfarning, tourism, manufacturing, and commercial. Tourism attracts a large number ofnon-residents to the area. This evacuation was not located in an EPZ of a commercial nuclearpower plant. However, the St. Lucie Nuclear Power Plant is located less than fifty miles away.Florida has several commercial nuclear power plants.
History of EmergenciesCentral Florida is more prone than average to both natural and technological hazards. It islocated in a hurricane-prone region, and it has a high volume of interstate and railroad traffic,making it more prone to technological hazards as well. The Kennedy Space Center is alsolocated in this region. The community has had previous experience with the hazard that led to
D-29
this evacuation and has experienced evacuations in the previous 10 years. The community alsohad previous experience with the alerting methods used in this evacuation.
Emergency PreparednessThe community's emergency preparedness activities include planning, training, drills andexercises, and community awareness as described below.
PlanningThe community had a written emergency plan that contained an evacuation section, and the planwas used in this emergency. The plan did not conform to NUREG-0654/FEMA-REP- 1, Rev. 1,and did not contain an ETE.
TrainingTraining is provided to emergency response personnel and joint training between industry andgovernment is regularly conducted.
Drills and ExercisesCentral Florida's emergency response agencies regularly conduct emergency drills andexercises. The emergency plan used in this evacuation was previously tested in a full-scale fieldexercise. The exercise performed immediately before evacuation was a full-scale field exerciseand a tabletop exercise.
Community AwarenessThe level of community awareness about local hazards and about evacuation procedures wasmedium, but the level of community awareness regarding the hazard that caused this evacuationand the methods used to alert the community was high.
THREAT CONDITIONS
On September 13, 1999, Hurricane Floyd threatened Florida as a massive Category 4 storm,equal in power to Hurricane Andrew (1992), but four times larger. The area of hurricane-forcewinds extended well over 150 miles from the eye of the storm, requiring hurricane warningsfrom south Florida to Massachusetts. Weather conditions during the evacuation were clear, androad conditions were dry. However, there were numerous traffic-related problems during theevacuation.
CONSEQUENCES
More than two million people in Florida evacuated in response to Hurricane Floyd.Approximately 665,969 residents were evacuated from their homes and businesses in centralFlorida. There were no injuries or deaths associated with the evacuation or the hurricane inFlorida. However, there were 56 deaths in other states, mostly caused by drowning from
D-30
freshwater floods. Hurricane Floyd caused only minor property damage as it skirted the state ofFlorida. The estimated total cost of evacuation related expenses is unknown.
EMERGENCY RESPONSE
Decision MakingThe level of cooperation among local, state, and federal agencies was high and politicalboundaries were crossed. The command, control, and coordination process could best bedescribed as pre-planned. The decision to evacuate was made by the County Board ofCommissioners, and there were no problems with the decision-making process.
CommunicationsAn EOC was used but there was no ICP. Communication between field emergency respondersand the EOC was by radio, and there were no problems with communications.
Notification and WarningSenior local officials were notified by telephone. The time that elapsed between the discovery ofthe incident and the mobilization of response personnel was approximately six days. The timethat elapsed between the start of the hazard and the decision to evacuate was 132 hours. It tookapproximately 22 hours to complete the evacuation. There were no problems with notificationof emergency personnel or senior local officials. Radio and television broadcasts, police and firedepartment PA systems, and a reverse-91 I telephone service notified the public. The evacuationtook place all at once, and there were no problems regarding warning and subsequent citizenaction.
Traffic Movement and ControlEvacuees were not given specific instructions about where to go when they evacuated. Manyhospitals and assisted living facilities were evacuated. Road conditions before the evacuationwere dry, and all major roadways were available to evacuees. Some people spontaneouslyevacuated and some people refused to evacuate. Major traffic problems were encountered butthere were no traffic accidents. Reverse-laning was not used.
Congregate Care CentersThe Red Cross, Salvation Army, and local agencies set up congregate care centers at schools andchurches. About four to nine percent of the evacuees used the congregate care centers. Therewere shadow evacuations, which did have an impact on traffic, but did not impact congregatecare center capacity.
Law EnforcementLocal police secured the area following the evacuation. There were no instances of looting orvandalism and no problems with law enforcement.
D-31
Re-EntryThe county commissioner for local law enforcement authorized re-entry. There were no specialcontrols during the re-entry process. Insurance companies compensated evacuees for theirexpenses. There were no major problems during re-entry.
INVESTIGATOR COMMENTS
County and state coordination and the public's prior knowledge of the hazard and evacuationsare factors that made the evacuation work well. Some lessons learned form the evacuation were:
* People need to be better informed about who does not need to evacuate.* Congregate Care Centers need to be visible and made more public.* A better system needs to be developed to communicate with people on the road.
Some solutions that Florida has developed to address these problems are:
* The community now has a system that counts and monitors the amount of traffic across thestate.
* Florida's public radio can now broadcast evacuation updates.* The community now has a plan that can implement reverse-laning.* The community now has an evacuation liaison team.* Transportation models were developed to show evacuation transportation information
systems, and their impact on surrounding states and regions.* The federal highway is now included in Florida's evacuations.* The community now has a state web site.
CONTACT INFORMATION AND REFERENCES
Contacts
State of Florida, All Hazards Planning Manager, Division of Emergency Management, (Meeting,August 26, 2003)
References
Dumont, Robert. "The Legacy of Hurricane Floyd-Inland Flooding and a Massive Evacuation."<http://www.ofcm.gov/fp-fyO 1 /pdf/sec 1 .pdf>
Federal Highway Administration (U.S.). "Evacuation Traffic Information System, SoutheastHurricane Evacuation Study." 2003.<http://www.fhwaetis.com/etis/ReportLinks/floydrpt.htm> (April 2003).
D-32
Florida Department of Transportation. "Governor's Hurricane Evacuation Task Force Report."<http://wwwl 1.myflorida.com/publicinformationoffice/EvacuationStudy/HurricaneTaskForceReport.doc> (June 2003).
North Carolina Shore and Beach (U.S.). "Beach Nourishment for Hurricane Protection: NorthCarolina Project Performance In Hurricanes Dennis and Floyd." 2000.<http://www.ncshoreandbeach.org/Dennis-Floyd-Study.htm> (April 2003).
Hosock, H. "Safe But Annoyed: The Hurricane Floyd Evacuation in Florida." Case 1652.Kennedy School of Government Case Programs, Harvard University, Boston, Massachusetts.
The Disaster Center. "Hurricane Floyd Reports."<http://www.disastercenter.com/hurricf9.htm> (June 2003).
In July 1998 a wildfire spread throughout Florida, damaging homes and causing numerousevacuations. Fires burned near the city of Mims in Brevard County, and in Volusia and Flaglercounties to the north. Approximately 16,000 people were evacuated from Mims and BrevardCounty, some on more than one occasion.
COMMUNITY CONTEXT
GeneralMims, Florida, is a suburban community with a population of approximately 9,147 people andcovers an area of 66.6 km2 (25.7 mi2 ). Approximately 16,000 people were evacuated from Mimsand Brevard County. Ethnicity, nationality, and age were not important factors in theevacuation.
The town of Mims is unincorporated. The main economic base is industry from the nearbyKennedy Space Center. Tourism to the Kennedy Space Center attracts large numbers ofnon-residents to the area. The nearest nuclear power plant is located more than 80 km (50 mi)away.
History of EmergenciesThe community is more prone to natural hazards than the average town and has had experiencewith wildfires and hurricanes in the past. The community has experienced large-scaleevacuations in the last 10 years, although they were smaller than the evacuations during thisevent. The community had not had previous experience with the alerting mechanism usedduring this evacuation.
Emergencv PreparednessThe community's emergency preparedness activities include planning, training, drills andexercises, and community awareness as described below.
D-34
PlanningThe community had a written emergency plan that was used in this emergency and the planincluded an evacuation section. It is unknown if the plan conformed to NUREG-0654/FEMA-REP-1, Rev. 1, or if there was an ETE in the plan. The plan did comply with state requirements.
TrainingThe community provides training to emergency response personnel regularly. Joint trainingbetween industry and government is regularly conducted; however, this is limited to high-hazardtargets.
Drills and ExercisesThe community's emergency response agencies regularly conduct emergency drills andexercises. The emergency plan used in this evacuation had not been previously tested infull-scale exercises.
Community AwarenessThe community had a low level of awareness about the local hazards and about evacuationprocedures. It has a low level of awareness about wildfires. The community also had a lowlevel of awareness about the alerting methods used in this evacuation.
THREAT CONDITIONS
In July 1998, a wildfire in Brevard County near the town of Mims spread rapidly through thearea. There were three or four fires ongoing and then a big blowup when the fires converged.Most of the evacuations occurred over a four-day period. Officials initially issued a mandatoryevacuation order in Mims for about 2,000 homes. The evacuation order was lifted as sea breezessteered the fire away, but winds switched again at nightfall, sending the fire back toward theneighborhoods. About 250 homes were evacuated for a second time. In Brevard County, morethan 4,000 people were evacuated, some for the third time. Approximately 16,000 people wereultimately evacuated from the area. Weather conditions were breezy with sea breezes shiftingdirection. The area was very rural and very wooded, causing a difficult time for firefighters.
The roads were dry and clear except for the smoky haze that covered much of the area. Therewere no unusual circumstances that occurred other than the wildfires.
CONSEQUENCES
In July 1998, wildfires had scorched large areas in Brevard County around Mims during a severedrought. A number of cars and barns were destroyed, and there were reports of at least fourhouses burned.
Flames injured at least five firefighters in Brevard County, three with second-degree bums.Another 12 firefighters were injured using tools for fighting the fires. Numerous firefighters
D-35
were treated for heat exhaustion. One police officer was injured during the evacuation when aman used his vehicle to run over the officer, who was trying to dissuade people from going backto their homes.
There were no fatalities from the wildfires or the evacuations. The estimated total cost of theevacuation-related expenses is unknown.
EMERGENCY RESPONSE
Decision MakingThe level of cooperation between local, state, and federal agencies was moderate, and politicalboundaries were crossed during this event. Response from Patrick Air Force Base and KennedySpace Center was good; however, other federal agencies were late to the scene. The command,control, and coordination processes could best be described as pre-planned; however, the planwas changed or altered each day. The decision to evacuate was made by the fire chief. Therewere problems with the decision-making process. Many teams were exhausted, and there was ashortage of personnel to support the evacuations.
CommunicationsAn EOC and an ICP were used in this emergency. Communication between field emergencyresponders and the ICP was primarily by cell phone. There were problems withcommunications. The radios failed very early when a microwave tower was lost due to theamount of smoke in the area. There were also too many frequencies in use by the variousagencies when the radios did work.
Notification and WarningSenior local officials were notified of the event by telephone. Emergency responders werenotified of the fire by a passing airplane about four days before it endangered residents. Therewere no problems with notification of emergency personnel or senior local officials. The timebetween discovery of the incident and mobilization of response personnel was planned aroundthe movement of the fire. The time elapsed between the start of the hazard and the decision toevacuate was four days. Initial evacuations were completed within approximately six hours.Subsequent evacuations varied depending on the size of the area.
The initial evacuation did occur all at once and was expanded as the fire spread. The public wasnotified by radio and television broadcasts, police going door-to-door, and police and firefightersusing PA systems. Although there were no problems with warning the public, some citizenstried to stay and fight the fires. They were unable to do so when the fire burned down powerpoles, cutting power to the wells and to the water systems.
D-36
Traffic Movement and ControlEvacuees were initially just told to get out. However, there were very limited choices indirection. No special institutions were evacuated. Road conditions during the evacuation weredry and visibility was limited by the smoke. Interstate 95 was shut down between Mims andNew Smyrna Beach and a 25.6 km (16 mi) stretch of U.S. 1 along the coast was also closed. Theclosure of these roads created additional traffic problems in the area. Reverse laning was notused. Some minor accidents occurred during the evacuation. Some people did evacuate beforebeing told to do so, and others refused to evacuate.
Congregate Care CentersThe Red Cross established congregate care centers in schools. It is unknown how manyevacuees reported to the congregate care centers; however, only six people showed up at theMims Elementary School. There were shadow evacuations, which had a minor impact on traffic.Shadow evacuations did not impact the congregate care center capacities.
Law EnforcementThe police and Florida Highway Patrol secured the evacuation area, and there were no instancesof looting or vandalism or any problems with law enforcement.
Re-EnThe chairman of the county commission authorized re-entry, and no special controls were usedduring re-entry. Evacuees were not compensated for their expenses. There were some majorproblems with re-entry when evacuees returned to the area to find no utilities or water.Additionally, many evacuees went sightseeing and got into dangerous areas.
INVESTIGATOR COMMENTS
The evacuation worked well because the size of the fire was manageable. Evacuation problemscould have been reduced with preplanning for the residents on traffic flow and direction.Lessons learned included the fact that the evacuation had not been considered until after the fireswere in the vicinity of residences and this could have been discussed and planned earlier.Additionally, there could have been better cooperation among the emergency vehicles from thevarious agencies.
CONTACT INFORMATION AND REFERENCES
Contacts
Brevard County Assistant Fire Chief(321) 633-2056(Personal Communication, 7/30/03)
D-37
Brevard County Fire Department(321) 633-2056(Personal Communication, 7/30/03)
References"Homes spared, evacuation order lifted, but battle against fire not over." Associated Press. July1998.
"Wildfire burns homes; evacuations again ordered in Florida." Associated Press. July 1998.
D-38
American Storage and Warehouse Company, Charlotte, North Carolina,September 2002, ID #74
Summary
Rank Value: 64Number Evacuated: 1,000Category: Technological HazardSpecific Type: Fixed Site Hazmat IncidentCommunity: UrbanComments: In an EPZ
INTRODUCTION
A chemical that produces noxious fumes spilled from storage drums at the American Storageand Warehouse Company in west Charlotte, North Carolina, on the evening of September 17,2002. Approximately 1,000 residents were forced to evacuate their homes and businesses formore than four hours. Approximately twenty drums of thiourea dioxide, a stripping agent usedin textile dyeing, had reacted and released dangerous vapors into the air. There were no deaths,but twelve people were treated at the hospital for breathing problems.
COMMUNITY CONTEXT
GeneralCharlotte is a major city in North Carolina near the border with South Carolina. It has a totalpopulation of 540,828 people. Approximately 1,000 residents (<1% of the population) wereevacuated within a 2.6 km (I mi) radius of the storage facility in west Charlotte. Land use in thearea is primarily residential and industrial. The total area of Charlotte is 629 km2 (243 mi2 ) andthe evacuated area was 8.13 km2 (3.14 mi2). The population density of the area during theevacuation was medium. Ethnicity, nationality, and age were not important factors in theevacuation.
Charlotte has a mayoral form of government and its main economic base is financial services.Business attracts a large number of non-residents. The evacuated area was located within theEmergency Planning Zone (EPZ) of the McGuire Nuclear Power Plant in North Carolina and theCatawba Nuclear Power Plant in South Carolina. North Carolina has three commercial nuclearpower plants.
History of EmergenciesCharlotte is no more prone to hazards than the average U.S. city. The community had very littleexperience with the hazard that led to this evacuation, only a chemical fire in 1981. However,the community had experienced hurricane-related evacuations in the previous ten years. Thecommunity did not have previous experience with the alerting mechanism used in this
D-39
evacuation because the reverse-91 1 automated phone notification system is not used duringhurricane evacuations.
Emergency PreparednessThe community's emergency preparedness activities include planning, training, drills andexercises, and community awareness as described below.
PlanningThe community had a written emergency plan with an evacuation section that was used in thisemergency. The plan conformed to NUREG-0654/FEMA-REP-I, Rev. 1. However, it did notcontain an ETE.
TrainingTraining is provided to emergency response personnel and joint training between industry andgovernment is regularly conducted.
Drills and ExercisesCharlotte's emergency response agencies regularly conduct emergency drills and exercises. Theemergency plan used in this evacuation was previously tested in a full-scale field exercise. Theexercise performed immediately before this evacuation was a tabletop exercise.
Community AwarenessThe level of community awareness of local hazards and of evacuation procedures was high, butthe community's awareness about the hazard that caused this evacuation was low, andfamiliarity with the alerting methods used was average.
THREAT CONDITIONS
The threat condition leading to this evacuation was a chemical spill at the American Storage andWarehouse Company in west Charlotte on September 17, 2002. The incident was reported at6:30 p.m. by people who saw smoke coming from the building and called 911. About twentydrums of thiourea dioxide, a stripping agent used in textile dyeing, had reacted and releaseddangerous vapors into the air but did not cause a fire. Weather conditions were cool, fair, anddry, and the roads were dry. No unusual circumstances occurred during this incident.
CONSEQUENCES
One thousand residents were evacuated from their homes and businesses. No deaths wereassociated with the incident but twelve people, including five firefighters, five police officers,one TV news cameraman, and one resident, were treated at the hospital for breathing problems.The estimated total cost of evacuation-related expenses is negligible.
D-40
EMERGENCY RESPONSE
Decision MakingThe level of cooperation among local, state, and federal agencies was high. Political boundarieswere not crossed. The command, control and coordination processes could best be described aspre-planned. The Charlotte police chief made the decision to evacuate and there were noproblems with decision-making process.
CommunicationsAn EOC was not used but there was an ICP. Communication among field emergency respondersand the ICP was by radio. There were no problems with communication.
Notification and WarningSenior local officials were notified of the incident through the Emergency Management'stelephone calling tree and emergency responders were notified through the 911 phone system.There were no problems with notification of emergency personnel or senior local officials. Thetime that elapsed between discovery of the incident and mobilization of response personnel wasless than fifteen minutes and the decision to evacuate was made in ten minutes. It tookapproximately twenty minutes to complete the evacuation. The public was notified throughseveral means, including a police/fire PA system, a reverse-91 1 automated phone system, andemergency personnel going door to door. The evacuation took place all at once and there wereno problems regarding warning and subsequent citizen action.
Traffic Movement and ControlEvacuees were given instructions about where to go to seek a congregate care center but werenot told to use specific routes. No special institutions were evacuated. Road conditions beforethe evacuation were dry and there were no traffic accidents or traffic problems, and all majorroadways were available to evacuees. Reverse-laning was not used. Some people evacuatedbefore being told to do so and no one refused to evacuate.
Congregate Care CentersThe American Red Cross set up a congregate care center at Harding University High School andabout a dozen people showed up, or approximately 1.5% of evacuees. There were shadowevacuations but this did not impact traffic or congregate care center capacity.
Law EnforcementPolice secured the area following the evacuation and no instances of looting or vandalism or anyproblems with law enforcement occurred.
Re-EntryAt 10:45 p.m. on September 17, more than four hours since the start of the emergency,responders allowed evacuees to return to their homes. There were no special controls during the
D-41
re-entry process. Evacuees were not compensated for their expenses. No major problems duringre-entry occurred.
INVESTIGATOR COMMENTS
According to the Charlotte Hazmat Captain, the reverse-91 1 automated phone notificationsystem contributed to the success of the evacuation. However, the evacuation was difficultbecause the evacuation area was so large.
CONTACT INFORMATION AND REFERENCES
Contacts
Charlotte Hazmat Captain(704) 336-2461(Personal Communication, 7/8/03)
References
Church World Service Emergency Response Program. "Toxic Spills \'Scary\'." September 18,2002. <http://www.cwserp.org/technological disasters/nes.php?newsld=l2> (April 9, 2003).
D-42
CSX Train Derailment and Fire, Baltimore, Maryland, July 18, 2001, ID #96
At 3:07 p.m. on Wednesday, July 18, 2001, a CSX Transportation train traveling from Hamlet,North Carolina, to Oak Island, New Jersey, derailed in the Howard Street Tunnel under thestreets of Baltimore, Maryland. The train was carrying a variety of freight and hazardousmaterials with three locomotives and sixty cars. The 2.4 km (1.5 mi) long train derailedapproximately in the middle of the 4.8 km (3 mi) long Howard Street Tunnel. Complicating thescenario was the subsequent rupture in a 100 cm (40 in) water main that ran directly above thetunnel. The flooding hampered extinguishing efforts, collapsed several city streets, knocked outelectricity to about 1,200 Baltimore customers, and flooded nearby buildings. The crash alsointerrupted a major line associated with the internet and an MCI WorldCom fiber optic telephoneline.
After the derailment, city officials closed down entrances to the city from all major highways.The baseball game between the Baltimore Orioles and the Texas Rangers at nearby CamdenYards was postponed and the stadium was evacuated. In addition, pedestrians were evacuatedfrom the area and local residents were requested to shelter in place. It is estimated that as manyas 10,000 people were evacuated from the area with no reports of injuries resulting from theevacuation. It took almost an hour for the Baltimore Fire Department to be notified of the event,which has been an issue and likely contributed to the difficulty of extinguishing the fire andcontrolling the situation.
COMMUNITY CONTEXT
GeneralBaltimore, Maryland is an urban community with a population of approximately 650,000 people.The city covers an area of 238.5 km2 (92.1 mi2). It has a very diverse economic base includingindustry, government, commercial, retail, and all forms of business services. On July 18, 2001,as many as 10,000 people were evacuated from the downtown area in the vicinity of the HowardStreet Tunnel. The area was moderately congested at the time of the incident because baseballgames were scheduled at Camden Yards. There was a day/night double header in which twogames are played on the same day, but not back to back. The early game had been completedand most fans had left the area. The players, concessionaires, and stadium workers were
D-43
evacuated. Between 2,500 and 5,000 fans remained when police officials evacuated the facility.The remaining community area was not evacuated, but sheltered in place. Thus, the actualpercentage of the community that was evacuated is small since many of the evacuees were notresidents of the area.
The evacuation area was primarily associated with the stadium and pedestrians in the vicinitytotaling about five square blocks. Ethnicity, nationality, and age were not important factors inthe evacuation. The city is located approximately 121 km (75 mi) from a commercial nuclearpower plant, the Calvert Cliffs Reactors 1 and 2, which are approximately 65 km (40 mi) southof Annapolis, Maryland.
History of EmergenciesThe area is no more prone to hazards than average for a city of this size. However, as a largecity, evacuations do occur, including those from floods, fires, bomb threats, and chemicalreleases. The community did not have any prior experience with the combined fire andhazardous materials inside a train tunnel.
The community had experienced minor evacuations in the previous ten years and had experiencewith the alerting mechanism used in this evacuation, police notifying people in the area toevacuate. However, the majority of the evacuation was from the stadium, which does notadequately represent members of the community, as these were players, fans, and workers in thearea.
Emergency PreparednessThe community's emergency preparedness activities include planning, training, drills andexercises, and community awareness, as described below.
PlanningBaltimore did have an emergency plan that was used in the incident. The plan contained threepages on evacuations, but not enough detail to provide a working blueprint for evacuations. Thefire marshal who heads the mostly volunteer committee that produced the plan, said thecommittee had been unable to fill several gaps in the plan because of lack of budget. Accordingto the plan, this was a Level III event requiring public notification to evacuate or shelter in place.The stadium and pedestrians in the area were evacuated while the residents of the area wererequested to shelter in place.
The plans probably did not conform to NUREG-0654/FEMA-REP- I, Rev. 1, and it is unknownif they contained evacuation time estimates. There have been many complaints about theadequacy of the plan with regard to the evacuation process.
TrainingTraining is provided to emergency response personnel and includes joint training with therailroad industry.
D-44
Drills and ExercisesApproximately six weeks before the incident, a full-scale drill was conducted with Baltimoreemergency response teams using a MARC train in an Amtrak Tunnel. The Baltimore emergencyresponse personnel also conducted drills in a Metro tunnel. These were passenger train drills,not hazmat train incident drills, but did acquaint personnel with tunnel environments.Approximately three years earlier, training was conducted on a train and truck hazardousmaterials collision.
Community AwarenessThe community's level of awareness regarding local hazards and evacuation procedures waslikely low. The community's level of awareness about the hazard that caused the evacuation andabout the alerting methods used was also low.
THREAT CONDITIONS
At 3:07 p.m. on July 18, 2001, a CSX freight train derailed in the Howard Street Tunnel andcaught fire. The 2.4 km (1.5 mi) long train was carrying a variety of freight and hazardousmaterials and derailed approximately in the middle of the 4.8 km (3 mi) long Howard StreetTunnel. Complicating the situation was the break of a 100 cm (40 in) water line that flooded thearea and hampered fire fighting. For the first time since installing them in 1952, the cityactivated its civil defense sirens at 5:45 p.m. to warn citizens of the impending danger from thederailment and fires. The incident occurred on a warm dry day in between games of a BaltimoreOrioles day/night double header at rush hour in downtown Baltimore.
CONSEQUENCES
The fire and flood that followed caused the evacuation of Camden Yards and the B&OWarehouse area. Up to 5,000 fans filled the stadium along with approximately 2,000 employees,including players and additional pedestrians in the area. The evacuation downtown at rush hourwas a complete traffic disaster. Block after block of commuters sat in bumper-to-bumper traffickeeping abreast of the situation through cellular phones or the radio.
According to the City of Baltimore Emergency Management Plan, a public informationannouncement must be made to the public during a Level III emergency. In the early stages ofthe incident, the incident was determined to be a Level III emergency and the EmergencyManagement Director urged that a public announcement be made over radio and television toalert citizens and to initiate a shelter in place advisory. In the general area surrounding MountRoyal Station, citizens were offered the choice to leave or shelter in place. Since there was someconcern over the residual effects of smoke to persons around the tunnel portals, an evacuationorder to pedestrians was broadcast.
The city of Baltimore issued a liberal leave policy for employees, as did the state of Maryland atState Center. As utility workers, police, and firefighters labored on Howard Street, two large
D-45
office buildings and several other businesses along the road were shut down. The downtownbusiness district and Howard Street especially, took a huge economic hit from the train fire. Intotal, more than 10,000 people may have been evacuated in the event. At least twenty-twopeople, including two firefighters with chest pains, were treated at area hospitals, most forrespiratory or eye irritation. None of these injuries were attributed directly to the evacuation.The estimated total cost of the actual evacuation was not determined.
EMERGENCY RESPONSE
Decision MakingThe level of cooperation among local, state, and federal agencies was high. Only a few politicalboundaries were crossed, including city/county involvement with runoff entering the harbor.Baltimore has a Local Emergency Planning Committee (LEPC) that includes the BFD to providecommunity awareness and interagency cooperation. The success of this incident has beendirectly related to the interagency cooperation and coordination of agencies and resources. Afew of the agencies involved included the Baltimore Fire, Police, and Emergency ManagementDepartments, Maryland Department of Environment, CSX Transportation, Baltimore CountyFire Department, and the U.S. Coast Guard.
The command, control and coordination processes could best be described as preplanned.The BFD made the decision to evacuate and there were no problems with the decision-makingprocess.
CommunicationsThe city of Baltimore has a consolidated Communications Center with an 800 MHz fire, police,and public services frequency system. This system provided outstanding performance to the fireservice during the Howard Street Tunnel incident. The incident commander believed thatcommunications and radio capabilites of the Baltimore Fire Department were the most importantfeatures of the incident's success.
Notification and WarningThere were problems with notification of the event reaching the fire department, as it tookalmost an hour for the fire department to be notified. However, once they were notified andresponded, the emergency management plan was activated and communication proceededsmoothly. The mayor was called as he was attending another event and ordered the roads closed.
Emergency response personnel mobilized immediately. The decision to evacuate was made afterthe fire department reached the scene more than an hour after the fire started. It is difficult toestimate the time to complete the evacuation as many of the people were stuck in traffic forhours. Police notified the public to evacuate by informing stadium management, and thepolice/fire PA system was used to notify pedestrians in the area Police and firefighters goingdoor-to-door notified some residents to shelter in place. The evacuation took place all at once
D-46
and there were no special problems regarding warning; however, there were significant trafficproblems.
Traffic Movement and ControlState highway officials closed all major roadways into the city in the hours following theaccident at the request of fire and police. Approximately 200 highway workers were stationed atthe city line to turn back motorists, and roadblocks were set up. All traffic coming from thedowntown area was rerouted away from potentially dangerous areas. The changes in trafficroutes cause rush hour gridlocks and even affected the light rail transportation in the city. By11:30 p.m. all major roads had been reopened.
Evacuees were given specific instructions about where to go when they evacuated and were toldto use specific routes that were designated by police barricades and policemen directing traffic.Road conditions were dry and there were no reports of anyone refusing to evacuate.
Congregate Care CentersCongregate care centers were not available. Shadow evacuations likely occurred; however, thisis difficult to estimate because most people in the area were provided the option to evacuate orshelter in place.
Law EnforcementThe area was secured by the police, and there were no instances of looting or vandalism. Noproblems with law enforcement were identified.
Re-EntryThe downtown streets were reopened by 11:30 p.m. with the exception of Howard Street. Asthis is a commercial area, re-entry was not a problem. Businesses in the area opened again thenext day. However, businesses within a few blocks of the event were forced to stay closedbecause of the flooding and smoke, and games at Camden Yards were postponed for a few days.
INVESTIGATOR COMMENTS
The incident, including the evacuation, was considered a success because of the excellentperformance of the city's communication system and the coordination and cooperation ofauthorities. The main problem with the evacuation was traffic control. Had the incident beenreported immediately, evacuation would have occurred closer to 3:30 p.m., and much of rushhour may have been missed.
CONTACTS AND REFERENCES
Maryland Emergency Management AgencyState Emergency Operations Center
CNN. "Baltimore Still Feels Train Fire's Effects." July 19, 2001.<www.cnn.com/200 1 /US/07/19/train. fire/> (April 28, 2003).
FEMA. "CSX Tunnel Fire." July 2001.<http://www.usfa.fema.gov/downloads/pdf/publications/tr-140.pdf> (June 2003).
SunSpot.net. "Baseball fans and commuters held hostage by road closings." July 19, 2001.<http://www.baltimoresun.com/technology/balte.md.sceneI 9jul 1 9,0,4361107.story?coll=bal-technology-headlines> (June 2003).
SunSpot.net. "Chronology: With a rumble, chaos." July 21, 2001.<http://www.baltimoresun.com/technology/bal-te.md.accident2 ljul21,0,7229827.story?coll=bal-tehnology-headlines> (June 2003).
The Bull Sheet. "Howard Street Tunnel Fire." July 18, 2001.<http://www.bullsheet.com/news/tunnelfire.html> (June 2003).
The Daily Ardmoreite. "Freight Train Derails forcing postponement." July 19, 2001.<http://www.ardmoreite.com/stories/071901/spoorioles.shtml> (June 2003).
The WBAL Channel.com. "Progress made in tunnel fire." July 19, 2001.<http://www.thewbalchannel.com/News/879713/detail.html> (June 2003).
The WBAL Channel.com. "Train derails; hazardous chemicals on board." July 19, 2001.<http://www.thewbalchannel.com/News/878827/detail.html> (June 2003).
US Fire Administration. "CSX Tunnel Fire."<http://www.usfa.fema.gov/applications/publications/trl40.cfin> (June 2003).
USA Today Sports. "Rangers vs. Orioles." July 19, 2001.<http://www.usatoday.com/sports/scores 101/101200/101200303.htm> (June 2003).
D-48
Waltham Local Emergency Planning Committee. "Officials to improve city emergency plan."July 27, 2001.<http://www.walthamlepc.org/news/baltimore/Baltimore2.htm> (June 2003).
D-49
World Trade Center, Lower Manhattan, September 11, 2001, ID #126
On September 11, 2001, 300,000 people were evacuated from lower Manhattan following anattack on the World Trade Center (WTC). The attack involved the hijacking of two fully fueledpassenger jets, which were used as flying bombs, crashing into each of the twin towers of theWTC and ultimately killing 2,823 people. In addition to the loss of life, the twin towers, alongwith several neighboring buildings, subsequently collapsed. The evacuation included more than8,000 children in the vicinity of Ground Zero. Ferries and tugboats were used to evacuate peopleto Liberty State Park in New Jersey. Rescue and recovery took months, with the cleanupcontinuing through May 2002. The total cost of the evacuation was millions of dollars.
COMMUNITY CONTEXT
GeneralThe WTC brought together businesses and government agencies involved in foreign trade. Itwas a complex of several buildings around a central plaza, near the foot of Manhattan in NewYork City. Each of the towers had 10 stories. About 50,000 people worked in the WTC, withoffices of 430 businesses from twenty-six different countries. One of the world's largest golddepositories was stored underneath the WTC, and was owned by a group of commercial banks.
Manhattan is one of the five boroughs that form New York City. It consists mainly of a smallisland between the Hudson River to the west, the East River to the east, and the Harlem River tothe northeast, connected by bridges and tunnels to New Jersey (west), the Bronx (northeast) andBrooklyn and Queens on Long Island (east and south). Manhattan is 21.5 km (13.4 mi) long andhas an area of 59 km2 (22.8 mi2). Approximately 300,000 people (or 20% of the population ofManhattan) were ordered to evacuate after the adjacent WTC towers collapsed. Age was a factorin the evacuation, since more than 8,000 children were evacuated from all types of schools,ranging from day care to high schools and from fully mobile to multiply handicapped children.
The community's main economic base is business/financial, commercial/retail, and tourism, andthe evacuated area was densely populated with business workers from surrounding areas.
D-50
The Indian Point Nuclear Power Plant is in Westchester County, New York, just 39 km (24 mi)north of the New York City boundary and 56 km (35 mi) north of mid-town Manhattan. TheIndian Point Nuclear Power Plant has twenty million people living within an 80 km (50 mi)radius.
History of EmergenciesLower Manhattan is no more prone to natural or technological hazards than the average U.S.city. However, a malevolent act on February 26, 1993, led to an evacuation; a bomb exploded inthe underground garage of the WTC North Tower, opening a 30 m (98 ft) hole through foursublevels of concrete. Six people were killed and more than a thousand were injured. Primarilydue to the 1993 incident, residents and workers in lower Manhattan had previous experiencewith the alerting mechanisms used in the 2001 evacuation.
Emergencv PreparednessThe community's emergency preparedness activities include planning, training, drills andexercises, and community awareness as described below.
PlanningThe New York City Fire Department (FDNY) had a written emergency plan with an evacuationsection, and it was used in this emergency. It is unknown whether the FDNY plan conformed tothe requirements of NUREG-0654/FEMA-REP-1, Rev. 1. Individual businesses, including theWTC towers, also had their own evacuation plan; however, it is unknown whether these planswere used in this emergency.
TrainingTraining of emergency response personnel, including joint training between industry andgovernment, is regularly conducted.
Drills and ExercisesEmergency drills and full-scale field exercises are regularly conducted, and the plan used in thisemergency was previously tested in a full-scale exercise. However, the type of exerciseconducted immediately prior to this evacuation is unknown. Evacuation drills have beenregularly conducted at the WTC since the 1993 bombing incident.
Community AwarenessThe community likely had an average awareness of local hazards and of the hazard (i.e.,malevolent act) that led to this evacuation. Evacuation drills had become routine following the1993 WTC bombing and therefore, the community probably had a high level of awareness aboutevacuation procedures and the alerting methods used in this evacuation.
D-51
THREAT CONDITIONS
The WTC attack was an act of malevolence. The weather was dry and clear that day. At 8:46am. American Airlines Flight 11 (a fully fueled Boeing 767) crashed into the North Tower ofthe World Trade Center, between floors ninety-four and ninety-eight. At 9:02 am. UnitedAirlines Flight 175 (another fully fueled Boeing 767) crashed into the south side of the SouthTower, between floors seventy-eight and eighty-four. The South Tower began to collapse soonafter it was hit, followed by the North Tower. Shortly after the jets hit, at least twenty people,primarily in the north tower, trapped by fire and smoke in the upper floors, jumped to theirdeaths. No form of airborne evacuation was attempted because the smoke was too dense for asuccessful landing on the roof of either tower. People immediately evacuated in whatevermanner possible. At 10:13 a.m. thousands were evacuated from the United Nations complex inNew York. At approximately 10:48 a.m., New York City Mayor Rudolph Giuliani officiallyordered the evacuation of lower Manhattan.
CONSEQUENCES
Approximately 300,000 people were evacuated from lower Manhattan. A total of 2,823 peopledied and thousands more were injured. However, the deaths and injuries that occurred duringthe evacuation could be directly attributed to the attack and not to the evacuation itself The totalcost of the evacuation was millions of dollars.
EMERGENCY RESPONSE
Although the community was extremely well prepared for an emergency, it is difficult to preparefor an emergency of this magnitude. This could very well have been a once in a lifetime event.As such, there were several problems identified during the emergency response and the FDNY,the New York Police Department (NYPD), and other responders are working to rectify thoseproblems.
Decision MakingThe level of cooperation among local, state, and federal agencies was extremely high; however,it was not without problems. Throughout the response, the FDNY and the NYPD rarelycoordinated command and control functions and rarely exchanged information related tocommand and control. Because of the magnitude of the incident, FDNY sought aid fromWestchester and Nassau Counties. Command, control and coordination processes could best bedescribed as pre-planned. The mayor of New York City ordered the evacuation of lowerManhattan, and there were no problems with the decision-making process.
CommunicationsAn EOC and ICP were used during this emergency. Communication between field emergencyresponders and ICP was by radio. Cell phones and regular phone lines were all jammed and notuseable. The FDNY's response to the attacks of September 11 began at 8:46 a.m. and by 8:50
D-52
a.m., an ICP was established in the lobby of WTC 1 (also called the South Tower). Atapproximately 9:00 a.m., the Incident Commander moved the ICP from the lobby of WTC 1 tothe far side of West Street (an eight-lane highway) opposite WTC I, because of the increasingrisk from falling debris within and around the lobby and other safety concerns.
A number of communication difficulties hindered FDNY chief officers as they coordinated theresponse. The portable radios that were used by the FDNY on September 11 do not workreliably in high-rise buildings without having their signals amplified and rebroadcast by arepeater system. The World Trade Center had such a system, but chief officers deemed itinoperable early in the response after they tested it in the lobby of WTC 1.
Radio communications between chief officers in the lobby of WTC I and the units they sent intothe building were sporadic. The chiefs were able to get through to some units sometimes, butnot others. Some units acknowledged receiving radio communications some times, but notothers. This left the chiefs not knowing whether their messages failed to get through, whethertheir units failed to acknowledge because they were busy with rescue operations, or whether theunits did acknowledge, but the acknowledgement did not get through. Because informationabout civilians in distress continued to reach the operations post in the lobby, the chief officersdecided to continue their attempts to evacuate and rescue civilians, despite the communicationsdifficulties.
In attempts to improve their communications, chief officers tried to deploy the department'smobile repeater and give units "standpipe phones" that could be connected to boxes along thebuilding's standpipe system. These were all ineffective.
The collapse of WTC 1 at 9:59 a.m. killed many civilians and first responders and destroyed theICP on West Street and the Field Communications Unit. The collapse weakened the commandand control structure as fire and EMS chiefs at the ICP, including the Incident Commander,sought shelter in nearby structures.
Notification and WarningEmergency responders were notified of the incident through the 911 phone/dispatch system.There were no problems with notification of emergency personnel or senior local officials. Thewhole world knew about this event, which unfolded in the international media with livecoverage. The time that elapsed between discovery of the incident and mobilization of responsepersonnel was approximately two minutes. The mayor of New York City ordered the evacuationof lower Manhattan at 10:48 a.m., approximately two hours after the start of the incident.
D-53
Traffic Movement and ControlEvacuees were given specific instructions about where to go when they evacuated. Many peopleevacuated on foot and walked to ferries that transported them to Liberty State Park in NewJersey. Mariners began evacuation proceedings immediately following the attacks, movingunprecedented numbers of people to safety. One company, New York Waterway, carried morethan 160,000 people, while Seastreak America set up a decontamination center at its terminal inaddition to evacuating people off Manhattan.
For those who did evacuate via roadways, there were no adverse weather conditions to affectroad conditions. However, there was traffic congestion and gridlock in the area. Reverse-laningwas not used since it would hamper the incoming emergency vehicles. People in the immediatevicinity of the incident began evacuating immediately and no one refused to evacuate.
Numerous special facilities that handle children - from day care to high school seniors, fromfully mobile to multiply handicapped - were safely evacuated from the vicinity of Ground Zeroin lower Manhattan. More than 8,000 children were evacuated.
Conaregate Care CentersCongregate care centers were used and were managed by the American Red Cross. Publicbuildings were used as congregate care centers and many evacuated to Liberty State Park in NewJersey. Others left their workplaces in lower Manhattan and returned to their homes, which wereoutside of the evacuated area. It is unknown how many people went to the congregate carecenters. There were no known shadow evacuations.
Law EnforcementPolice and national guardsmen secured the area following the evacuation. However, looting andvandalism did occur. In addition, some people took advantage of the incident and committedfraud.
Re-EntryRe-entry was authorized by the mayor and was a controlled phased re-entry. Most people wereallowed to return to their homes; however, some businesses remained closed for several weeksand some never reopened. There were no major problems during re-entry, although somebusinesses were completely destroyed in the tragedy. Several funds were set up to help thevictims.
CONTACT INFORMATION AND REFERENCES
Contacts
District Office for New York City Fire Department(718) 999-2457
D-54
References
CNN. "September I1: Chronology of terror." September 12, 2001.<www.cnn.com/2001/US/09/1 l/chronology.attack/> (June 2003).
Lehmuller, P. and A. Switzer. "September 11: An Elementary School at Ground Zero."PRINCIPAL Magazine, March 2002. <http://www.naesp.org/comm/pO3O2c.htm> (June 2003).
"FDNY Fire Operations Response on September 11," New York City Fire Department.<http://www.nyc.gov/html/fdny/pdf/mckreport/fireoperations response.pdfz
"McKinsey Report - Increasing FDNY's Preparedness," New York City Fire Department.<http://home.nyc.gov/html/fdnyfhtml/mck_reportltoc.shtml>
D-55
Centennial Olympic Park, Atlanta, Georgia, July 27, 1996, ID #124
The Centennial Olympic Park bombing was a malevolent act that took place on July 27, 1996, inAtlanta, Georgia, during the 1996 Summer Olympics. An early morning blast forced theevacuation of approximately 60,000 people from the crowded park in downtown Atlanta. Onewoman was killed from bomb shrapnel that struck her in the head, and another person, acameraman, died from a heart attack while running to cover the blast. The blast injured 111others. However, there were no injuries or deaths associated with the evacuation and no unusualcircumstances or special problems that occurred during the evacuation.
COMMUNITY CONTEXT
GeneralAtlanta, Georgia, is an urban city that was the host of the 1996 Summer Olympic Games. It hasa total population of 416,474 residents and has a total area of 343 km2 (132 mi2). Approximately60,000 (14% of the total population) were evacuated from a 1-mi2 area. Population densityduring the evacuation was high and ethnicity, nationality, or age were not important factors.
Land use in the area is mainly commercial, and Atlanta has a mayoral form of government. Thecommunity's main economic base is tourism and it attracts a large number of non-residents tothe area. Atlanta is more than fifty miles away from the nearest commercial nuclear powerplant, which is in Georgia.
History of EmergenciesAtlanta is more prone to hazards that the average U.S. city because of its numerous railroads andmajor highways. It is also in a tornado-prone area. The community did not have experiencewith the hazard that led to this evacuation, although it did have experience with evacuations andwith the alerting mechanisms used.
Emergency PreparednessThe community's emergency preparedness activities include planning, training, drills andexercises, and community awareness as described below.
D-56
PlanningThe community had a written emergency plan that contained an evacuation section and was theplan used in this emergency. It is unknown if the plan conformed to NUREG-0654/FEMA-REP-1, Rev. 1, or if it contained an ETE.
TrainingTraining is provided to emergency response personnel and joint training between industry andgovernment is regularly conducted.
Drills and ExerciseThe community's emergency response agencies regularly conduct emergency drills andexercises. The emergency plan used in this evacuation was previously tested in a full-scale fieldexercise, and a full-scale field exercise and a tabletop exercise were performed immediatelybefore this evacuation.
Community AwarenessThe level of community awareness about local hazards and about the hazard that led to thisevacuation was high. The level of community awareness about evacuation procedures and aboutthe alerting methods used was medium.
THREAT CONDITIONS
The threat conditions leading to this evacuation consisted of a malevolent act that took place onJuly 27, 1996, in Atlanta, Georgia, during the 1996 Summer Olympics. An early-morning blastforced the evacuation of approximately 60,000 people from the crowded park in downtownAtlanta. According to CNN News, the attack happened as follows: At 12:58 a.m., a securityguard found an unattended bag beneath a sound control tower and he alerted the bomb disposalteam. Then at 1:07 a.m., a male called 911 warning that the bag would explode in thirtyminutes. At 1:08 a.m., bomb experts identified wires and a pipe within the bag and began toevacuate park visitors. At 1:20 a.m., the bomb exploded. Downtown Atlanta was sealed off at2 a.m.
A few hours after the bombing, Richard Jewell was named as the prime suspect, but it was laterdiscovered that Eric Robert Rudolph was to blame. Weather conditions were warm and clearand road conditions were dry. There were no unusual circumstances or special problems thatoccurred during the evacuation.
CONSEQUENCES
On July 27, 1996, in Atlanta, Georgia, a bombing occurred in the crowded Centennial OlympicPark. One woman was killed from bomb shrapnel that struck her in the head and another person,a cameraman, died from a heart attack while running to cover the blast. The blast injured 111others. However, no injuries or deaths associated with the evacuation occurred, and no unusual
D-57
circumstances or special problems occurred during the evacuation. The estimated total cost ofevacuation-related expenses is unknown.
EMERGENCY RESPONSE
Decision MakingThe level of cooperation between local, state, and federal agencies was high and politicalboundaries were crossed. The command, control, and coordination processes could best bedescribed as pre-planned. The decision to evacuate was made by venue authorities and the stateEOC. There were no problems with the decision-making process.
CommunicationAn EOC and an ICP were used in this emergency. Communication between field emergencyresponders and the EOC was by radio and cell phone, and there were no problems withcommunications.
Notification and WarningSenior local officials were made aware of the incident by means of a notification tree, and localpolice and a 911 phone call notified emergency responders. The time that elapsed between thediscovery of the incident and mobilization of response personnel was less than fifteen minutes.The time between the start of the hazard and the decision to evacuate was ten minutes. Theevacuation happened all at once and took 55 minutes to complete. There was no problem withnotification of emergency personnel or senior local officials. The public was notified byemergency personnel telling evacuees face to face. There were no special problems regardingwarning or subsequent citizen action.
Traffic Movement and ControlEvacuees were not given specific instructions about where to go when they evacuated or specificroutes to use. There were no special institutions evacuated. Road conditions before theevacuation were dry and no special traffic problems were encountered. Reverse-laning was notused and there were no traffic accidents during the evacuation. No one evacuated before beingtold to do so and no one refused to evacuate.
Congregate Care CentersCongregate care centers were not used. There were shadow evacuations but they did not impacttraffic.
Law EnforcementPolice secured the area following the evacuation to prevent looting and vandalism. There wereno instances of looting or vandalism and no problems with law enforcement.
D-58
Re-EntryA joint decision of city, state, and Olympic committees authorized re-entry. There were nospecial controls during the re-entry process. Evacuees were not compensated for their expensesand no major problems occurred during re-entry.
INVESTIGATOR COMMENTS
The proximity of the blast and getting everyone to cooperate were factors that made theevacuation work well.
CONTACT INFORMATION AND REFERENCES
Contacts
Georgia Emergency Management Agency Public Affairs Officer(404) 635-7022Personal Contact 9/8/03
On October 23, 1995, a railroad tank car at the Gaylord Chemical Corporation Plant in Bogalusa,Louisiana, exploded, releasing poisonous and corrosive nitrogen tetroxide vapors.Approximately 3,000 people were evacuated between October 23 and October 24 because of thevapor cloud, and 4,710 people were treated for irritated eyes and sore throats at local hospitals;81 people were admitted.
COMMUNITY CONTEXT
GeneralBogalusa, Louisiana, is a suburban parish of 13,365 people based on the 2000 Census (14,280people based on the 1990 census). It covers an area of 24.7 km2 (9.5 mi2). Approximately 3,000people, or slightly more than 20% of the population, were evacuated as a result of the tank carfailure at Gaylord Chemical Corporation on October 23, 1995. The evacuated area wasprimarily residential and covered 8.1 km2 (3.14 mi2). The population density at the time of theevacuation was average (medium). Ethnicity, nationality, and age were not important factors inevacuation.
Bogalusa is a manufacturing and trading center situated on the Pearl River. It has a mayoralform of government. There are no special characteristics that attract a large number of non-residents. Bogalusa is approximately 145 km (90 mi) from the River Bend Nuclear Power Plantand 113 km (70 mi) from the Waterford Nuclear Power Plant, which are both in Louisiana.
History of EmergenciesBecause it is a manufacturing center, the city may be slightly more prone to technologicalhazards, and it is within a hurricane-prone state, making it more prone to natural disasters thanthe average U.S. city. The community did not have any prior experience with the hazard that ledto this evacuation and had not experienced any evacuations in the previous 10 years. Bogalusaresidents did not have previous experience with the alerting mechanism used in this evacuation.
D-60
Emergency PreparednessThe community's emergency preparedness activities include planning, training, drills andexercises, and community awareness as described below.
PlanningBogalusa does not have a written emergency plan. The Gaylord Chemical Plant's emergencyresponse plan was the one in place. The plan likely did not conform to NUREG-0654/FEMA-REP-1, Rev. 1, and the Bogalusa Fire Department does participate in this plan. AlthoughLouisiana passed a state law in 1989 designed to force petrochemical companies and localemergency planning committees (LEPCs) to work together to plan for worst-case accidents, thatlaw was never implemented because the Department of Environmental Quality was still workingon the regulation.
TrainingTraining is provided to emergency response personnel, but joint training between industry andgovernment is not conducted.
Drills and ExercisesBogalusa's emergency response agencies do not regularly conduct emergency drills andexercises.
Community AwarenessThe level of community awareness about local hazards, evacuation procedures, and about thehazard that caused this evacuation was low. The community probably had an average awarenessabout the alerting methods used.
THREAT CONDITIONS
The threat condition leading to the evacuation was a release of poisonous and corrosive vaporsfrom a failed tank car at the Gaylord Chemical Plant. Around 3:55 p.m. on October 23, 1995,yellow-brown vapors began leaking from a railroad tank car that contained a mixture of nitrogentetroxide and water. Plant personnel notified emergency response agencies, and Bogalusa firepersonnel arrived at the scene around 4:30 p.m. and set up fire hoses to help suppress the vapors.
At about 4:45 p.m., the tank car exploded, resulting in one end of the tank car jacket being tornaway and thrown about 106.7 m (350 fi). The tank car was then propelled 10.7 m (35 ft) downthe track and derailed at a track bumping block, releasing a large reddish-brown vapor cloud.Vapors continued to be released for another 36 hours until the chemical reaction within the tankwas brought under control through neutralization and dilution.
It was cloudy and windy but the road conditions were dry. However, the emergency responseand ensuing evacuations encountered several special problems. The response was hampered bythe absence of the fire chief, who was being treated at the hospital, and the fact that the
D-61
explosion cut off telephone service in most of Bogalusa. In addition, the streets were jammedwith frightened residents attempting to leave. Emergency medical facilities were taxed to thelimit by injured residents and rescuers, most suffering from burned eyes, irritated skin anddifficulty breathing. In addition, one of the two hospitals available to treat victims was locatedinside the evacuation zone.
CONSEQUENCES
Approximately 3,000 people, or slightly more than 20% of the population, were evacuated.There were no deaths or injuries related to the evacuation itself; however, 4,710 people weretreated at local hospitals and 81 people were admitted because of the vapor cloud consisting ofnitrogen tetroxide gas, which is poisonous when inhaled. The estimated total cost of evacuation-related expenses is unknown.
EMERGENCY RESPONSE
Decision MakingThe level of cooperation between local, state, and federal agencies was high. The incidentinvolved the state police, two federal agencies, the National Transportation Safety Board(NTSB) and the Occupational Safety & Health Administration (OSHA), and hazmat teams fromSlidell, Louisiana, and Mobil Oil in Chalmette, Louisiana. Political boundaries were notcrossed. The command, control and coordination processes could best be described as ad hoc.The fire chief made the decision to evacuate just before being taken to the hospital to be treatedfor inhalation problems. There were no problems in the decision-making process.
CommunicationsAn EOC, including an ICP, was used in this emergency. The Louisiana State Police assumedcommand of the incident, as dictated by state law, and the incident commander initiated themutual aid system. Because Bogalusa is part of a mutual aid system, the fire department has nohazmat team and no chemical protective equipment. The Bogalusa Fire Department doesparticipate in Gaylord's emergency response plan. Hazmat teams from Slidell and Mobil Oil inChalmette were called to the scene. A command center was established, but was moved twicebecause of shifting winds. Field emergency responders communicated via radio since theexplosion cut off telephone service in much of Bogalusa. There were problems withcommunications because the field responders and EOC were on different radio frequencies.
Notification and WarningSenior local officials were called and paged and the governor declared a state of emergency.Emergency personnel were notified through the 911 system. There were no problems withnotification. Emergency response personnel mobilized to the scene within 15 minutes ofdiscovery of the incident, and the decision to evacuate was made between 15 and 30 minutesfrom the start of the hazard. There were at least two, and possibly three, stages to theevacuation, although the details are vague. The first stage of the evacuation involved 3,000
D-62
people within a 2.6 km (1 mi) radius and took 1.5 hours to complete. According to publishedreports, additional residents were evacuated 24 hours after the initial evacuation (i.e., Stage 2 onOctober 24). The public was notified by officers who went door-to-door and by a police/fire PAsystem, as well as by radio and television broadcasts. There were no special problems regardingwarning and subsequent citizen action. Citizens were reportedly very cooperative.
Traffic Movement and ControlThe Bogalusa fire and police departments set up roadblocks when they arrived on the scene andimmediately made plans for an evacuation. The streets were jammed with frightened residentsattempting to leave. Evacuees were not told to use specific routes and it is unknown if they weretold where to go. No special institutions were evacuated.
No major roadways were unavailable and reverse laning was not used. Some peoplespontaneously evacuated before being told to do so when they saw the "mushroom cloud." Therewere no traffic accidents during the evacuations. There were a few instances of people refusingto evacuate.
Congregate Care CentersCongregate care centers managed by the Red Cross were used as were churches. The percentageof evacuees who went to congregate care centers is not known. Evacuation congregate carecenters had to be moved at least once due to changing wind direction. There were some shadowevacuations but this did not impact traffic and it is unknown if it impacted congregate care centercapacity.
Law EnforcementThe evacuated area was secured by police. There were 600-700 law enforcement officers on thescene, and there were no instances of looting or vandalism and no problems with law enforce-ment.
,Re-EnrThe state police chief authorized re-entry on the morning of October 25, 1995, two days after thestart of the hazard. There were no special controls on re-entry and no problems associated withre-entry. Evacuees were not compensated for their expenses.
INVESTIGATOR COMMENTS
The Bogalusa Fire Department showed a high level of professionalism in its response to theincident. They secured the scene, called for help, gathered information, and assisted the IC. Inaddition, the alerting mechanisms were effective.
The Bogalusa Fire Department felt that notification of the incident could have been move timely.In addition, the Fire Department had no hazmat team and no chemical protective equipment.The department does participate in Gaylord Chemical Plant's emergency response plan.
D-63
Although Louisiana passed a state law in 1989 to force petrochemical companies and LEPCs towork together to plan for worst-case accidents, that law has never been implemented because theDepartment of Environmental Quality is still working on the regulation.
CONTACT INFORMATION AND REFERENCES
Contacts
Bogalusa, Louisiana Fire ChiefBogalusa, Louisiana Police ChiefLocal American Red Cross(985) 732-6217 (phone)(Personal Communication, 6/27/03)
National Transportation Safety Board (U.S.) (NTSB). HZB-98-01, "Tank Car Failure andRelease of Poisonous and Corrosive Vapors, Gaylord Chemical Corporation, Bogalusa,Louisiana." NTSB: Washington, D.C. October 1995.
D-64
Union Pacific Railroad, Eunice, Louisiana, May 27, 2000, ID #30
On May 27, 2000, at least 2,000, and potentially as many as 3,500, residents of Eunice,Louisiana, were evacuated from their homes after a Union Pacific Railroad train derailed on theedge of town, sparking several blasts that sent fireballs into the sky. Thirty-two of the train's113 cars derailed, including several tank cars loaded with hazardous chemicals that includedacrylic acid and dichloropropane. No injuries were reported. The fire burned for several days,hampering cleanup and investigation efforts. Residents were allowed to begin returning to theirhomes after five days.
COMMUNITY CONTEXT
GeneralEunice, Louisiana, located approximately 120.7 km (75 mi) west of Baton Rouge, is classified assuburban although it is a combination of residential areas, manufacturing plants, and retailoutlets. It has a total population of 11,500 and covers an area of 12.1 km2 (4.7 mi 2). Between2,000 and 3,500 residents (or between 17% and 30% of the population) were ordered to evacuateon May 27, 2000, after a train containing hazardous cargo derailed and caught fire at the edge oftown. The evacuation area was between 7.8 and 31.1 km 2 (3 and 12 mi2). The populationdensity at the time of the evacuation was average. Ethnicity, nationality, and age were notimportant factors in the evacuation.
Eunice is a small city with a mayoral form of government. The main economic base ismanufacturing and industry (petroleum). There are no special characteristics that would attract alarge number of non-residents (although there is a Cajun Music Hall of Fame). The nearestcommercial nuclear power plant is over 80 km (50 mi) away. The state of Louisiana has twocommercial nuclear power plants.
History of EmergenciesCompared to similar communities, Eunice is more prone to technological hazards because of thepetroleum industry in the area and more prone to natural disasters, such as hurricanes. Thecommunity did not have any experience with the hazard that led to this evacuation and it is
D-65
unknown if there were any evacuations in the previous 10 years or if the community hadprevious experience with the alerting mechanism used in this evacuation.
Emergency PreparednessThe community's emergency preparedness activities include planning, training, drills andexercises, and community awareness as described below.
PlanningEunice has a written emergency plan with an evacuation section, and it was used in thisemergency. However, the plan is not written to the rigor of NUREG-0654/FEMA-REP-1, Rev.1, and it contains no ETE.
TrainingEmergency responders receive training on a routine basis. Firefighters, for example, receive aminimum of twenty hours of training per month, which includes emergency drills, exercises, andfull-scale field exercises. Joint training is conducted with the state police and the EPA on aroutine basis.
Drills and ExercisesThe community's emergency response agencies regularly conduct emergency drills andexercises, and the emergency plan used in this evacuation was previously tested in a full-scalefield exercise. The exercise performed immediately before this evacuation was likely a full-scale field exercise.
Community AwarenessThe community's awareness of local hazards and of evacuation procedures was likely no higherthan average. The level of awareness concerning the hazard that caused this evacuation was low,while the level of community awareness about the alerting methods used was average.
THREAT CONDITIONS
On May 27, 2000, a Union Pacific Railroad train containing hazardous cargo derailed and caughtfire at the edge of Eunice, Louisiana. The evacuation of between 2,000 and 3,500 residentsoccurred on a Saturday morning under clear and dry weather conditions. Roads were also clearand dry, and there were no unusual circumstances that occurred during this incident.
According to the Eunice fire chief, the fire was contained within the area where 32 boxcarsderailed. The fire jumped from boxcar to boxcar. One hour after the derailment, there was amajor explosion, the cause of which was undetermined. The explosion was followed by aminiature mushroom cloud that hung in the air for a long time. Within the cloud, were green,blue, lavender, and other rainbow colors (from chemicals). One-and-one-half hours later (i.e.,2.5 hours from the initial derailment) there was a second (bigger) explosion which was probablya propane tank, the heat from which was felt 2.4 km (1.5 mi) away. The fires continued for four
D-66
to five days following the derailment. Some fires/explosions were intentionally set to burn offchemicals (e.g., cyanide, acrylic acids). Wood and grass along the railroad tracks continued tobum for five days following the derailment. Fires were always contained within that area (i.e.,no homes burned).
CONSEQUENCES
The derailment of the Union Pacific Railroad train on May 27, 2000, forced the evacuation ofbetween 2,000 and 3,500 residents. There were no deaths or injuries caused by the accident orthe evacuation. The estimated total cost of evacuation-related expenses was approximately$200,000.
EMERGENCY RESPONSE
Decision MakingThe level of cooperation among local, state, and federal agencies was high. Political boundarieswere not crossed. The command, control and coordination processes could best be described asad hoc. The decision to evacuate was made by the police chief and there were no problems inthe decision-making process.
CommunicationsAn EOC, including an ICP, was used in this emergency. The Louisiana State Police assumedcommand of the incident, as dictated by state law. Field emergency responders communicatedvia cell phone and pager. No problems were identified with communications.
Notification and WarningIt is unknown how senior local officials were notified of the incident; however, everyone inEunice was aware of the incident and there were no problems with notification of emergencypersonnel or senior local officials. Emergency responders were notified through 91 1 dispatch.The elapsed time between discovery of the incident and mobilization of response personnel wasless than 15 minutes and the decision to evacuate was made in two minutes. The police wentdoor-to-door to notify residents to evacuate. A police/fire PA system was also used. There wereno special problems regarding warning and subsequent citizen action, although some peoplerefused to evacuate and some people were evacuated more than once. The evacuation occurredin three stages, as described in the next paragraph.
According to a state policeman, the evacuation occurred in three stages. In the first stage,approximately 200 people were evacuated within a few blocks of the derailment. The first stageof the evacuation was completed in approximately 45 minutes. The second stage of theevacuation occurred within one hour of the derailment and included approximately 1,500 peoplewithin a 2.6 km (1 mi) radius of the accident. It took over two hours to complete thisevacuation. The final stage of the evacuation involved 2,000 people and was initiated within twohours of the accident. It included residents within a 3.2 km (2 mi) radius from the derailment.
D-67
The final stage of the evacuation was 95% complete by the following day (i.e., 24 hours later).Some people refused to comply with the evacuation order.
Traffic Movement and ControlWhen ordered to evacuate, evacuees were told to go to three specific hotels designated by UnionPacific Railroad. Evacuees were told to use specific routes and police directed traffic. Nospecial institutions were evacuated. Road conditions before the evacuation were dry and nomajor roadways were unavailable for use. No special traffic problems were encountered and notraffic accidents occurred. Since the evacuation was initiated immediately, there was no time forspontaneous evacuations. Reverse-laning likely was not used. Some people refused to evacuate.
Congregate Care CentersCongregate care centers were not used. However, the Union Pacific Railroad put up 550families in hotels, filling up rooms up to 64 km (40 mi) away. The Union Pacific Railroad alsomade arrangements to feed pets that were left behind during the evacuations. There were noshadow evacuations.
Law EnforcementPolice secured the evacuated area and there were no instances of looting or vandalism or anyproblems with law enforcement.
Re-EntryThe police chief, in collaboration with state officials, authorized re-entry. The evacuation orderwas lifted on Thursday afternoon (i.e., five days following derailment) and people outside of a2.6 km (I mi) radius of the derailment were allowed to return to their homes. It was a controlledphased re-entry. No major problems were identified during re-entry. The Union PacificRailroad compensated evacuees for their expenses.
INVESTIGATOR COMMENTS
The timing of the incident, the fact that it happened on a Saturday morning when everyone wasat home, facilitated evacuation of residents. In addition, the quick response of emergencyresponders and the high level of preparedness of the police and other officials made theevacuation work well.
CONTACT INFORMATION AND REFERENCES
Contacts
Eunice Local Police(Personal Communication, May 31, 2000)
D-68
Eunice Fire Chief(Personal Communication, June 29, 2000)
Acting Eunice Fire Chief(Personal Communications, June 20 and 24, 2003)
References
"Cars Explode After Train Derails." Reuters Ltd. May 28, 2000.
"Fire Ignites After Freight Train Derails in Louisiana." Associated Press. May 28, 2000.
Louisiana Office of Emergency Preparedness. "State of Louisiana Emergency Operations PlanSupplement IA." January 2000.<http://www.loep.state.1a.us/Plans/EOPSupplementla.pdf> (June 2003).
Louisiana Office of Emergency Preparedness. "State of Louisiana Emergency Operations PlanSupplement IB." January 2000.<http://www.loep.state.1a.us/Plans/EOPSupplementlb.pdf> (June 2003).
"Train Derails." Associated Press. May 29, 2000.
D-69
Brandon Pipeline Rupture, Florida, May 27, 2003, ID #235
An anhydrous ammonia leak from a ruptured underground pipeline owned by Tampa PipelineCorp. forced the evacuation of more than 2,000 children from an elementary school and middleschool southeast of downtown Tampa. Nearby residents were not evacuated but were advised tostay inside.
COMMUNITY CONTEXT
GeneralBrandon, Florida, is a suburban community with a population of approximately 78,000 people; itcovers an area of 75.9 km2 (29.3 mi2). Approximately 2,000 people, or 2.5%, of the population,were evacuated from a 5.1 km2 (2 mi2) area during this incident. The land use in the area wasmainly for schools and the population density of the area was low. Ethnicity and nationalitywere not important factors in the evacuation; however, age was a factor as most of the evacueeswere schoolchildren.
The community has a county commission form of government, and has a limited economic base,as the town is a bedroom community. Tourism attracts a large number of non-residents, or"snowbirds," to the area. The nearest nuclear power plant is Crystal River, located more than 80km (50 mi) away. Florida has nuclear power plants.
History of EmergenciesThe community is more prone to hazards than average and has had experience with ammonialeaks in the past on a smaller scale. The community also has experienced industrial facilityincidents and hurricanes and has experienced large-scale evacuations in the last 10 years. Thecommunity has not had previous experience with alerting only schools.
Emergencv PreparednessThe community's emergency preparedness activities include planning, training, drills andexercises, and community awareness as described below.
D-70
PlanningThe community had a written emergency plan with an evacuation section that was used in thisemergency. It is unknown if the plan conformed to NUREG-0654/FEMA-REP- 1, Rev. 1, or ifthere was an ETE in the plan.
TrainingThe community provides training to emergency response personnel and regularly conducts jointtraining between industry and government.
Drills and ExercisesThe community's emergency response agencies regularly conduct emergency drills andexercises. The emergency plan used in this evacuation was previously tested in full-scale fieldexercises and in tabletop exercises.
Community AwarenessThe community had a medium level awareness of the local hazards and a high level of awarenessof evacuation procedures. It had a medium level of awareness about hazardous materials ingeneral and no awareness about the alerting methods used in this evacuation.
THREAT CONDITIONS
On May 27, 2003, an underground pipeline owned by Tampa Pipeline Corp. ruptured and leakedanhydrous ammonia. Nearby residents were advised to stay inside, and traffic was detouredaround the leak, which happened on a main thoroughfare near an upscale development ofapproximately 1,200 homes. An elementary school and a middle school in the area requiredevacuation. It was early in the morning at approximately 7 a.m. on a hot day with a light fog inthe area. The roads were dry and clear and no unusual circumstances occurred during this event.
CONSEQUENCES
Approximately 2,000 people within a 5.1 km2 (2 mi2) area were evacuated from two schoolsafter ammonia leaked from a ruptured pipeline. The evacuees were primarily children from thetwo schools. The remaining residents in the area were advised to shelter in place and stay intheir homes. There were no fatalities or injuries from the incident or the evacuation. Theestimated total cost of evacuation-related expenses is unknown.
EMERGENCY RESPONSE
Decision MakingThe level of cooperation between local and state agencies was high, and political boundarieswere not crossed in this event. The command, control, and coordination processes could best bedescribed as pre-planned. The decision to evacuate was made by the Fire Department IncidentCommander, and there were no problems with the decision-making process.
D-71
CommunicationsAn EOC was not used in this event; however, an ICP was established. Communication betweenfield emergency responders and the ICP was primarily by radio and face to face. There were noproblems with communications during the event.
Notification and WarningSenior local officials were notified of the incident by a telephone tree and e-mail. Theemergency responders were notified through a 911 telephone call from the school. There wereno problems with the notification of emergency personnel or senior local officials. The elapsedtime between discovery of the incident and mobilization of response personnel was less than 15minutes, and the initial decision to evacuate was made approximately 30 minutes after thenotification of the incident. It took less than one hour to complete the evacuation.
The two schools were the only facilities evacuated, and they were notified directly by the police.The evacuation took place all at once and there were no problems with warning and subsequentcitizen action. No one refused to evacuate.
Traffic Movement and ControlEvacuees were given instructions on where to go. The schools were the only special institutionsevacuated. Road conditions during the evacuation were dry and no traffic accidents or traffic-related problems occurred during the event. One road in the area was closed, creating amoderate traffic problem. Reverse-laning was not used.
Congregate Care CentersCongregate care centers were established at local schools for this emergency and were managedby the school administration. All of the evacuees, 100%, went to the congregate care centers.There were some shadow evacuations where people left the area because of the odor. Some ofthese people went to a local campground. These shadow evacuations had no impact on thecongregate care centers.
Law EnforcementPolice and the sheriff secured the area following the evacuation and there were no instances oflooting or vandalism or any problems with law enforcement.
Re-EntryRe-entry was authorized by the fire chief and there were no special controls. Evacuees were notcompensated for their expenses. There were no problems reported during re-entry.
D-72
INVESTIGATOR COMMENTS
Preplanning efforts contributed to the success of this evacuation. It was learned thatimprovements could be made in notifying the public officials.
CONTACT INFORMATION AND REFERENCES
Contacts
Hillsborough County Fire RescueSpecial Operations Chief(813) 272-6600(Personal Communication, 8/6/03)
On February 11, 2003, a fire at a farm supply store housing dangerous chemicals prompted theevacuation of about 3,500 people within a 3.2 km (2 mi) radius of the site in Slocomb, Alabama.One school and two senior citizen centers had to be evacuated. The evacuated area was locatedat least 32.2 km (20 mi) from the Joseph M. Farley Nuclear Power Plant located near Dothan,Alabama.
COMMUNITY CONTEXT
GeneralSlocumb, Alabama, is a rural community with a population of around 4,200 people.Approximately 3,500 people, or 83% of the population, were evacuated in the middle of the day.The evacuated area was primarily residential and included a school and two senior citizencenters. Population density was high during the evacuation. The city of Slocumb coversapproximately 23.3 km2 (9 mi2) and the evacuated area was approximately 32.6 km2 (12.6 mi2).Ethnicity, nationality, and age were not important factors in the evacuation.
Slocumb has a mayoral form of government and its main economic base is farming.
The schools in Slocumb attract other people from around the county. Alabama has twocommercial nuclear power plants; one is in the northern part of state, 16.1 km (10 mi) northwestof Decatur, and the other is 29 km (18 mi) southeast of Dothan, or at least 32.2 km (20 mi) fromthe site of this evacuation.
History of EmergenciesSlocumb is no more prone to hazards than the average U.S. city. The community has not hadany experience with the hazard that led to this evacuation nor experienced any evacuations in theprevious 10 years.
D-74
Emergency PreparednessThe community's emergency preparedness activities include planning, training, drills andexercises, and community awareness as described below.
PlanningThe community had a written emergency plan with an evacuation section that was used in thisemergency. The plan did not conform to NUREG-0654/FEMA-REP- 1, Rev. 1, and did notcontain an ETE.
TrainingThe city of Slocumb provides training to its emergency response personnel. However, jointtraining between industry and government is not regularly conducted.
Drills and ExercisesSlocumb's emergency response agencies regularly conduct emergency drills and exercises.However, the emergency plan used in this evacuation had not been previously tested in a full-scale field exercise.
Community AwarenessResidents of Slocumb had a low awareness of local hazards and of the hazard that caused thisevacuation. The community's awareness about evacuation procedures and about the alertingmethods used was average.
THREAT CONDITIONS
A fire at the Mathis Farm Supply in Slocumb, Alabama, at approximately 11:00 a.m. onTuesday, February 11, 2003, prompted the evacuation of about 3,500 people. The Mathis FarmSupply, located a few miles from the Florida line, contained numerous fertilizer products. Theevacuation proceeded with no unusual circumstances. It was sunny but windy that day and theroad conditions were good.
CONSEQUENCES
Approximately 3,500 people were evacuated from Slocumb, Alabama, after the fire broke out atthe Mathis Farm Supply. There were no reported deaths or injuries resulting from the fire or thesubsequent evacuation. Schoolchildren were taken to a high school stadium and an elementaryschool gym, and congregate care centers were opened at two churches. The total estimated costof evacuation-related expenses and property damages was approximately $10,000 to $15,000.
D-75
EMERGENCY RESPONSE
Decision MakingThe level of cooperation among local, state, and federal agencies was very high. No politicalboundaries were crossed during this evacuation. The command, control, and coordinationprocesses could best be described as pre-planned. The decision to evacuate was made by themayor, based on the Hazmat team's assessment of the situation. There were no problems in thedecision-making process.
CommunicationsThere was an ICP but no EOC used in this emergency. Emergency communication was viaradio and communication was a problem because emergency personnel were on different radiofrequencies.
Notification and WarningSenior local officials were notified of the incident by radio and telephone, and emergencyresponders were notified by pager and radio, following report of the incident through the 911emergency system. There were no problems with notification of emergency personnel or seniorlocal officials. Response personnel mobilized to the scene in less than 15 minutes, and thedecision to evacuate was made in 20 minutes. It took one hour to complete the evacuation. Thepublic was notified of the evacuation by sirens and by door-to-door notification. The evacuationwas staged by location. There were no special problems regarding warning and subsequentcitizen action.
Traffic Movement and ControlEvacuees were given specific instructions about where to go when they evacuated and were toldto use specific routes. However, these routes were not specifically marked. Reverse-laning wasnot used. One school and two senior citizen centers were evacuated. Road conditions before theevacuation were dry. Major roadways were available for use, and no special traffic problems oraccidents occurred during the evacuation. No one evacuated before being told to do so and noone refused to evacuate.
Congregate Care CentersCongregate care centers were managed by the Red Cross and by volunteers. Congregate carecenters included a high-school stadium and an elementary school gym, and two congregate carecenters located at churches. The percentage of evacuees that went to congregate care centers isunknown. There were no shadow evacuations.
Law EnforcementPolice secured the evacuated area following the evacuation, and there were no instances oflooting or vandalism or any other problems with law enforcement.
D-76
Re-EntrvRe-entry was authorized by Slocumb's mayor and there were no special controls during the re-entry process. Evacuees were not compensated for their expenses. There were no majorproblems during re-entry.
INVESTIGATOR COMMENTS
According to the Slocumb fire chief, the coordination among agencies contributed to the successof the evacuation. In addition, one of the lessons learned is that it is difficult to get informationon chemical mixtures (referring here to the hazmat response and not to the evacuation).
CONTACT INFORMATION AND REFERENCES
Contacts
Slocumb Fire Chief(334) 684-2257(Personal Communication, 7/7/03)
ReferencesChemical Incidents Report Center. "Fire at Farm Supply Store." February 11, 2003.<www.chemsafety.gov/circ/post.cfm> (April 9,2003).
D-77
Choctaw Maid Farm Poultry Plant, Forest, Mississippi, March 20, 2001, ID #4
On March 20, 2001, a fire started in a poultry processing plant in Forest, Mississippi.Approximately 2,000 people were evacuated from the town. The evacuation occurred in thedownwind direction from the plant and included schools, businesses, residences, and the ScottCounty Jail covering an area of approximately 7.8 km2 (3 mi2). Three people were hospitalizedfrom the event; no injuries were reported from the evacuation. During the course of the event arainstorm moved in lowering the temperature and increasing winds.
COMMUNITY CONTEXT
GeneralThe city of Forest, Mississippi, is a small urban community with a mayoral form of government.It has a population of approximately 5,900 people and covers an area of 33.7 km2 (13 mi2). Itsmain economic base is manufacturing and industry. On March 20, 2001, approximately 2,000people were evacuated after a fire started in the Choctaw Maid Farm poultry plant.
The area was not congested at the time of the evacuation. According to the Forest fire chief,approximately 25% of the community was evacuated. The evacuation area was primarilyindustrial, commercial and residential. Ethnicity, nationality, and age were not important factorsin the evacuation. The city is located more than 80 km (50 mi) from the nearest commercialnuclear power plant, the Grand Gulf Reactor.
History of EmergenciesThe area is prone to similar hazards but this is the largest event in at least 15 years. Thecommunity had prior experience with the hazard that led to this evacuation, including anammonia explosion at a poultry plant the previous year. As a result, the fire department wasmore prepared for this event. The Forest fire chief stated that this was the largest evacuation inthe 15 years he had been in Forest. There have been a number of smaller evacuations in thecommunity in the previous years and the same means of alerting people was used for thisevacuation, including using the telephone for the schools and patrolmen going door to door tonotify businesses and residences.
D-78
Emergency PreparednessThe community's emergency preparedness activities include planning, training, drills andexercises, and community awareness as described below.
PlanningForest had a written emergency plan that contained an evacuation section. However, the planwas under revision at the time. The plan conformed to federal guidelines and was used in thisemergency. The plan probably did not conform to NUREG-0654/FEMA-REP-1, Rev. 1, as itdid not contain ETEs and routing information was based on town quadrants rather than thehazard or wind direction. The Forest fire department does use ETEs for evacuating schools. TheETE for the schools is 15 minutes and the schools were evacuated within the ETE.
According to the Forest chief of police, prior planning for evacuations was a major contributor tothe success of this evacuation.
TrainingTraining is provided to emergency response personnel, and joint training between industry andgovernment is conducted.
Drills and ExercisesThe Forest Fire Department regularly conducts emergency drills and exercises with the schools.The Fire Department and Police Department conduct planning sessions and tabletop drills forevacuations.
Community AwarenessThe community's level of awareness about local hazards was high. The community's level ofawareness about the hazard that caused the evacuation and the alerting methods used was alsohigh, although the size of the evacuation for this event was significantly larger than that of anyprevious evacuations.
THREAT CONDITIONS
The hazard that led to this evacuation was a fire at the Choctaw Maid Farm poultry plant. Theincident occurred on a lightly overcast morning. However, during the course of the event, arainstorm moved in lowering the temperature and increasing the wind speed. The evacuationwas slightly hampered by the direction of the wind. The evacuation plan had segmented thetown into quadrants and evacuation routes were based on the quadrants. However, the winddirection dictated the direction of evacuation traffic.
D-79
CONSEQUENCES
On the morning of March 20, 2001, a fire started at the Choctaw Maid Farm poultry plant, and a911 emergency call was placed from the plant to the local Fire Department. The FireDepartment was on scene within ten minutes. Evacuation of the plant was initiated before thearrival of the Fire Department. Evacuation of the Tyson plant across the street and of thedownwind population was initiated immediately upon arrival of the Fire Department. Therewere three reported injuries and no fatalities associated with the incident. There were no injuriesassociated with the evacuation. Approximately 2,000 people were evacuated. The estimatedtotal cost of the evacuation to the public was minimal.
EMERGENCY RESPONSE
Decision MakingThe level of cooperation among local, state, and federal agencies was high. No politicalboundaries were crossed. The command, control and coordination processes could best bedescribed as pre-planned. The Forest Fire Chief made the decision to evacuate jointly with thechief of police as they established command and control at the scene. There were no problemswith the decision-making process.
CommunicationsAn EOC was not used during this emergency but an ICP was used. Field emergency responderscommunicated via radio. According to the Forest Fire Chief, the greatest problem encounteredin this event was with the radios and the overload of available frequencies. The emergencyresponse team has four radio frequencies and all were inundated with communication during theevent. The ICP made a field decision to limit select teams and individuals to designatedfrequencies to improve the communications. This resolved the problem, but did create veryslight delays in communication when teams on one frequency needed to communicate withteams on another frequency. The local radio and cable television stations broadcastedemergency information, including traffic routes, and kept the public informed of the changingevents.
Notification and WarningSenior local officials and emergency responders were notified of the incident by phone. Therewere no problems with notification of emergency personnel or senior local officials. Emergencyresponse personnel mobilized immediately. The decision to evacuate was made in less than 10minutes and took approximately 45 minutes to complete. The public was notified to evacuate bypolice who went door to door and informed residents of the evacuation, where to go, and whatdirection to proceed. Schools were notified by telephone. The evacuation took place all at once,and there were no special problems regarding warning and subsequent citizen action. Therewere a few businesses that were missed during the evacuation, and a few residents refused toevacuate; however, these were minor and did not impact the evacuation or result in injury.
D-80
Traffic Movement and ControlEvacuees were given specific instructions from the patrol officers conducting the evacuationabout where to go when they evacuated and were told to use specific routes that were designatedby policemen directing traffic. The school and the Scott County Jail were evacuated and theseevacuations went very well. Highway 80 is the major roadway through town and passes directlyby the plant. This required that Highway 80 be shut down and traffic be re-routed on local sideroads. There were no problems with re-routing the traffic, as the local roads were very adequatefor the volume and size of the vehicles. There were no reported traffic accidents during theevacuation. No one evacuated before being told to do so, and very few individuals refused toevacuate.
Congregate Care CentersCongregate care centers were not used in this event. There were no shadow evacuations.
Law EnforcementThe evacuated area was secured by the police, and there were no instances of looting orvandalism. No problems were identified with law enforcement.
Re-EntryThe Forest Fire Chief lifted the evacuation order after approximately five hours and there wereno special controls in place during re-entry. Evacuees were not compensated for their expenses.There were no problems associated with re-entry.
INVESTIGATOR COMMENTS
As a result of this event and lessons learned, the Forest Fire Department has reevaluated itsevacuation procedures and now organizes the evacuation based on wind direction. In addition,the city has installed sirens and educated the public on what to do if a siren is activated.
CONTACT INFORMATION AND REFERENCES
Contacts
Fire ChiefForest Fire Department(601) 469-1221(Personal Communication, July 2003)
Chief of PoliceForest Police Department(601) 469-4141(Personal Communication, July 2003)
D-81
References
"How do you like your chicken?"Associated Press. March 21, 2001.<http://tspwebO2.tsp.utexas.edu/webarchive/03-2 1-01/> (June 2003).
D-82
Truck Accident, Hugo, Oklahoma, August 18, 2000, ID #27
On August 18, 2000, a military truck carrying rockets flipped over on a highway ramp andspilled its load in Hugo, Oklahoma. Between 2,000 and 2,500 people within a 2.6 km2 (1 mi2)radius of the site were evacuated as a precaution even though the Oklahoma National Guard saidthe rockets were in no danger of exploding. Two National Guardsmen were injured in theincident, but there were no deaths or injuries during the subsequent evacuation.
COMMUNITY CONTEXT
GeneralHugo is a suburban community with a population of 5,536 people. Between 2,000 and 2,500, or36 to 45% of the city's population, were evacuated on August 18, 2000. The city of Hugocovers an area of 14.4 km2 (5.6 mi2) and the evacuated area covered an area of 8.1 km2 (3.14mi2). The population density was medium during the evacuation. Land use in the evacuatedarea was residential and commercial. Ethnicity, nationality, and age were not important factorsin the evacuation.
The community is run by a city manager; its main economic base is farming. However, LakeHugo attracts a large number of non-residents. The nearest nuclear power plant is more than80 km (50 mi) away and the state of Oklahoma does not have any commercial nuclear powerplants.
History of EmergenciesThe community is no more prone to hazards than average and had no prior experience with thehazard that led to this evacuation. Hugo has experienced no evacuations in the past ten years.However, the community did have previous experience with the alerting mechanism used in thisevacuation.
Emergency PreparednessThe community's emergency preparedness activities include planning, training, drills andexercises, and community awareness as described below.
D-83
PlanningThe community had a written emergency plan that included an evacuation section that was usedin this emergency. It is unknown whether the plan conformed to NUREG-0654/FEMA-REP-1,Rev. 1, or whether it contained an ETE.
TrainingThe community provides training to emergency response-personnel and regularly conducts jointtraining between industry and government.
Drills and ExercisesThe community's emergency response agencies regularly conduct emergency drills andexercises but the emergency plan used in this evacuation was not previously tested in a full-scaleevacuation.
Community AwarenessThe community had an average level of awareness about local hazards and about evacuationprocedures. The community also had an average level of awareness about the hazard that causedthis evacuation and about the alerting methods used in this evacuation.
THREAT CONDITIONS
The threat condition leading to this evacuation was a truck accident that resulted in a load ofmilitary rockets spilling onto a highway ramp. Between 2,000 and 2,500 people were evacuated.The roads were dry and no unusual circumstances occurred during the incident.
CONSEQUENCES
Between 2,000 and 2,500 residents were evacuated. Two National Guardsmen were injured inthe accident and there were no deaths or injuries in the subsequent evacuation. The estimatedtotal cost of evacuation-related expenses is unknown.
EMERGENCY RESPONSE
Decision MakingThe level of cooperation between local, state, and federal agencies was high. Politicalboundaries were not crossed. The command, control and coordination processes could best bedescribed as ad hoc. The decision to evacuate was made by the Hugo Fire Chief and there wereno problems with the decision-making process.
D-84
CommunicationsAn EOC was not used; however, an ICP was used and communication between field emergencyresponders and the ICP was by radio and cell phone. There were no problems withcommunication.
Notification and WarningIt is unknown how senior local officials were notified of the incident. Emergency responderswere notified through the 911 phone system. There were no problems with notification ofemergency personnel. The elapsed time between the truck accident and mobilization of responsepersonnel was less than fifteen minutes and the decision to evacuate was made approximatelythirty minutes after the accident. It took approximately two hours to complete the evacuation.The public was notified by radio and television broadcasts and by emergency responders goingdoor-to-door. The evacuation took place all at once. There were no special problems withwarning and subsequent citizen action.
Traffic Movement and ControlEvacuees were given specific instructions about where to go when they were notified to evacuateand they were told to use specific routes, which were designated by police roadblocks. Fivespecial institutions were evacuated, including one school, two day care centers and two housingprojects. Road conditions before the evacuation were dry and there were no traffic accidents, notraffic problems, and major roadways were available to evacuees. Reverse - laning was not used.No one evacuated before being told to do so and no one refused to evacuate.
Congregate Care CentersCongregate care centers managed by Civil Defense were used. Congregate care centersconsisted of schools and churches. It is unknown what percentage of evacuees went to thecongregate care centers. There were no shadow evacuations.
Law EnforcementHugo Police secured the area following the evacuation and there were no instances of looting orvandalism or any problems with law enforcement.
Re-EntryThe Hugo fire chief authorized re-entry and there were no special controls during re-entry.Evacuees were not compensated for their expenses. There were no problems during re-entry.
INVESTIGATOR COMMENTS
According to the Hugo first assistant fire chief, the evacuation was successful due topreparedness and agency coordination. There were no problems encountered during theevacuation.
D-85
CONTACT INFORMATION AND REFERENCES
ContactHugo Fire DepartmentFirst Assistant Fire Chief(580) 326-7106(Personal Communication, 7/14/03)
On July 22, 1999, at about 10:00 a.m., a corrosive chemical known as chlorosulfonic acid spilledwhile being loaded at a Proctor & Gamble Factory that makes shampoo and toothpaste located inIowa City, Iowa. The spilled acid formed a vaporous cloud that began drifting on the wind. Asa result, 5,000 residents were evacuated and two police officers were treated at a hospital andreleased. There were no deaths or injuries associated with the evacuation.
COMMUNITY CONTEXT
GeneralApproximately 5,000 people on the southeast side of Iowa City, population 62,380, wereevacuated (approximately 8% of the city's total population). Iowa City covers an area of 63.3km2 (24.4 mi2), and the evacuated area was 2.6 km2 (1 mi2). The population density was mediumduring the evacuation. Land use in the evacuated area was residential and commercial. Age wasan important factor in the evacuation since a large percentage of evacuees were children andspecial-needs population.
The community has a mayoral form of government and its main economic base is education (i.e.,the University of Iowa). The University of Iowa attracts a large number of non-residents. Thenearest nuclear power plant is the Duanne Arnold Nuclear Power Plant located 13 km (8 mi)northwest of Cedar Rapids and approximately 32 km (20 mi) north of Iowa City.
History of EmergenciesThe community is more prone to natural disasters than average but not to technological hazards.Iowa City has experienced evacuations in the past 10 years resulting from tornadoes, floods, andstorms. However, the community had no previous experience with the hazard that led to thisevacuation. The community did have previous experience with the alerting mechanism used inthis evacuation.
D-87
Emergencv PreparednessThe community's emergency preparedness activities include planning, training, drills andexercises, and community awareness as described below.
PlanningThe community had a written emergency plan, which was used in this emergency. However, itis unknown whether the plan had an evacuation section or if it conformed to NUREG-0654/FEMA-REP-1, Rev. 1.
TrainingThe community provides training to emergency response personnel and regularly conducts jointtraining between industry and government.
Drills and ExercisesThe community's emergency response agencies regularly conduct emergency drills andexercises but the emergency plan used in this evacuation was not previously tested in a full-scaleevacuation.
Community AwarenessThe community has an average level of awareness about local hazards and evacuationprocedures. However, awareness about the hazard that caused this evacuation (i.e., thechlorosulfonic acid spill) was low. The community had an average level of awareness about thealerting methods used in this evacuation.
THREAT CONDITIONS
The threat condition leading to this evacuation was a spill of chlorosulfonic acid atapproximately 10 a.m. on July 22, 1999. The spill formed a vaporous cloud that began driftingwith the wind. As a result, 5,000 residents were evacuated and two police officers were treatedat a hospital and released. The roads were dry and clear and there were no unusualcircumstances that occurred during the incident.
CONSEQUENCES
Approximately 5,000 residents were evacuated and two police officers were treated at a hospitaland released. There were no deaths, but two injuries were associated with the incident; no deathsor injuries were associated with the evacuation. The estimated total cost of evacuation-relatedexpenses is unknown.
D-88
EMERGENCY RESPONSE
Decision MakingThe level of cooperation among local, state, and federal agencies was high. Political boundarieswere not crossed. The command, control and coordination processes could best be described aspre-planned. The decision to evacuate was made jointly by the Iowa City fire and police chiefs,and there were no problems with the decision-making process.
CommunicationsAn EOC was not used; however, an ICP was used and communication between field emergencyresponders and the ICP was by radio. There were no problems with this form of communication.
Notification and WarningSenior local officials were notified of the incident by cell phone, and emergency responders werenotified through the 911 phone system. There were no problems with notification of emergencypersonnel or senior local officials. The elapsed time between discovery of the incident andmobilization of response personnel was less than 15 minutes and the decision to evacuate wasmade approximately 45 minutes after discovery of the spill. It took approximately one hour tocomplete the evacuation. The public was notified by emergency responders going door to door.The evacuation was staged, section by section. The method of disseminating evacuationinformation to the residents was not totally effective and could have been better.
Traffic Movement and ControlEvacuees were given specific instructions about where to go but were not told to use specificroutes; they were told which direction to go. Three special institutions were evacuated,including two day care centers and a handicapped facility. Road conditions before theevacuation were dry and there were no traffic accidents or traffic problems; major roadwayswere available to evacuees. Reverse-laning was not used. No one evacuated before being told todo so and no one refused to evacuate.
Congregate Care CentersCongregate care centers were not used and there were no shadow evacuations.
Law EnforcementIowa City police secured the area following the evacuation and there were no instances oflooting or vandalism or any problems with law enforcement.
Re-EntryThe Iowa city fire and police chiefs and an industry representative jointly authorized re-entry.There were no special controls during re-entry. Evacuees were not compensated for theirexpenses. No problems occurred during re-entry.
D-89
INVESTIGATOR COMMENTS
According to the Iowa City fire chief, the evacuation was successful because communicationbetween industry and public safety personnel was effective. However, the lack of a formalevacuation system contributed to the evacuation's problems and was a lesson learned during thisevacuation (i.e., that a formal evacuation system is needed).
CONTACT INFORMATION AND REFERENCES
Contact
Iowa City Fire Chief(319) 356-5256(Personal Communication, 7/14/03)
References
"5,000 Evacuated in Iowa due to Spill." Associated Press. July 22, 1999.
D-90
Cargill Chemical Plant, Maysville, Kentucky, January 4, 1998, ID #166
On January 4, 1998, approximately 2,500 people were evacuated because of a fire at the Cargill,Inc. Chemical Plant in Maysville, Kentucky. Communities were evacuated on both sides of theOhio River, including Maysville, Kentucky, and Adams and Brown counties in Ohio. TheCargill Plant contained stockpiles of herbicides, pesticides, and 380 metric tons (420 tons) ofammonium nitrate, and residents were evacuated because of the potential for a large explosion.Authorities decided to let the fire burn out rather than fight it with water and risk washing toxicchemicals into the Ohio River, which is only 274 m (300 yd) away. No deaths or injuries wereassociated with the evacuation, and there was one injury associated with the fire but no deaths.
COMMUNITY CONTEXT
GeneralApproximately 2,500 people were evacuated from several residential (suburban) communities,including Maysville, Kentucky, and Adams and Brown counties across the Ohio River in Ohio.The evacuated area covered a 2.6 km (I mile) radius or 8.1 km2 (3.14 mi2). The populationdensity during the evacuation was medium. Ethnicity, nationality, and age were not importantfactors in the evacuation.
The region's main economic base is derived from both tourism and manufacturing. Tourismattracts a large number of non-residents. There are no commercial nuclear power plants within80 km (50 mi) of the evacuated area, and there are no commercial power plants in Kentucky.However, Ohio has two commercial nuclear power plants.
History of EmergenciesBecause of its manufacturing and industry, the area may be slightly more prone to technologicalhazards than the average U. S. city. The community had no prior experience with the hazard thatled to this evacuation and no evacuations in the previous ten years, although residents hadprevious experience with the alerting mechanism used in this evacuation.
D-91
-
Emergencv PreparednessThe community's emergency preparedness activities include planning, training, drills andexercises, and community awareness as described below.
PlanningMason County has a written emergency plan with an evacuation section that was used in thisemergency. The plan conformed to NUREG-0654/FEMA-REP-l, Rev. 1, except it did notcontain an ETE.
TrainingTraining is provided to emergency response personnel, and joint training is regularly conductedwith industry and government.
Drills and ExercisesEmergency response agencies regularly conduct emergency drills and exercises; however, it isunknown whether or not the emergency plan used in this evacuation was previously tested in afull-scale field exercise.
Community AwarenessThe level of community awareness of local hazards was average (medium). Awareness aboutevacuation procedures is low; but the community had a high level of awareness concerning thehazard that caused this evacuation. The residents were moderately familiar with the alertingmethods used.
THREAT CONDITIONS
The threat condition leading to the evacuation was the burning of hazardous chemicals and thepossibility of a large explosion. Around 2:30 a.m. on January 4, 1998, a Maysville police officerspotted the fire at the Cargill Chemical Plant. The plant contained stockpiles of herbicides,pesticides, and 380 metric tons (420 tons) of ammonium nitrate. The initial Maysville PoliceDepartment officers on the scene notified the Mason County Disaster and Emergency Services.By 3:05 a.m., 50 firefighters from nine Mason County area fire departments and two ambulanceservices arrived on the scene. Shortly thereafter, it was decided to pull back the emergencyresponse personnel and let the fire bum itself down. The defensive stance was made because ofthe volatile nature of the chemicals involved and the risk of contamination given the proximityof the warehouse to the Ohio River. Road conditions and weather conditions during theevacuation are unknown. No unusual circumstances occurred during this incident other than thehazard itself.
D-92
CONSEQUENCES
As the fire at the Cargill Plant grew, approximately 2,500 people, or more than 27% of thepopulation, were evacuated. There were no deaths or injuries related to the evacuation itself.There were no deaths directly related to the fire, but a firefighter did suffer a minor injury. Theestimated cost to the public of the evacuation itself is unknown.
EMERGENCY RESPONSE
Decision MakingThe level of cooperation among local, state, and federal agencies was high and politicalboundaries were crossed. Several communities were evacuated, including those in Adams andBrown counties, Ohio, which are across the Ohio River from the plant. The command, controland coordination processes could best be described as pre-planned. The decision to evacuatewas made by the Incident Commander who was the Kentucky State Fire Marshal. There wereno problems with the decision-making process.
CommunicationsThe Ohio EOC was activated, and an ICP was used. Communication between the fieldemergency responders and the EOC was by radio, and there were no problems withcommunication.
Notification and WarningSenior local officials were notified of the incident by telephone. Local police saw the fire andnotified emergency responders. There were no problems with notification of local officials oremergency personnel. The elapsed time between discovery of the incident and mobilization ofresponse personnel was less than 15 minutes. The decision to evacuate was made in less than 15minutes. It is unknown how long it took to complete the evacuation. The public was notified byradio and television broadcasts, police/fire PA system, and by emergency personnel going doorto door to notify residents. The evacuation occurred all at once and there were no specialproblems with warning and subsequent citizen action.
Traffic Movement and ControlEvacuees were given specific instructions about where to go when they evacuated but were nottold to use specific routes. One special institution (a senior citizen apartment building) wasevacuated. Road conditions before the evacuation are unknown. No major roadways wereunavailable for use and there were no special traffic problems. Some people spontaneouslyevacuated after seeing the fire. Reverse-laning was not used. There were no traffic accidentsduring the evacuations. It is unknown whether anyone refused to evacuate.
Congregate Care CentersCongregate care centers were set up at local high schools in both Maysville, Kentucky, andAdams and Brown counties in Ohio and were managed by the Red Cross. A total of 437 people
D-93
or 17.5% of the evacuees went to the congregate care centers. There were shadow evacuationsbut this did not impact traffic or congregate care center capacity.
Law EnforcementThe evacuated area was secured by the police; there were no instances of looting or vandalismand no problems with law enforcement.
Re-EntryThe Kentucky State Fire Marshall authorized re-entry at 6:00 p.m. on January 4, 1998,approximately 15 hours after the start of the incident. No special controls were employed. It isunknown whether evacuees were compensated for their expenses. No major problems occurredduring re-entry.
INVESTIGATOR COMMENTS
According to Maysville fire chief, the evacuation worked well because of the high level ofcooperation between agencies and the emergency plan worked well.
The fact that the incident and the evacuation took place in the middle of the night created a slightproblem.
CONTACT INFORMATION AND REFERENCES
Contact
Maysville Fire Chief(606) 564-9411
References
CNN (U.S.), "Chemical Fire Forces Evacuations Along Ohio River." January 1998.<http://www.cnn.com/US/9801/04/plant.fire/> (June 2003).
Leonard, James. "Explosions, Fire at Fertilizer Plant Force Early Morning Evacuation."Dispatch, Volume VIII, No. 1. Fall 1998. <http://www.efilmgroup.com/dispatch/disviii4.html>(June 2003).
"Thousands Evacuated in Kentucky Fertilizer Plant Fire."Associated Press. January 5, 1998.
D-95
Cerro Grande Fire, Los Alamos, New Mexico, May 10, 2000, ID #107
The Cerro Grande Fire, which began on May 4, 2000, was the largest, most destructive wildfirethat New Mexico has ever known. Originally started as a prescribed bum in Bandelier NationalMonument, the wildfire ultimately burned 190 km2 (47,000 acres) and caused the evacuation ofthousands of people in Los Alamos County. As a result, a total of 12,000 people were evacuatedfrom the town of Los Alamos on May 7 and May 10, and another 7,000 people were evacuatedfrom the unincorporated community of White Rock on May 11 (see also ID #209). Hamperingthe evacuation effort was the fact that Los Alamos sits on a hill with only one main road out ofthe town. However, the evacuation proceeded smoothly and was accomplished twice as fast aspredicted although this is mostly attributed to the fact that Los Alamos National Laboratories(LANL) and the public schools were all closed. If these institutions had all been open, theevacuation may have taken as long as 24 hours to complete (or twice as long as predicted). Onespecial institution (the Los Alamos Medical Center) was evacuated. The evacuation of LosAlamos proceeded smoothly; however, several changes were made to the County EmergencyManagement Plan as a result of lessons learned.
COMMUNITY CONTEXT
GeneralOn May 7, 2000, approximately 500 residences (-1,000 people) in Los Alamos were ordered toevacuate as wildfires neared their community. On May 10, 2000, the remaining population ofLos Alamos was ordered to evacuate and there was generally good compliance with theevacuation order. A total of 12,000 residents (the total population) of Los Alamos wereevacuated.
Los Alamos is generally a suburban area with small shopping centers and LANL. The size ofthe community and of the evacuated area is 28.1 km2 (10.9 mi2 ). The population density duringthe evacuation was low because LANL and the schools were closed. Los Alamos is a town runby seven county councilors. Its main economic base is LANL. There are no specialcharacteristics that attract a large number of non-residents. There are no commercial nuclearpower plants located within 80 km (50 mi) of Los Alamos and there are no commercial nuclearpower plants in New Mexico.
D-96
History of EmergenciesLos Alamos is no more prone to technological hazards than the average community, although itis slightly more prone to natural disasters, specifically wildfires. Los Alamos County has hadsignificant experience with the hazard that led to this evacuation, including a large fire in 1954,La Mesa Fire (1977), Dome Fire (1996), Lummis Fire (1997), Oso Fire (1998), and Guaje Fire(2000). However, the town of Los Alamos had not experienced any evacuations in theprevious 10 years and most likely had no prior experience with the alerting mechanism used inthis evacuation, which was a reverse 91 1 telephone system.
Emergenca PreparednessThe community's emergency preparedness activities include planning, training, drills andexercises, and community awareness as described below.
PlanningThe community had a written emergency plan, which contained an evacuation section and it wasused in this emergency. The Los Alamos County Emergency Management Plan generallyconformed to NUREG-0654/FEMA-REP- 1, Rev. 1, except that it did not contain an ETE.However, authorities estimated that it would take 12 hours to evacuate Los Alamos and theevacuation was accomplished in half that time.
TrainingTraining is provided to emergency response personnel, and joint training is regularly conductedwith LANL.
Drills and ExercisesLos Alamos County's emergency response agencies regularly conduct emergency drills andexercises and the emergency plan used in this evacuation was previously tested in a full-scalefield exercise. The exercise performed immediately before this evacuation was most likely afunctional drill.
Community AwarenessThe local community is highly aware of local hazards, especially of the hazard (i.e., wildfire)that caused this evacuation. However, the community's awareness about evacuation proceduresand about the alerting method used in this evacuation was likely no higher than that of theaverage community.
THREAT CONDITIONS
The Cerro Grande Fire began as a prescribed bum on May 4, 2000, and quickly spread out ofcontrol. A total of 12,000 people were evacuated from Los Alamos. The evacuations occurredduring the daytime. The weather was hot and dry and the roads were dry. The Los Alamosevacuation involved two unusual circumstances. First, a special institution (i.e., the Los Alamos
D-97
Medical Center) had to be evacuated. Second, Los Alamos sits on a hill with only one main roadout of the town.
CONSEQUENCES
As the uncontrolled wildfire approached Los Alamos, the entire town was evacuated. First,approximately 1,000 people were evacuated on May 7 and another 11,000 were evacuated onMay 10 for a total of 12,000 evacuees. There were no reported deaths or injuries due to eitherthe wildfire or the evacuation although a few firefighters suffered minor injuries. The estimatedcost to the public of the evacuation itself, and not of any damages associated with the wildfire, isseveral million dollars. Federal disaster aid was made available to families who had lost homes;however, there was no reimbursement for evacuation expenses since food and shelter wasprovided to those who chose to go to the congregate care centers.
EMERGENCY RESPONSE
Decision MakingThe level of cooperation among local, state, and federal agencies was very high. Some of thelocal, state and federal agencies involved in this emergency include the U. S. Forest Service,National Park Service, Federal Emergency Management Agency, Los Alamos County, SantaClara Pueblo and San Ildefonso Pueblo, state and local police, New Mexico National Guard, andfirefighters and emergency personnel from all over the country. Political boundaries were notcrossed. The command, control and coordination processes could best be described as pre-planned. The decision to evacuate was made by the Los Alamos Police Chief although otherauthorities influenced his decision. No problems were identified with the decision-makingprocess even though there was no legal authority to order an evacuation.
CommunicationsTwo EOCs were used during this evacuation, one maintained by LANL and the other maintainedby Los Alamos County. This was confusing and did not work well. As a result, the CountyEmergency Management Plan has been re-written to have a Joint LANL/Los Alamos CountyEOC in future emergencies. Field emergency responders communicated with the EOC by cellphone/pagers and radios. However, the radios did not work well because Los Alamos County'svarious radio systems were designed for routine minimal operational demands. Interoperabilitywithin Los Alamos County and with out-of-town supporting services was a problem. Therefore,most of the communications took place using cell phones/pagers. Amateur harn radio operatorswere very effective in getting and passing on information.
Notification and WarningSenior local officials were notified of the incident by telephone, the Community Alert NetworkSystem (CANS), which is a reverse 91 1 system that calls all of the numbers in its database andalerts the recipients of the hazard, the evacuation, and appropriate emergency procedures theyshould follow. Emergency responders were notified of the incident by cell phones and pagers
D-98
and personnel utilized phone trees to make sure all responders were notified. Because of thenature of this particular incident and the somewhat remote location, response personnel were notmobilized to the scene until over an hour after the start of the incident. A partial (and smaller)evacuation occurred three days following the start of the prescribed burn; however, the mainevacuation took place five days from the start of the prescribed bum. The time to complete themain evacuation was four to six hours. There were no problems identified with the notificationof emergency personnel or senior local officials. The public was notified by the CANS systemdescribed above.
The evacuation was staged; the first stage on May 7 involved approximately 1,000 people andthe second stage (the main evacuation) involved 1 1,000 people. The CANS system was slowand it was later discovered to have an outdated database of telephone numbers. Therefore, it wasnot as effective in notifying the public as it could have been. It has since been replaced with theEmergency Preparedness Notification System, another reverse 911 system, which is operated byQwest Communications.
Traffic Movement and ControlEvacuees were given specific instructions about where to go when they evacuated and were toldto use three main routes that were designated with police barricades. The Los Alamos Policeand the New Mexico National Guard manned roadblocks and assisted in the evacuation. Thefinal route out of town is the one main road that goes down the hill out of Los Alamos. Reverse-laning was used. One special institution (the Los Alamos Medical Center) was evacuated earlyas a precaution. Road conditions before the evacuation were dry. No major roadways wereunavailable for use due to construction or due to damage caused by the hazard, and there were nospecial traffic problems and no traffic accidents. In fact, the main evacuation on May 10proceeded twice as fast as predicted. There were some instances of residents evacuating earlyafter they saw the smoke in town. Some residents refused to evacuate and officials did not havethe legal authority to force them to evacuate. The residents who stayed watered the areassurrounding their homes and their neighbors' homes to prevent them from burning.
Congregate Care CentersCongregate care centers were used and were managed by local Red Cross personnel. A pre-planned congregate care center was set up at the White Rock Baptist Church; however, whenWhite Rock was ordered evacuated the following day (May I1), new congregate care centerswere opened at the Pojoaque High School, Santa Fe High School, and the Cities of Gold Casinoin Pojoaque. Other congregate care centers were reportedly available in Glorieta and at thePojoaque Gym. Most evacuees came to the congregate care centers for information and meals,but few clients needed sleeping facilities. Less than 10% of evacuees stayed at the congregatecare centers. The vast majority of evacuees stayed with friends and relatives, in hotels, or intheir own personal recreational vehicles. There were no shadow evacuations.
D-99
Law EnforcementThe Los Alamos Police Department, augmented by the Air National Guard Security Police andmutual aid departments, maintained intensive security patrols in burned and evacuated areas.There were no reported instances of looting or vandalism and no problems identified with lawenforcement.
Re-EntryOn May 16, 2000, Los Alamos reopened except for the area west and north of Diamond Drive.The town had water and electricity but large areas did not have natural gas. Re-entry wasauthorized by the Los Alamos Emergency Manager and was accomplished with the assistance ofthe Los Alamos Police Department. The re-entry process was a controlled, phased re-entrybecause so many homes had been destroyed by the wildfire. Federal disaster aid was madeavailable to families who had lost homes; however, there was no reimbursement for evacuationexpenses since food and shelter was provided to those who chose to go to the congregate carecenters.
INVESTIGATOR COMMENTS
The county's pre-incident planning was adequate but understandably did not anticipate themagnitude of a Cerro Grande-type incident.
As summarized from "The Cerro Grande Fire of 2000: Summary of Matters to be Considered bythe Los Alamos County Council, December 16, 2002," relevant lessons learned include:
1. The operation of two EOCs did not work well and the County Emergency Management Planhas been rewritten to have a Joint LANL/County EOC. The revised plan was approved byCouncil in June 2001.
2. The automated telephone citizen notification system used, the Community Alert NetworkSystem (CANS), was not as effective as desired. CANS has been replaced with theEmergency Preparedness Notification System, operated by Qwest, and appears to be a bettersystem.
3. Animal control, specifically care of pets when the town was evacuated, became a majorissue. Tentative mutual aid agreements, prompted by the State Department of Agriculture,have been discussed by County Animal Control personnel and Santa Fe City and County.
4. Tracking and registering evacuees proved to be a big problem. Evacuees should beencouraged to register via internet on the County website or by telephone with a designatedCounty office. The website should be configured to accept a large number of registrants, andto receive additional input from telephoned messages.
5. Donated food, clothing, services, and material exceeded needs and was uncontrolled.
D-100
6. The American Red Cross national response personnel were very difficult to work with anddeclined to coordinate any of their activities with the County. Local Red Cross personnelinitially provided their usual good services, but were completely ignored by the nationallevel team.
7. The County's various radio systems were designed for routine minimal operational demands.Interoperability within the County and with out-of-town supporting services was andcontinues to be a problem.
8. The Public Information Telephone Center was one of the most effective steps taken duringthe entire operation. Fifty phone lines were placed in operation within a matter of hours, andhandled over 7,000 calls in the first day.
9. Emergency Management "news bulletins" proved to be a very effective means of gettingtimely updates to County officials, the media, and the public. These announcementsaddressed fire and law enforcement/security operations, status of utilities and other services,road closings and openings, volunteer operations, and store openings.
10. The County Joint Service Center was conceived to be the center for recovery operations byreturning residents. All agencies were housed in one building to provide a "one-stop"service under management by the County. The operation was well received by residents.
11. The American Red Cross, and to a lesser extent, FEMA, were reluctant to be housed withany other agencies or with each other. Only strong direction by a county manager kept theRed Cross functioning as part of the Joint Service Center.
12. The decision to bring in managers from the city of Oakland (California), which hadexperienced a major conflagration in the recent past, was a good one. Their list of actionstaken and advice was invaluable in ensuring all that should be done was done.
13. A major lesson learned was how to transition from emergency to recovery operations. Thiswas accomplished by creating the Recovery Planning Group, which operated under thedirection of the Emergency Manager. It was composed of department manager-levelpersonnel, and met daily, usually for several hours. Its charter was to consider all problemsfrom the residents' perspective. Second-level personnel continued staffing the EOC duringthe period the two groups overlapped.
14. County management was instrumental in getting the "Cerro Grande Fire Assistance Act"through Congress. This was a much needed piece of legislation that provided both short- andlong-range relief to the county and its citizens.
Baker, D. "Northern N. M. Fire Burns Thousands of Acres, Forces Evacuations." AssociatedPress. May 31, 2000.
Los Alamos Community Pages. "Wildfire!" 2001.<http://www.losalamos.org/laarc/CerroGrandeFire-K5QIN.html> (June 2003).
D-102
Los Alamos County. "The Cerro Grande Fire of 2000: Summary of Matters to be Considered bythe Los Alamos County Council." December 16, 2002.<http://www.lac-nm.us/vertical/Sites/ {845DODAE-A374-48AD-926F-F850E019F2CD}/uploads/{4883FE6F-492D-4973-A789-69175EDD4886} .PDF> (June 2003).
MacDonald, J. "Relief and Grief as Fire Evacuees Get Look at Homes." Associated Press. May15, 2000.
D-103
Deadwood Fire, Deadwood, South Dakota, June 29, 2002, ID #213
An 18.2 km2 (4,500 acre) wildfire near Deadwood, South Dakota, forced the evacuation of15,000 people on June 29, 2002. Deadwood, about 64 km (40 mi) northwest of Rapid City, ishome to about 80 casinos and attracts thousands of tourists to its casinos on summer days. Manyof the evacuees were gamblers rather than local residents. The population of Deadwood is only1,380 people. Three special institutions were evacuated, including a nursing home, the countyjail and the Deadwood hospital. Only the nursing home evacuation was of any majorconsequence, and ambulances and special-lift vans from other towns were used to transport theelderly. The Deadwood hospital only had three patients. In addition to Deadwood, half of thetown of Lead and the Boulder Canyon Country Club were later evacuated.
COMMUNITY CONTEXT
GeneralDeadwood, a small suburban community of only 1,380 people, is about 64.4 km (40 mi)northwest of Rapid City, South Dakota. It attracts thousands of tourists to its eighty casinos, andthe local population swells during the summer months. Population density was high during thisevacuation. On June 29, 2002, 15,000 people were evacuated. This represented the entirecommunity. Ethnicity, nationality, and age were not important factors in the evacuation.
Deadwood is a city with a mayoral form of government. Its main economic base is tourism,which attracts a large number of non-residents. Deadwood is more than 80 km (50 mi) from thenearest commercial nuclear power plant and there are no nuclear power plants in the state ofSouth Dakota.
History of EmergenciesDeadwood is more prone to natural disasters than average. Wildfires are frequent in thesurrounding areas and the community has had prior experience with them. However, the lastevacuation of Deadwood was for a wildfire in 1959. The community did not have previousexperience with the alerting mechanism used (door to door).
D-104
Emergency PreparednessThe community's emergency preparedness activities include planning, training, drills andexercises, and community awareness as described below.
PlanningLawrence County has a written emergency plan with an evacuation section, the "spirit" of whichwas followed in this emergency. The wildfire spread so fast that there was not a lot of time to"open the book." The Lawrence County Emergency Plan is currently being revised. The planconformed to NUREG-0654/FEMA-REP- I, Rev. 1, in most aspects, except it did not contain anETE.
TrainingTraining is provided to emergency response personnel. The local emergency planningcommittee includes members from industry and government, and joint training is conducted withemergency response personnel.
Drills and ExercisesThe emergency response agencies regularly conduct emergency drills and exercises. Aminimum of one drill is required each year, and two drills were conducted in 2002. Theemergency plan used in this evacuation was previously tested in a full-scale field exercise.
Community AwarenessThe residents of Deadwood are highly aware of local hazards (i.e., wildfires). They aremoderately familiar with evacuation procedures and they would have been highly aware of thealerting methods used in this evacuation since it was just door-to-door notification.
THREAT CONDITIONS
The threat leading to the evacuation was a wildfire that started at about 2 p.m. on June 29, 2002,about a mile south of Lead, which is 4.8 km (3 mi) from Deadwood. The cause of the fire isunknown, but lightning was reported in the area the previous night. Hot, windy conditions in thenorthern Black Hills made the situation worse. The temperatures soared as high as 43.31C(I 10-F).
The fire spread very rapidly and took out all of the power, as well as destroying cell phonetowers. Therefore, telephones, cell phones, and televisions could not be used, and emergencypersonnel had to rely on radios. In addition, all notification had to be done door to door.Although the media reported that civilian use of cell phones jammed the communication system,the emergency management manager reported that the communication failure was caused bydestruction of the cell phone towers in the fire.
D-105
CONSEQUENCES
Approximately 15,000 people were evacuated due to the Deadwood Fire. There were no deathsor injuries resulting from either the fire or the evacuation. The estimated total cost ofevacuation-related expenses is unknown.
EMERGENCY RESPONSE
Decision MakingThe level of cooperation among local, state, and federal agencies was high. Political boundarieswere not crossed. Command, control and coordination processes could best be described as pre-planned. Unofficially, the emergency manager ordered the evacuation. However, officially theevacuation order came from the governor. There were no problems with the decision-makingprocess.
CommunicationsAn EOC and an ICP were used in this emergency. Communication between field emergencyresponders and the EOC was by radio. All other communication methods were down because ofthe fire, but, according to the emergency manager, this was not a major problem for thembecause they usually communicate by radio. Although the media reported that civilian use ofcell phones jammed the communication system, the emergency management manager reportedthat the communication failure was due to destruction of cell phone towers in the fire.
Notification and WarningSenior local officials were notified of the incident when emergency personnel knocked on theirdoor. Emergency responders were notified by radio dispatch. There were no problems withnotification. Response personnel mobilized to the scene within two minutes of discovery of theincident. The decision to evacuate was made within 30 minutes of discovery of the incident.The main evacuation took about 40 minutes to complete. The public was notified by emergencypersonnel who went door to door. The evacuation was staged. The nursing home was evacuatedearly as a precaution; next the main evacuation took place in Deadwood; later, half of Lead andthe Boulder Canyon Country Club were evacuated. There were no special problems withwarning or subsequent citizen action.
Traffic Movement and ControlPeople were told to head north toward Spear Fish when they evacuated; however, they were nottold what routes to take. They were told that congregate care centers were set up at Black HillsState University in Spear Fish and the former armory in Lead. Three special institutions wereevacuated, a nursing home, the county courthouse, including the county jail, and the DeadwoodHospital. Only the first one, the nursing home, required much in the way of specialarrangements. The Deadwood Hospital, for example, only had three patients. The nursinghome, however, was evacuated early as a precaution. Ambulances and special-lift vans were
D-106
used to evacuate the elderly. In addition, a trolley system from Black Hills was used to evacuatethe elderly.
Road conditions were clear and dry; however, Route 385 was eliminated as an evacuation routeafter the fire jumped it. There were traffic jams that the media reported as significant but theywere not significant according to the emergency manager. That manager said that traffic wasstill moving even though it was bumper to bumper, and there were no traffic accidents. Therewas no time for spontaneous evacuations. Reverse-laning was used. Only a few people refusedto evacuate, including a hotel operator and his employee.
Congregate Care CentersCongregate care centers included the former armory in Lead and the sports and fitness center atBlack Hills State University in Spear Fish. The American Red Cross managed the congregatecare centers. Only a few hundred people (less than 5%) registered at the congregate care centers.There were no shadow evacuations.
Law EnforcementThe State Highway Patrol (police) secured the area following the evacuations. They went houseto house to make sure all of the doors were locked. There were no instances of looting orvandalism, and no problems with law enforcement.
Re-EntryThe Federal Firefighting Team authorized re-entry. No special controls were used during re-entry; however, law enforcement accompanied those who had lost their homes in the fire.Evacuees were not compensated for their expenses. No major problems occurred during re-entry.
CONTACT INFORMATION AND REFERENCES
Contacts
Lawrence County Emergency Manager(605) 578-2122(Personal Communication, June 30, 2003)
References
Kafka, J. "Black Hills towns evacuated as wildfire bums on hillsides above them." AssociatedPress. July 1, 2002.
Kafka, J. "Residents of Black Hills gambling town ordered to evacuate as fire approaches."Associated Press. June 30, 2002.
D-107
Cerro Grande Fire, White Rock, New Mexico, May 11, 2000, ID #209
The Cerro Grande Fire, which began on May 4, 2000, was the largest, most destructive wildfirethat New Mexico has ever known. Originally started as a prescribed bum in Bandelier NationalMonument, the wildfire ultimately burned 190 km2 (47,000 acres) and caused the evacuations ofthousands of people in Los Alamos County. As a result, 7,000 people were evacuated from theunincorporated community of White Rock, New Mexico on May 11. Previously, 12,000 peoplehad been evacuated from the town of Los Alamos on May 7 and May 10 (See also ID #107).The White Rock evacuation did not go well. Hampering the evacuation effort was the fact thatWhite Rock had swollen in size by at least 1,000 people who came from Los Alamos the daybefore seeking shelter. Several changes were made to the Los Alamos County EmergencyManagement Plan as a result of lessons learned during the evacuations. One major change wasthat White Rock was subdivided into three notification zones and three specific evacuation zonesin order to relieve congestion and improve evacuation times.
COMMUNITY CONTEXT
GeneralOn the evening of May 11, 2000, approximately 7,000 people in White Rock, New Mexico wereordered to evacuate as wildfires neared their community. White Rock is a small, unincorporatedcommunity located near Los Alamos. The size of the community and of the evacuated area is18.6 km2 (7.2 mi2 ). The population density during the evacuation was high. White Rock is abedroom community to Los Alamos and the main economic base is LANL. There are no specialcharacteristics that attract a large number of non-residents; however there were a high number ofnon-residents in White Rock on the day of the evacuation because evacuees from Los Alamoscame to the congregate care center set up at the White Rock Baptist Church. There are nocommercial nuclear power plants located within 80 km (50 mi) of White Rock and there are nosuch plants in New Mexico.
History of EmergenciesWhite Rock is no more prone to technological hazards than the average community, although itis slightly more prone to natural disasters, specifically wildfires. Los Alamos County has hadsignificant experience with the hazard that led to this evacuation. Residents were well aware of
D-108
the significance of the Cerro Grande Fire and had witnessed the evacuation of Los Alamos theprevious day (See also ID #107). In addition, the community has witnessed several large firesover the last 36 years, including a large fire in 1954, La Mesa Fire (1977), Dome Fire (1996),Lurnmis Fire (1997), Oso Fire (1998), and Guaje Fire (2000). However, White Rock had notexperienced any evacuations in the previous 10 years and likely had no prior experience with thealerting mechanism used in this evacuation, which was a reverse 91 1 telephone system.
Emergency PreparednessThe community's emergency preparedness activities include planning, training, drills andexercises, and community awareness as described below.
PlanningThe community had a written emergency plan, which contained an evacuation section and it wasused in this emergency. The Los Alamos County Emergency Management Plan generallyconformed to NUREG-0654/FEMA-REP- 1, Rev. 1, except that it did not contain an ETE.
TrainingTraining is provided to emergency response personnel, and joint training is regularly conductedwith LANL.
Drills and ExercisesLos Alamos County's emergency response agencies regularly conduct emergency drills andexercises, and the emergency plan used in this evacuation was previously tested in a full-scalefield exercise. The exercise performed immediately prior to this evacuation was most likely afunctional drill.
Community AwarenessThe local community is highly aware of local hazards, especially of the hazard (wildfires) thatcaused this evacuation. However, the community's awareness of evacuation procedures and ofthe alerting method used in this evacuation was likely no higher than that of the averagecommunity.
THREAT CONDITIONS
The Cerro Grande Fire began as a prescribed bum on May 4, 2000. A total of 7,000 people wereevacuated from White Rock. The evacuations occurred during the night and proceeded slowly.The weather was hot and dry and the roads were dry. The White Rock evacuation had oneunusual circumstance; the town had swollen in size due to evacuees from Los Alamos who hadsought shelter in White Rock. This increased the population by at least 1,000 people.
D-109
CONSEQUENCES
On May 11, 2000, as the uncontrolled wildfire approached White Rock, the entire town of 6,000people plus the 1,000 evacuees from Los Alamos were evacuated for a total of 7,000 evacuees.There were no reported deaths or injuries resulting from either the wildfire or the evacuation.The estimated cost to the public of the evacuation itself, and not of any damages associated withthe wildfire, is several million dollars. Federal disaster aid was made available to families whohad lost homes; however, there was no reimbursement for evacuation expenses since food andshelter was provided to those who chose to go to the congregate care centers.
EMERGENCY RESPONSE
Decision MakingThe level of cooperation among local, state, and federal agencies was very high. Some of thelocal, state and federal agencies involved in this emergency include the U.S. Forest Service,National Park Service, Federal Emergency Management Agency, Los Alamos County, SantaClara Pueblo and San Ildefonso Pueblo, state and local police, New Mexico National Guard, andfirefighters and emergency personnel from all over the country. Political boundaries were notcrossed. The command, control and coordination processes could best be described as pre-planned. The decision to evacuate was made by the Los Alamos Police Chief, although otherauthorities influenced his decision. No problems were identified with the decision-makingprocess, even though there was no legal authority to order an evacuation.
CommunicationsThe same two EOCs that were used for the Los Alamos emergency (See also ID #107) wereused for the White Rock evacuation. This included one EOC maintained by LANL and the othermaintained by Los Alamos County. This was confusing and did not work well. As a result, theCounty Emergency Management Plan has been re-written to have a Joint LANL/County EOC infuture emergencies. Field emergency responders communicated with the EOC by cellphone/pagers and radios. However, the radios did not work well because the county's variousradio systems were designed for routine minimal operational demands. Interoperability withinthe county and with out-of-town supporting services was a problem. Therefore, most of thecommunications took place using cell phones/pagers. Amateur ham radio operators were veryeffective in getting and passing on information.
Notification and WarningWhite Rock does not have any senior local officials. It is a small, unincorporated community.However, senior county officials and emergency responders were notified of the incident by cellphones and pagers and personnel utilized phone trees to make sure all responders were notified.Response personnel were not mobilized to the scene until over an hour after the start of theincident. The evacuation took several hours to complete (much longer than the evacuation ofLos Alamos the previous day). There were no problems identified with the notification ofemergency personnel. The evacuation took place all at once on May 11, 2000, and
D-1 10
approximately 7,000 people were evacuated. The public was notified of the incident bytelephone, using the Community Alert Network System (CANS), which is a reverse 911 systemthat calls all of the numbers in its database and alerts the recipients of the hazard, the evacuation,and appropriate emergency procedures to follow. The CANS system was found to have anoutdated database of telephone numbers and was not as effective in notifying the public as itcould have been. It has since been replaced with the Emergency Preparedness NotificationSystem, another reverse 91 1 system, which is operated by Qwest Communications.
Traffic Movement and ControlEvacuees were given specific instructions about where to go when they evacuated and were toldto use three main routes that were designated with police barricades. The Los Alamos police andthe New Mexico National Guard manned roadblocks and assisted in the evacuation. Roadconditions prior to the evacuation were dry. No major roadways were under construction andtherefore unavailable and none were damaged by the hazard. Traffic was heavy because thepopulation of White Rock had swollen in the previous 24 hours with evacuees from Los Alamoswho had sought shelter there. However, no traffic accidents were reported. If there were anyinstances of spontaneous early evacuations, they were negligible. No one refused to evacuate.
Congregate Care CentersCongregate care centers were used and were managed by local Red Cross personnel.Congregate care centers were set up at the Pojoaque High School, Santa Fe High School, and theCities of Gold Casino in Pojoaque. Other congregate care centers were reportedly available inGlorieta and at the Pojoaque Gym. Most evacuees came to the congregate care centers forinformation and meals, but few clients needed sleeping facilities. Less than 10% of evacueesstayed at the congregate care centers. The vast majority of evacuees stayed with friends andrelatives, in hotels, or in their own personal recreational vehicles. There were no shadowevacuations.
Law EnforcementThe Police Department, augmented by the Air National Guard Security Police and mutual aiddepartments, maintained intensive security patrols in burned and evacuated areas. There were noreported instances of looting or vandalism, and no problems were identified with lawenforcement.
Re-EntryOn May 14, 2000, White Rock was re-opened to residents. Re-entry was authorized by the LosAlamos County Emergency Manager and was accomplished with the assistance of the PoliceDepartment. There were no special controls during the re-entry process because, unlike LosAlamos (See also ID #107), none of the homes in White Rock had been destroyed by thewildfire. Federal disaster aid was made available to families who had lost homes; however,there was no reimbursement for evacuation expenses since food and shelter was provided tothose who chose to go to the congregate care centers.
D-lll
INVESTIGATOR COMMENTS
The county's pre-incident planning was adequate but understandably did not anticipate themagnitude of a Cerro Grande-type incident. One major change to the plan was that White Rockwas subdivided into three notification zones and three specific evacuation zones in order torelieve congestion and improve evacuation times.
As summarized from "The Cerro Grande Fire of 2000: Summary of Matters to be Considered bythe Los Alamos County Council, December 16, 2002," relevant lessons learned include:
1. The operation of two EOCs did not work well and the County Emergency Management Planhas been rewritten to have a Joint LANL/County EOC. The revised plan was approved byCouncil in June 2001
2. The automated telephone citizen notification system used, the Community Alert NetworkSystem (CANS), was not as effective as desired. CANS has been replaced with theEmergency Preparedness Notification System, operated by Qwest, and appears to be a bettersystem.
3. Animal control, specifically care of pets when the town was evacuated, became a majorissue. Tentative Mutual Aid agreements, prompted by the State Department of Agriculture,have been discussed by County Animal Control personnel and Santa Fe City and County.
4. Tracking and registering evacuees proved to be a big problem. Evacuees should beencouraged to register via internet on the county website or by telephone with a designatedcounty office. The website should be configured to accept a large number of registrants,and to receive additional input from telephoned messages.
5. Donated food, clothing, services, and material exceeded needs and was uncontrolled.
6. The American Red Cross national response personnel were very difficult to work with anddeclined to coordinate any of their activities with the county. Local Red Cross personnelinitially provided their usual good services, but were completely ignored by the nationallevel team.
7. The county's various radio systems were designed for routine minimal operational demands.Interoperability within the county and with out-of-town supporting services was andcontinues to be a problem.
8. The Public Information Telephone Center was one of most effective steps taken during theentire operation. Fifty phone lines were placed in operation within a matter of hours, andhandled over 7,000 calls in the first day.
D-1 12
9. Emergency Management "news bulletins" proved to be a very effective means of gettingtimely updates to county officials, the media, and the public. These announcementsaddressed fire and law enforcement/security operations, status of utilities and other services,road closings and openings, volunteer operations, and store openings.
10. The County Joint Service Center was conceived to be the center for recovery operations byreturning residents. All agencies were housed in one building to provide a "one-stop"service under management by the county. The operation was well received by residents.
11. The American Red Cross, and to a lesser extent, FEMA, were reluctant to be housed withany other agencies or with each other. Only strong direction by a county manager kept theRed Cross functioning as part of the Joint Service Center.
12. The decision to bring in managers from the city of Oakland (California), which hadexperienced a major conflagration in the recent past, was a good one. Their list of actionstaken and advice was invaluable in ensuring all that should be done was done.
13. A major lesson learned was how to transition from emergency to recovery operations. Thiswas accomplished by creating the Recovery Planning Group, which operated under thedirection of the Emergency Manager. It was composed of department manager-levelpersonnel, and met daily, usually for several hours. Its charter was to consider all problemsfrom the residents' perspective. Second-level personnel continued staffing the EOC duringthe period the two groups overlapped.
14. County management was instrumental in getting the "Cerro Grande Fire Assistance Act"through Congress. This was a much needed piece of legislation that provided both short andlong-range relief to the county and its citizens.
Koidin, M. "Three Days away, White Rock's 7,000 Residents Return Home." Associated Press.May 15, 2000.
Los Alamos County. "The Cerro Grande Fire of 2000: Summary of Matters to be Considered bythe Los Alamos County Council." December 16, 2002.<http://www.lac-nm.us/vertical/Sites/{845DODAE-A374-48AD-926F-F850E019F2CD}/uploads/{4883FE6F-492D-4973-A789-69175EDD4886} .PDF> (June 2003).
D-114
HIayman Blaze, Douglas County, Colorado, June 2002, ID #119
The Hayman Wildfire in Douglas County, Colorado, forced the evacuations of more than 40,000residents who lived just southwest of Denver. The fire began from an illegal campfire in PikeNational Forest, about 10 km (6 mi) northwest of Lake George. Fire investigators believe thefire was ignited by underground coal that had been burning since the 1970s. Different sectionsof the fire were spreading in Park, Jefferson, and Douglas counties, spurring evacuations inDeckers, Trumbull, the Wigwam Creek area, as well as areas west of Colorado Highway 67.
Six congregate care centers were set up by the American Red Cross in Woodland Park, LakeGeorge, Littleton, Highlands Ranch, Colorado Springs, and Castle Rock for at least 3,000residents previously evacuated. Two other congregate care centers were opened to house 270travelers stranded when a 1 11 -km (69-mi) long section of I-70 was closed Sunday because ofapproaching flames and heavy smoke.
COMMUNITY CONTEXT
GeneralDouglas County is a suburban county in Colorado located in the southern region of the state. Ithas a total population of 175,766 people. Approximately 5,500 people (3% of the population)from the city of Castle Rock in Douglas County were evacuated. Land use in the evacuationarea was primarily residential. The total area of Douglas County is 2,183 km2 (843 mi2) and theevacuated area was 155 km2 (60 mi2). The population density of the area during the evacuationwas medium. Ethnicity, nationality, and age were not important factors in the evacuation.
Douglas County has a commission and board form of government and its main economic base istourism. Tourism and people traveling on Interstate 67 attract a large number of non-residents tothe area. The nearest commercial nuclear power plant is more than 80 km (50 mi) away.
History of EmergenciesDouglas County is no more prone to hazards than the average U.S. county. The community hadprevious experience with the hazard that led to this evacuation and had experienced evacuations
D-1 15
in the previous ten years. The community also had previous experience with the alertingmechanisms used in this evacuation.
Emergency PreparednessThe community's emergency preparedness activities include planning, training, drills andexercises, and community awareness as described below.
PlanningThe community had a written emergency plan, but it did not contain a specific evacuationsection and was the plan used in this emergency. It is unknown if the plan conformed toNUREG-0654/FEMA-REP- 1, Rev. 1, or if it contained an ETE.
TrainingTraining is provided to emergency response personnel but joint training between industry andgovernment is not regularly conducted.
Drills and ExercisesDouglas County's emergency response agencies regularly conduct emergency drills andexercises. The emergency plan used in this evacuation was not previously tested in a full- scalefield exercise, but was tested in sections.
Community AwarenessThe level of community awareness of local hazards was medium. The level of communityawareness of evacuation procedures was also medium, and the level of awareness about thehazard that caused the evacuation was low. The level of community awareness about alternatemethods used in this evacuation was medium.
THREAT CONDITIONS
The threat condition leading to this evacuation was a wildfire that began on June 4, 2002, atapproximately 4 p.m. in Pike National Forest and burned more than 100,000 acres before it wascompletely contained on July 2, 2002. Weather conditions were clear and dry and the roadswere dry. There were no unusual circumstances that occurred during this incident other than thehazard itself.
CONSEQUENCES
Approximately 5,500 people were evacuated from their homes and businesses beginning on June4, 2002, and were allowed to return on July 2, 2002. There were no deaths or injuries caused bythe hazard or by the evacuation. The estimated total costs of evacuation related expensesincurred by the public are unknown.
D-1 16
EMERGENCY RESPONSE
Decision MakingThe level of cooperation between local, state, and federal agencies was high. Five politicalboundaries were crossed which included county, national, and forest boundaries. The command,control, and coordination processes could best be described as pre-planned. The decision toevacuate was first made by the sheriff and emergency manager of Douglas County and thenbecame federal jurisdiction. There were problems with the decision making process becausethere were two different evacuation commands issued.
CommunicationAn EOC was used along with an ICP. Communication between field emergency responders andEOC was by radio, telephone, and cell phone. There were no problems with communication.
Notification and WarningSenior local officials and emergency responders were notified by telephone. The elapsed timebetween the discovery of the incident and the mobilization of response personnel is unknown.The elapsed time between the start of the hazard, the decision to evacuate, and the total time ittook to complete the evacuation is unknown because the evacuation was staged over the courseof a month. There were no problems with notification of emergency personnel or senior localofficials. The public was notified by radio and television broadcasts, a reverse 91 1 system, andby emergency responders going door to door. There were no special problems regardingwarning and subsequent citizen actions.
Traffic Movement and ControlEvacuees were given specific routes and directions about where to go. These routes weredesignated by roadblocks and there were access limitations. There were no special institutionsevacuated. Road conditions prior to the evacuation were dry and Highway 67 was unavailabledue to the fire. Reverse-laning was not used. No special traffic problems were encountered andno traffic accidents occurred. Some people spontaneously evacuated and others refused toevacuate.
Congregate Care CentersThe American Red Cross set up six congregate care centers in Woodland Park, Lake George,Littleton, Colorado Springs, Highlands Ranch, and Castle Rock for 3000 residents. It isunknown what percentage of evacuees used the congregate care centers. There were shadowevacuations but this did not impact traffic or congregate care center capacity.
Law EnforcementThe police secured the area following the evacuation and there were no instances of looting orvandalism and no problems with law enforcement.
D-117
Re-EntrvIncident management teams authorized re-entry through a controlled phase based on the fire'slocation. Evacuees were not compensated for their expenses and there were no major problemsduring re-entry.
INVESTIGATOR COMMENTS
Pre-designated evacuations, trigger points, telephone notification systems, and the public's priorknowledge of the hazard contributed to the success of the evacuation. Reoccupation issues aboutwhen and how evacuees could return home made the evacuation difficult.
CONTACT INFORMATION AND REFERENCES
Contacts
Douglas County Emergency Services Coordinator(303) 660-75898/20/03
References
Long, C. Disaster Relief News Stories. "Hayman Wildfire Breaks Lines." June 18, 2002.
Long, C. Disaster Relief News Stories. "Hayman Fire 30% Contained." June 15, 2002.
Wikipedia, The Free Encyclopedia. "Douglas County, Colorado.
On July 18, 1997, 6,000 residents were evacuated from their homes in Flora and an area fivemiles north of Flora after 11 tank cars derailed in the middle of the night. Two of the tank carscarried 159,110 L (35,000 gal) of chloroprene, a chemical used to create the synthetic rubberneoprene. No deaths or injuries were associated with the derailment or the evacuation.
COMMUNITY CONTEXT
GeneralThe entire town of Flora, Mississippi, population 1,546, and an area five miles to the north wereevacuated (a total of 6,000 people were evacuated). The town of Flora covers an area of 8.8 km2
(3.4 mi2), and the evacuated area covered an area of 38.8 km2 (15 mi2). The population densitywas medium during the evacuation. Land use in the evacuated area is residential, commercial,and agricultural. Ethnicity, nationality, and age were not important factors in the evacuation.
The community has a mayoral form of government and its main economic base is agricultural.There is a petrified forest that attracts a large number of tourists. The nearest nuclear powerplant is more than 80 km (50 mi) away. Mississippi has one commercial nuclear power plant,Grand Gulf 1, located 40 km (25 mi) south of Vicksburg.
History of EmergenciesThe community is no more prone to hazards than average, although it has had experience withderailments and evacuations in the past. In 1995 a car and train accident led to an evacuation.However, the community had no previous experience with the alerting mechanism used in thisevacuation.
Emergency PreparednessThe community's emergency preparedness activities include planning, training, drills andexercises, and community awareness as described below.
D-119
PlanningThe community did not have a written emergency plan.
TrainingThe community provides training to emergency response personnel and regularly conducts jointtraining between industry and government.
Drills and ExercisesThe community's emergency response agencies do not regularly conduct emergency drills orexercises.
Community AwarenessThe community has a low level of awareness of local hazards and of the hazard that caused thisevacuation (i.e., the chloroprene spill). However, the community has a high level of awarenessabout evacuation procedures and the alerting methods used in this evacuation.
THREAT CONDITIONS
The threat condition leading to this evacuation was the derailment of a train carrying 159,113 L(35,000 gal) of chloroprene at 3:00 a.m. on July 18, 1997. The roads were dry and clear andthere were no unusual circumstances that occurred during the derailment, other than the fact thatit occurred in the middle of the night.
CONSEQUENCES
Approximately 6,000 people in a 39 km2 (15 mi2) area were evacuated from their homes after atrain carrying 159,1 10 L (35,000 gal) of chloroprene derailed in Flora, Mississippi. No deaths orinjuries were associated with the derailment or the evacuation. The estimated total cost ofevacuation-related expenses is unknown.
EMERGENCY RESPONSE
Decision MakingThe level of cooperation among local, state, and federal agencies was high, particularly betweenthe Game and Fish Department and the State Highway Patrol. Political boundaries were crossed.The command, control and coordination processes could best be described as pre-planned. Thedecision to evacuate was made jointly by the Flora Fire and Police Chiefs and there were noproblems with the decision-making process.
D-120
CommunicationsThere was an EOC and an ICP during this emergency. Communication between fieldemergency responders and the EOC was by radio and cell phone. There were no problems withthis form of communication.
Notification and WarningSenior local officials were notified of the incident by telephone and emergency responders werenotified through the 911 phone system. There were no problems with notification of emergencypersonnel or senior local officials. The elapsed time between discovery of the incident andmobilization of response personnel was less than 15 minutes, and the decision to evacuate wasmade approximately 20 minutes after the derailment. It took approximately 1.5 hours tocomplete the evacuation. The public was notified by police/fire Public Address (PA) system.The evacuation took place all at once and there were no special problems regarding warning andsubsequent citizen action.
Traffic Movement and ControlEvacuees were not given specific instructions about where to go but were told to use specificroutes designated by roadblocks and manned police patrols. No special institutions wereevacuated. Road conditions before the evacuation were dry and there were no traffic accidentsand no traffic problems; major roadways were available to evacuees. Reverse-laning was notused. No one evacuated before being told to do so and no one refused to evacuate.
Congregate Care CentersCongregate care centers were not used and there were no shadow evacuations.
Law EnforcementThe State Highway Patrol and the Game and Fish Department secured the area following theevacuation and there were no instances of looting or vandalism or any problems with lawenforcement.
Re-EntryThe Flora fire and police chiefs jointly authorized re-entry two days after the derailmentoccurred. There were no special controls during re-entry and no problems with the re-entry.Evacuees were not compensated for their expenses.
INVESTIGATOR COMMENTS
According to the Flora police chief, the evacuation was successful because of cooperation ofevacuees.
In July 1998, a wildfire started in Flagler County, Florida and spread rapidly through the area.Fires burned in Brevard, Volusia, and Flagler counties and through the neighboring towns ofBunnel and Palm Coast, damaging and destroying homes. At least 150 homes were damaged ordestroyed, and more than 800 km2 (500 mi2 ) were blackened. Approximately 45,000 peoplewere evacuated from the area.
COMMUNITY CONTEXT
GeneralFlagler County, Florida, is a suburban community with a population of approximately 49,832and it covers an area of 1,478 km2 (571 mi2). Approximately 45,000 people, almost 100% of thepopulation, were evacuated from Flagler County. Ethnicity, nationality, and age were notimportant factors in the evacuation.
The county has a county commission form of government, and the main economic base iscommercial and retail services. Tourism to Daytona Beach attracts large numbers ofnon-residents to the area. The nearest nuclear power plant is more than 80 km (50 mi) away.
History of EmergenciesThe area is more prone to natural hazards than the average county, and the county has hadexperience with wildfires in the past. The community had not experienced large-scaleevacuations in the last 10 years; however, there was a large-scale evacuation in 1985. Thecommunity had had previous experience with the alerting mechanism used during thisevacuation.
Emergency PreparednessThe community's emergency preparedness activities include planning, training, drills andexercises, and community awareness as described below.
D-123
PlanningThe community had a written emergency plan that was used in this emergency and the planincluded an evacuation section. The plan did not conform to NUREG-0654/FEMA-REP-1, Rev.1, and there was no ETE in the plan.
TrainingThe community provides training to emergency response personnel, and joint training betweenindustry and government is regularly conducted.
Drills and ExercisesThe community's emergency response agencies regularly conduct emergency drills andexercises; however, the emergency plan had not been previously tested in full-scale exercises.
Community AwarenessThe community has implemented a public awareness program and therefore has a high level ofawareness of the local hazards and of evacuation procedures. It has a low level of awarenessabout wildfires and a medium level of awareness about the alerting methods used in thisevacuation.
THREAT CONDITIONS
In July 1998, a wildfire in Flagler County, Florida, spread rapidly through the area. Fires alsoburned in Brevard and Volusia counties and through the neighboring towns of Bunnel and PalmCoast, placing approximately 120,000 people under evacuation orders. The Flagler County firewas noticed immediately after it started; however, no planes were available to fight the firebecause they were tied up with other fires in the state. In Flagler County, approximately 45,000people were ultimately evacuated. The evacuations occurred during the day when weatherconditions were dry and hot with gusty winds that hampered firefighters' efforts to control theblaze. The roads were dry and clear except for the smoky haze that covered much of the area,causing motorists to use headlights in midday as visibility was cut to one-quarter mile. Threefires converging on each other, combined with the large number of evacuees, caused significanttraffic issues. Traffic was bumper to bumper, and people were told to turn around when the firesshifted directions.
CONSEQUENCES
Beginning around June 1, 1998, some 2,000 wildfires scorched more than 450,000 acres inFlorida during a severe drought. Nearly 200 homes were damaged or destroyed andapproximately 55 people, many of them firefighters, were injured. Flagler County was the worsthit with fires in July where the fires damaged or destroyed at least 150 homes and blackenedmore than 800 km2 (500 mi2) and caused the evacuation of approximately 45,000 people.During the event, three evacuations took place, and the third evacuation, on July 2, 1998, atapproximately 3 p.m., was an order to evacuate the entire county.
D-124
There were no fatalities from the wildfires, but four people were injured in Flagler County.There were no fatalities or injuries as a result of the evacuation. The estimated total cost of theevacuation-related expenses is unknown.
EMERGENCY RESPONSE
Decision MakingThe level of cooperation among local, state, and federal agencies was moderate, and politicalboundaries were crossed in this event. The command, control, and coordination processes couldbest be described as ad hoc. The decision to evacuate was made by the governor, and there wereno problems with the decision-making process.
CommunicationsAn EOC and an ICP were used in this emergency. Communication between field emergencyresponders and the ICP was by radio, telephone, cell phone, and citizen ban (CB) radios. Therewere problems with having too many frequencies for communications during the event.
Notification and WarningSenior local officials were notified of the event by pager and cell phone. Emergency responderswere aware of the fire when it started but could not immediately get to the fire due to thelighting. The elapsed time between discovery of the incident and mobilization of responsepersonnel was less than 15 minutes. Emergency responders could see the fire, but there were noaircraft available to fight the fire as they were tied up on other fires in the state. The initialdecision to evacuate was made approximately seven days after the fire started. The entireevacuation was completed within approximately 8 hours.
The evacuation occurred all at once and the public was notified by police going door to door,using PA systems, and by radio and television broadcasts. There were no problems withwarning and subsequent citizen action. Some people evacuated before being told to do so, andothers refused to evacuate. One individual refused to evacuate in Ormond Beach. Flamesultimately surrounded his house, requiring him to be evacuated by helicopter.
Traffic Movement and ControlEvacuees were given instructions on where to go and were told which routes to use. Theseroutes were designated by hurricane evacuation route signs. There were special institutionsevacuated, including the Flagler Palm Coast High School, the County Jail, a hospital and a60-bed nursing home. Road conditions during the evacuation were dry and visibility was limitedby smoke. Approximately 100 miles of Interstate 95 and portions of Interstate 10 were closed,hampering traffic movement. As winds shifted and three fires converged, people were stoppedand redirected, causing even greater traffic problems and bumper-to-bumper conditions. Someminor traffic accidents were reported during the event and there were reports of people runningout of gas. Reverse-laning was not used.
D-125
Congregate Care CentersThe Red Cross established 40 congregate care centers, primarily in schools. Approximately4,800 people or 10% of the evacuees reported to the congregate care centers. Some of thesecongregate care centers had to be relocated as the fire encroached on the area. There werereports of individuals traveling well outside of the evacuation limits to ensure that they were outof harm's way. There were shadow evacuations where people from outside Flagler County alsoevacuated; however, these did not impact the congregate care center capacities or traffic. Manyevacuees went to the homes of friends or relatives, as well as to hotels, and even to the DaytonaSpeedway and Gainesville Fairgrounds to seek shelter.
Law EnforcementApproximately 1,500 National Guard were brought in to assist police with security following theevacuation. There were some instances of looting, but no instances of vandalism. There werereports of individuals violating curfew and then daring the police to arrest them stating that theywould prefer to be taken to jail where it was safe.
Re-Ent=rThe Chairman of the County Commission authorized re-entry; there were no special controlsduring re-entry. Evacuees were not compensated for their expenses.
INVESTIGATOR COMMENTS
The evacuation worked reasonably well because of the attention the county pays to fires.However, problems included the road closures that hampered the evacuation routes and toomany frequencies used for communications. The public's prior knowledge of evacuationsstemming from hurricanes and the public awareness education program both contributed to thesuccess of the evacuation.
CONTACT INFORMATION AND REFERENCES
Contacts
Flagler County Fire DepartmentEmergency Management Division Chief(386) 437-7831(Personal Communication, 7/21/03)
References"Like a war zone." Associated Press. Mike Schneider. 7/4/98
D-126
Louisiana State University Anthrax Hoax, Alexandria, Louisiana,October 29, 2001, ID #1
On October 29, 2001, 2,000 people at Louisiana State University at Alexandria (LSUA) wereevacuated after a phone call from a caller who claimed that anthrax had been planted in theschool's ventilation system. All nine buildings on campus were evacuated because the caller didnot specify which buildings had been contaminated. LSUA has no residence halls and it was acalm and orderly evacuation. The incident was later revealed to be a hoax.
COMMUNITY CONTEXT
GeneralLSUA is located I I km (7 mi) south of the city of Alexandria, Louisiana. Alexandria is asuburban community with a population of approximately 46,342 people and covers an area of69.9 km2 (27 mi2). Approximately 2,000 people, or 4.3%, of the population were evacuatedfrom a 1.3 km2 (0.5 mi2) area during this incident. The land use in the area is mainly schools andthe population density of the area was low. Ethnicity, nationality and age were not importantfactors in the evacuation.
The university is located just outside of Alexandria and is run by a commission in RapidesParish. The main economic base of the city is agriculture. The university attracts a largenumber of non-residents to the area. The nearest nuclear power plant is River Bend locatedmore than 80 km (50 mi) away.
History of EmergenciesThe community is more prone to hazards than average and has had experience with highway andrail accidents in the past along with tornadoes. The community has not had experience withanthrax in the past and has not experienced large-scale evacuations in the last 10 years. Thecommunity has had previous experience with the alerting methods used at the school, whichincluded use of the local intercom and alarms.
D-127
Emergency PreparednessThe community's emergency preparedness activities include planning, training, drills andexercises, and community awareness as described below.
PlanningThe community had a written emergency plan for the campus with an evacuation section thatwas used in this emergency. The plan did not conform to NUREG-0654/FEMA-REP- 1, Rev. I,and there was no ETE in the plan.
TrainingThe community provides training to emergency response personnel; however, this training doesnot include training about emergencies involving anthrax. Joint training is regularly conducted,on an annual basis, between industry and government.
Drills and ExercisesThe community's emergency response agencies regularly conduct emergency drills andexercises. The emergency plan used in this evacuation was previously tested in full-scale fieldexercises and in tabletop exercises.
Community AwarenessThe community has a medium level awareness of the local hazards and a low level of awarenessof evacuation procedures. It has a low level of awareness of anthrax in general, and mediumawareness of the alerting methods used in this evacuation.
THREAT CONDITIONS
On October 29, 2001, an anonymous call was placed to Louisiana State University at Alexandria(LSUA) from a caller who claimed that anthrax had been placed in the school's ventilationsystem. The caller did not identify where the anthrax had been placed, requiring the entirecampus to be evacuated. The call occurred at 8:15 a.m. during the early morning classes beforemany students had arrived on campus. The roads were dry and clear on a warm morning, andthere were no unusual circumstances that occurred during this event.
CONSEQUENCES
The anthrax threat was later revealed to be a hoax; however, the false report resulted in theevacuation of approximately 2,000 people, or 4.3%, of the population from a 1.3 km2 (0.5 mi2 )area. All nine buildings on campus were evacuated because the caller did not specify whichbuildings had been contaminated. A special team was called in to take samples, and classeswere suspended until samples demonstrated that the facilities were not contaminated. Nofatalities or injuries from the incident or the evacuation occurred. The estimated total cost of theevacuation-related expenses is unknown.
D-128
EMERGENCY RESPONSE
Decision MakingThe level of cooperation between local and state agencies was moderate, and politicalboundaries were not crossed in this event. The command, control, and coordination processescould best be described as ad hoc for the onsite response and pre-planned for the EOCoperations. The decision to evacuate was made by the school Chancellor, and there were noproblems with the decision-making process.
CommunicationsAn EOC was used in this event, and an ICP was established in the field. Communicationbetween field emergency responders and the ICP was primarily by radio. There were problemswith communications during the event becasue local and state police used different radiofrequencies.
Notification and WarningSenior local officials were notified of the incident by telephone. The emergency responderswere notified through a 911 telephone call from the school. There were no problems with thenotification of emergency personnel or senior local officials. The elapsed time betweendiscovery of the incident and mobilization of response personnel was less than 15 minutes, andthe decision to evacuate the first building was made approximately 15 minutes after thenotification of the incident. Approximately 30 minutes later, it was decided to evacuate the restof the campus. It took less than one hour to complete the evacuation.
Every building that makes up LSU campus was evacuated, and the school made the decision toevacuate. The evacuation took place quickly, but was considered a staged event. There were noproblems with warning and subsequent citizen action. No one refused to evacuate.
Traffic Movement and ControlEvacuees were given instructions to get off campus. There was no need to designatetransportation routes. The school is a special institution. Road conditions during the evacuationwere dry, and no traffic accidents or traffic-related problems occurred during the event.Reverse-laning was not used.
Congregate Care CentersCongregate care centers were not established for this emergency, and there were no shadowevacuations.
Law EnforcementPolice, the sheriff, state police and campus police secured the area following the evacuation, andthere were no instances of looting or vandalism or any problems with law enforcement.
D-129
Re-EntryRe-entry was authorized by the Louisiana State Police Hazmat unit, and there were no specialcontrols for re-entry. Evacuees were not compensated for their expenses. There were noproblems reported during re-entry.
INVESTIGATOR COMMENTS
Public awareness of the threat from recent events in the United States helped make thisevacuation work well. The emergency responders' lack of knowledge of the chemical andbiological contamination was a problem. The public's prior knowledge of evacuations alsocontributed to the success of the evacuation.
CONTACT INFORMATION AND REFERENCES
Contacts
DirectorRapides Parish Office of Emergency Preparedness(318) 445-0186(Personal Communication, 8/19/03)
References
Hamilton, K. "Local universities affected by threat of anthrax." Louisiana Wildcat College.November 2, 2001.
D-130
Railcar Leak, Sterling Heights, Michigan, March 2000, ID #58
On March 20, 2000, a railcar carrying hydrochloric acid was found leaking in the CONRAILyard in Sterling Heights, Michigan. Approximately 2,400 people within a six-block area wereevacuated from their businesses and homes.
COMMUNITY CONTEXT
GeneralThe city of Sterling Heights, Michigan, is a suburban community with a population ofapproximately 124,471 people and covers an area of 95 km2 (36.8 mi2). Approximately 2,400people, or 2% of the population, were evacuated from a 1.3 km2 (0.5 mi2) area during thisincident. Ethnicity, nationality, and age were not important factors in the evacuation.
The community has a city council form of government with a city manager. Its main economicbase is manufacturing. There are a large number of manufacturing facilities in the area thatattract large numbers of non-residents. The nearest nuclear power plant is located more than80 km (50 mi) away.
History of EmergenciesThe area is more prone to hazards than the average city, although the city has not had experiencewith leaking railcars in the past. The community has experienced large-scale evacuations in thelast ten years and has had previous experience with the alerting mechanism used during thisevacuation.
Emergency PreparednessThe community's emergency preparedness activities include planning, training, drills andexercises, and community awareness as described below.
D-131
PlanningThe community had a written emergency plan with an evacuation section; however, the plan wasnot used in this emergency. It is unknown if the plan conformed to NUREG-0654/FEMA-REP-1, Rev. 1, or if there was an ETE in the plan.
TrainingThe community provides training to emergency response personnel and regularly conducts jointtraining between industry and government.
Drills and ExercisesThe community's emergency response agencies regularly conduct emergency drills andexercises, and the emergency plan had been previously tested in tabletop and full-scale exercises.In February 2000 General Dynamics Land Systems, a company evacuated during this event,conducted a tabletop exercise with Sterling Heights emergency response personnel andgovernment officials.
Community AwarenessThe community has a medium level awareness of the local hazards and a low level of awarenessof evacuation procedures. It has a medium level of awareness of hazardous materials in general,and with the alerting methods used in this evacuation.
THREAT CONDITIONS
The threat conditions leading to this evacuation consisted of a leak in a railcar and subsequentplume of hydrochloric acid on March 20, 2000, at approximately 8:30 a.m. Weather conditionswere dry and winds were out of the east at approximately 8 kmph (5 mph). The roads were dryand clear and no unusual circumstances occurred during the event.
CONSEQUENCES
Approximately 2,400 people within a 1.3 km2 (0.5 mi2) area were evacuated from theirbusinesses and homes after a railcar was discovered leaking hydrochloric acid in SterlingHeights, Michigan. There were no fatalities or injuries from the incident or the evacuation. Theestimated total cost of the evacuation-related expenses is unknown.
EMERGENCY RESPONSE
Decision MakingThe level of cooperation among local, state, and federal agencies was high, and politicalboundaries were not crossed in this event. The command, control, and coordination processescould best be described as pre-planned. The decision to evacuate was made by the SterlingHeights Fire Department IC, and there were no problems with the decision-making process.Some of the agencies involved in the evacuation and response included the Sterling Heights
D-132
police, fire and public works departments, EPA, Department of Transportation, Macomb CountyHealth Department, and PVS Transportation, Inc.
CommunicationsAn EOC was not used, but there was an ICP used in this emergency. Communication betweenfield emergency responders and the ICP was by radio. There were no problems withcommunications during the event.
Notification and WarningSenior local officials were notified of the incident by telephone, and emergency responders werenotified through the 911 phone system. There were no problems with the notification ofemergency personnel or senior local officials. The elapsed time between discovery of theincident and mobilization of response personnel was less than 15 minutes and the initial decisionto evacuate was made at 9:40 a.m., approximately one hour after the discovery of the leak whenthe fire department and PVS Chemical and Transportation organization completed theirassessment. At 10:40 a.m., the IC assessed the scenario once more and ordered the evacuation ofadditional manufacturing facilities, including General Dynamics Land Systems, which employsapproximately 1,400 people. The entire evacuation was completed by 11:20 a.m.
The public was notified by a public address system and police going door to door. Theevacuation was staged and completed within approximately 1.5 hours. It is unlikely that anyoneevacuated before being told to do so, and some people refused to evacuate.
Traffic Movement and ControlEvacuees were given instructions on where to go and were told which routes to use. Theseroutes were designated by police barricade. There were no special institutions evacuated. Roadconditions during the evacuation were dry, and no traffic accidents or traffic related problemsoccurred during the event. Reverse-laning was not used.
Congregate Care CentersThere were no congregate care centers established in this event and people were told to go home.There were no shadow evacuations.
Law EnforcementPolice and private security secured the area following the evacuation and there were no instancesof looting or vandalism or any problems with law enforcement.
Re-EntryThe EPA monitored the air and, in coordination with the Sterling Heights Fire Department Chief,authorized reentry at approximately 8:00 p.m. There were no special controls during re-entryand evacuees were not compensated for their expenses.
D-133
INVESTIGATOR COMMENTS
According to the Sterling Heights fire chief, the evacuation worked well because of the highlevel of cooperation between industry and response personnel.
CONTACT INFORMATION AND REFERENCES
ContactsSterling Heights Fire DepartmentChief of Operations(586) 446-2991(Personal Communication, 7/30/03)
ReferencesSterling Heights Fire Department Incident Report #00-01670.
Jones, Radford. Anticipating the Worst of Times; April 2001.<http://www.securitymanagement.com/library/00 1021 .html>
D-134
Grand Trunk Derailment, Potterville, Michigan, May 27, 2002, ID #70
On May 27, 2002, the Grand Trunk train derailed in Potterville, Michigan, sending 35 of 58 carsoff the tracks. The train had nine cars of propane, two of which were leaking, and two cars ofsulfuric acid. The entire town of Potterville, approximately 2,200 people, was evacuated from a4.8 km2 (1.9 mi2) area for five days.
COMMUNITY CONTEXT
GeneralThe town of Potterville, Michigan, is a suburban community with a population of approximately2,200 people. The entire town was evacuated as a result of the train derailment and release ofhazardous materials. The town covers an area of 4.8 km2 (1.9 mi2) and 100% of the area wasevacuated. Ethnicity, nationality, and age were not important factors in the evacuation.
The community has a town council and town manager form of government with a mayor. Itsmain economic base is retail trade. There are no special characteristics that attract large numbersof visitors. The nearest nuclear power plant is Palisades, located more than 80 km (50 mi) away.
History of EmergenciesThe area is more prone to hazards than average with two railroad tracks running through townand heavy rail traffic in the area. Although the emergency response teams were aware of thepotential for railroad cargo to be hazardous, the residents, in general, were unaware of thepotential hazards. The community had not experienced large-scale evacuations in the last tenyears. It is unknown whether the community had previous experience with the alertingmechanism used during this evacuation.
Emergency PreparednessThe community's emergency preparedness activities include planning, training, drills andexercises, and community awareness as described below.
D-135
PlanningThe community had a written emergency plan with an evacuation section that was used in thisemergency. It is unknown if the plan conformed to NUREG-0654/FEMA-REP-1, Rev. 1, andthere was no ETE in the plan.
TrainingTraining is provided to emergency response personnel and training is conducted jointly with therailroad.
Drills and ExercisesThe community's emergency response agencies regularly conduct emergency drills andexercises; however, the emergency plan used in this evacuation had not been previously tested ina full-scale exercise.
Community AwarenessThe community has a medium level of awareness about the local hazards associated with therailroad. However, it has a low level of awareness about hazardous material leaks, evacuations,and the alerting methods used.
THREAT CONDITIONS
The threat conditions leading to this evacuation included the derailment of 35 cars from theGrand Trunk train. Nine of these cars carried propane and two of the cars carried sulfuric acid.The accident occurred around noon. The roads were dry and clear, and there were no unusualcircumstances that occurred during the derailment.
CONSEQUENCES
The entire town of Potterville, Michigan, covering an area of 4.8 km2 (1.9 mi2) was evacuatedwhen two of the propane cars leaked in the accident. There were no fatalities or injuries fromthe accident or the evacuation. The estimated total cost of the evacuation-related expenses isunknown.
EMERGENCY RESPONSE
Decision MakingThe level of cooperation among local, state, and federal agencies was high. Political boundarieswere not crossed in this event. The command, control, and coordination processes could best bedescribed as pre-planned. The decision to evacuate was made by the fire chief, and there wereno problems with the decision-making process.
D-136
CommunicationsAn EOC was not used but there was an ICP used in this emergency. Communication betweenfield emergency responders and the ICP was by radio. There were problems with having toomany frequencies to manage communications during the event.
Notification and WarningSenior local officials of this small town were immediately aware of the incident, as everyoneresponded. Emergency responders were notified through the 911 phone system. There were noproblems with the notification of emergency personnel or senior local officials. The elapsedtime between discovery of the incident and mobilization of response personnel was less than 15minutes and the decision to evacuate was made approximately 10 minutes after the derailment.It took approximately one hour to evacuate the town. The public was notified by a publicaddress system and police going door to door. The evacuation took place all at once and onlyone person refused to evacuate.
Traffic Movement and ControlEvacuees were given instructions on where to go for congregate care centers and were toldwhich routes to use. These routes were designated using roadblocks. There were no specialinstitutions evacuated. Road conditions during the evacuation were dry and no traffic accidentsor traffic-related problems occurred during the event. Reverse laning was not used, and no oneevacuated before receiving the evacuation notice.
Congregate Care CentersA congregate care center was set up at the Sheriffs Office and approximately 90 individuals, 4%of the population, went to the congregate care center. However, most of these people left andwent to hotels when they were informed that Canadian National would reimburse residents forhotel rooms. There were no shadow evacuations.
Law EnforcementPolice secured the area following the evacuation, and there were no instances of looting orvandalism or any problems with law enforcement.
Re-EntryRe-entry was allowed after a joint decision by the police chief, fire chief, and mayor. There-entry process was controlled and phased and there were no problems with re-entry. Evacueeswere compensated for food and hotel rooms by Canadian National.
D-137
CONTACT INFORMATION AND REFERENCES
Contacts
Potterville Fire Chief(517) 231-3653(Personal Communication, 7/23/03)
On December 16, 2000, a release of sulfur dioxide from a railcar that caught fire caused anevacuation of approximately 2,300 people in Oshkosh, Wisconsin. The railcar, leased byHydrite Chemical Company, released a vapor cloud that forced the evacuation of about 750homes, the Oshkosh Truck Corporation Service Center, and the Lake Air Shopping Mall. It alsoforced the shutdown of 2.6 km (1 mi) of Highway 45.
COMMUNITY CONTEXT
GeneralThe town of Oshkosh, Wisconsin, is a suburban community with a population of approximately3,234 people and covers an area of 158 km2 (61 mi2). Approximately 2,300 people, or 71%, ofthe population were evacuated from a 5.2 km2 (2 mi2) area during this incident. Ethnicity andnationality were not important factors in the evacuation; however, age was an important factorwith a number of elderly residents with special needs.
The town has a town council form of government, and the main economic base is manufacturing.Tourism attracts a large number of non-residents in the summer months. The nearest nuclearpower plant is Point Beach 2 located near Manitowoc, Wisconsin, approximately 83 km (52 mi)away. Wisconsin has two commercial nuclear power plants.
History of EmergenciesThe community is more prone to hazards than average, and the town has had experience withchemical leaks from manufacturing plants in the past. The community has experiencedlarge-scale evacuations in the last 10 years; however, the community has not had previousexperience with the alerting mechanism used during this evacuation.
Emergency PreparednessThe community's emergency preparedness activities include planning, training, drills andexercises, and community awareness as described below.
D-139
PlanningThe community had a written emergency plan with an evacuation section that was used in thisemergency. It is unknown if the plan conformed to NUREG-0654/FEMA-REP-1, Rev. 1, or ifthere was an ETE in the plan.
TrainingThe community provides training to emergency response personnel and regularly conducts jointtraining between industry and government.
Drills and ExercisesThe community's emergency response agencies regularly conduct emergency drills andexercises; however, the emergency plan used in this evacuation was not previously tested infull-scale exercises.
CommunitV AwarenessThe community has a high level of awareness about the local hazards and a low level ofawareness about evacuation procedures. It has a medium level of awareness about hazardousmaterials in general, and with the alerting methods used in this evacuation.
THREAT CONDITIONS
On December 16, 2000, a release of sulfur dioxide from a railcar that caught fire caused anevacuation in Oshkosh, Wisconsin. The railcar released a vapor cloud that forced the evacuationof about 750 homes, the Oshkosh Truck Corporation Service Center, and the Lake Air ShoppingMall and forced the shutdown of a portion of Highway 45. Weather conditions were cold, snowwas falling, and the winds were shifting during the event. The roads were wet and icy.
CONSEQUENCES
Approximately 2,300 people within a 5.2 km2 (2 mi2) area were evacuated from their businessesand homes after a railcar containing approximately 310,000 kg (141,000 lb) of sulfur dioxidecaught fire. There were no fatalities or injuries from the incident or the evacuation. Theestimated total cost of the evacuation-related expenses is unknown.
EMERGENCY RESPONSE
Decision MakingThe level of cooperation among local, state, and federal agencies was high, and politicalboundaries were not crossed in this event. The command, control, and coordination processescould best be described as pre-planned. The decision to evacuate was made by the Oshkosh FireChief, and there were no problems with the decision-making process.
D-140
CommunicationsAn EOC and an ICP were used in this emergency. Communication among field emergencyresponders and the ICP was by radio and cell phone. There were no problems withcommunications during the event.
Notification and WamingSenior local officials were notified of the incident by telephone in accordance with the EOC planand emergency responders were notified through the 911 phone system. There were noproblems with the notification of emergency personnel or senior local officials. The elapsedtime between discovery of the incident and mobilization of response personnel was less than 15minutes, and the initial decision to evacuate was made less than 30 minutes after the firedepartment reached the scene. It took approximately three hours to complete the evacuation,which started with a local area and expanded to approximately 2,300 people.
The public was notified by radio and television broadcasts, by police going door to door, andwith a reverse 911 system. The evacuation was staged and completed within approximatelythree hours. Some people did evacuate before being told to do so, and some people refused toevacuate.
Traffic Movement and ControlEvacuees were given instructions on where to go and were told which routes to use. Theseroutes were designated by police barricades. There were no special institutions evacuated. Roadconditions during the evacuation were wet, but no traffic accidents or traffic-related problemsoccurred during the event. Reverse-laning was not used.
Congregate Care CentersCongregate care centers were established at local schools for this emergency and were managedby the Red Cross. There were shadow evacuations; however, this did not have an impact oncongregate care center capacity or the evacuation.
Law EnforcementPolice and the sheriff secured the area following the evacuation, and there were no instances oflooting or vandalism or any problems with law enforcement.
Re-EnrRe-entry was authorized as a joint decision among the EPA, Department of Natural Resources,and the Fire Chief. Re-entry was controlled and took longer than expected because the EPAwanted to monitor each household before allowing re-entry. Evacuees were compensated fortheir expenses.
D-141
INVESTIGATOR COMMENTS
The cooperation of citizens and multiple means of notification were helpful in making thisevacuation a success. It was learned that the radio and cable interrupt did not work very well.The fact that some residents, especially those close to the site, had prior knowledge of hazardshelped in this evacuation.
CONTACT INFORMATION
Contacts
Oshkosh Fire Chief(920) 236-5240
D-142
Norfolk Southern Railway Derailment, Farragut, Tennessee,September 15, 2002, ID #73
On September 15, 2002, a train derailed in Farragut, Tennessee, just south of Knoxville, andspilled more than 45,460 L (10,000 gal) of sulfuric acid. Approximately 3,000 people wereevacuated within a 9.6 km2 (3.7 mi2) evacuation zone, and another 8,000 people were under avoluntary evacuation notice. The evacuation occurred in a rural area of Tennessee in the TurkeyCreek and Farragut communities. There were no fatalities from the accident and only minorinjuries, which included skin and lung irritation from exposure to the sulfuric acid.
COMMUNITY CONTEXT
GeneralFarragut is an affluent suburb of Knoxville located in Knox County, Tennessee. The town ofFarragut is a suburban community with a mayoral form of government. It has a population ofapproximately 17,720 people and covers an area of 42.1 km2 (16.2 mi2). Its main economic baseis government employment, retail trade, and manufacturing.
On September 15, 2002, approximately 3,000 people were evacuated in a 2.1 km (1.3 mi)rectangular grid, totaling approximately 9.6 km2 (3.7 mi2), after a train derailment in thecommunity of Farragut. The area was lightly congested at the time of the evacuation. TheRural/Metro Fire Department has estimated, based on census data and rough calculations, thatthere were approximately 8,700 people in the region that was evacuated, equating toapproximately 35% of the area being evacuated.
The evacuation area was primarily residential (suburban area). Ethnicity, nationality, and agewere not important factors in the evacuation. Knoxville is more than 80 km (50 mi) from thenearest commercial nuclear power plant, the Watts Bar I in Spring City, Tennessee. Oak RidgeNational Laboratory, which has nuclear reactor facilities, is approximately 32 km (20 mi)northwest of the evacuation but was not involved in the event.
D-143
History of EmergenciesThe area is likely no more prone to hazards than average. Although the emergency responseteams were aware of the potential for railroad cargo to be hazardous, the residents, in general,were unaware of the potential hazards. The emergency response teams have had someexperience with small chemical spills and railcars off track, but this was the first large-scaleevent in the community.
Emergency PreparednessThe community's emergency preparedness activities include planning, training, drills andexercises, and community awareness as described below.
PlanningKnoxville County has an active emergency response plan that was developed to meet theSuperfund Amendments and Reauthorization Act (SARA) Title III requirements. The planaddresses evacuations in a general sense but does not specify routing or have evacuation timeestimates and does not conform to NUREG-0654/ FEMA-REP-1, Rev. 1. As part of the SARATitle III requirements, the community was required to establish a Local Emergency PlanningCommittee (LEPC). The Knox County LEPC is an active organization with representatives fromthe area law enforcement, fire protection, and railroad personnel. The working relationship ofthis committee contributed to the success of this evacuation.
TrainingTraining is provided to emergency response personnel. Training is conducted jointly with therailroad, and a few months before the event, site training was conducted at the Norfolk Southernswitchyard. Most training was directed toward problems at the switchyard and was not directlyrelated to train derailment. In addition, the incident command structure for emergency responsewas practiced at least annually.
Drills and ExercisesThe Knox County emergency response agencies regularly conduct emergency drills andexercises and had previously tested their emergency procedures in full-scale field exercises inthe Norfolk Southern switchyard facility. These drills included hazmat practice, but were notfocused on train derailments.
Community AwarenessThe community does not have chemical plants or manufacturing facilities in the area. Thecommunity's level of awareness of local hazards and evacuation procedures was low. Thecommunity's level of awareness about the hazard that caused the evacuation and about thealerting methods used was also low.
D-144
THREAT CONDITIONS
On September 15, 2002, a Norfolk Southern train derailed as it was en route from Allentown,Pennsylvania, to Birmingham, Alabama. The train had 141 cars and three locomotives, of which24 cars and two locomotives derailed. More than 45,461 L (10,000 gal) of sulfuric acid spilledfrom a ruptured tank, forming a heavy cloud of hazardous gas that spread over the area. Some ofthe acid leaked into Ft. Loudoun Lake along the Tennessee River and reacted violently. Theincident and the evacuation took place in the middle of the morning. It was overcast outside, andthe roads were clear and dry.
During the initial response, emergency personnel were placing soda ash on the spill. Thisapproach was not effective, and officials with Norfolk Southern Railway called in a Pittsburgclean-up crew that specialized in sulfuric acid.
CONSEQUENCES
Approximately 20 evacuees and one emergency worker complained of minor skin and lungirritation and were taken to the hospital as a result of the sulfuric acid leaking from the trainderailment. There were no fatalities associated with the incident. Approximately 3,000 peoplewere evacuated within a 2.1 km (1.3 mi) rectangular grid downwind of the incident, and another8,000 people were put on voluntary evacuation notice. Seven public schools in the Knox Countyschool system were cancelled because of the incident. There were multiple agencies involved inthe evacuation and no cumulative costs were compiled for this event.
EMERGENCY RESPONSE
Decision MakingThe level of cooperation among local, state, and federal agencies was very good. Some of theonsite agencies included the EPA, U.S. Coast Guard, FBI, the Farragut Fire Marshal, theRural/County Fire Chief, and the Knox County Sheriff. The train derailment occurred near theborder of Farragut and Knox Counties. However, many of these agencies work togetherroutinely and have interagency training so the response was not impacted by the location. Thecommand, control and coordination processes could best be described as pre-planned andfollowed the written emergency plan. The Rural/Metro fire chief made the decision to evacuate,and there were no problems with the decision-making process.
CommunicationsThe Knox County Sheriff's Office EOC was utilized as the central command. An ICP wasestablished approximately 0.8 km (0.5 mi) from the incident to coordinate activities. Fieldemergency responders communicated via radio and cell phone, and there were no problemsidentified with communications. There were multiple cell phones available onsite making cellphones the preferred means to communicate with the EOC.
D-145
Notification and WarningThe train derailment was originally reported through the local 911 emergency system. Seniorlocal officials were notified by the Farragut Fire Marshal. Emergency responders were notifiedof the incident by phone and mobilized immediately. There were no problems with notificationof emergency personnel or senior local officials.
The decision to evacuate was made within approximately 45 minutes of the event. After noticeto evacuate, it took approximately two hours to complete the evacuation of the area. The publicwas notified to evacuate through use of a reverse 911 call-back system and through the use ofpatrolmen going door to door in some areas. The evacuation took place all at once with veryinfrequent incidents of residents refusing to leave. One area of the evacuation was in an areawith a high concentration of the sulfuric acid. The hazmat team had to go to approximately fourresidences in that area and evacuate invalids using an ambulance. There was also a bike toursponsored by the Multiple Sclerosis Society that had cyclists traveling near the affected area.The bike tour officials were alerted and called off the remaining portion of the tour.
Traffic Movement and ControlEvacuees were informed of the congregate care center locations when the evacuation notice wasgiven. However, most of the residents in this affluent neighborhood chose to go to friends,relatives, or hotels rather than to congregate care centers. Specific routes were designated bypolice barricades and policemen directing traffic. No special institutions were evacuated. Mostof the roads in the area are two lanes; conditions were dry, traffic moved smoothly, and theevacuation proceeded well. Some people evacuated before receiving notice, and many peoplewere in church at the time and just stayed out of the area.
Congregate Care CentersThe Red Cross immediately established four congregate care centers. These included theTokesbury Methodist Church, Blount Christian Church, Beardon High School and the Red Crossfacility. Two of the congregate care centers closed at 9 p.m. the first evening. The remainingtwo congregate care centers closed the following morning as people were allowed to go home.There were 200 people registered at the congregate care centers, representing less than 7% of theevacuated population. There was no obvious impact from shadow evacuations.
Law EnforcementLocal law enforcement brought in additional crews to patrol the evacuated area, and there wereno instances of looting or vandalism. No problems were identified with law enforcement.
Re-EntryRe-entry was allowed after a joint decision by the incident commander and emergency responseofficials on September 16, 2002, with re-entry to some areas being allowed on September 17,2002. The media was used to inform residents that it was safe to return and there were nospecial controls in place during re-entry. Norfolk Southern established a hot line to reimburseevacuees for their expenses. There were no problems associated with re-entry.
D-146
INVESTIGATOR COMMENTS
According to the Rural/Metro fire chief, the evacuation worked well because of the high level ofcooperation among agencies established through the LEPC, the planning efforts of theemergency management team, and the training program for the emergency response personnel.He did state that it is important to inform residents of how long they would be gone to allowthem to gather medicines, take pets, and turn off appliances. In this evacuation, emergencypersonnel did not inform residents of the duration and had to make some special trips into theevacuation zone to retrieve pets and medicine.
CONTACT INFORMATION AND REFERENCES
Contacts
Farragut Fire Marshal(865) 675-2384(Personal Communication, July 2003)
Rural/Metro Fire Chief(865) 531-2058(Personal Communication, July 2003)
References
American Red Cross News. "Thousands evacuated after Tennessee train derailment."September 16, 2002. <http://www.nyredcross.org/news/2002/020916_derailment.asp> (June2003).
Bender, Annett. "Knoxville churches affected by tanker spill." The Call. September 27, 2002.<http://www.holstonconference.com/thecall/archives/09-27-02/02 sept27_derailment.html>(June 2003).
Disaster Relief. "Thousands evacuated after Tennessee train derailment." September 16, 2002.<http://www.disasterrelief.org/Disasters/020916TennTrain/> (June 2003).
Jacobs, Don and J. J. Stanbaugh. "Toxic Fumes force Thousands to Flee." News-Sentinel.September 16, 2002.<http://www.stevequayle.com/News.alert/AmericaGeneral/020916.TN.toxic.fumes.html>(June 2003).
The Jefferson City News Tribune Online Edition. "Thousands flee after train derails, acidspilled near Knoxville, Tenn." September 16, 2002.<http://newstribune.comn/stories/091602/wor_ 0 9 1 60 20 0 51 .asp> (June 2003).
D-147
WBIR.com. "Neighborhoods evacuated after train derails spilling sulfuric acid." September 16,2002. <http://www.wbir.com/News/news.asp?IDX9183> (June 2003).
D-148
Pipeline Rupture, North Attleboro, Massachusetts, December 9,1995, ID #19
On December 9, 1995, a 40 cm (16 in) natural gas main was ruptured after being hit at a nearbyconstruction site by a bulldozer. Approximately 40,000 people were evacuated within a 2.6 km(I mi) radius of the incident in North Attleboro, Massachusetts, including 25,000 from EmeraldSquare Mall, 15,000 from surrounding strip malls, and several hundred nearby homes. Theevacuation occurred in a highly congested area with a lot of pedestrian traffic. There were minorinjuries to the bulldozer operator and no fatalities associated with the incident.
COMMUNITY CONTEXT
GeneralThe town of North Attleboro, Massachusetts, is an affluent suburban community with a mayoralform of government. It has a population of approximately 27,000 people and covers an area of49.3 km2 (19 mi2). Its main economic base is retail, which attracts a large number of non-residents to area stores and strip malls. On December 9, 2003, approximately 40,000 peoplewere evacuated from an 8.1 km2 (3.14 mi2) area after a natural gas main was ruptured.Approximately 25,000 people were evacuated from Emerald Square Mall and 15,000 peoplewere evacuated from the surrounding strip malls and from the several hundred nearby homes.The area was highly congested at the time of the evacuation. It is difficult to determine preciselywhat percentage of the community was evacuated, since many of the evacuees from the mallwere not residents of the area. It is estimated that approximately one-quarter of the residentswere evacuated. However, as much as one-half of the people present in the community at thetime, including both visitors and residents, were evacuated. The evacuation area was primarilycommercial/retail. Ethnicity, nationality, and age were not important factors in the evacuation.The town is located approximately 40 to 48 km (25 to 30 mi) from a commercial nuclear powerplant, the Pilgrim I Boiling Water Reactor at the Energy Nuclear Power Plant in Plymouth,Massachusetts.
History of EmergenciesThe area is likely no more prone to hazards than average. The community did not have any priorexperience with the hazard that led to this evacuation. The local fire chief stated that he had "notseen anything like this in twenty years." The community had not experienced any evacuations in
D-149
the previous 10 years, and it is unknown whether the community had any prior experience withthe alerting mechanism used in this evacuation.
Emergency PreparednessThe community's emergency preparedness activities include planning, training, drills andexercises, and community awareness as described below.
PlanningNorth Attleboro had a written emergency plan that contained an evacuation section. In addition,the Emerald Square Mall had an evacuation plan. Both plans were used in this emergency. Theplans probably did not conform to NUREG-0654/FEMA-REP-1, Rev. 1, and it is unknown ifthey contained evacuation time estimates.
TrainingTraining is provided to emergency response personnel and joint training between industry andgovernment is conducted annually.
Drills and ExercisesNorth Attleboro's emergency response agencies regularly conduct emergency drills andexercises but had not previously tested their emergency procedures in a full-scale field exercise.Immediately before this evacuation, they likely performed a "mock disaster drill" (i.e., afunctional drill).
Community AwarenessThe community's level of awareness about local hazards and about evacuation procedures waslikely average. The community's level of awareness about the hazard that caused the evacuationand the alerting methods used was probably average.
THREAT CONDITIONS
The hazard that led to this evacuation was the rupture of a 40-cm (16-in) natural gas pipelinebelonging to Algonguin Natural Gas. The gas main was struck by a bulldozer operator who wasworking at a construction site near a Wal-Mart Store. The incident occurred on a cold andsnowy Saturday during the height of the Christmas shopping season. Several eyewitnessescommented that it sounded like a jet taking off. The incident and the evacuation took place inthe middle of the afternoon. It was cold outside and the roads were wet. The evacuation wasslightly hampered by both the snowstorm and the high level of pedestrian traffic. The localnewspaper reported that it resembled a war scene.
D-150
CONSEQUENCES
On December 9, 1995, at approximately 1:20 p.m. a 40-cm (16-inch) natural gas main wasruptured and within 10 minutes an evacuation was initiated. There was one reported injury (tothe bulldozer operator) and no fatalities associated with the incident. Approximately 40,000people were evacuated within a one-mite radius. The estimated total cost of the evacuation tothe pubic was minimal.
EMERGENCY RESPONSE
Decision MakingThe level of cooperation among local, state, and federal agencies was high. However, nopolitical boundaries were crossed. The command, control and coordination processes could bestbe described as ad hoc. The North Attleboro fire chief made the decision to evacuate, and therewere no problems with the decision-making process.
CommunicationsAn EOC, including an ICP, was used in this emergency. Field emergency responderscommunicated via radio and no problems were identified with communications.
Notification and WarningSenior local officials and emergency responders were notified of the incident by phone. Therewere no problems with notification of emergency personnel or senior local officials. Emergencyresponse personnel mobilized immediately. The decision to evacuate was made in less than 10minutes. It took up to one hour to complete the evacuation. The public was notified to evacuateby fire engine sirens and a police/fire PA system. The evacuation took place all at once, andthere were no special problems regarding warning and subsequent citizen action.
Traffic Movement and ControlEvacuees were given specific instructions about where to go when they evacuated and were toldto use specific routes that were designated by police barricades and policemen directing traffic.No special institutions were evacuated. Road conditions were wet and snowy. Some majorroadways were unavailable because of the hazard. However, traffic moved relatively smoothlyand the evacuation proceeded faster than expected. There was no time for people to evacuatebefore being told to do so. Traffic was reverse-laned and there were no reported traffic accidentsduring the evacuation. No one refused to evacuate.
Congregate Care CentersThree congregate care centers were used. It is unknown who managed those congregate carecenters, but it may have been response personnel. High schools were used as congregate carecenters and the length of stay was less than 2.5 hours. It is unknown what percentage of theevacuees went to congregate care centers. Presumably, all of the out-of-town shoppers would
D-151
have gone home, leaving only the local residents to go to the congregate care centers. Therefore,it was a very low percentage. There were no shadow evacuations.
Law EnforcementThe area was secured by the police, and there were no instances of looting or vandalism. Noproblems were identified with law enforcement.
Re-EntyThe North Attleboro fire chief lifted the evacuation order after 1.5 hours and there were nospecial controls in place during re-entry. However the stores remained closed. Evacuees werenot compensated for their expenses. There were no problems associated with re-entry.
CONTACT INFORMATION AND REFERENCES
Contacts
North Attleboro Fire Chief (former)North Attleboro Fire Department50 Elm StreetP.O. Box 904North Attleboro, MA 02761(508) 699-0140 (phone)(508) 643-0296 (fax)
References
"Mall Evacuated." Associated Press. December 9, 1995.
Skerner, S. "Thousands Flee After Explosion at NA Gas Line." The Sun Chronicle. December10, 1995.
D-152
Twin City Foods Plant, Arlington, Washington, May 12,2002, ID #69
On May 12, 2002 (Mother's Day), there was an ammonia spill at the Twin City Foods Plant inArlington, Washington. The spill prompted authorities to evacuate approximately 1,500 peoplewithin a 2.6 km2 (1 mi2) area. Two individuals suffered minor injuries from the accident. Theleak was thought to be the result of an attempted theft of the ammonia for use in illegally makingmethamphetamine.
COMMUNITY CONTEXT
GeneralArlington, Washington, is a city of approximately 1 1,713 people, based on the 2000 Census. OnMay 12, 2002, approximately 1,500 people, or slightly more than 12% of the population, wereevacuated from a suburban community in Arlington because of the ammonia leak at the TwinCity Foods Plant. Arlington is a small community approximately 90 miles north of Seattle. Thecity covers 19.6 km2 (7.6 mi2). The evacuated area covered 2.6 km2 (I mi2). The populationdensity during the evacuation was average (medium). Ethnicity, nationality, and age were notimportant factors in the evacuation.
Arlington has a mayoral form of government and its main economic base is manufacturing/industry and commercial/retail/services. There are no special characteristics that attract largenumbers of non-residents. There are no commercial nuclear power plants within 80 km (50 mi)of Arlington. The state of Washington does have a commercial nuclear power plant located inthe southeastern portion of the state near Hanford.
History of EmergenciesArlington is more prone to technological hazards than average because of the local industry,highway and rail, gas pipeline, etc. It is also more prone to natural disasters, includingearthquakes and flooding. The community had no prior experience with the hazard that led tothis evacuation; no evacuations in the previous ten years; and no previous experience with thealerting mechanism used in this evacuation.
D-153
Emergency PreparednessThe community's emergency preparedness activities include planning, training, drills andexercises, and community awareness as described below.
PlanningArlington has a written emergency plan that is based on the template provided in the WashingtonState Comprehensive Emergency Management Plan (CEMP). The Arlington plan was used inthis emergency; however, it does not contain an evacuation section and does not conform toNUREG-0654/FEMA-REP-1, Rev. 1.
TrainingTraining is provided to emergency response personnel, and joint training between industry andgovernment is regularly conducted.
Drills and ExercisesArlington's emergency response agencies regularly conduct emergency drills and exercises butthe emergency plan used in this evacuation was not previously tested in a full-scale fieldexercise.
Community AwarenessThe level of community awareness of local hazards, with evacuation procedures, and of thealerting methods used is average (medium). The level of community awareness about the hazardthat caused the evacuation was low.
THREAT CONDITIONS
The threat condition leading to the evacuation was a spill of ammonia at the Twin City FoodsPlant. Around 12:30 p.m. on May 12, 2002, a passerby noticed an ammonia odor and called91 1. Approximately 4,546 L (1,000 gal) of ammonia had been released. Ammonia is a toxic,reactive, and corrosive gas. In higher concentrations, ammonia can be fatal.
It was Mother's Day and the weather at the time of the incident was sunny, calm and warm andthe roads were clear and dry. There were no unusual circumstances that occurred during thisincident, other than the hazard.
CONSEQUENCES
Approximately 1,500 people, or slightly more than 12% of the population, were evacuated.There were no deaths or injuries due to the evacuation and no deaths related to the hazardousammonia spill. However, two people were treated at the local hospital for eye and throatirritation. The estimated total cost of the evacuation to the pubic was approximately $20,000.
D-154
EMERGENCY RESPONSE
Decision MakingThe level of cooperation among local, state, and federal agencies was high. Multiple agencieswere involved, including the Snohomish County Regional Hazmat Team, American Red Cross,State Police Patrol, and the Arlington Police and Fire Departments. Political boundaries werenot crossed. Command, control and coordination processes could best be described as pre-planned. The decision to evacuate was made by the Incident Commander in coordination withthe on-duty police and fire personnel. There were no problems associated with the decision-making process.
CommunicationsAn EOC was not used. However, an ICP was used and communication between the fieldemergency responders and the ICP was via radio, cell phone, and face-to-face contact. Therewere no problems with communications.
Notification and WarningSenior local officials were notified of the incident by pager and telephone. Emergencyresponders were notified through the 911 system. There were no problems with notification ofeither local officials or responders. Emergency response personnel mobilized within 15 minutesof discovery of the incident, and the decision to evacuate was made within 30 minutes of thestart of the incident. It took approximately one hour to complete the evacuation. The public wasnotified by a Police/Fire PA System and by emergency personnel going door to door to notifyresidents to evacuate. The evacuation took place all at once. There were no special problemswith warning and subsequent citizen action.
Traffic Movement and ControlEvacuees were told what congregate care centers to go to and which routes to take, which weredesignated by police barricades. No special institutions were evacuated. Road conditions priorto the evacuation were clear and dry; however, major roadways (State Routes 9 and 530) wereunavailable for use because of the hazard. Some people evacuated before being told to do so.Reverse-laning was not used. There were no traffic accidents during the evacuations. Somepeople refused to evacuate.
Congregate Care CentersCongregate care centers were managed by the Red Cross and included schools. However, therewas a delay in the arrival of the Red Cross. Fewer than 20 people (or 1% of evacuees) registeredat the congregate care centers. There were no shadow evacuations.
Law EnforcementThe evacuated area was secured by the police, and there were no instances of looting orvandalism and no problems with law enforcement.
D-155
Re-EntnrThe Arlington Fire Chief authorized re-entry approximately five hours after the start of theincident. There were no special controls associated with re-entry and no major problems withre-entry. Evacuees were not compensated for their expenses.
INVESTIGATOR COMMENTS
According to the Arlington fire chief, the evacuation worked well because of the high level ofcooperation among agencies and because the command system worked well.
CONTACT INFORMATION AND REFERENCES
Contacts
Arlington Fire Chief(360) 403-3600(Personal Communication, June 27, 2003)
References
Hadley, J. and C. McGann. "1,500 People Evacuated in Arlington during Ammonia Scare."Seattle Post-Intelligencer. May 13, 2002.<http://seattlepi.nwsource.com/local/70190 arlingtonl 3.shtml> (June 2003).
Washington State Comprehensive Emergency Management Plan (CEMP), Edition II, May 2002.
D-156
Train Derailment, Prichard, Alabama, March 25, 1994, ID #95
On March 25, 1994, 13 cars from a train derailed in the early morning hours in Prichard,Alabama, spilling a tanker loaded with chlorine, a toxic chemical, and resulting in the evacuationof approximately 2,000 people. There were no deaths or injuries related to the incident.
COMMUNITY CONTEXT
GeneralPrichard is a city located in Mobile County, Alabama, with a population of 28,633 people.Approximately 2,000 residents (7% of the population) were evacuated. Land use in the area wasprimarily residential. The total area of Prichard is 66 km2 (25.5 mi2) and the evacuated area was10.36 km2 (4 mi2). The population density of the area during the evacuation was high.Ethnicity, nationality, and age were not important factors in the evacuation.
Prichard has a mayoral form of government, and its main economic base is commercial services.There are no special characteristics that attract a large number of non-residents to the area.Prichard is approximately 200 miles away from the nearest commercial nuclear power plant,which is Farley Nuclear Power Plant.
History of EmergenciesBecause Prichard has a major highway (1-65) running through it and because it is located in ahurricane-prone state, it is more prone to both natural disasters and technological hazards thanthe average U. S. city. It is unknown whether the community had prior experience with the typeof hazard that led to this evacuation. The community had experienced evacuations in theprevious 10 years, but they were on a much smaller scale. The community has also had previousexperience with the alerting mechanisms that were used in this evacuation.
Emergency PreparednessThe community's emergency preparedness activities include planning, training, drills andexercises, and community awareness as described below.
D-157
PlanningThe community did not have a written emergency plan.
TrainingTraining is provided to emergency response personnel and joint training between industry andgovernment is conducted annually.
Drills and ExercisesThe community's emergency response agencies do not regularly conduct emergency drills andexercises.
Community AwarenessThe level of community awareness of local hazards was low and the level of communityawareness regarding the hazard that caused this evacuation was also low. The level ofcommunity awareness about evacuation procedures was average as was the level of communityawareness about the alerting methods used during the evacuation.
THREAT CONDITIONS
The threat conditions leading to this evacuation consisted of 13 train cars derailing, one of whichspilled chlorine, a hazardous liquid. The derailment was believed to have been caused bynegligence on the part of the rail operator.
CONSEQUENCES
Two thousand residents were evacuated from their homes and businesses on the evening ofMarch 25, 1994. No deaths or injuries were associated with the hazard or with the evacuation.The estimated total cost of evacuation-related expenses incurred by the public is unknown.
EMERGENCY RESPONSE
Decision MakingThe level of cooperation between local, state, and federal agencies was high. No politicalboundaries were crossed. The command, control, and coordination processes could best bedescribed as ad hoc. The decision to evacuate was made by the Prichard fire chief and therewere no problems with the decision making process.
CommunicationsAn EOC was not used but a field ICP was used. Communication between field emergencyresponders and ICP was by radio. There were no problems with communication.
D-158
Notification and WarningSenior local officials were notified of the incident through dispatch and phone trees. Emergencyresponders were notified of the incident through the 911 phone system. There were no problemswith notification between senior local officials and emergency response personnel. The elapsedtime between the discovery of the incident and the mobilization of response personnel was lessthan 15 minutes and the decision to evacuate was made in 15 minutes. It took approximately 45minutes to complete the evacuation. The public was notified to evacuate by emergency responsepersonnel going door to door. The evacuation took place all at once, and there were no specialproblems regarding warning and subsequent citizen action.
Traffic Movement and ControlIt is unknown whether people were given specific instructions about where to go when theyevacuated or whether they were told to use specific routes. No special institutions wereevacuated. Road conditions before the evacuation were dry; there were no traffic accidents ortraffic problems, and all major roadways were available to evacuees. Reverse-laning was notused. No one spontaneously evacuated before being told to do so and no one refused toevacuate.
Congregate Care CentersThe American Red Cross set up congregate care centers. It is unknown how many evacueesused the congregate care centers. There were no shadow evacuations.
Law EnforcementPolice secured the area following the evacuation and there were no instances of looting orvandalism or any problems with law enforcement.
Re-EntryA joint decision between the mayor and fire chief authorized re-entry at 12 p.m. on March 25,1994. No special controls were used during the re-entry process and no major problemsoccurred during re-entry. Evacuees were not compensated for their expenses.
INVESTIGATOR COMMENTS
According to the Prichard fire chief, the good response and cooperation of residents and thepublic's prior knowledge of hazards and evacuations contributed to the success of theevacuation. However, one lesson learned is that the setup and mobility of the ICP needs to beimproved. No unusual circumstances occurred during this incident other than the hazard itself.
D-159
CONTACT INFORMATION AND REFERENCES
Contact
Prichard Fire Chief(251) 452-7823(Telephone Conversation, 8/19/03)
References
Prichard, Alabama. From Wikipedia, the Free Encyclopedia.<http://www.wikipedia.org/w/wiki.phtml?title=Prichard%2CAlabama&printable=yes
D-160
Burlington Northern Railroad Derailment, Superior, Wisconsin, June 30, 1992, ID #16
On June 30, 1992, a Burlington Northern Railroad freight train derailed as it approached a bridgeover the Nemadji River in Douglas County near the Town of Superior, Wisconsin. The railcarwas on its way from Novacor Chemical Ltd. in Alberta, Canada to Chicago, where its contentswas going to be used to manufacture rubber. Fourteen freight cars derailed, including three tankcars that contained hazardous materials. About 99,332 L (21,850 gal) of aromatic concentratesspilled into the river. The more volatile constituents of the aromatic concentrates evaporatedfrom the surface of the river and formed a vapor cloud about 32 km (20 mi) long and 8 km (5mi) wide that resulted in the evacuation of more than 40,000 people from the City of Superior,Wisconsin, from Duluth, Minnesota, and from surrounding areas. A large-scale, stagedevacuation was initiated and generally progressed smoothly. There were some injuries as adirect result of the evacuation; however, none of these were life threatening and governors fromboth states praised the public for their orderly departure.
COMMUNITY CONTEXT
GeneralOn June 30, 1992, at 2:50 am. a Burlington Northern freight train derailed in Douglas County,Wisconsin near the City of Superior. The hazardous plume resulted in the evacuation ofapproximately 40,000 people from the following communities: Douglas County, the Town ofSuperior, and the City of Superior, Wisconsin; and Duluth, Cloquet, Carlton, Wrenshall, andEsko, Minnesota. According to written reports there was substantial compliance with theevacuation. The Town of Superior is a rural community located immediately south of the Cityof Superior across Superior Bay from Duluth. Duluth is a more urban and a more heavilypopulated area.
The size of Douglas County is 3,833 km2 (1,480 mi2); it has a population of approximately43,000. The population density during the evacuation, primarily in Duluth, was high. The Cityof Superior has a mayoral form of government. Its main economic base is commercial, retail,and service industries with some industrial facilities. Ethnicity, nationality, and age were notimportant factors in the evacuation. The nearest commercial nuclear plant, Monticello, islocated near Minneapolis, Minnesota, more than 80 km (50 mi) from the incident. The
D-161
evacuation did not impact operations and did not enter the emergency planning zone (EPZ) ofthe reactor.
History of EmergenciesThe Douglas County region is more prone to hazards than the average community. There is arefinery and tank farm in the City of Superior, along with the railroad activities. Approximatelyone year before this event, one of the same railcars that derailed had a leak at the rail yard,requiring an emergency response but not an evacuation. The Douglas County emergencymanagement coordinator and the City of Superior chief of police said there had been no previousevacuations before this event, and the alerting mechanism had not been utilized in the past.
Emergency PreparednessThe community's emergency preparedness activities include planning, training, drills andexercises, and community awareness as described below.
PlanningDouglas County, Wisconsin, and Duluth, Minnesota, both have emergency management plans.The Douglas County disaster plan was activated for this event and had been reviewed by theWisconsin Department of Military Affairs, Division of Emergency Response and had beenapproved as meeting all federal and state emergency planning requirements. The latestcertification of the county disaster plan before the accident occurred March 1, 1992.
The Duluth disaster planning was included within the St. Louis County, Minnesota, disasterplan. This plan was reviewed by a Regional Review Committee for the Minnesota Departmentof Public Safety, and was approved as meeting all federal and state emergency planningrequirements. The St. Louis County disaster plan was not activated during this emergencyresponse.
The Douglas County plan did not address evacuation organization, communication, or routing.According to the City of Superior chief of police, there was confusion over who made decisionsduring the early development of the EOC. However, the decision issues were quickly resolved.There was no ETE in the plan, and it is difficult to estimate the total time for the evacuationbecause it covered multiple communities and was being conducted by separate policedepartments throughout the day. The emergency plans likely did not meet the requirements ofNUREG-0654/FEMA-REP-1, Rev. 1.
There was no hesitation in establishing an ICP at approximately 3:30 a.m. 3.2 km (2 mi) north ofthe accident site. Based on the Douglas County disaster plan, the fire chief became the incidentcommander (IC) and the patrol commander became the law enforcement on-scene coordinator.Later in the morning when the plume was headed for Duluth (about 8:00 a.m.), Duluth and St.Louis County safety officials established a joint EOC. A Duluth police department lieutenantbecame the incident commander for the Minnesota response.
D-162
TrainingThe Burlington Northern Railroad had an active training program. When the train conductorradioed the 28th Street yard, a Burlington Northern trainmaster was dispatched immediately tothe site, and the yardmaster called the Douglas County Communication Center (91 1),CHEMTREC, Wisconsin Department of Emergency Management, the City of Superior policeand fire departments, and appropriate Burlington Northern officials. CHEMTREC is theChemical Transportation Emergency Center operated by the Chemical Manufacturer'sAssociation; it was established to provide initial and immediate information on handlinghazardous materials and chemicals.
According to the Douglas County Emergency Coordinator and the City of Superior Chief ofPolice, response teams had training in emergency response. This training included frequent, butnot necessarily annual training and exercises in the handling of hazardous materials and railcarleaks. The training level of the county responders was described as being at the awareness levelwhile the training for the city responders was described as being at the technician level.
Drills and ExercisesDouglas County and the City of Superior conducted exercises with hazardous materials andrailcar leaks before this event. In January 1991, Wisconsin and Minnesota emergencyorganizations conducted a tabletop exercise simulating a train derailment and materials spill intothe Mississippi River on the border between the two states. The emergency notificationcoordination was tested in June 1991 during a joint, full-scale exercise involving a simulatedtrain derailment and hazardous materials spill into the Mississippi River. The county had lastconducted a hazardous materials disaster drill on September 28, 1991.
Community AwarenessThe community was very aware of technical hazards and is even more aware today. There is arefinery and tank farm in the City of Superior along with the railroad activities. However, therehad not been evacuations in the past, so the community was not aware of the alerting methodsthat were used in the evacuations.
THREAT CONDITIONS
On a calm morning, June 30, 1992, at approximately 2:50 a.m. a Burlington Northern Railroadfreight train derailed as it approached a bridge over the Nemadji River in Douglas CountyWisconsin. Three tank cars contained hazardous materials including aromatic concentrates,liquid petroleum gas (LPG), and crude butadiene. The three tank cars fell about 71 feet, withone landing in the river and two landing in a flood plain adjacent to the river. About 99,332 L(21,850 gal) of aromatic concentrates spilled into the river.
Based on discussions with the manufacturer (Novacor) and information available fromemergency guides, the Town of Superior fire chief, in coordination with the Douglas Countypatrol commander, decided that the damaged and leaking crude butadiene represented the worst
D-163
threat. At that time, about 3:40 a.m., a 2.6-km (i-mi) area around the accident site wasevacuated. At around 5:30 a.m., Douglas County personnel reported to the EOC observation ofan oil-like sheen downriver from the accident. The sheen extended several miles downriver andwas traveling toward the City of Superior and Lake Superior. Following this observation andfurther telephone consultation with Novacor, the IC decided to expand the evacuation area from2.6 km (I mi) around the accident to 2.6 km (I mi) on each side of the river in a downriverdirection. This evacuation extended into the town of South Superior and into the southeasternpart of the city of Superior.
The Civil Air Patrol was called in and spotted a massive vapor cloud that had formed over theNemadji River downriver from the site. At approximately 6:20 am., the Douglas County EOCnotified the Duluth police department about the accident and the vapor cloud moving towardDuluth. The City of Superior police notified Minnesota Point of the accident andrecommendations to evacuate. Local officials in Minnesota Point were aware of the event andhad already initiated evacuation orders.
The morning was calm, and the chemical haze did not dissipate as it drifted across the cold waterof Superior Bay. As the day warmed, the volume of the gas increased, moving up the Duluthhillside like a Lake Superior fog. In mid-afternoon, a wind off the lake blew the toxic haze awayfrom Duluth's East End and Park Point and into Superior, causing substantial evacuations there.
The more volatile constituents of the aromatic concentrates evaporated from the surface of theriver and formed a vapor cloud about 32 km (20 mi) long and 8 km (5 mi) wide. A total of morethan 40,000 people were evacuated from Douglas County; the Town of Superior; the City ofSuperior, Wisconsin; from Duluth, Minnesota; and from surrounding areas. Most of theevacuations occurred during the early morning, with the last notices to evacuate occurringaround 1:30 p.m. The weather was hot and dry and the roads were dry. By mid-afternoon, itstarted to rain, helping to dissipate the vapor cloud.
CONSEQUENCES
The derailment prompted one of the largest technical hazard evacuations in history. Winds firstcarried a strong smelling bluish haze into eastern Duluth and as far north as Hermantown andTwo Harbors. Then the winds shifted, blowing the plume southwest into the St. Louis RiverValley to communities such as Cloquet, Carlton, Wrenshall, and Esko, where some people werealso evacuated.
More than 100 injuries were reported as a result of the release of the hazardous material andresulting evacuation. Most people complained of sore throats, headaches, and difficultybreathing. At least six people were admitted to the hospital; most were treated and released.Approximately 35 police and fire fighting personnel who were aiding in the evacuation activitiesat nursing homes, health care homes, and patrolling road blocks in the evacuated areas weretreated for dizziness and eyes, nose, and throat irritations at area hospitals. Their injuries were a
D-164
direct result of supporting the evacuation. According to the Chief of Police of the City ofSuperior, the patrolmen did not have respirators.
EMERGENCY RESPONSE
Decision MakingThe level of cooperation among local, county, state, and railroad agencies was very high, withdecision-making authority changing hands in mid-morning. Some of the local, state and federalagencies involved in this emergency included the Douglas County Division of EmergencyResponse, Douglas County sheriff, Town and City of Superior police and fire departments,Wisconsin National Guard, Duluth police and fire departments, St. Louis County emergencymanagement, Burlington Northern, CHEMTREC, the Civil Air Patrol, the U.S. Coast Guard, andthe EPA. The evacuation crossed multiple political boundaries including city, county, and stateborders. At approximately 10:00 a.m., at the direction of the EPA, the U.S. Coast Guard enteredthe Douglas County EOC and took over command as the federal on-scene coordinator until theEPA arrived. At this point, the Coast Guard restricted communication with the media.
The initial decision to evacuate Douglas County was made jointly by the police captain, thesheriff, and the Douglas County incident commander. Approximately 2,500 people wereevacuated. As additional information arrived on the size of the spill in the river, the evacuationarea was expanded. After reports from the Civil Air Patrol that a cloud was moving towardDuluth, police in Duluth began evacuating residents. As late as 1:30 p.m., several small towns inCarlton County, Minnesota, southwest of Duluth, were also evacuated. Ultimately, more than40,000 people were evacuated.
CommunicationsThe command, control and coordination processes could best be described as pre-planned.There were EOCs established in accordance with emergency plans. At approximately 3:30 a.m.,the Douglas County emergency management director for the Division of Emergency Responseestablished an EOC in the basement of the Douglas County Law Enforcement Center in the Cityof Superior, Wisconsin. At approximately 8:00 a.m., Duluth and St. Louis County Minnesotaestablished a joint EOC in Duluth City Hall. Incident command was established by DouglasCounty approximately 3.2 km (2 mi) from the site and was later moved to a point 6.4 km (4 mi)from the site.
Radio was the primary means of communication between the train conductor and railroadofficials. Notification to Douglas County and other emergency responders was by telephone.During the event, the City of Superior phone system locked up and shut down as a result of themassive volume of incoming calls.
When the Coast Guard took over operations at the direction of the EPA, they stopped all contactwith the media until the arrival of the EPA. This created a communication issue with theevacuation. As winds changed the evacuation areas changed, while the media continued
D-165
reporting the original information they had received. In some instances, they were reporting thatresidents needed to go to an evacuation center that had since been declared an evacuation area.
Notification and WarningThe train conductor radioed the Burlington Northern 28th Street yard in the City of Superior ofthe derailment. The yardmaster immediately dispatched a Burlington Northern trainmnaster andcalled the Douglas County Communication Center (911) to report the incident. The yardmasterthen called Novacor and CHEMTREC to obtain details on the potential hazards. The policeattempted to notify the mayor of the City of Superior; however he was out of town. The policethen telephoned the president of the City Council. There were no problems with notification oflocal officials or responders.
Once the decision to evacuate was made, the police and fire department started going door todoor to wake individuals. Initially, the residents were told to leave and were given very littleinstruction. However, as the evacuations expanded, the police notified the public through radioand television and provided more information on where and how to leave.
The time to complete the evacuation cannot readily be determined. The continuing spread of theplume required that additional areas be evacuated throughout much of the day. The earlyevacuations in Douglas County used police and firemen going door to door and loudspeakers towake residents. Later evacuations also used the media to notify residents to leave the area.
A minor problem with warning residents was that much of the Douglas County area is very rural,requiring significant manpower to notify a relatively small number of residents. The NTSBreport states that nearly all affected residents complied with the evacuation requests. However,most of Duluth's news organizations are downtown in the area that was evacuated, and manynews staff members ignored the requests and stayed to cover the event.
Traffic Movement and ControlEvacuation routes were designated by police barricades. Northbound Interstate Highway 35outside of Duluth was blocked for several hours to prevent people from entering the city, whilecars streamed out of the city in southbound lanes. There was a traffic jam getting off theInterstate 35 exit ramp to Hinckley. The Interstate was backed up coming from the north. TheWisconsin National Guard troops were called in to assist local authorities with traffic control,transportation of evacuees, and maintaining barricades. The troops assisted local lawenforcement with patrolling the traffic control barricades for the next four days.
Special institutions were evacuated, including nursing and health care homes. A prison wasplanning to evacuate; however, there were not enough buses to transport the prisoners becausethe buses were being used to support other evacuation needs. Eventually, the prison officialsdetermined that they did not require evacuation. Road conditions prior to the evacuation wereclear and dry. It was noted that there were no serious traffic accidents reported during theevacuations.
D-166
Congregate Care CentersSome people moved to evacuation centers set up by the American Red Cross on higher ground,above areas where the cloud seemed to settle. Others left for cabins or towns on the Iron Rangeto the north. In Duluth and Superior, two high schools, a National Guard Armory and studentcenters at the University of Wisconsin-Superior and at the University of Minnesota-Duluth weredeclared emergency centers operated by the Red Cross.
Employees of the Carlton County Courthouse loaded people present for jury duty into a bus anddrove them 31 km (19 mi) south to Moose Lake, where authorities set up a makeshift courtroomin a boardroom of the high school. More than 150 people took refuge in a school auditorium,and others pitched camp in Moose Lake Park. The total number of people that went tocongregate care centers has not been determined.
Law EnforcementThe evacuated areas were secured by barricades set up by the local police. The barricades werepatrolled by the police and the Wisconsin National Guard. There were no reported instances oflooting or vandalism or any problems identified with law enforcement.
Re-EntryBy 3:40 p.m. on June 30th, the vapor cloud over the Minnesota areas had dissipated, and theevacuation orders were lifted for these areas. The mayor of Duluth authorized the re-entry andnotified the public through the media. However, the media message caused some confusion andresidents in the City of Superior and Douglas County thought it was clear to return. However,these areas remained evacuation areas for a few more hours. By 6:30 p.m., the vapor cloud inWisconsin had dissipated, and the evacuation order was lifted for the City of Superior and SouthSuperior. A 9.7-km (6-mi) by 8-km (5-mi) evacuation zone remained around the accident sitewithin the Town of Superior.
Information that it was safe to return home was conveyed to the public via the media. The re-entry process was not controlled. At 6:00 p.m. on July 3, 1992, the remaining evacuation orderwas lifted and at 6:15 p.m., the ICP was closed.
Many people received financial settlements from Burlington Northern and were not able todiscuss the settlements. Burlington Northern settled and paid out claims to over 12,000 people.The City of Superior settled a claim against the railroad for $89,000 for city expenses involvedin the cleanup. In addition, the U.S. government received $260,000 for costs incurred from thespill. There was no mention of how much of this amount was for evacuation-related expenses.
INVESTIGATOR COMMENTS
In discussions with the Douglas County Emergency Management Coordinator and the City ofSuperior Chief of Police, the following observations and lessons learned were noted:
D-167
1. The evacuation was noted as proceeding well because (1) the local population cooperatedwith authorities; (2) the use of media for notification was well received; (3) the commandstructure was understood, even when the Coast Guard took over operations; and (4) theemergency responders felt empowered and did not need to wait for local officials to makedecisions.
2. Problems with the evacuation included the shutdown of the phone system that occurredbecause of the mass number of residents calling for information on the evacuation. Thenews media, although helpful in getting the information out to the public, became a problemwhen winds changed and evacuation directions needed to be updated. The media in someinstances were providing old information, sending residents to evacuation centers that werenow located in evacuation areas.
3. As a result of this event, the City of Superior, the state of Wisconsin, Duluth, and the state ofMinnesota have developed increased capabilities for response to hazardous materialsemergencies.
CONTACT INFORMATION AND REFERENCES
Contacts
Douglas County Emergency Management Coordinator(Lead Canary Team during event)(715) 395-1391
City of Superior Chief of Police1407 Hammond Ave.City of Superior, Wisconsin(715) 395-7234
References
Kuchera, Steve. "Toxic Tuesday remains under a cloud of concern." Duluth News - Tribune.June 30, 1997.<http://www.marshallschool.org/school/cours/course/dvosen/chem/Notes/FireUnit/Toxic%2OTuesday°/o20(5yrs%20later).pdf> (June 2003).
Lush, David. "Toxic Tuesday' the studies, doubts, lawsuits, payments." The Daily Telegram.July 1, 2002.<http://www.ashlandwi.com/upnorth/placed/story/07-01-2002UNW.html> (June 2003).
D-168
Oaks, L. and P. Doyle. "Thousands flee toxic cloud HI Derailment spills chemicals into riversouth of Duluth, Superior." Star Tribune. July 1, 1992.<http://www.marshallschool.org/school/cours/course/dvosen/chem/Notes/FireUnit/Duluth%20Benzene%20Spill92.pdf> (June 2003).
Park Point Community Club. "Minnesota Point Environmental Management Plan."<http://www.parkpoint.org/envplan/toxic.html> (June 2003).
Rasid, H. and J. Hufferd. "Hazards of living at the edge of the water: the case of Minnesotapoint, Duluth, Minnesota." Human Ecology 17(1), 85-100. 1989.
University of Wisconsin Disaster Management Center. "Aim and Scope of DisasterManagement."<http://dmc.engr.wisc.edu/courses/aimscope/AA02-05.html> (June 2003).
D-169
Hanford Fire, Benton City, Washington, June 27, 2000, ID #103
On June 27, 2000, an automobile collided with a tractor trailer, igniting a huge wildfire thatswept through portions of the DOE Hanford Nuclear Site near Richland, Washington. The firewas reported to have been the fastest-growing fire in the United States during the past ten years.It burned 777 km2 (192,000 acres) of sagebrush/grass-covered land in the region and destroyedeleven homes in nearby Benton City and West Richland. The fire forced approximately 1,700employees to evacuate the DOE Hanford Site and more than 10,500 residents to evacuate theirhomes, including 2,500 from Benton City. There was one fatality due to the automobile accidentand at least three injuries from the fire, but no deaths or injuries related to the evacuation itself.The focus of this case study is the evacuation that took place in Benton City, Washington.Information for this case study was derived from news wire sources, reports, and interviews withpersonnel involved in the evacuations, including the Benton County Emergency ManagementDepartment.
COMMUNITY CONTEXT
GeneralAll 2,500 residents of Benton City were ordered to evacuate on June 28, 2000, as wildfiresneared their community. The entire population (100%) complied with the evacuation order.Some people voluntarily evacuated before the official order. Benton City is a residential(suburban) community surrounded by rural areas. The size of the community and of theevacuated area is 4.5 km2 (1.8 mi2). The population density during the evacuation was low.Benton City has a mayoral form of government and farming is its main economic base. Thereare no special characteristics that attract a large number of non-residents.
Several unique aspects to this community made it extremely well prepared for an evacuation,according to Lyle Ball of the Benton County Emergency Management Department. Thecommunity is close to the DOE Hanford Site Reservation, which is 24.1 km (15 mi) away, theColumbia (Energy Northwest) Nuclear Power Plant [ 10.3 km (6.4 mi) from the EPZ or 26.4 km(16.4 mi) from the facility itself], and a U.S. Army chemical stockpile detail. Approximately 50to 60 chemical facilities are located in the area. Because of this, Benton County is subject toseveral emergency management plans, each conforming to the guidelines outlined in NUREG-
D-170
0654/FEMA-REP-1, Rev. 1. The city evacuated in accordance with the Benton CountyComprehensive Emergency Plan, which contains an evacuation section. However, the plan doesnot contain evacuation time estimates for Benton City. Training, drills and exercises, includingfull-scale field exercises, are a part of the plan and occur on a routine basis. A minimum of fourexercises are conducted each year and sometimes as many as six to eight exercises are conductedeach year.
History of EmergenciesThe Benton County area is probably more prone to both natural and technological hazards thanthe average U.S. city. The area was evacuated in the mid-1990s because of wildfires and in 1998because of flooding on the Yakima River. The proximity to the DOE Hanford Site, theColumbia (Energy Northwest) Nuclear Power Plant, and the chemical facilities make itpotentially more prone to technological hazards than the average community. Thus, communityawareness of the hazard and of evacuation procedures is relatively high.
Emergencv PreparednessThe community's emergency preparedness activities include planning, training, drills andexercises, and community awareness as described below.
PlanningThe community was governed by several emergency plans, each of which addressed the hazardthat occurred (the fire). These plans conform to the guidance contained in NUREG-0654/FEMA-REP-1, Rev. 1.
Training and DrillsLocal law enforcement and fire departments are extremely well prepared for emergencyresponse and evacuations because they undergo regular training and drills, including full-scalefield exercises. This is related to their proximity to the DOE Hanford Site, the Columbia(Energy Northwest) Nuclear Power Plant, and several chemical facilities.
Community AwarenessCommunity awareness of local hazards is high. Many in the local population work at the above-referenced facilities and are cognizant of emergency procedures.
THREAT CONDITIONS
The hazard that led to this evacuation was the wildfire that began after an automobile collidedwith a tractor-trailer on June 27, 2000. Before the evacuation, residents were aware that thisswiftly moving fire could reach their community and some people voluntarily evacuated beforethe official evacuation order.
Weather conditions at the time of the evacuation were dry with 48.4 km/h (30 mph) wind gustsand 37.81C (1000F) temperatures. Thick smoke filled the air and may have had a slight impact
D-171
on the efficiency of the evacuation, according to evacuees interviewed for news reports. As thefire progressed, the winds increased in strength and moved in the direction of the DOE Hanfordsite. The wildfires reportedly came within two to three miles of highly radioactivecontamination at the DOE Hanford Site. Other than that, there were no unusual circumstancesthat occurred during this incident, other than the hazard itself. Roads in the vicinity were clearand dry and did not impact the effectiveness of the evacuation of Benton City.
CONSEQUENCES
Approximately 2,500 people evacuated from Benton City (100% of that community). Another8,000 people were evacuated from the communities of West Richland and Horn Rapids and1,700 employees evacuated the DOE Hanford Site. There were no deaths or injuries associatedwith the evacuations. There was, however, one fatality associated with the automobile accidentthat created the wildfire that led to the evacuation, and at least three people were hurt in the fire.The estimated cost of evacuated-related expenses incurred by the public is $200,000. This isprimarily for hotel stay and meals. Although the government did not reimburse the public for itsevacuation expenses, several funds were established to help the families; it is unknown howmuch money each family received.
The accident occurred at approximately 1:30 p.m. on June 27, 2000, and emergency respondersarrived on the scene within minutes. The tractor-trailer involved in the accident was fullyengulfed in flames at that time and the wildfires were rapidly growing. Benton County declareda state of emergency at 6:00 p.m. on June 27, and by 1:45 a.m. on June 28, the governor haddeclared a state of emergency in Benton County. The National Guard was activated to assistwith the evacuations and the Red Cross set up congregate care centers in nearby Richland andKennewick, Washington.
EMERGENCY RESPONSE
Decision MakingThere was a high level of cooperation among local, state, and federal agencies. Politicalboundaries were not crossed. The command, control and coordination processes could best bedescribed as ad hoc. The decision to evacuate was made by the County Emergency Manager.There were no problems with the decision-making process.
CommunicationsAn EOC, including an ICP, was used in this emergency. Field emergency responderscommunicated with the EOC via radio and pager/cell phone. Communication was not identifiedas being a problem during this incident or during the evacuation.
Notification and WarningThere were no problems associated with notification and warning. The smoke resulting from thefire served to alert most in the community, including public officials, of the hazard. The police
D-172
used sirens and police PA system to alert the public of the evacuation. Emergency informationwas also broadcast over the radio (KONA Radio on 610 AM and 105.3 FM). The evacuation ofBenton City was staged all at once. Everyone was notified and evacuated at the same time. Ittook less than one hour to evacuate Benton City. No special problems were noted regardingwarning and subsequent citizen action.
Traffic Movement and ControlThere were no reported problems associated with traffic movement and control. People weregiven specific instructions about where to go when they were warned to evacuate. They weretold to use specific routes, and they were directed out along those routes. The roads werereverse-laned to facilitate movement out of the city. Some people spontaneously evacuatedbefore being told to do so and no one refused to evacuate. There were no traffic accidents orspecific traffic problems during the evacuation. No special institutions, such as hospitals orprisons, were involved in the evacuation.
Congregate Care CentersCongregate care centers managed by the American Red Cross were used. Approximately 20%of the evacuees went to the emergency congregate care centers, which included Richland HighSchool and United Central Protestant Church in Richland. People did not evacuate from outsidethe designated evacuation area.
Law EnforcementThe area was secured by the National Guard and there was no problem with looting andvandalism. No problems were identified with law enforcement.
Re-EntryThe evacuation order was lifted by the Benton County Emergency Services on June 29, 2000, at12:15 p.m. This decision was based on control of the fire. Residents were advised to stay tunedto local television and radio for further developments. There were no special controls and nospecial problems associated with re-entry.
INVESTIGATOR COMMENTS
Factors that contributed to the success of the evacuation included community awareness andemergency management preparedness and routine training and drills, including full-scale fieldexercises.
D-173
CONTACT INFORMATION AND REFERENCES
ContactsDOE PlannerBenton County Emergency Management(Part of Benton County Emergency Services)561 Truman AvenueRichland, WA 99352(509) 628-2600
ReferencesAshton, L. "Sky on fire." Associated Press. June 29, 2000.
CNN. "Energy secretary Hanford fire contained: No radiation released, tests show; nuclearwatchdogs urge more monitoring." June 30, 2000.<http://www.cnn.comn/2000fUS/06/30/hanford.fire.03/> (June 2003).
CNN. "Firefighters halt spread of blaze at Washington state nuclear site." June 29, 2000.<http://www.cnn.com/2000fUS/06/29/hanford.fire.05/> (June 2003).
Department of Energy: Hanford Site (U.S.), "Hanford Site Fire Information." 2002.<http://www.hanford.gov/hanfordfire.html> (April 2003).
"Details On Hanford Fire." Hanford Joint Information Center, News Release.004, Richland,Washington, June 28, 2000, 8:15 p.m.
Disaster Relief. "Fierce Wildfire Burns Through Nuclear Reservation in Washington State."June 29, 2000. <http://www.disasterrelief.orglDisasters/000629washfire/> (June 2003).
Mulick, C. and J. Hagey. "Evacuate residents wait for word on fire." Tri-City Herald. June 29,2000. <http://www.tri-cityherald.com/news/2000/0629/story2.html> (June 2003).
U.S. DOE. 2000. Type B Accident Investigation: U.S. DOE Report Response to the 24Command Wildfire on the Hanford Site -- June 27-July 1, 2000, DOE/RL-2000-63. October2000. http://www.hanford.gov/docs/rl-2000-63/
Wiley, J. K. "Wildfires at nuclear site raises fears." Associated Press. June 30, 2000.
D-174
Burlington Northern Santa Fe Derailment, Scottsbluff, Nebraska,November 4, 2000, ID #26
At 10:30 p.m. on Saturday, November 4, 2000, a Burlington Northern Santa Fe (BNSF) trainderailed in northwestern Scottsbluff, Nebraska. Twenty-eight out of the 120 tank cars derailed;10 of the tanker cars contained benzene and dicyclopentadiene and five ruptured, spillingchemicals. Approximately 5,000 people within a 2.6 km (Imi) radius were evacuated because ofthe noxious gas cloud early Sunday morning (November 5th).
COMMUNITY CONTEXT
GeneralScottsbluff, Nebraska, is a city of approximately 14,732 people, based on the 2000 Census.Approximately 5,000 people, or slightly more than 30% of the population, were evacuated froma suburban area of northwestern Scottsbluff because of the train derailment and release ofhazardous material. Population density was medium during the evacuation. The city covers15.4 km2 (5.9 mi2) and the evacuated area was approximately 7.8 km2 (3.14 mi2). Ethnicity,nationality, and age were not important factors in the evacuation.
Scottsbluff is a rural farming community in western Nebraska. It has a mayoral form ofgovernment. Land uses in the evacuation area were residential, industrial and agricultural. Thecommunity's main economic base is farming. Tourism attracts a large number of non-residents.There are no commercial nuclear power plants within 80 km (50 mi) of Scottsbluff. However,there are two commercial power plants located in Nebraska.
History of EmergenciesScottsbluff is likely no more prone to hazards than the average U.S. city. Although more thanthirty trains pass through Scottsbluff daily, the community had no prior experience withderailments and chemical spills and had not experienced evacuations in the past ten years.
D-175
Emergency PreparednessThe community's emergency preparedness activities include planning, training, drills andexercises, and community awareness as described below.
PlanningScottsbluff has a written emergency plan with an evacuation section that was the plan used inthis emergency. The plan did not conform to NUREG-0654/FEMA-REP- 1, Rev. 1, and did notcontain an ETE.
TrainingTraining is provided to emergency response personnel. However, joint training between industryand government is not regularly conducted.
Drills and ExercisesScottsbluff's emergency response agencies regularly conduct emergency drills and exercises butthe emergency plan used in this evacuation was not previously tested in a full-scale fieldexercise.
Community AwarenessThe level of community awareness about local hazards, derailments/chemical spills, andevacuation procedures was relatively low. However, the community was highly aware of thealerting methods used, which included sirens, radio and television broadcasts, police/fire PAsystems, and door-to-door notification.
THREAT CONDITIONS
At 10:30 p.m. on November 4, 2000, approximately 363,688 L (80,000 gal) of a chemicalcontaining benzene was released following derailment of a Burlington Northern Santa Fe Train.Approximately 5,000 people within a one-mile radius were evacuated. The initial evacuationtook place shortly after midnight. Most residents were allowed back into their homes bymorning, but some families were evacuated again that day. The weather was cool, there wasnothing unusual, such as storms, and the roads were dry. The only unusual circumstance wasthat the evacuation took place at night.
CONSEQUENCES
Approximately 5,000 people, or slightly more than 33% of the population, were evacuated.There were no reported deaths or injuries because of the evacuation, the derailment, or exposureto the benzene. The estimated cost to the public of the evacuation itself, and not from any of thedamages associated with the train derailment, is unknown; BNSF reimbursed evacuees for theirexpenses.
D-176
EMERGENCY RESPONSE
Decision MakingThere was a high level of cooperation among local, state, and federal agencies. Politicalboundaries were not crossed. The command, control and coordination processes could best bedescribed as pre-planned. The decision to evacuate was made jointly by Scottsbluff's police andfire chiefs. There were no problems with the decision-making process.
CommunicationsAn EOC and an ICP were used in this emergency. Communication between field emergencyresponders and the EOC was by radio, telephone, cell phone, and fax. There were no problemswith communication.
Notification and WarningSenior local officials were notified of the incident after receiving a call from the commandcenter. Emergency responders were notified of the incident by pager and telephone treesfollowing report of the incident through the 911 emergency system. There were no problemswith notification of emergency personnel or senior local officials. Response personnelmobilized to the scene in less than 15 minutes, and the decision to evacuate was made soonafterward. It took two hours to complete the evacuation. The public was notified of theevacuation by several methods, including sirens, radio and television broadcasts, police/fire PAsystems, and door-to-door notification. The evacuation took place all at once. There were nospecial problems regarding warning or subsequent citizen action.
Traffic Movement and ControlPeople were given specific instructions when they evacuated, including which routes to use andwhat congregate care centers to go to. Police officers guided evacuees along the routes. Nospecial institutions were evacuated. The road conditions were dry; no major roadways wereunavailable, and there were no special traffic problems or traffic accidents. Reverse-laning wasnot used. No one evacuated before being told to do so and no one refused to evacuate.
Congregate Care CentersCongregate care centers managed by the local chapter of the American Red Cross were used.Congregate care centers included Scottsbluff High School, Gering High School, and several areachurches. According to the Red Cross, approximately 350 people (or 7% evacuees) soughtcongregate care centers immediately following the derailment. Evacuees were allowed to returnto their homes just after 3:00 a.m. on November 5, 2000, or 4.5 hours following the derailment.There were some shadow evacuations, but this did not impact traffic or congregate care centercapacity.
Law EnforcementThe evacuated area was secured by the police, and there were no instances of looting orvandalism or any other law enforcement problems.
D-177
Re-EntryThe Scottsbluff Fire Chief and Police Chief jointly authorized re-entry approximately 4.5 hoursafter the derailment occurred. There were no special controls on re-entry and BNSFcompensated evacuees for their expenses. No major problems occurred during re-entry.
INVESTIGATOR COMMENTS
The alerting system (door-to-door) was very effective and contributed to the success of theevacuation, especially since it occurred at night.
Lessons learned in this evacuation include:
1. Communication needs to be improved.
2. The public needs to be educated on the use of sheltering in place as an option.
3. Personal protective clothing, including masks and suits are needed for response personnel.
CONTACT INFORMATION AND REFERENCES
Contacts
Special Operations DivisionPolice Department(308) 630-6261
Scottsbluff Chapter of the American Red Cross(308) 635-2114
ReferencesArizona Summer Wildcat Online. "Neb. town evacuated after derailment." November 6, 2000.<http://wildcat.arizona.edu/papers/94/55/01_93_m.html> (June 2003).
"Evacuation Ordered After Train Derailment Releases Fumes." Associated Press. November 5,2000.
Nebraska Department of Environmental Quality. "DEQ Update: Scottsbluff Train Derailment."<http://www.deq.state.ne.us/Gen.nsf7Pages/Updatel> (June 2003).
Nebraska Emergency Management Agency. "State of Nebraska Emergency Operations Plan."February 12, 2002.<http://www.nebema.org/seop.html.pdf> (June 2003).
D-178
The Independent. "Scottsbluff Praised for Handling Derailment." November 16, 2000.<http://www.theindependent.com/stories/ 1I1600/newscottsbluffderaill6.html> (June 2003).
United Transportation Union. "NEBRASKA: Town evacuated after train derailment."<http://www.utu.org/DEPTS/PR-DEPT/NEWS/NDigest/2000/Nov2m/1 16/1160002.htm> (June2003).
D-179
Fish Plant Ammonia Leak, Morro Bay, California, October 3, 2001, ID #66
On October 3, 2001, 500 kg (1,100 lb) of anhydrous ammonia leaked at a fish processing plant,causing the evacuation of approximately 3,500 people within a 910 m (1,000 yd) radius of thefacility in Morro Bay, California. No deaths or injuries were associated with either the incidentor the subsequent evacuation.
COMMUNITY CONTEXT
GeneralMorro Bay is a suburban community with a population of 10,350 people. Approximately 3,500people, or 34% of the city's population, were evacuated on October 3, 2001. The city of MorroBay covers an area of 26.3 km2 (10.2 mi2), although 50% of this area is covered in water. Theevacuated area covered an area of 2.6 km2 (1 mi2). The population density was medium duringthe evacuation. Land use in the evacuated area was residential, commercial, and industrial. Agewas an important factor in the evacuation since there were elderly patients in a handicappedfacility that was evacuated. In addition, there was a significant Hispanic population that did notunderstand either verbal or written evacuation instructions, which were given in English.
The community has a mayoral form of government and its main economic base is tourism,which attracts a large number of non-residents. A portion of Morro Bay is located within the 16km (10 mi) EPZ of the Diablo Canyon Nuclear Power Plant, with the remaining part of the citylocated just outside of the 16 km (10 m) EPZ and well within the 80 km (50 mi) EPZ.
History of EmergenciesThe community is no more prone to hazards than average and had no prior experience with thehazard that led to this evacuation. Morro Bay has experienced evacuations in the past 10 years,but not of this magnitude. The community did not have previous experience with the alertingmechanism used in this evacuation.
D-180
Emergency PreparednessThe community's emergency preparedness activities include planning, training, drills andexercises, and community awareness as described below.
PlanningThe community had a written emergency plan that was used in this emergency. It is unknownwhether the plan contained an evacuation section. According to the Morro Bay Fire Chief, theplan conformed to NUREG-0654/FEMA-REP-1, Rev. 1. However, it did not contain an ETE.
TrainingThe community provides training to emergency response personnel and regularly conducts jointtraining between industry and government.
Drills and ExercisesThe community's emergency response agencies regularly conduct emergency drills andexercises, and the emergency plan used in this evacuation was previously tested in a full-scaleevacuation. Immediately before this evacuation, a tabletop exercise was performed.
Community AwarenessThe community has an average level of awareness about local hazards and about evacuationprocedures. However, awareness of the hazard that caused this evacuation (i.e., the anhydrousammonia leak) was low. The community had an average level of awareness of the alertingmethods used in this evacuation.
THREAT CONDITIONS
The threat condition leading to this evacuation was a leak of anhydrous ammonia at a fishprocessing plant, causing the evacuation of approximately 3,500 people during the day. Theroads were dry; however, it was foggy outside with limited visibility. This did not have a majorimpact on the evacuation, and there were no unusual circumstances that occurred during theincident.
CONSEQUENCES
Approximately 3,500 residents were evacuated. No deaths or injuries were associated witheither the incident or the subsequent evacuation. The estimated total cost of evacuation-relatedexpenses is unknown.
D-181
EMERGENCY RESPONSE
Decision MakingThe level of cooperation among local, state, and federal agencies was high and included the U.S.Coast Guard. Political boundaries were not crossed. The command, control and coordinationprocesses could best be described as pre-planned. The decision to evacuate was made by theCounty Health Office and there were no problems with the decision-making process.
CommunicationsAn EOC and an ICP were used and were co-located. Communication between field emergencyresponders and the EOC/ICP was by radio. There were no problems with this form ofcommunication.
Notification and WarningSenior local officials were notified of the incident by telephone and emergency responders werenotified through a citizen's complaint of an ammonia odor. There were no problems withnotification of emergency personnel or senior local officials. The elapsed time betweendiscovery of the incident and mobilization of response personnel was less than 15 minutes. Theevacuation was staged. The decision to evacuate Stage I was made approximately 30 minutesafter discovery of the leak, and it took approximately 20 minutes to evacuate those people. Thedecision to evacuate Stage 2 was made three hours later and it took approximately 30 minutes toevacuate those people. The decision to evacuate the third and final stage was made six hoursfollowing discovery of the ammonia leak and it took approximately 90 minutes to evacuate thoseresidents. The public was notified by emergency responders going door to door. There wereproblems with warning and subsequent citizen action because many in this community spokepredominantly Spanish and did not understand the evacuation instructions, which were given inEnglish.
Traffic Movement and ControlEvacuees were given specific instructions, both verbal and written (i.e., a flyer), when they weretold to evacuate. However, many in the community spoke predominantly Spanish and did notunderstand the instructions, which were in English. Evacuees were not told to use specificroutes. No special institutions were evacuated; however, two schools were closed for the day.Road conditions before the evacuation were dry, although it was foggy outside, which hinderedvisibility. This did not impact the efficiency of the evacuation. There were no traffic accidents,no traffic problems, and major roadways were available to evacuees. Reverse-laning was notused. Some people evacuated before being told to do so and others refused to evacuate. Thethird, and largest, stage of the evacuation was timed to coincide with the morning commute towork and school. Thus, many evacuees simply went to work or went to school and had no needto go to a congregate care center.
D-182
Congregate Care CentersCongregate care centers managed by the local American Red Cross were used. Congregate carecenters consisted of schools and approximately 200 people, or 6% of evacuees, went to thecongregate care centers. The third, and largest, stage of the evacuation was timed to coincidewith the morning commute to work and school. Thus, many evacuees simply went to work orwent to school rather than go to a congregate care center. There were no shadow evacuations.
Law EnforcementMorro Bay police secured the area following the evacuation and there were no instances oflooting or vandalism or any problems with law enforcement.
Re-EntryThe County Health Office authorized re-entry and there were no special controls during re-entry.Evacuees were not compensated for their expenses. There were no problems during re-entry.
INVESTIGATOR COMMENTS
According to the Morro Bay fire chief, the evacuation was successful because there was a goodplan and time to put signs, personnel, etc. into place. In addition to the language issue, the onlyproblem encountered was pressure from elected officials to authorize re-entry.
CONTACT INFORMATION AND REFERENCES
Contact
Morro Bay Fire Chief(805) 772-6242(Personal Communication, 7/14/03)
References
National Response Center. "2001 National Response Team Incident Summaries: Fish Plant."<http://www.nrc.uscg.mil/insum200l/fishplantl.html> (June 2003).
D-183
Louisville Cargo Transfer Accident, Louisville, Kentucky, November 19, 1998, ID #24
Approximately 2,400 people in and around a Ford Motor Company Plant in Louisville,Kentucky, were evacuated on the morning of November 19, 1998, after a chemical reactionproduced a cloud of toxic gases. At approximately 8:25 a.m., a truck driver delivering chemicalsnoticed an orange cloud coming from the bulk storage building. Seven people were injured inthe incident. No deaths or injuries were associated with the evacuation.
COMMUNITY CONTEXT
GeneralLouisville, Kentucky, is an urban area with a population of 256,231 people as of the 2000Census; however, as a result of a merger with Jefferson County, it now has approximately693,604 residents. Approximately 2,400 people, or less than 1% of the population, wereevacuated because of this incident. The city of Louisville covers an area of 172.6 km2 (66.7 mi2)and the evacuated area covered a small area, probably less than 2.6 km2 (I mi2). The populationdensity was high during the evacuation. Land use in the evacuated area was residential,commercial, and industrial. Ethnicity, nationality, and age were not important factors in theevacuation.
The city has a mayoral form of government and its main economic base is commercial/retail/services. The University of Louisville, University of Kentucky in nearby Lexington, and theKentucky Derby all attract a large number of non-residents. The nearest nuclear power plant isover 80 km (50 mi) away and the state of Kentucky does not have any commercial nuclearpower plants.
History of EmergenciesThe community is no more prone to hazards than average and had no prior experience with thehazard that led to this evacuation. Louisville, Kentucky, has not experienced any majorevacuations in the past 10 years. However, the city's residents did have previous experiencewith the alerting mechanism used in this evacuation (broadcasts on public television).
D-184
Emergence PreparednessThe community's emergency preparedness activities include planning, training, drills andexercises, and community awareness as described below.
PlanningJefferson County had a written emergency plan that included an evacuation section that was usedin this emergency. It is unknown whether the plan conformed to NUREG-0654/FEMA-REP-1,Rev. 1, or whether it contained an ETE.
TrainingThe community provides training to emergency response personnel and regularly conducts jointtraining between industry and government.
Drills and ExercisesThe community's emergency response agencies do not regularly conduct emergency drills andexercises.
Community AwarenessThe community has a low level of awareness concerning local hazards and of the hazard thatcaused this evacuation. In addition, the community's level of awareness about evacuationprocedures was low. The community's awareness about the alerting mechanisms used in theevacuation was also low, because although the emergency broadcasting system was tested on aperiodic basis, it has rarely been used in an actual emergency.
THREAT CONDITIONS
The threat condition leading to this evacuation was an inadvertent mixing of chemicals, whichproduced toxic gases and forced the evacuation of 2,400 people in and around a Ford MotorCompany Plant in Louisville, Kentucky, on the morning of November 19, 1998. After a pipefitter at the plant inadvertently attached a hose to the wrong coupler, a nickel nitrate andphosphoric acid solution being unloaded from a cargo truck was inadvertently mixed withsodium nitrite solution in a storage tank. A chemical reaction ensued that produced toxic gasesof nitric oxide and nitrogen dioxide, leading to the evacuation. The roads were dry and clear,and no unusual circumstances occurred during the incident.
CONSEQUENCES
Approximately 2,400 people were evacuated from the Ford Motor Company Plant andsurrounding businesses, and another 600 local residents were told by authorities to remain insidetheir homes on the morning of November 19, 1998. The incident resulted in seven people beingtreated for minor inhalation injuries, including three police officers, three Ford Motor Companyemployees, and the truck driver. No deaths or injuries were associated with the evacuation. Theestimated total cost of evacuation-related expenses is unknown.
D-185
EMERGENCY RESPONSE
Decision MakingThe level of cooperation among local, state, and federal agencies was high. Political boundarieswere not crossed. The command, control and coordination processes could best be described aspre-planned. The decision to evacuate was made jointly by the Louisville Fire Chief and theEmergency Manager and there were no problems with the decision-making process.
CommunicationsAn EOC was not used; however, an incident command post (ICP) was used and communicationbetween field emergency responders and the ICP was by radio, telephone, and cell phone. Therewere no problems with communication.
Notification and WarningSenior local officials were notified of the incident by telephone and emergency responders werenotified by plant personnel through the 911 phone system. There were no problems withnotification of emergency personnel or senior local officials. The elapsed time betweendiscovery of the incident and mobilization of response personnel was less than 15 minutes andthe decision to evacuate the Ford Plant was made within 15 minutes. The decision to evacuatenearby residents was made within one hour of the incident. It took approximately two hours tocomplete the evacuation. The public was notified by radio and television broadcasts, apolice/fire PA system, and by door-to-door notification. The evacuation was staged; first, plantpersonnel were evacuated and then nearby residents were evacuated. There were no specialproblems regarding warning and subsequent citizen action.
Traffic Movement and ControlEvacuees were given specific instructions about where to go when they evacuated and were toldto use specific routes that were designated by roadblocks and manned police patrols. No specialinstitutions were evacuated. Road conditions prior to the evacuation were dry and there were notraffic accidents, no traffic problems, and major roadways were available to evacuees. Reverse-laning was not used. No one evacuated before being told to do so and no one refused toevacuate.
Congregate Care CentersCongregate care centers managed by Civil Defense were used. Fire stations were used ascongregate care centers; however, none of the evacuees went to the congregate care centers.There were no shadow evacuations.
D-186
Law EnforcementPolice secured the area following the evacuation and there were no instances of looting orvandalism or any problems with law enforcement.
Re-EntryThe Louisville fire chief authorized re-entry and there were no special controls during re-entry.Evacuees were not compensated for their expenses. There were no problems during re-entry.
INVESTIGATOR COMMENTS
According to the assistant fire chief at the Worthington Fire Station in Louisville, the evacuationwas successful due to coordinated effort between agencies.
CONTACT INFORMATION AND REFERENCES
Contact
Assistant Fire ChiefWorthington Fire StationLouisville, Kentucky(502) 241-9366(Personal Communication, 7/15/03)
References
National Transportation Safety Board (U.S.) (NTSB). HZB-00-02, "Chemical Reactions DuringCargo Transfer Louisville, Kentucky." NTSB: Washington, D.C. November 1998.
D-187
Pesticide Tanker Truck Explosion, Balch Springs, Texas, April 14, 1994, ID #243
On April 14, 1994, a truck carrying 10,500 kg (23,000 lb) of an acutely toxic pesticide, Temik15-G, which contains aldicarb as its active ingredient, crashed. The truck hit a traffic sign andburst into flames on Interstate 20 in Balch Springs, Texas, southeast of Dallas, spilling the toxicpesticide, sending a smoke plume over the community, and causing the evacuation ofapproximately 5,000 people.
COMMUNITY CONTEXT
GeneralBalch Springs is a suburban community with a population of approximately 19,375 people andcovers an area of 20.9 km2 (8.1 mi2). Approximately 5,000 people, or 26%, of the populationwere evacuated from a 12.8 km2 (5 mi2) area during this incident. The land use in the area ismainly residential, and the population density of the area was high at the time of the evacuation.Ethnicity and nationality were not important factors in the evacuation; however, age was a factoras several schools with young children were evacuated.
The city has a mayoral form of government, and the main economic base is industry. There areno special characteristics that attract large numbers of visitors to the area. The nearest nuclearpower plant is Comanche Peak more than 80 km (50 mi) away.
History of EmergenciesThe community is more prone to hazards than average but has not had experience with this typeof emergency in the past. Balch Springs has had emergencies with storms and has a large flowof traffic, including transport of hazardous materials, through the area. The community has notexperienced large-scale evacuations in the last 10 years and had no previous experience with thealerting mechanisms used in this emergency.
Emergencv PreparednessThe community's emergency preparedness activities include planning, training, drills andexercises, and community awareness as described below.
D-188
PlanningThe community had a written emergency plan with an evacuation section that was used in thisemergency. It is unknown if the plan conformed to NUREG-0654/FEMA-REP-1, Rev. 1, or ifthere was an ETE in the plan.
TrainingThe community provides training to emergency response personnel. However, joint trainingbetween industry and government is not regularly conducted.
Drills and ExercisesThe community's emergency response agencies do not conduct regular emergency drills andexercises. The emergency plan used in this evacuation was not previously tested in full-scalefield exercises.
Community AwarenessThe community has a medium level of awareness of the local hazards and a medium level ofawareness of evacuations procedures. It had a low level of awareness of the hazards in thisincident, including hazardous materials in general. The community does have a high level ofawareness of the alerting methods used in this evacuation.
THREAT CONDITIONS
At about 8 a.m. on April 14, 1994, a truck carrying 10,500 kg (23,000 lb) of an acutely toxicpesticide, Temik 1 5-G, which contains aldicarb as its active ingredient, crashed. The truck hitthe concrete post of a traffic sign and burst into flames on Interstate 20 in Balch Springs, Texas,southeast of Dallas. Temik is "the most toxic insecticide registered" with the EPA, according tothe National Pesticide Telecommunications Network at Texas Tech University. Balch Springfirefighters initially sprayed water on the fire because they believed the driver might still bealive. But when they contacted the chemical manufacturer, Rhone-Poulenc Co., the companysaid the water would make the cloud more poisonous. The company advised firefighters to letthe blaze burn. Authorities let the fire bum for more than 10 hours and the fire was out at about6:15 p.m.
The evacuation area was initially limited to an area just north of 1-20; however, the evacuationwas expanded north during the afternoon as 10 to 20 mph winds pushed the smoke further. Theweather was mild and the roads were dry.
CONSEQUENCES
A cloud of toxic smoke forced the evacuation of more than 5,000 people in a 12.8 km2 (5 mi2)area. Four Mesquite schools downwind were evacuated. The North Texas Poison ControlCenter at Parkland Memorial Hospital was swamped with calls from worried people, but no onewho called or was treated showed any signs of pesticide poisoning.
D-189
At about 2 am. on April 15, police removed scores of roadblocks, allowing people to return totheir homes. Tests by the EPA showed that the area suffered no contamination from the smokeemanating from the burning wreck.
The death of the truck driver was the only fatality from the incident. More than 100 individualswent to hospitals, mostly for eye and lung irritations, but no one was seriously injured. Noinjuries were reported during the evacuation. The estimated total cost of the evacuation-relatedexpenses is unknown. The school district alone estimated costs of overtime pay, fuel, and foodat approximately $30,000 to support the evacuation.
EMERGENCY RESPONSE
Decision MakingThe level of cooperation among local, state, and federal agencies was high, and politicalboundaries were crossed in this event. The command, control, and coordination processes couldbest be described as pre-planned. The decision to evacuate was made jointly by the mayor andthe fire chief, and there were no problems with the decision-making process.
CommunicationsAn EOC was used in this event and an ICP was established. Communication between fieldemergency responders and the ICP was primarily by radio and cell phone. There were noproblems with communications during the event.
Notification and WamrinSenior local officials were notified of the incident by a telephone emergency tree. Theemergency responders were notified through a 911 telephone call. There were no problems withthe notification of emergency personnel or senior local officials. The elapsed time betweendiscovery of the incident and mobilization of response personnel was less than 15 minutes andthe initial decision to evacuate was made approximately 40 minutes after the notification of theincident. It took approximately two hours to complete the evacuation.
Evacuees were notified by radio and directly by the police using a PA system and going door todoor. The evacuation was staged; as wind changed, the area increased. There were no problemswith warning and subsequent citizen action. Some residents refused to evacuate.
Traffic Movement and ControlEvacuees were given instructions on where to go but were not told to use specific routes, as thesewere considered obvious. Police roadblocks were used to direct traffic. A number of specialinstitutions were evacuated, including four Mesquite schools, a retirement home, and a day carecenter. Road conditions during the evacuation were dry, and no traffic accidents or traffic-related problems occurred during the event. Interstate 20 was closed because of the incident, butdid not create problems. Reverse-laning was not used.
D-190
Congregate Care CentersCongregate care centers were established at local schools and public buildings for thisemergency and were managed by the Red Cross and city personnel. Approximately 450evacuees, or 9%, went to the congregate care centers; remaining evacuees went to the homes offriends or relatives. There were shadow evacuations reported; however, these did not impact thetraffic or capacity of the congregate care centers.
Law EnforcementThe Dallas police and sheriff secured the area following the evacuation and there were noinstances of looting or vandalism. At least three arrests were made of individuals trying to enterthe evacuation area prior to re-entry authorization.
Re-EntryRe-entry was authorized by the state police and there were no special controls during the re-entryprocess. There were no problems reported during re-entry. Evacuees were compensated fortheir expenses. Agents for the trucking company set up evacuation claim centers and reimbursedpeople for lodging, food, medication, or other expenses from the evacuation. People with smallclaims received checks on the spot.
INVESTIGATOR COMMENTS
The fact that many people were at work and were easy to reach contributed to the success of thisevacuation. Improvements could be made in public notification using television and radio.
On October 20, 1991, the Oakland, California, fire became this nation's most costly fire and theworst fire involving loss of life and property since the Great San Francisco Earthquake and Fireof 1906. The unusual weather conditions, including high winds and record high temperatures,coupled with five years of drought, fueled an extremely fast-moving fire. Although estimatesvary, up to 20,000-30,000 people were evacuated from portions of Oakland, Berkeley, andPiedmont, California, including part of the UC-Berkeley campus. A total of 25 people died inthe fire and 150 were injured. Of the 25 people killed, 19 were in the process of evacuatingwhen they died. Numerous problems were associated with the evacuation, includingcommunication problems, traffic problems (including traffic accidents), and looting problems.
COMMUNITY CONTEXT
GeneralThe fire and evacuation took place in the wildland-urban interface area between Oakland andBerkeley Hills. This is a suburban area that is heavily developed with expensive residentialproperties with spectacular views of Oakland and San Francisco. In these hills are a series ofnarrow canyons that hampered the fire-fighting efforts.
Oakland has a population of 399,484, and Berkeley has a population of 102,743. The evacuationinvolved up to 20,000 to 30,000, or approximately 6% of the total population. Populationdensity during the evacuation was medium.
Oakland covers 2,024 kn 2 (78.2 mi2) and the evacuated area was approximately 26 km2 (10 mi2).The evacuated area was largely residential with some commercial/retail outlets, and alsoincluded the University of California at Berkeley campus. Oakland is a city with a mayoral formof government. Its main economic base is diverse, including business/financial, commercial/retail, and manufacturing/industry. The University of California at Berkeley attracts a largenumber of non-residents. Ethnicity, nationality, and age were not important factors in theevacuation.
D-192
The state of California contains commercial nuclear power plants. However, the evacuated areais about two hundred miles from the nearest plant, the Diablo Canyon Nuclear Power Plant nearSan Luis Obispo, California.
History of EmergenciesThe wildland-urban interface area between Oakland and Berkeley Hills is more prone to fire thanaverage. There have been 14 major fires since 1923. However, the community had notexperienced a major evacuation in the previous ten years. The community had previousexperience with the alerting mechanism used in this evacuation (police PA system).
Emergency PreparednessThe community's emergency preparedness activities include planning, training, drills andexercises, and community awareness as described below.
PlanningThe county had a written emergency plan that included an evacuation section. However, it isunknown if it was used in this emergency. The plan did not conform to NUREG-0654/FEMA-REP-1, Rev. I, and did not contain an ETE.
TrainingTraining is provided to emergency response personnel. However, it is unknown whether jointtraining between industry and government was regularly conducted.
Drills and ExercisesThe Oakland Fire Department regularly conducts emergency drills and exercises. However, it isunknown whether the emergency plan that was used in this evacuation had been previouslytested in a full-scale field exercise.
Comrnunity AwarenessThe community in the Oakland and Berkeley Hills area is highly aware of local hazards, mostlythe potential for severe wildfires such as the one that prompted this evacuation. However, thecommunity's familiarity with evacuation procedures is only average. The community was alsohighly aware of the alerting method used (police PA system).
THREAT CONDITIONS
On October 20, 1991, strong winds rekindled a grass fire that had started the previous day. Thefire began on a steep hillside in a box canyon above State Highway 24 near the entrance to theCaldecott Tunnel. This is a wooded area with heavy underbrush, narrow streets and steepterrain. The unusual weather conditions, including high winds and record high temperatures anddrought conditions, fueled a huge blaze. Road conditions before the evacuation were dry.However, smoke from the fire made it difficult, if not impossible, to see portions of the road andto ascertain the direction of the fire.
D-193
The evacuation included 20,000 to 30,000 people from significant portions of Oakland,Berkeley, and Piedmont, as well as part of the UC-Berkeley campus. Large areas wereevacuated ahead of the fire. Fire officials identified the areas to be evacuated, while Oaklandand Berkeley police officers conducted the actual evacuation. While some residents hurried toleave the area, others refused to leave. Police officers had to use their authority to evacuatesome residents and to keep others from returning to endangered areas.
CONSEQUENCES
As many as 20,000 to 30,000 people were evacuated on October 20, 1991, because of the EastBay Hills Fire in the wildland-urban interface area between Oakland and Berkeley Hills. A totalof 25 people died in the fire and 150 were injured. Of the 25 people killed, 19 were in theprocess of evacuating when they died. Eleven were killed when the fire caught up to them andeight died in the narrow smoke-filled streets during the evacuation. Many of the fatalitiesincluded individuals who were unable to evacuate because of age or disabilities. The body of anOakland police officer was found, along with five civilian fatalities, at a narrow point on CharingCross Road. It appeared that the cars were jammed at this point by a collision in the narrowestpart of the road, and the occupants were unable to escape the advancing flames. The estimatedtotal cost of evacuation-related expenses is unknown.
EMERGENCY RESPONSE
Decision MakingThe level of cooperation among local, state, and federal agencies was extremely high. Theresponse to this fire was one of the largest ever recorded: 440 engine companies and more than1,500 firefighters responded to the fire. Initially, the Oakland Fire Department conductedoperation and planning functions at the scene but later in the day, the California Department ofForestry and Fire Protection provided an overhead management team, and a joint command wasestablished that consisted of the Oakland, Berkeley, and Piedmont fire departments, andDepartment of Forestry. Both Oakland and Berkeley are in Alameda County and participate inthe Alameda County Fire Mutual Aid Plan. Oakland is the coordinating department for mutualaid within the North Zone of Alameda County, which includes 11 agencies. Engine units fromOrinda, Moraga, and Contra Costa Counties were also dispatched to the fire. Command, controland coordination processes could best be described as ad hoc. The Incident Commander orderedthe Oakland and Berkeley police to evacuate residents. There were no problems with thedecision-making process.
CommunicationsThe Incident Command System was used and there was both an EOC, which consisted of theOakland Fire Department Dispatching Center, and an ICP or mobile command post.Communication between field emergency responders and the EOC was by radio, telephone, andcell phone. There were many communication problems that hampered both the fire-fightingefforts and the evacuation. The radio channels and Communications Center were overwhelmed
D-194
by the situation. Radio communications were difficult or impossible because there were toomany units on the same channel and too few mutual aid channels available; the steep, hillyterrain interfered with the radio signals. In the Oakland Fire Communications Center, thesituation was also out of control. The incoming telephone lines rang continuously, with onecaller after another reporting the fire. The news media were calling for information. The radiowas so jammed with traffic that it was difficult to hear and respond to the messages that weredirected to the Communications Center.
Notification and WarningSenior local officials were notified of the incident by telephone, and emergency responders werenotified through 91 1/dispatch. There were no problems with notification of emergencypersonnel or senior local officials. Emergency personnel were on the scene immediately becausefirefighters were onsite fighting the hotspots from the previous day. The elapsed time betweenthe start of the fire and the decision to evacuate was a couple of hours. Most of the public wasalready aware of the fire but was officially notified to evacuate by police loudspeakers. A policehelicopter PA system was used. Oakland chose not to use the Emergency Broadcast System,feeling it was inefficient.
The evacuation was partially staged. Large areas were evacuated ahead of the fire. The fire wasfast moving and the winds were strong and variable in direction. It took several hours tocomplete the evacuation and not everyone made it out alive. The narrow streets were packedwith people and the smoke made it impossible to know in which direction to evacuate. Therewere problems with warning and subsequent citizen action. Many people evacuated before theevacuation order and others refused to evacuate. Some of the residents refused to leave and triedin vain to protect their own homes. Police officers had to use their authority to evacuate someresidents and to keep others from returning to endangered areas.
Traffic Movement and ControlEvacuees were not given specific instructions about where to go when they evacuated or whichroutes to use. The evacuation was conducted primarily by Oakland and Berkeley police officers.The scene was very chaotic because the smoke made it impossible to know in which direction toevacuate. In addition, the high winds produced a rapidly moving fire that actually caught up toand overwhelmed some of the evacuees. One known special institution (part of the University ofCalifornia at Berkeley campus) was evacuated. However, it is unknown if any other specialinstitutions were evacuated.
Special traffic problems existed during the evacuation. In addition to a heavy smoke that made itimpossible to see, downed power lines and abandoned vehicles impeded the roadways. At leastone traffic accident occurred during the evacuation and those involved in the accident, includinga police officer, died in the fire. It is unknown whether reverse-laning was used. The steep andnarrow roads, as well as the power lines and abandoned vehicles, forced evacuees to take anyroute possible to escape the fire.
D-195
There were some instances of people evacuating before being ordered to do so because the firewas moving so quickly. In addition, some people actually refused to evacuate and responsepersonnel had to re-evacuate some people who returned to their homes.
Congregate Care CentersCongregate care centers were opened in Oakland, Berkeley, and Piedmont. The congregate carecenters were managed by the Red Cross, the Salvation Army, and by the Oakland, Berkeley, andPiedmont emergency planning and support agencies. It is unknown precisely what types ofpublic buildings were used as congregate care centers or what percentage of evacuees went tothe congregate care centers. There were no shadow evacuations.
Law EnforcementThe Oakland and Berkeley Police secured the evacuated area to prevent looting and vandalism.However, some civilians, posing as volunteers, entered the area and looted homes. There wereproblems with law enforcement because officers left the area to protect themselves from thefast-moving fire.
Re-EntryIt is unknown who authorized re-entry. However, it was a controlled phased re-entry becausemany homes had been destroyed in the fire. More than 3,000 structures and 1,500 acres weredestroyed in the fire. Some evacuees received compensation for their evacuation-relatedexpenses through their insurance companies. It is unknown whether there were major problemsduring re-entry. However, it could be assumed that there were problems since many homes weredestroyed in the fire.
CONTACT INFORMATION AND REFERENCES
References
TR-060, The East Bay Hills Fire Oakland-Berkeley, California, October 1991, United States FireAdministration Technical Report Series, "The East Bay Hills Fire Oakland-Berkeley,California," Federal Emergency Management Agency, United States Fire Administration,National Fire Data Center. <http://www.usfa.femagov/downloads/txt/publications/tr-060.txt>
Parker, Captain Donald R. "The Oakland-Berkeley Hills Fire: An Overview," Oakland Office ofFire Services. January 1992. <http://www.sfrnuseum.org/oakfire/overview.htrnl>
"The Oakland Berkeley Hills Fire," National Fire Protection Association (NFPA) in cooperationwith the Oakland and Berkeley, California Fire Departments and the California State FireMarshal's Office. 1992. <http://www.firewise.org/pubs/the0akdandBerkeleyHillsFire/>
D-196
Railroad Accident, Appleton and Grand Chute, Wisconsin, November 3, 1997, ID #52
On November 3, 1997, two railroad tankers carrying liquid petroleum gas derailed near theborder of Appleton and Grand Chute, Wisconsin. Approximately 5,000 people within a 2.6 km2
(1 mi2) area were evacuated from their homes in Appleton and Grand Chute as a precautionbecause of the threat of an explosion.
COMMUNITY CONTEXT
GeneralApproximately 5,000 people were evacuated from a 2.6 km2 (I mi2) area in a suburban(residential) community located on the border of the cities of Appleton and Grand Chute,Wisconsin. Appleton has a population of 70,087 people and covers an area of 55.3 km2 (21.4mi2). Grand Chute has a population of 18,392 people and covers an area of 64.6 km2 (25.0 mi2).Grand Chute is about 121 km (75 mi) northwest of Milwaukee. Ethnicity, nationality, and agewere not important factors in the evacuation.
The community has a mayoral form of government, and its main economic base is industry.There is a mall that attracts a large number of non-residents. The closest nuclear power plant isPoint Beach, located near Manitowoc, Wisconsin, approximately 40 km (25 miles) away.Wisconsin has two commercial nuclear power plants.
History of EmergenciesThe community is no more prone to hazards than the average U.S. city, although the city has hadexperience with derailments in the past. In 1996 there reportedly was a massive derailment andfire that resulted in a nearly three-week evacuation of Weyauwega, which is located 32 km (20mi) west of Appleton. There were no large-scale evacuations in the previous 10 years. It isunknown whether the community had previous experience with the alerting mechanism used inthis evacuation.
D-197
Emergency PreparednessThe community's emergency preparedness activities include planning, training, drills andexercises, and community awareness as described below.
PlanningThe community had a written emergency plan with an evacuation section that was used in thisemergency. The plan did not conform to NUREG-0654/FEMA-REP-1, Rev. 1, and there was noETE in the plan.
TrainingThe community provides training to emergency response personnel but does not regularlyconduct joint training between industry and government.
Drills and ExercisesThe community's emergency response agencies regularly conduct emergency drills andexercises, but it is unknown whether or not the emergency plan used in this evacuation waspreviously tested in a full-scale field exercise.
Community AwarenessThe community has a low level of awareness of local hazards and of evacuation procedures.However, it has an average awareness of train derailment, in general, and a high level ofawareness about the alerting methods used.
THREAT CONDITIONS
The threat condition leading to this evacuation was the derailment of two railroad tankerscarrying liquid petroleum gas in the early evening (approximately 4 p.m.) on November 3, 1997.Weather conditions were overcast but there was no precipitation, and it was approximately 10C(50'F). The roads were dry and clear, and there were no unusual circumstances that occurredduring the derailment.
CONSEQUENCES
Approximately 5,000 people within a 2.6 km2 (I mi2) area were evacuated from their homes aftertwo railroad tankers carrying liquid petroleum gas derailed near the border of Appleton andGrand Chute, Wisconsin. There were no deaths or injuries associated with the derailment or theevacuation. The estimated total cost of evacuation-related expenses is unknown.
EMERGENCY RESPONSE
Decision MakingThe level of cooperation between local, state, and federal agencies was high. Politicalboundaries were crossed, since the evacuation area included Appleton and Grand Chute,
D-198
Wisconsin. The command, control and coordination processes could best be described as pre-planned. The decision to evacuate was made by the Appleton fire chief, and there were noproblems with the decision-making process.
CommunicationsAn EOC was not used but there was an ICP used in this emergency. Communication betweenfield emergency responders and the ICP was by face-to-face contact. There were no problemswith this form of communication.
Notification and WarningSenior local officials were notified of the incident by telephone and emergency responders werenotified through the 911 phone system. There were no problems with notification of emergencypersonnel or senior local officials. The elapsed time between discovery of the incident andmobilization of response personnel was less than 15 minutes, and the decision to evacuate wasmade approximately one and one-half hours after the derailment. It is unknown how long it tookto complete the evacuation. The public was notified by radio and television broadcasts and bydoor-to-door notification. The evacuation took place all at once, but some people refused toevacuate.
Traffic Movement and ControlEvacuees were given instructions about where to go to seek congregate care centers but were nottold to use specific routes. One special institution, a manufacturing facility, was evacuated.Road conditions before the evacuation were dry and there were no traffic accidents and no trafficproblems; all major roadways were available to evacuees. Reverse-laning was not used. It isunknown whether anyone evacuated before being told to do so. Some people refused toevacuate.
Congregate Care CentersTwo schools were opened as congregate care centers but it is unknown who managed thosecongregate care centers or what percentage of evacuees actually went to the congregate carecenters. There were no shadow evacuations.
Law EnforcementPolice secured the area following the evacuation, and there were no instances of looting orvandalism or any problems with law enforcement.
Re-EntryThe Appleton fire chief authorized re-entry several hours after the derailment. There were nospecial controls during re-entry. It is unknown whether evacuees were compensated for theirexpenses. There were no problems during re-entry.
D-199
INVESTIGATOR COMMENTS
According to the Special Operations Chief in the Appleton Fire Department, the evacuation wassuccessful because of cooperation among agencies, the responders' and the public's knowledgeof the hazard, and the emergency plan that was in place.
CONTACT INFORMATION AND REFERENCES
Contact
Special Operations ChiefAppleton Fire Department(920) 832-2281(Personal Communication, 7/9/03)
References
"All Clear Given After Train Tankers Derail in Wisconsin." Associated Press. November 3,1997.
"Wisconsin Neighborhood Evacuated Due to Derailment." Associated Press. November 3,1997. <http://archive.ap.org> (May 22, 2003).
D-200
Keystone Cement, Bath, Pennsylvania, December 9, 1997, ID #53
On December 9, 1997, the temperature doubled in a tank of hazardous solvents at the KeystoneCement Company in Bath, Pennsylvania, posing the possibility of an explosion. At least 1,600people were evacuated, including 950 children from two elementary schools and a seniorcitizens townhouse complex during a 10-hour emergency that virtually shut down the borough ofBath.
COMMUNITY CONTEXT
GeneralBath is a rural borough located in Northampton County, Pennsylvania. Bath has a population of2,678 people and a total land area of 2.4 km2 (0.9 mi2). The evacuated area extended beyond theborders of Bath to include approximately 8 km2 (3.14 mi2). The estimated population for thisarea is 6,400 people. At least 1,600 people, or 25% of the community, was evacuated. Thepopulation density of the area during the evacuation was medium. Ethnicity, nationality, and agewere not important factors in the evacuation.
Bath has a mayoral form of government. The area of the evacuation was primarily residential.The community's main economic base is manufacturinglindustry. There are no specialcharacteristics that attract a large number of non-residents. The Limerick Nuclear Power Plant,is located about 34 km (21 mi) northwest of Philadelphia, or about 60 km (37 mi) from thisevacuation. The state of Pennsylvania has five commercial nuclear power plants, includingThree Mile Island, located 16 km (10 mi) southeast of Harrisburg.
History of EmergenciesThe Bath area is no more prone to hazards than average, and the community had no previousexperience with the hazard that led to this evacuation or experience with any evacuations in theprevious 10 years. It is unknown whether the community had previous experience with thealerting mechanism used in this evacuation.
D-201
Emergency PreparednessThe community's emergency preparedness activities include planning, training, drills andexercises, and community awareness as described below.
PlanningThe community had a written emergency plan that included an evacuation section used in thisemergency. The plan did not conform to NUREG-0654/FEMA-REP- 1, Rev. 1, and there was noETE in the plan.
TrainingTraining is provided to emergency response personnel, and although joint training is conductedbetween industry and government, it is not done on a regular basis.
Drills and ExercisesThe community's emergency response agencies regularly conduct emergency drills andexercises. However, the emergency plan used in this evacuation was not previously tested in afull-scale field exercise.
Communitq AwarenessThe community had a low level of awareness of local hazards but a high level of awarenessabout the hazard that caused this evacuation. The community's awareness of evacuationprocedures and the alerting mechanisms used was average (medium).
THREAT CONDITIONS
The threat condition leading to this evacuation was a tank of hazardous solvents at the KeystoneCement Company in Bath, Pennsylvania. The tank doubled in temperature, posing thepossibility of an explosion. The tank capacity was about 133,000 L (35,000 gal), but only21,000 L (5,500 gal) were being stored. An explosion is more powerful when the tank containsmore vapor than fuel. At least 1,600 people were evacuated. The road conditions were dry andthe outside temperature was low, around 4.4° C (400 F), which helped keep vapors in thehazardous materials tank down. The evacuation began at 8:30 a.m., and people were allowed toreturn to their homes about 6:30 p.m.
CONSEQUENCES
On December 9, 1997, the hazmat incident at Keystone Cement led to the evacuation of at least1,600 people, including 950 children from two elementary schools and a senior citizenstownhouse complex. The evacuation lasted 10 hours and shut down Bath. There were no deathsor injuries associated with either the hazard or the evacuation. The estimated total cost ofevacuation-related expenses incurred by the pubic was minimal.
D-202
EMERGENCY RESPONSE
Decision MakingThe level of cooperation among local, state, and federal agencies was high. Approximately 60firefighters with companies from East Allen, Allen, Hanover (Northampton County), Hanover(Lehigh County), Bath, Walnutport and Klecknersville were at the plant. Political boundarieswere not crossed. Command, control and coordination processes could best be described as adhoc. The decision to evacuate was made by the East Allen fire chief, who opted to evacuate a2.6 km (I mi) radius around the plant. There were no problems with the decision-makingprocess.
CommunicationsAn EOC and an ICP were used. Communication between field emergency responders and EOCwas by radio, cell phone, and messenger. There were no problems with communications.
Notification and WarningSenior local officials were notified of the incident by telephone, and emergency responders werenotified through the county commission center. There were no problems with notification ofemergency personnel or senior local officials. The elapsed time between discovery of theincident and mobilization of response personnel was less than 15 minutes. The elapsed timebetween start of the hazard and the decision to evacuate was one hour (the evacuation began at8:30 a.m. and lasted for 10 hours). It is unknown how long it took to complete the evacuation.The public was notified by a police/fire PA system. The evacuation took place all at once, andthere were no special problems regarding warning and subsequent citizen action. A fewresidents refused to evacuate but this was not a problem since residents were under a voluntaryevacuation notice.
Traffic Movement and ControlEvacuees were given specific instructions about where to go when they evacuated and were toldto use specific routes, which were designated by police roadblocks. Bath was cordoned off tonormal traffic throughout the day. Route 329, where the Keystone plant is located, was blockedfrom Airport Road to the borough. Route 512 was closed from Main Street to HanovervilleRoad. Roads were dry and there were no traffic accidents, but there were traffic jams. Trafficwas detoured around the plant, and Routes 512 and 329 were closed for about 10 hours, causingmajor delays and tie-ups. Reverse-laning was not used.
Three special institutions were evacuated, including the Howard Jones townhouse apartments, asenior citizens complex, and two elementary schools. No one spontaneously evacuated beforebeing told to do so. However, some people refused to evacuate, including an elderly couple whostayed in their home and a woman who openly strolled through the business district. Theevacuation was mandatory for students and senior citizens but voluntary for the rest of thepopulace.
D-203
Congregate Care CentersCongregate care centers managed by the American Red Cross were used. Children were taken toMoore Elementary School, located several miles northeast of Bath, and senior citizens werebused to the Klecknersville Fire Hall, also in Moore. Northampton High School students wholive in Bath were kept at the high school until their parents picked them up. About 118 people,or 7% of those evacuated, mostly elderly, registered with the Red Cross. However, 1,000 schoolchildren were bused to an elementary school. Therefore, the total number of people going tocongregate care centers was approximately 1,118 people, or 70% of those evacuated. Therewere no shadow evacuations.
Law EnforcementThe evacuated area was secured by police, and there were no instances of looting or vandalismor any problems with law enforcement.
Re-EntryThe evacuation began at 8:30 a.m., and people were allowed to return to their homes about6:30 p.m., according to the American Red Cross. Re-entry was authorized by the East Allen FireChief and no special controls during re-entry were used. Evacuees were not compensated fortheir expenses. There were no major problems during re-entry.
INVESTIGATOR COMMENTS
None
CONTACT INFORMATION AND REFERENCES
ContactsEast Allen Fire Marshall(610) 262-6700(Personal Communication, 7/15/03)
ReferencesCsencsits, S. and K. Parrish. "Blast Hazard Shuts Down Bath: The Temperature in Tank ofSolvents at Keystone Cement Doubles, Forcing Evacuations." Lehigh County EmergencyResponse News. December 9, 1997.<http://www.dep.state.pa.us/dep/counties/Lehigh/Emergency ResponseNewsClips.htm>(May 9, 2003).
Devlin, Ron. "Borough Became Town Under Siege Residents Were Hostage to a Tank ofChemicals Until All-Clear at 6:30 P.M." Lehigh County Emergency Response News.December 9, 1997.<http://www.dep.state.pa.us/dep/counties/Lehigh/Emergency ResponseNewsClips.htm>(May 9, 2003).
D-204
Propane Storage Facility Fire, Pascagoula, Mississippi, October 1998, ID #3
More than 1,500 residents of Pascagoula, Mississippi, were evacuated in October 1998 after afire broke out at a propane storage facility. There were no deaths but three injuries wereassociated with the fire; no deaths or injuries were associated with the subsequent evacuation.There were no unusual circumstances that occurred during this incident.
COMMUNITY CONTEXT
GeneralThe evacuated area was a suburban community in the city of Pascagoula, Mississippi, which hasa total population of 26,200. Approximately 1,500 people, or 5.7% of the population wasevacuated because of the incident. The evacuated area was approximately 1.3 km2 (0.5 mi2) andthe city has a total area of 47.2 km2 (18.2 mi2). The evacuated area consisted of residential andcommercial property. Population density of the evacuation area was average. Ethnicity,nationality, and age were not important factors in the evacuation.
Pascagoula has a mayoral form of government and its main economic base is manufacturing andindustry. Tourism and shipbuilding attract a large number of non-residents. IngallsShipbuilding constructs many U.S. Navy ships here. Mississippi has one commercial nuclearpower plant, the Grand Gulf 1, which is located over 80 km (50 mi) away from Pascagoula, orabout 40 km (25 mi) south of Vicksburg.
History of EmergenciesPascagoula is more prone to both natural disasters (e.g., hurricanes and storms) andtechnological hazards than the average U.S. city. However, the community had no priorexperience with the hazard that led to this evacuation. There have been hurricane evacuations inthe previous 10 years. However, the residents had no previous experience with the alertingmechanism used in this evacuation, which was door-to-door notification.
Emergency PreparednessThe community's emergency preparedness activities include planning, training, drills andexercises, and community awareness as described below.
D-205
PlanningPascagoula has a written emergency plan with an evacuation section that was used in thisemergency. It is unknown whether or not this plan conforms to NUREG-0654/FEMA-REP- 1,Rev. 1, requirements.
TrainingPascagoula provides training to its emergency response personnel, including joint trainingbetween industry and government.
Drills and ExercisesPascagoula's emergency response agencies regularly conduct emergency drills and exercises. Itis unknown whether the emergency plan used in this evacuation was previously tested in a full-scale field exercise.
Community AwarenessThe community level of awareness of local hazards is average and awareness of the hazard thatcaused this evacuation was low. However, community awareness of evacuation procedures andalerting methods used is high.
THREAT CONDITIONS
The hazard that led to this evacuation was a fire at the propane storage facility in Pascagoula,Mississippi. The incident occurred at approximately 1 p.m. on a sunny and fair day. The roadconditions were dry, and there were no unusual circumstances that occurred during this incident.
CONSEQUENCES
At least 1,500 residents of Pascagoula, Mississippi, were evacuated after a fire broke out at apropane storage facility. There were no deaths and three injuries associated with the fire and nodeaths or injuries associated with the subsequent evacuation. The estimated total cost ofevacuation-related expenses is unknown.
EMERGENCY RESPONSE
Decision MakingThe level of cooperation among local, state, and federal agencies was high. Political boundarieswere not crossed. Command, control and coordination processes could best be described as pre-planned. The decision to evacuate was made jointly by the Pascagoula fire and police chiefs.There were no problems with the decision-making process.
CommunicationsAn EOC and an ICP were used. Communication between field emergency responders and EOCwas by radio and cell phone. There were no problems with communications.
D-206
Notification and WarningSenior local officials were notified of the incident by telephone and emergency responders werenotified of the incident through the 911 emergency system. There were no problems withnotification of emergency personnel or senior local officials. Response personnel mobilized tothe scene in less than 15 minutes, and the decision to evacuate was made in about ten minutes. Ittook one to two hours to complete the evacuation. The public was notified of the evacuationdoor to door. The evacuation took place all at once. There were no special problems regardingwarning and subsequent citizen action.
Traffic Movement and ControlEvacuees were given specific instructions about where to go when they evacuated and were toldto use specific routes around the hazard. Police officers directed evacuees along the routes thatwere designated. No special institutions were evacuated; however, two special institutionssheltered in place. Road conditions before the evacuation were dry. No major roadways wereunavailable for use because of construction or damage caused by the hazard, and no specialtraffic problems, including traffic accidents, occurred during the evacuation. It is unknownwhether anyone evacuated before being told to do so or if anyone refused to evacuate.
Congregate Care CentersA congregate care center was managed by the Red Cross at the fairgrounds. The number ofevacuees that went to the fairgrounds is unknown. There were no shadow evacuations.
Law EnforcementPolice secured the area following the evacuation, and there were no instances of looting orvandalism or any other problems with law enforcement.
Re-EntryRe-entry was authorized by the incident commander and the EOC. No special controls wereused during the re-entry process. Evacuees were not compensated for their expenses. Therewere no major problems during re-entry.
INVESTIGATOR COMMENTS
According to the Pascagoula fire chief, the evacuation went smoothly because of the availabilityof response personnel and the closeness of the neighborhood. In addition, the public wasfamiliar with evacuation procedures because of storm-related evacuations.
CONTACT INFORMATION AND REFERENCES
ContactsPascagoula Fire Chief(228) 762-0751(Personal Communication, 7/9/03)
D-207
ReferencesFireworld. "Pascagoula, Mississippi." October 1998.<www.fireworld.com/incidents/Octl 998.html> (May 27, 2003).
D-208
Transportation Accident, Bossier City, Louisiana, September 18, 1998, ID #239
On September 18, 1998, workers loading a bomb from a B-52 accidentally dropped the 500-pound explosive on a runway in Bossier City, Louisiana. The bomb did not explode; however,as a precaution, approximately 2,000 people were evacuated before the bomb was picked up andmoved to a safe location.
COMMUNITY CONTEXT
GeneralThe city of Bossier, Louisiana is a suburban community with a population of approximately56,400 people and covers an area of 107.8 km2 (41.6 mi2). Approximately 2,000 people, or3.5%, of the population were evacuated from a 2.6 km2 (I mi2) area during this incident. Theland use in the area is mainly residential, and the population density of the area was medium.Ethnicity, nationality, and age were not important factors in the evacuation.
The city has a mayoral form of government, and the main economic base is tourism. Tourismattracts a large number of non-residents to casinos in the area. Additionally, Barksdale Air ForceBase is located in the city and attracts a large number of visitors. The nearest nuclear powerplant is River Bend located more than 80 km (50 mi) away. Louisiana has a commercial nuclearpower plant northwest of Baton Rouge.
History of EmergenciesThe community is more prone to hazards than average. However, the city had not hadexperience with unexploded ordnance in the past. The community had experienced evacuationsfor tornados, train accidents, and transportation accidents, and had experienced large-scaleevacuations in the last 10 years. The community had had previous experience with the alertingmechanism used during this evacuation.
Emergency PreparednessThe community's emergency preparedness activities include planning, training, drills andexercises, and community awareness as described below.
D-209
PlanningThe community has a written emergency plan with an evacuation section that was used in thisemergency. It is unknown if the plan conformed to NUREG-0654/FEMA-REP-1, Rev. 1, or ifthere was an ETE in the plan.
TrainingThe community provides training to emergency response personnel and regularly conducts jointtraining between industry and government.
Drills and ExercisesThe community's emergency response agencies regularly conduct emergency drills andexercises. The emergency plan used in this evacuation was previously tested in full-scale fieldexercises and in tabletop exercises.
Community AwarenessThe community has a medium level of awareness of the local hazards and a low level ofawareness of evacuations procedures. It has a medium level of awareness of these types ofweapons in general, and a low level of awareness of the alerting methods used in this evacuation.
THREAT CONDITIONS
On September 18, 1999, a bomb was accidentally dropped while being loaded on a B-52 atBarksdale Air Force Base in Bossier City, Louisiana. The bomb did not explode; however,possible damage to the bomb and uncertainty about moving the bomb was cause to evacuate thearea. Weather conditions were dry and clear and the roads were clear.
CONSEQUENCES
Approximately 2,000 people within a 2.6 km2 (I mi2) area were evacuated from their homes aftera bomb was dropped during a loading operation at Barksdale Air Force Base. There were nofatalities or injuries from the incident or the evacuation. The estimated total cost of theevacuation-related expenses is unknown.
EMERGENCY RESPONSE
Decision MakingThe level of cooperation among local, state, and federal agencies was high, and politicalboundaries were crossed in this event because the accident occurred on federal property near thecity. The command, control, and coordination processes could best be described as pre-planned.The decision to evacuate was made by the Bossier City fire chief, and there were no problemswith the decision-making process.
D-210
CommunicationsAn EOC was not used in this event; however, an ICP was established. Communication betweenfield emergency responders and the ICP was primarily by radio. There were no problems withcommunications during the event.
Notification and WarningSenior local officials were notified of the incident by telephone. The emergency responderswere notified when the Air Force Base contacted the Fire Department Communication Division.There were no problems with the notification of emergency personnel or senior local officials.The elapsed time between discovery of the incident and mobilization of response personnel wasless than 15 minutes and the initial decision to evacuate was made approximately three hoursafter the notification of the incident. It took approximately one hour to complete the evacuation.
The public was notified by telephone, radio and television broadcasts, and by police going doorto door. The evacuation took place all at once and there were no problems with warning andsubsequent citizen action. No one refused to evacuate.
Traffic Movement and ControlEvacuees were given instructions on where to go and were told which routes to use. Theseroutes were designated by police roadblocks. There were no special institutions evacuated.Road conditions during the evacuation were dry, and no traffic accidents or traffic-relatedproblems occurred during the event. Reverse-laning was not used.
Congregate Care CentersCongregate care centers were established at local schools and churches for this emergency andwere managed by the facility owners. It is unknown what percent of the evacuees went to thecongregate care centers. There were no shadow evacuations.
Law EnforcementPolice secured the area following the evacuation and there were no instances of looting orvandalism or any problems with law enforcement.
Re-EntryRe-entry was authorized as a joint decision between the Bossier City fire chief and Barksdale AirForce Base officials. Re-entry was not controlled, and evacuees were not compensated for theirexpenses. There were no problems reported during re-entry.
D-211
INVESTIGATOR COMMENTS
The coordinated efforts of the Air Force and the city contributed to the success of thisevacuation. It was learned that improvements could be made in notifying the public and that it isimportant to work with different agencies in training.
CONTACT INFORMATION AND REFERENCES
Contacts
Bossier City Fire Chief(318) 741-8700(Personal Communication, 8/7/03)
Bossier City HazMat Officer(318) 741-8700(Personal Communication, 8/7/03)
On August 5, 1997, a leaky valve or hose at the Chicago Specialty Corporation released 6,600 kg(3,000 ibs) of sulfur trioxide into the atmosphere, causing an evacuation of approximately 2,500people on the south side of Chicago, Illinois.
COMMUNITY CONTEXT
GeneralThe city of Chicago, Illinois, is an urban community with a population of approximately2,900,000 people and covers an area of 606 km2 (234 mi2). Approximately 2, 500 people, or lessthan 1%, of the population was evacuated from the south side suburbs of Chicago during thisincident. Ethnicity, nationality and age were not important factors in the evacuation.
The city has a mayoral form of government, and the main economic base is industry andtourism. Tourism attracts a large number of non-residents. Additionally, there is a large militarycontingent and many workers who travel into the city. The nearest nuclear power plant isDresden, located approximately 15 km (9 mi) east of Morris, Illinois.
History of EmergenciesChicago is more prone to hazards than average, and the city has had experience with chemicalleaks from manufacturing plants in the past. The community has experienced large-scaleevacuations in the past 10 years, and the community has had previous experience with thealerting mechanism used during this evacuation.
Emergencv PreparednessThe community's emergency preparedness activities include planning, training, drills andexercises, and community awareness as described below.
D-213
PlanningThe community had a written emergency plan with an evacuation section that was used in thisemergency. It is unknown if the plan conformed to NUREG-0654/FEMA-REP-1, Rev. 1, or ifthere was an ETE in the plan.
TrainingThe community provides training to emergency response personnel and regularly conducts jointtraining between industry and government.
Drills and ExercisesThe community's emergency response agencies regularly conduct emergency drills andexercises, and the emergency plan used in this evacuation was previously tested in tabletop andfull-scale exercises.
Community AwarenessThe community has a medium level of awareness about the local hazards and a low level ofawareness about evacuation procedures. It has a low level of awareness about hazardousmaterials in general, but a high level of awareness about the alerting methods used in thisevacuation.
THREAT CONDITIONS
On August 5, 1997, a leaky valve or hose at the Chicago Specialty Corporation released 6,600 kg(3,000 lb) of sulfur trioxide. The chemical escaped from a tanker truck in liquid form, thenvaporized and formed a toxic cloud that dispersed and caused an evacuation of approximately2,500 people on the south side of Chicago, Illinois. Weather conditions were hot and the roadswere dry.
CONSEQUENCES
Approximately 2,500 people were evacuated from their businesses and homes after a release ofsulfur trioxide into the atmosphere. There were no fatalities from the incident; howeverhospitals reported treating 40 people for burning eyes and related ailments. There were noinjuries from the evacuation. The estimated total cost of the evacuation-related expenses isunknown.
EMERGENCY RESPONSE
Decision MakingThe level of cooperation between local, state, and federal agencies was high, and politicalboundaries were not crossed in this event. The command, control, and coordination processescould best be described as pre-planned. The decision to evacuate was made by the Chicago FireChief, and there were no problems with the decision-making process.
D-214
CommunicationsIt is unknown if an EOC was used; however, an ICP was used in this emergency.Communication between field emergency responders and the ICP was by radio. There were noproblems with communications during the event.
Notification and WarningSenior local officials were notified of the incident by a telephone tree, and emergency responderswere notified through the 911 phone system. There were no problems with the notification ofemergency personnel or senior local officials. The elapsed time between discovery of theincident and mobilization of response personnel was less than 15 minutes. It is not known howlong it took to make the initial decision to evacuate or how long it took to complete theevacuation.
It is not known how the public was notified, but it was likely door-to-door notification. Theevacuation was completed all at once. It is unknown if people evacuated before being told to doso or if some people refused to evacuate.
Traffic Movement and ControlEvacuees were given instructions on where to go and were told which routes to use. Theseroutes were designated by police barricades. There were no special institutions evacuated. Roadconditions during the evacuation were dry and no traffic accidents or traffic-related problemsoccurred during the event. Reverse laning was not used.
Congregate Care CentersIt is unknown if congregate care centers were established for this emergency. There were noshadow evacuations.
Law EnforcementThe police secured the area following the evacuation, and there were no instances of looting orvandalism or any problems with law enforcement.
Re-EntryThe fire chief authorized re-entry, and there were no special controls in place during re-entry.Evacuees were not compensated for their expenses.
INVESTIGATOR COMMENTS
Interagency cooperation and a clear understanding of the threat were factors that made theevacuation work well. One problem with the evacuation was the need for clearercommunication and more information.
D-215
CONTACT INFORMATION AND REFERENCES
Contacts
Chicago Fire DepartmentChief of Hazmat(312) 745-1044(Personal Communication, 7/30/03)
References"Toxic Spill Forces Evacuations." Associated Press. August 5, 1997.
D-216
Plastics Plant Fire, Mason City, Iowa, May 1998, ID #79
In May 1998, a fire started in a plastics plant, causing the potential for a chlorine gas leak.Approximately 3,600 people were evacuated from their businesses and homes.
COMMUNITY CONTEXT
GeneralMason City, Iowa, is a suburban, community with a population of approximately 29,172 peopleand covers an area of 68 km2 (26 mi2). Approximately 3,600 people, or 12%, of the populationwere evacuated from a 2.6 km2 (1 mi2) area during this incident. Ethnicity, nationality, and agewere not important factors in the evacuation.
The city has a mayoral form of government and the main economic base is manufacturing.Tourism attracts large numbers of non-residents to the area. The nearest nuclear power plant ismore than 80 kn (50 mi) away.
History of EmergenciesThe area is more prone to hazards than the average city, and the city has had experience withchlorine leaks in the past. It is unknown if the community has experienced large-scaleevacuations in the last 10 years; however, they have had previous experience with the alertingmechanism used during this evacuation.
Emergenav PreparednessThe community's emergency preparedness activities include planning, training, drills andexercises, and community awareness as described below.
PlanningThe community had a written emergency plan that was used in this emergency, and the planincluded an evacuation section. It is unknown if the plan conformed to NUREG-0654/FEMA-REP-1, Rev. 1, or if there was an ETE in the plan. The plan did comply with state requirements.
D-217
TrainingThe community regularly provides training to emergency response personnel; however, jointtraining between industry and government is not regularly conducted.
Drills and ExercisesThe community's emergency response agencies regularly conduct emergency drills andexercises. The emergency plan had not been previously tested in full-scale exercises.
Community AwarenessThe community has a medium level of awareness about the local hazards and about evacuationprocedures. It has a low level of awareness about hazardous materials. The community doeshave a high level of awareness about the alerting methods used in this evacuation.
THREAT CONDITIONS
On Mother's Day in May 1998, there was a fire in the mid-afternoon at a plant that makes andstores plastics, creating a concern about the potential release of chlorine gas. As a result of thisconcern, approximately 3,600 people were evacuated. Weather conditions were dry and theroads were dry and clear. There were no unusual circumstances that occurred during the event.
CONSEQUENCES
Approximately 3,600 people within a 2.6 km2 (I mi2) area were evacuated from their businessesand homes after a fire started at a plant that makes plastics. There was a significant potential forrelease of chlorine gas, hence the need for the evacuation. There were no fatalities or injuriesfrom the incident or the evacuation. The estimated total cost of the evacuation-related expensesis unknown.
EMERGENCY RESPONSE
Decision MakingThe level of cooperation among local, state, and federal agencies was high, and politicalboundaries were not crossed in this event. The command, control, and coordination processescould best be described as pre-planned. The decision to evacuate was made by the Mason CityFire Chief, and there were no problems with the decision-making process.
CommunicationsAn EOC was not used, but there was an ICP used in this emergency. Communication betweenfield emergency responders and the ICP was by radio. There were no problems withcommunications during the event.
D-218
Notification and WarningEmergency responders were notified through the 91 1 phone system, and there were no problemswith the notification of emergency personnel. The elapsed time between discovery of theincident and mobilization of response personnel was less than 15 minutes and the initial decisionto evacuate was made approximately one hour later. The entire evacuation was completedwithin one hour.
Police going door to door notified the public, and the evacuation occurred all at once. Therewere no problems with warnings or subsequent citizen action. It is unlikely that anyoneevacuated before being told to do so, and no one refused to evacuate.
Traffic Movement and ControlEvacuees were given instructions on where to go and were told which routes to use. Theseroutes were designated by police road blocks. There were no special institutions evacuated.Road conditions during the evacuation were dry and no traffic accidents or traffic-relatedproblems occurred during the event. Reverse-laning was not used.
Congregate Care CentersCongregate care centers were established in churches and schools for this emergency; however,it is unknown how many people went to the congregate care centers. The EmergencyManagement director managed the congregate care centers. There were no shadow evacuations.
Law EnforcementPolice secured the area following the evacuation, and there were no instances of looting orvandalism or any problems with law enforcement.
Re-EntryThe Mason City fire chief authorized re-entry, and there were no special controls duringre-entry. Evacuees were not compensated for their expenses.
INVESTIGATOR COMMENTS
The evacuation worked well due to good training, a good command system and the cooperationof the police and fire departments. A lesson learned was that there needs to be a better way tonotify residents of the need to evacuate.
CONTACT INFORMATION
ContactsMason City Fire Chief(641) 421-3640(Personal Communication, 7/22/03)
D-219
Champion Technologies Inc., Odessa, Texas, August 20,1992, ID #245
On August 20, 1992, a fire at the Champion Technologies Inc. Plant, located just outside theOdessa City limits, prompted the evacuation of approximately 27,000 area residents. Thefacility stores about 702 oilfield chemicals that could pose a health hazard if inhaled. To furthercomplicate matters, weather conditions, including high humidity, caused the cloud of smoke toremain low and to blow directly over the city. There were no deaths, but 54 people were injuredbecause of the hazard. There were no deaths or injuries associated with the evacuation.
COMMUNITY CONTEXT
GeneralOdessa is a city in Texas with a total population of 90,943 people. Approximately 27,000residents (29.6% of the population) were evacuated from a suburban area of Odessa. Anestimated 550 businesses, in addition to both Permian and Winwood Malls, were evacuated.Land use in the area was primarily residential, commercial, and industrial. The total land area ofOdessa is 95.5 km2 (36.9 mi2) and the evacuated area was 72.5 km2 (28 mi2). The populationdensity of the area during the evacuation was medium. Age was an important factor in theevacuation because a nursing home with numerous senior citizens had to be evacuated. Odessais located over 50 miles away from the nearest commercial nuclear power plant.
History of EmergenciesOdessa is more prone to both technological hazards and natural disasters than the average U.S.city because it is located in a tornado-prone area and it is intersected by railroads and majorinterstates. The community did have previous experience with the hazard that led to thisevacuation, but it is unknown whether the community had experienced evacuations in theprevious 10 years.
Emergency PreparednessThe community's emergency preparedness activities include planning, training, drills andexercises, and community awareness as described below.
D-220
PlanningThe community had a written emergency plan with an evacuation section that was used in thisemergency. However, it is unknown whether the plan conformed to NUREG-0654/FEMA-REP-1, Rev. 1.
TrainingTraining is provided to emergency response personnel, and joint training between industry andgovernment is regularly conducted.
Drills and ExercisesOdessa's emergency response agencies regularly conduct emergency drills and exercises. It isunknown whether the emergency plan used in this evacuation was previously tested in afull-scale field exercise.
Community AwarenessThe level of community awareness about local hazards and about the hazard that caused thisemergency was medium. The level of community awareness about evacuation procedures andabout the alerting methods used was low.
THREAT CONDITIONS
The threat condition leading to this evacuation was a chemical spill that resulted in a fire at theChampion Technologies Inc. Plant near Odessa, Texas, at approximately 4:35 a.m. on August20, 1992. According to Champion Technologies Inc., lightning had struck a chemical storagefacility where approximately 702 oilfield chemicals were being stored. The chemicals involvedin the fire posed a possible health hazard, specifically respiratory distress and irritation if inhaledfor long periods of time. To further complicate matters, weather conditions, including highhumidity, caused the cloud of smoke to remain low and blow directly over the city. The windwas blowing to the west at 13 to 16 km/hour (8 to 10 mph), humidity was 100%, and thetemperature was 17.20C (630F). Changing wind direction forced the ICP to be moved andhindered the assessment of the evacuation boundary. There was a thunderstorm earlier that daybut roads were clear and dry during the evacuation.
CONSEQUENCES
As a result of the fire at the Champion Technologies Inc. Plant in Odessa, Texas, 27,000 peoplewere evacuated from their homes and businesses. Approximately 54 people were treated atMedical Center Hospital for symptoms, including watering and burning eyes, itching skin, anddifficulty in breathing. Among those treated were several law enforcement officers. All 54individuals were treated and released and there were no deaths. There were no deaths or injuriesassociated with the evacuation. The estimated total costs of evacuation-related expensesincurred by the public are unknown.
D-221
EMERGENCY RESPONSE
Decision MakingThere was an integrated emergency response effort of the local, state, and federal agenciesinvolved in response to the spill, explosion, and fire at Champion Technologies Inc., and thelevel of cooperation was moderate. No political boundaries were crossed. The command,control, and coordination process could best be described as pre-planned. The decision toevacuate was made by the Odessa fire chief; there were some problems with the decision-making process, and it was determined that a unified command structure was needed. Otheragencies that worked with the jurisdiction during this emergency were the Texas Railroadcommission, Texas Water Commission, Texas Air Control Board, Texas Department of PublicSafety, Southwestern Bell Telephone, and Post-Newsweek Cable. A reported 40 officers fromthe Odessa Police Department, 25 officers from the Ector County Sheriff Department andReserve Unit, 18 Texas Department of Public Safety Officers, three Ector County IndependentSchool District personnel, four Adult Probation Officers, seven Midland County SheriffDepartment Officers, and 12 Texas Department of Transportation personnel participated in theevacuation process.
CommunicationsAn EOC was used as well as an ICP. Communication between field emergency responders andthe ICP was by radio. There were no problems with the communication and equipment workedokay; however, the agency coordination could have been better. At the onset of the emergency,the assistant fire chief had been notified of the severity of the situation and in coordination withthe battalion chief, the EOC was activated.
Notification and WarningSenior local officials were notified of the incident by telephone, and emergency responders werenotified of the incident through a 911 call from an employee of Champion Technologies. Theelapsed time between the discovery of the incident and the mobilization of response personnelwas less than 15 minutes. The elapsed time between the discovery of the incident and hazardand the decision to evacuate was one hour and 20 minutes. It took approximately three and ahalf hours to complete the evacuation. The public was notified by sirens, radio and televisionbroadcasts, and by emergency responders going door to door. There were no problems withnotification of emergency personnel or senior local officials. The evacuation took place all atonce and there were no problems regarding warning and subsequent citizen action. Dispatchersnotified fire department personnel, and fire units were dispatched to the scene of what was thenconsidered a two-alarm fire. The battalion chief responded to the scene of the fire. Afterassessing the scene, other fire department personnel were requested to assist firefighters at thelocation. The Odessa Fire Department Hazmat Unit was also dispatched. Law enforcementofficers, aided by volunteers from the public and private sector, notified residents of the need toleave their homes and businesses based upon information provided by the spotters. Aftersounding sirens to awaken the residents, door-to-door contact was made to warn and evacuatecitizens. The broadcast news media and local cable company, in conjunction with reports from
D-222
the public information officer, provided regular updates on the fire situation, areas to beevacuated and the location of congregate care centers. The excellent news coverage of theemergency was beneficial to the overall operations and was closely followed by key officials inthe EOC, enabling them to grasp the magnitude of the situation even though they were removedfrom the scene.
Traffic Movement and ControlEvacuees were given instructions about where to go to seek congregate care centers and weregiven specific routes. Several special institutions were evacuated, including two nursing homes,two malls, one elementary school, and 550 small businesses. Road conditions before theevacuation were dry and all major roadways were available to evacuees. There were no specialtraffic problems encountered and reverse-laning was not used. Some people spontaneouslyevacuated; however, no one refused to evacuate.
Congregate Care CentersBy 7 a.m. the American Red Cross had established congregate care centers at the Odessa HighSchool Field House and the Odessa College Sports Complex. Approximately 1,000 individuals(3.7% of evacuees) registered at the congregate care centers. EMS units dispatched to theAvalon Place Nursing Home assessed the need to send patients directly to Medical CenterHospital for more specialized care. Transportation buses provided by Ector County includedthose equipped for persons with disabilities.
Law EnforcementLaw enforcement personnel from the Odessa Police Department, Ector County SheriffDepartment, and Texas Department of Public Safety were called in for assistance and securedthe area following the evacuation. Aid from law enforcement personnel included securing thearea, traffic control and evacuation of citizens in the threatened area. There were no instances oflooting or vandalism and no problems with law enforcement.
Re-EntryThe evacuation order was lifted at 10:42 a.m.; citizens were allowed to return home andbusinesses were allowed to open. The Odessa Fire Chief authorized re-entry. There were nospecial controls during the re-entry process. Evacuees were not compensated for their expensesand there were no problems during re-entry.
INVESTIGATOR COMMENTS
The success of this emergency response operation with such a massive evacuation was a result ofthe tremendous cooperation and expertise of all individuals involved, coupled with pre-planningand training. Areas of improvement identified by city and county personnel includedcommunications (phone and radio), notification, public education, equipment, and EOCarrangement.
D-223
1. Communications - add additional phone lines in the EOC, use cellular phones, use RACESmore, and divert incoming calls to a phone bank to keep from tying up the EOC's lines.
2. Notification - keep a list in the EOC for first call up and assign non-key personnel to makecontacts, as necessary.
3. Public Education - work with media to teach the public to stay off phones during disasterexcept for emergencies and not to contact 911 for informational purposes; have moreprograms to educate the public about various types of emergencies and how to react.
4. Equipment - arrange for fax machine in the EOC to send group information to media, etc.;use governmental access channel for training and to display emergency information updatedfrom EOC/PIO, arrange for additional phones and radios for EOC.
5. EOC Arrangement - work to decrease noise level in the EOC; rearrange room to maximizeuse of space by moving phone bank into the hallway; move key officials into another area.
CONTACT INFORMATION AND REFERENCES
Contacts
Odessa Fire Chief(915) 335-4650(Personal Communication, 8/5/03)
D-224
Liquified Chlorine Gas Leak, Henderson, Nevada, May 6, 1991, ID #36
A massive leak of liquefied chlorine gas created a dangerous cloud over the city of Henderson,Nevada, May 6, 1991. The leak originated at the Pioneer Chlor Alkali facility located in anindustrial area approximately 10 miles southeast of Las Vegas, Nevada. Pioneer is one ofseveral chemical and materials processing facilities that are located in the Basic ManagementInc. complex. More than 200 persons were examined at local hospitals, including somepolicemen who were exposed to chemicals while managing evacuation activities.
COMMUNITY CONTEXT
GeneralThe city of Henderson, Nevada, is a suburban community with a population of approximately207,640 people and covers an area of approximately 154 km2 (96 mi2). Approximately 7,000people, or 3%, of the population were evacuated from an area of several square kilometersduring this incident. Ethnicity, nationality, and age were not important factors in the evacuation.
The city has a mayoral form of government, and the main economic base is tourism. Tourismattracts a large number of non-residents to the area. The nearest nuclear power plant is morethan 80 km (50 mi) away, and there are no commercial nuclear power plants in Nevada.
History of EmergenciesThe community is more prone to hazards than average, and the city has had experience withchemical leaks from manufacturing plants in the past. Several hazardous material incidents haveoccurred in the immediate area, including an explosion of ammonium perchlorate at an adjacentfacility in 1988, which resulted in two deaths and 372 injuries. The community has experiencedlarge-scale evacuations in the last 10 years; however, it is unknown if the community hadprevious experience with the alerting mechanism used during this evacuation.
D-225
Emergency PreparednessThe community's emergency preparedness activities include planning, training, drills andexercises, and community awareness as described below.
PlanningThe community did not have a written emergency plan for use in this emergency.
TrainingThe community provides training to emergency response personnel and regularly conducts jointtraining between industry and government. Joint training exercises had been conducted with theClark County Fire Department HazMat Team and other area fire departments.
Community AwarenessThe community has a medium level of awareness of the local hazards and a low level ofawareness of evacuations procedures. It has a low level of awareness of hazardous materials ingeneral, and with the alerting methods used in this evacuation.
THREAT CONDITIONS
Liquid chlorine is stored in pressure tanks at the facility. A leak was first detected by automaticmonitoring equipment located near the storage tanks at approximately 1:10 a.m. on May 6, 1991.Employees responding to the alarm found a pinhole size leak in a pipe. Attempts were made byplant personnel to stop the flow and patch the leak. Management personnel were notified andmembers of the company's emergency team were called to respond to the plant. Plantemployees were considered to be proficient in handling situations of this type.
At approximately 1:50 a.m. a citizen notified the Henderson Police Department of a strongoffensive odor near the complex. The call was relayed to the Las Vegas City Fire DepartmentCommunications Center, which provides communications for the Clark County Fire Department.Since reports of odors in the area are a frequent occurrence, the Clark County battalion chief wasnotified and he made the decision to wait for a more positive report before responding. Thecommunications personnel began to call the industries in the area to ask if any of them had aproblem.
At approximately 2 a.m., a second call was received and the fire department was dispatched.Arriving at the gate of the facility, the Clark County battalion chief found several employeeswho had been exposed to chlorine gas and were in need of medical attention. Within a fewminutes, the atmosphere around the plant entrance became enveloped by the chlorine cloud andmost of the plant employees donned their emergency escape respirators. All fire department and
D-226
plant personnel evacuated to a location approximately one half mile from the plant where acommand post was established.
It was very difficult to accurately predict the size or travel of the gas cloud resulting from thevaporization of the liquid pool on the ground. The flow rate of the leak could not be determined,and the size of the resulting liquid pool could not be observed. The developing cloud could notbe visually monitored because of the darkness and the location of the problem within the facility.
Weather conditions were clear and dry and the roads were dry.
CONSEQUENCES
The chlorine gas created a dangerous cloud of poison over the city of Henderson, Nevada,May 6, 1991. The leak originated at the Pioneer Chlor Alkali facility in an industrial area whereseveral chemical and materials processing facilities are located. All of the adjacent industrialfacilities were shut down and evacuated except one critical facility where employees donnedself-contained breathing apparatus and continued working.
At approximately 3:30 a.m. conditions began to deteriorate rapidly. The command post andstaging area were suddenly enveloped by the gas and had to be evacuated. The command postwas relocated first to a convenience market parking lot, which also became unacceptable, andthen to a race track parking lot several miles from the facility. Reports of strong odors in theresidential areas and downtown portions of Henderson caused the IC to begin evacuations ofresidents. At approximately 3:45 a.m. a state of emergency was declared by the CountyManager and the Clark County Emergency Operations Center was activated.
Approximately 7,000 people were evacuated from their businesses and residences. More than200 persons were examined at local hospitals, including some policemen who were exposed tochemicals while managing evacuation activities. There were no fatalities from the incident orthe evacuation. The estimated total cost of the evacuation-related expenses is unknown.
EMERGENCY RESPONSE
Decision MakingThe level of cooperation between local, state, and federal agencies was high, and politicalboundaries of the city and county were crossed in this event. The command, control, andcoordination processes could best be described as ad hoc. The decision to evacuate was made bythe Battalion Chief for Clark County, and there were no problems with the decision-makingprocess.
CommunicationsAn EOC and an ICP were used in this emergency. The EOC was activated at 3:45 a.m. when theCounty Manager declared a state of emergency. The field ICP was relocated three times during
D-227
the emergency. Communication between field emergency responders and the ICP was by radioand cell phone. There were problems with communications during the event: the agencies andjurisdictions involved used a variety of radio systems and frequencies. This problem wassomewhat resolved through the use of cell phones to supplement the radio communications.
Notification and WarningIt is unknown how senior local officials were notified of the incident. Emergency responderswere notified through the 911 phone system. There was a delay in the notification of emergencypersonnel while the battalion chief waited for a more positive report. There were no problemsnotifying senior local officials. The elapsed time between discovery of the incident andmobilization of response personnel was approximately 50 minutes and the initial decision toevacuate was made approximately four hours after the start of the incident. It tookapproximately four hours to complete the evacuation, which started with the surroundingindustrial facilities and expanded to approximately 7,000 people.
The public was notified by use of a PA system and by police going door to door. The evacuationwas completed all at once. It is unknown if some people evacuated prior to being told to do so,and no one refused to evacuate.
Traffic Movement and ControlEvacuees were given instructions on where to go and were told which routes to use. Theseroutes were designated by police road blocks. There was one special institution evacuated andthis was a retirement home in the direct path of the gas cloud. Additionally, the St. RoseDominican Hospital in downtown Henderson was located within the affected area. A decisionwas made to leave the patients in the building with the air handling system set to recirculate theinterior air. This was determined to be preferable to risking moving the patients outside into thecontaminated atmosphere. Road conditions during the evacuation were dry, and no trafficaccidents or traffic-related problems occurred during the event. Reverse-laning was not used.
Congregate Care CentersCongregate care centers were established at local schools and hotels in Las Vegas for thisemergency and were managed by the Red Cross. The Clark County School District made schoolbuses available to the Fire Department and 50 off-duty firefighters were called in to drive them.Each bus driver was provided with an SCBA, in case a contaminated area was encountered, andtwo teams were made up of full crews of SCBA-equipped firefighters standing by to take busesinto the contaminated areas to rescue residents in immediate danger. Police officers wereassigned to notify residents in the predicted path of the cloud, while firefighters were assigned toareas where the presence of chlorine could be detected. Approximately 700 people, or 10% ofthose evacuated, went to the congregate care centers. There were shadow evacuations; however,this did not have an impact on congregate care center capacity or the evacuation.
D-228
Law EnforcementPolice secured the area following the evacuation, and there were no instances of looting orvandalism or any problems with law enforcement.
Re-EntryRe-entry was authorized as a joint decision between the Las Vegas, County, and HendersonUnified Command. The re-entry was controlled and no problems were encountered. Evacueeswere not compensated for their expenses.
INVESTIGATOR COMMENTS
The unified command working together contributed to the success of this evacuation. Oneproblem was there were no qualified personnel to drive the evacuation buses.
Additional lessons learned include:
* The problems associated with a high-risk occupancy in one jurisdiction creating a problem ina different jurisdiction present obvious challenges for emergency planning responseagencies. In this case the responding agencies worked well together, but the deficiencies ofthe regulatory and planning processes were a major focus of attention after the incident.
* The Incident Command System proved to be extremely effective in this incident, particularlyin coordinating the efforts of several different agencies at the scene. The ability to assignmajor responsibilities to command officers from different fire departments, without anyproblems, is evidence that the personnel are trained and prepared to operate effectively.
* The lack of effective radio communications among agencies was a problem in this incident.Cell phones were used effectively to supplement public safety radio capabilities and provedreliable. Had the system become overloaded with calls during the incident, Centel Cellularwould have blocked off communications, allowing only emergency personnel phones towork.
* Making the decision of whether to evacuate residents or warn them to remain indoors withwindows and outside air inlets closed is critical. The risk of exposure during evacuation maybe greater than the risk of staying indoors.
* The use of buses operated by fire department personnel is a practical means to evacuate. It iseasier to train fire fighters to drive buses than to train bus drivers to use SCBA.
* Police officers who were not provided with or trained to use SCBA were effective inevacuating areas ahead of the contamination, but could not function in contaminated areas.Several police officers who were assigned traffic control or to assist with the evacuationwere exposed to chlorine and transported themselves to medical facilities for evaluation.
D-229
* It proved to be extremely difficult to determine the size, shape, and movement of the chlorinecloud. Helicopter observation was a valuable asset, particularly with increasing daylight.An attempt was made to predict dispersion of the chlorine using CAMEO (a computer code)but complicated factors of terrain, slope, temperature, wind velocity, humidity and unknownrate of release made predictions extremely difficult.
CONTACT INFORMATION AND REFERENCES
Contacts
Henderson Fire Chief(702) 565-2436(Personal Communication, 7/21/03)
Clark County Deputy Chief(702) 455-7311(Personal Communication, 7/21/03)
References
Routley, J. G. "Massive Leak of Liquefied Chlorine Gas, Henderson, Nevada," May 6, 1991;Federal Emergency Management Agency Report.
D-230
Railroad Accident, Shepherdsville, Kentucky, November 19, 1991, ID #92
A freight train derailment sent 14 cars, including one carrying explosive chemicals and onecarrying cluster bombs, plunging off a railroad bridge just after noon on November 19, 1991 onthe main rail line between Louisville and Nashville. Approximately 1,000 people in downtownShepherdsville, Kentucky, plus homes and businesses within 1.6 km (1 mi) of the wreck wereevacuated. The evacuation included four schools and the Bullitt County Jail. The derailmentwas caused by a garbage truck that struck part of the bridge moments before the train passed.The governor declared the site a disaster area, which allowed use of National Guard personneland equipment to handle the emergency.
COMMUNITY CONTEXT
GeneralShepherdsville Kentucky, is an urban community with a population of approximately 8,334people and covers an area of 27.9 km2 (10.8 mi2). Approximately 1,000 people, or 12%, of thepopulation were evacuated from a 7.68 km2 (3 mi2 ) area during this incident. The land use in thearea is mainly residential, commercial and industrial, and the population density of the area washigh at the time of the evacuation. Ethnicity, nationality, and age were not important factors inthe evacuation.
The city has a mayoral form of government, and the main economic base is commercial activity.There are no special characteristics that attract large numbers of visitors to the area. The nearestnuclear power plant is more than 80 km (50 mi) away. Kentucky has no nuclear power plants.
History of EmergenciesThe community is more prone to hazards than average but has not had experience with this typeof emergency in the past. The community has not experienced large-scale evacuations in the last10 years and had no previous experience with the alerting mechanisms used in this emergency.
Emergency PreparednessThe community's emergency preparedness activities include planning, training, drills andexercises, and community awareness as described below.
D-231
PlanningThe community has a written emergency plan with an evacuation section that was used in thisemergency. It is unknown if the plan conformed to NUREG-0654/FEMA-REP-1, Rev. 1, or ifthere was an ETE in the plan.
TrainingThe community provides training to emergency response personnel and regularly conducts jointtraining between industry and government.
Drills and ExercisesThe community's emergency response agencies regularly conduct emergency drills andexercises. The emergency plan used in this evacuation was not previously tested in full-scalefield exercises.
Community AwarenessThe community has a low level of awareness of the local hazards and a low level of awareness ofevacuations procedures. It also had a low level of awareness of the hazards in this incident,including hazardous materials and cluster bombs in general, and a medium awareness of thealerting methods used in this evacuation.
THREAT CONDITIONS
On November 19, 1991, a garbage truck struck a trestle leading to a bridge causing the tracks tomove 30 cm (12 in) laterally and 10 cm (4 in) vertically. A freight train crossing the bridgederailed sending fourteen cars plunging off a railroad bridge just after noon. A total of 28 carsderailed. One of the cars that derailed, but did not go over the bridge carried 4,100 kg (9,000 lb)of explosives, including 90 cluster bombs. Of the 14 cars that fell over the bridge, onecontaining corn syrup and one containing construction materials caught fire.
The 89-car train was passing over the Salt River about 32 km (20 mi) from Louisville just afternoon at about the same time the truck struck the bridge. The accident occurred on the main railline between Louisville and Nashville. The weather was wet and the roads were wet.
CONSEQUENCES
Approximately 1,000 people in downtown Shepherdsville, Kentucky, plus homes and businesseswithin 1.6 km (I mi) of the wreck were evacuated as a result of the accident. Some of the carscontained chemicals and explosives, prompting officials to evacuate the area. Additionally,some of the cars, not near the explosives, caught fire. The evacuation included four schools andthe Bullitt County Jail. The governor declared the site a disaster area, which allowed use ofNational Guard personnel and equipment to handle the emergency.
D-232
There were no fatalities from the incident, but four firefighters became ill and had to be taken tothe hospital. No injuries were reported during the evacuation. The estimated total cost of theevacuation-related expenses is unknown.
EMERGENCY RESPONSE
Decision MakingThe level of cooperation among local, state, and federal agencies was high, and politicalboundaries were crossed in this event. The command, control, and coordination processes couldbest be described as pre-planned. The decision to evacuate was made by the fire chief, and therewere no problems with the decision-making process.
CommunicationsAn EOC was used in this event and an ICP was established. Communication between fieldemergency responders and the ICP was primarily by radio. There were problems withcommunications during the event; different frequencies were being used by different agencies.
Notification and WarningSenior local officials were notified of the incident by telephone. The emergency responderswere notified through a fire lieutenant who saw the accident. There were no problems with thenotification of emergency personnel or senior local officials. The elapsed time betweendiscovery of the incident and mobilization of response personnel was less than 15 minutes, andthe initial decision to evacuate was made approximately 10 minutes after notification of theincident. It took approximately 8 hours to complete the evacuation.
Evacuees were notified by radio and television broadcast and directly by the police using a PAsystem. The evacuation was staged; as information became available on the contents of therailcars, additional areas were evacuated. There were no problems with warning and subsequentcitizen action. No one refused to evacuate.
Traffic Movement and ControlEvacuees were given instructions on where to go and were told to use specific routes. Policeroadblocks and traffic control were used to direct traffic. A number of special institutions wereevacuated, including the Bullitt County Jail, four schools, a day care facility, and City Hall.Road conditions during the evacuation were wet but no traffic accidents or traffic-relatedproblems occurred during the event. State Highway 61 was closed because of the incident butthis did not create problems. Reverse-laning was not used.
Congregate Care CentersCongregate care centers were established at local schools and public buildings for thisemergency and were managed by the Red Cross. Approximately 200 evacuees, or 20%, went tothe congregate care centers while the remaining evacuees went to friends or relatives. Therewere no shadow evacuations.
D-233
Law EnforcementState and county police secured the area following the evacuation and there were no instances oflooting or vandalism or any problems with law enforcement.
Re-EnttyRe-entry was authorized by the Kentucky Division of Disaster and there were no special controlsduring the re-entry process. Evacuees were not compensated for their expenses. There were noproblems reported during re-entry.
INVESTIGATOR COMMENTS
Cooperation of the residents in this event was likely enhanced because of the unknown potentialconsequences and this cooperation contributed to the success of this evacuation. Improvementscould be made in communications with various agencies, and communication equipment such asadditional and standard frequencies are needed. Lessons learned included the importance ofagency cooperation.
CONTACT INFORMATION AND REFERENCES
Contacts
Shepherdsville Fire Chief(502) 543-6833(Personal Communication, 8/6/03)
References
Gibson, A. "Train Plunges off Bridge South of Louisville." Associated Press. November 20,1991.
Schreiner, B. "Crews Remove Cluster Bombs from Site of Derailed Train." Associated Press.November 21, 1991.
"Train Carrying Chemicals, Bombs, Plunges off Bridge." Associated Press. November 20,1991.
D-234
Rodeo-Chediski Fire, Show Low, Arizona, June 18, 2002, ID #116
The Rodeo-Chediski Fire in Show Low, Arizona, began as two separate fires. The Rodeo Fire,which was started on June 18, 2002, combined with the Chediski Fire on June 23, 2002, and wasfinally contained on July 7, 2002. The combined fire forced the evacuation of approximately20,000 people.
COMMUNITY CONTEXT
GeneralShow Low is a rural town in east central Arizona. For the majority of the year, it has a totalpopulation of 7,695 people and the population increases to around 20,000 people during thesummer season. Approximately 20,000 residents (100% of the population) were evacuated aftera wildfire approached the town. Land use in the area was primarily residential and commercial.The total area of Show Low and the evacuated area is 72.3 km2 (27.9 mi2). The populationdensity of the area during the evacuation was low. Ethnicity, nationality, and age were notimportant factors in this evacuation.
Show Low has a council/manager form of government and its main economic base is tourism,which attracts a large number of non-residents, and retail. The community is located more than50 miles away from the nearest commercial nuclear power plant.
History of EmergenciesShow Low is more prone to natural disasters and technological hazards than the average U.S.community. The community has had previous experience with hazardous material spills, floods,earthquakes and the hazard that led to this evacuation. The community had not experiencedevacuations in the previous ten years or had previous experiences with the alerting mechanismused in this evacuation.
Emergencv PreparednessThe community's emergency preparedness activities include planning, training, drills andexercises, and community awareness as described below.
D-235
PlanningThe community had a written emergency plan with an evacuation section that was used in thisemergency. The plan did not conform to NUREG-0654/FEMA-REP-1, Rev. 1, and it isunknown if the plan contained an ETE.
TrainingTraining is provided to emergency response personnel, and joint training between industry andgovernment is regularly conducted.
Drills and ExercisesShow Low's emergency response agencies regularly conduct emergency drills and exercises.The emergency plan used in this evacuation was not previously tested in a full-scale fieldexercise.
Community AwarenessThe level of community awareness of local hazards was medium and the level of communityawareness of evacuation processes was high. The level of community awareness about thehazard that caused the evacuation and the alerting methods used was high.
THREAT CONDITIONS
The Rodeo-Chediski fire burned in east-central Arizona from June 18, 2002, and was notcontrolled until July 7. It was the worst fire in Arizona to date, consuming 467,066 acres ofwoodland. Initially there were two separate fires. The first fire, the Rodeo Fire, was reported onthe afternoon of June 18 near the Rodeo Fairground on the Fort Apache Reservation. Anarsonist was arrested on June 29 and was later charged. By early evening, despite the efforts offire crews, approximately 1,200 acres were ablaze. Increasing wind speeds fed the fire to morethan 2,000 acres by the following morning and when wind speeds increased to around 25 mph,the fire grew rapidly, increasing fourfold over the next three hours. By June 21, the Rodeo firehad consumed approximately150,000 acres.
The Chediski fire, which was first reported on the morning of June 20 near Chediski Peak, hadbeen started by a lost hiker who was later arrested and charged. Again fed by strong winds, ithad spread to 2,000 acres by mid-afternoon, and by the following morning it covered more than14,000 acres.
Show Low was evacuated in the early evening. Weather conditions were very warm and theskies were smoky. No unusual circumstances occurred other than the hazard itself.
CONSEQUENCES
On June 18, 2002, 20,000 residents were evacuated from their homes and businesses and wereable to return home on July 7, 2002. No deaths or injuries were associated with the incident or
D-236
the evacuation. The total cost of evacuation-related expenses and property damages incurred bythe public is unknown.
EMERGENCY RESPONSE
Decision MakingThe level of cooperation among local, state, and federal agencies was high. County and federalpolitical boundaries were crossed. The command, control, and coordination process could bestbe described as ad hoc. The decision to evacuate was made by a unified command, and therewere no problems with the decision making process.
CommunicationAn EOC was used along with an ICP. Communication between field emergency responders andEOC was by radio, telephone, and runners. There were no problems with communication.
Notification and WarningSenior local officials were notified of the incident through paging and visual observations of thefire. Emergency responders were notified of the incident through government channels. Theelapsed time between the discovery of the incident and the mobilization of response personnelwas approximately 18 hours. The elapsed time between the start of the hazard and the decisionto evacuate was three days. It took four hours to complete the evacuation, and there were noproblems with notification of emergency personnel or senior local officials. The public wasnotified by radio and television broadcasts, PA systems, and emergency responders going doorto door. The evacuation took place all at once, and there were no special problems regardingwarning and subsequent citizen action.
Traffic Movement and ControlEvacuees were given specific instructions about where to go when they evacuated and specificroutes to use. One hospital and two nursing homes had to be evacuated. Road conditions beforethe evacuation were dry, and all major roadways were available to evacuees. There were notraffic accidents during the evacuation and reverse laning was used. Some people spontaneouslyevacuated before being told to do so, and others refused to evacuate.
Congregate Care CentersThe American Red Cross set up congregate care centers at various schools; approximately 8,000people (approximately 40%) of the evacuees showed up. There were shadow evacuations butthey did not impact traffic or congregate care center capacity.
Law EnforcementThe National Guard secured the area following the evacuation and no instances of looting orvandalism, occurred, nor were there any problems with law enforcement. A small army of lawenforcement officers and National Guard troops patrolled the evacuated area to prevent lootingand vandalism. Roughly 100 Maricopa County Sheriff's Office posse members and 130 Arizona
D-237
Army National Guardsmen were among the 500 extras called in to help the Navajo CountySheriff's Department keep order in and around Show Low.
Re-EntryOn July 7, 2002, nineteen days since the start of the emergency, the unified command authorizedre-entry and allowed evacuees to return to their homes. No special controls were used during there-entry process. No major problems occurred during re-entry. Evacuees were compensated fortheir expenses.
INVESTIGATOR COMMENTS
According to the Show Low fire chief, the public's pre-education about evacuations and firehazards contributed to the success of the evacuation. However, the evacuation was difficultbecause some people did not have local television stations and were not notified of theevacuation. What to do with evacuees' animals and livestock was also a problem.
CONTACT INFORMATION
Contacts
Show Low Fire Chief(928) 537-5100(Personal Communication, 8/22/03)
The Biscuit Fire started July 13, 2002, from a lightning strike approximately 8 km (5 mi) west ofSelma, Oregon, in the Siskiyou National Forest within the Kahniopsis Wilderness. The firecontinued burning through July and August of 2002, burning over 2,000 km2 (500,000 acres).The fire had a 332 km (206 mi) perimeter and encompassed two regions, two national forests,five ranger districts, and many cooperating agencies. The vegetation, terrain, fire behavior,environmental factors, public concern and duration of this event made it an extremely complexoperation. The Shelley Creek Fire, Sour Biscuit Fire and Florence Fire all combined in earlyAugust, and the fire was renamed the Biscuit Fire. During the fire, many towns andcommunities were placed on evacuation notice and ultimately more than 1,000 people wereevacuated from their homes. The path of the fire provided opportunities for fire officials toprovide early evacuation warning to residents, which contributed to the smooth evacuationprocess in the areas affected.
COMMUNITY CONTEXT
GeneralOn July 13, 2002, a lightning strike caused a fire approximately 8 km (5 mi) west of Selma,Oregon, near the town of Cave Junction. The size of Cave Junction is 4.2 km2 (1.6 mi2) with apopulation of 1,363 residents in the town and an additional 15,000 rural residents in the area, fora total population in the area of almost 17,000 people. The area is frequented by vacationers inthe summer, and the population density during the evacuation was medium.
As the fire grew, the entire town of Cave Junction was put on 24-hour evacuation notice. TheBiscuit fire evacuations totaled more than 1,000 people spread over a number of communities.The Red Cross registered 950 people evacuating Cave Junction, which represents approximately70% of the population. Cave Junction is a small town run by a mayor. It is the gateway to theOregon Caves National Monument and is the commercial, service, and cultural center for a ruralcommunity of small farms, woodlots, and crafts people. The valley is in the basin of the IllinoisRiver Valley and its tributaries and includes a number of small communities, all of which wereimpacted during the Biscuit Fire. The nearest commercial nuclear plant, the ColumbiaGenerating Station, is located in Richland, Washington, more than 80 km (50 mi) from the fire.
D-239
The evacuations did not impact operations and did not enter the emergency planning zone (EPZ)of the reactor.
History of EmergenciesThe Cave Junction area, including Gasquet, California, is more prone to natural disasters thanthe average community. The area has been identified as being at risk from previous wildfires,including the 1987 Silver Fire. Beginning in the spring of 1996 when the Gasquet Shaded Fuelbreak was burned, work began to reduce fuels to protect this community. The reduction in fuelsproved to be critical when, in September 1996, the Panther Fire threatened Gasquet. The PantherFire almost forced an evacuation of the community.
Additional hazards included flooding in 1997. After the floods, the Rogue Valley InterfaithRelief Network was established to support emergency responders in a variety of ways.
Emergency PreparednessThe community's emergency preparedness activities include planning, training, drills andexercises, and community awareness as described below.
PlanningAn evacuation plan was available and was used in this event. The recommendation forevacuations is a joint responsibility of the fire-fighting organization and local officials. Theincident commander manages the fire and gives recommendations to local law enforcementofficials, the Josephine County sheriff. The sheriff then initiates the evacuation.
These evacuations covered multiple communities. To address the public concern and provideup-to-date information, many community meetings were held with the local, state, and federalofficials. Residents were urged to listen to the radio and television for current updates on theevacuation status, and were requested to be ready to leave within 30 minutes upon notification ofan evacuation. This is in effect an evacuation time estimate and there were no reports ofindividuals not evacuating within the allotted time. The evacuation plan was specific to the fireand likely did not meet the requirements of NUREG-0654/FEMA-REP-1, Rev. 1.
TrainingThe sheriff's office coordinates the evacuations and personnel receive emergency responsetraining. The Rogue Valley Interfaith Relief Network was established to support emergencyresponders. The volunteers are members of regional churches; they go through extensivetraining to support the response and evacuation efforts.
Drills and ExercisesIf drills or exercises were conducted, they were not reported.
D-240
Community AwarenessThe Cave Junction area is a community that was known to be at risk of forest fire, andcommunity awareness was high. Videos were distributed and public meetings had been held topersuade owners to thin trees and replace roofs with non-burning materials. Grants wereavailable to help defer some of the costs.
THREAT CONDITIONS
What ultimately became known as the Biscuit fire started on July 13, 2002, with a lightningstrike approximately 8 km (5 mi) west of Selma, Oregon, in the Siskiyou National Forest withinthe Kalmiopsis Wilderness. The Sour Biscuit fire spread and eventually combined with theShelley Creek Fire and Florence Fire and was renamed the Biscuit Fire. The fire was one of thelargest in Oregon history, burning over 2,000 km2 (500,000 acres). Throughout most of theevent, the weather was hot, dry, and windy. Roads were clear and dry, but many local roads,including Rowdy Creek Road, Low Divide Road and others were either closed or open only toresidents. In addition, Highway 199 was closed because of the fire.
CONSEQUENCES
The Biscuit Fire, which started from a lightning strike on July 13, 2002, was one of the largest inOregon history, burning more than 2,000 km2 (500,000 acres), and having a 332 km (206 mi)perimeter and a 48 km (30 mi) front. The changing winds and hot weather made fighting the firedifficult and kept the surrounding communities on evacuation alert. Many communities werepartially evacuated, including Cave Junction, Oak Flat, Gasquet, Low Divide, and Rowdy Creek.As a result of the fire, more than 1,000 people were evacuated. In addition, three homes weredestroyed in California, two homes were destroyed in Oak Flat, Oregon, and eight buildings atthe McCaleb Boy Scout Ranch were destroyed. At least four firefighters were injured inaccidents.
EMERGENCY RESPONSE
Decision MakingThe level of cooperation among local, state, and federal agencies was high. Some of the local,state and federal agencies involved in this emergency included the Jackson County sheriff,Josephine County sheriff, Oregon State fire marshal, Oregon National Guard, Illinois Valley FireDistrict, U.S. Forest Service, Bureau of Land Management, and firefighters from Canada,Australia, and New Zealand.
The fire crossed multiple political boundaries, including city, county, and state borders and wasmanaged by the Southwest Oregon National Interagency Area Command Team from a center inMedford, Oregon. The fire was divided into four administrative zones that were managed byseparate Incident Management Teams. The decisions to evacuate were made by the local sheriffafter receipt of information from the incident commanders that the fires had crossed trigger lines.
D-241
CommunicationsThe command, control and coordination processes could best be described as pre-planned.EOCs were established in accordance with emergency plans. The fire was divided into fouradministrative zones that were managed by separate Incident Management Teams. The teamsclosely coordinated their activities to construct fire lines, conduct bum-out operations andprotect rural communities. Zone 1 had a command center in Lake Selmac, Oregon. Zone 2managed the southern portion of the fire in northern California from a command center inCrescent City, California. Zone 3 managed the southwestern flank of the fire with a commandcenter east of Brookings, Oregon. Zone 4 managed the northwestern portion of the fire from acommand center in Gold Beach, Oregon. Radio was the primary means of communication.
Notification and WarningThere was considerable time between the start of the fire on July 13 and the initiation ofevacuations, most of which occurred in August. As the fire grew and encroached upon thecommunities, the sheriff and fire officials maintained frequent communication with localofficials. During this time, the sheriff and fire officials also notified the public of the currentstate of the fire through community meetings. The local television and radio stations were alsoused to keep the public posted on the evacuation notices. In some instances firefighters wentdoor-to-door.
Most communities were provided 24-hour notice, followed by an eight-hour notice andsometimes as short as a one-hour notice. These evacuation notices notified residents that anevacuation order could come within the specified period. Residents should be prepared to leavewithin 30 minutes if an evacuation order was issued. There was some confusion during a publicmeeting in Gasquet at the American Legion Hall on August 5. The sheriff, federal and local fireofficials notified the public that the fire had crossed a trigger point and that the residents shouldbe on a one-hour evacuation notice alert. However, many residents understood this to mean theyshould evacuate. The following evening, the sheriff clarified the statement through the mediathat an evacuation order was not in place, only an evacuation notice. This likely resulted inshadow evacuations; however, the number of residents leaving was not identified.
The time to complete the evacuation was generally within the time allotted for the specifiedevacuation. There were no reports of evacuation notices not providing sufficient time to leave.
The Rogue Valley Interfaith Relief Network supported the communication link by answeringtelephones for residents calling and requesting the status of the fire and the current evacuationplans, including which roadways were open and directions to go in the event of an evacuation.There were no problems with notification of either local officials or responders. There were nospecial problems with warning the public, although many of the affected residents refused toleave. Many had built their homes and were not going to leave them unprotected.
D-242
Traffic Movement and ControlThroughout the incident, roads were clear and dry. Highway 199 was the largest road impacted;it was closed early on in the incident. Many local roads, including Rowdy Creek Road, LowDivide Road, and others were either closed or open only to residents. Evacuation routes wereestablished by road closure barricades and reinforced by sheriff s deputies providing informationto the residents as they were ordered to evacuate. The McCaleb Boy Scout Ranch was evacuatedand there were no reports of problems with this evacuation. There were also no reports of trafficaccidents occurring during the evacuations.
Congregate Care CentersThe American Red Cross established a number of evacuation congregate care centers throughoutthe event. Congregate care centers were set up at Crescent Elk School in Gasquet, Riley CreekSchool in Gold Beach, and Grants Pass South Middle School. In addition, the Seventh DayAdventist Churches in the Cave Junction area opened their facilities to evacuees who neededshelter.
The Red Cross reported 950 people registered as having left Cave Junction. They also reported53 people staying at the Grants Pass South Middle School on August 2. In addition, the RedCross reported that people were staying at motels, with friends, or at campsites until theevacuation notices were lifted. There were no reports on the number of people staying at theremaining congregate care centers or at the Seventh Day Adventist facilities. The Red Crossalso made arrangement for pets and livestock, but there were no reports on numbers of animalssheltered.
Law EnforcementThe evacuated areas were secured by barricades set up by the Sheriff's departments. There wereno reported instances of looting or vandalism or any problems identified with law enforcement.
Re-EntryThe sheriff generally authorized re-entry for each of the evacuated areas. Information wasconveyed to the public through the media that it was safe to return home. Public meetings wereheld frequently to update the populace on evacuation conditions. Evacuees were notcompensated for their expenses, and there were no reports on the total cost of the evacuations.
INVESTIGATOR COMMENTS
The considerable time between the start of the fire and the initiation of evacuations wasimportant for the success of these evacuations. Communication between officials and residentsthrough town meetings and use of the media kept the public very aware of the threat andprovided the current status of potential evacuations at frequent intervals, which contributed tothe success of this event.
D-243
REFERENCES
References
Biscuit Fire Chronology<http://www.biscuitfire.comnpdf/chron-july-ext-attack.pdf> (June 2003).
CBS News. "Oregon's 30 mile wall of flames." August 4, 2002.<http://www.cbsnews.com/stories/2002/08/01/national/main5I7254.shtml> (June 2003).
CBS News. "Oregon Valley gets reprieve from fire." August 2, 2002.<http://www.cbsnews.com/stories/2002/08/05/national/main517525.shtml> (June 2003).
City of Ashland, Oregon. "Ashland City News: August 21 Biscuit Fire Update." August 21,2002. <http://www.ashland or.us/newsresults.asp?NewsID=859> (June 2003).
CNN. "Fireline last defense from Oregon wildfire." July 31, 2002.<http://www.cnn.com/2002/US/07/3 1/oregon. fires/> (June 2003).
Disaster News Network. "Fire crews make progress." August 4, 2002.<http://www.disastemews.net/news/news.php?articleid=1510> (June 2003).
Disaster Response. "17000 on edge in Oregon." August 1, 2002.<http://www.ucc.org/disaster/dO80l02.htm> (June 2003).
Emergency Services Information Site. "Firefighters injured when engine rolls." August 16,2002. <http://www.withthecommand.com/2002-Aug/OR-engineroll.html> (June 2003).
National Incident Team. "Florence Fire Information Update." August 3, 2002.<http://www.pnw-team2.com/florence/fireupdates/PNWT2_fireupdate_080302am.pdf> (June2003).
National Water Resources Association. "NWRA Weekly Report." July 3, 2002.<http://www.nwra.org/article.cfin?nwranewsid=1080> (June 2003).
Seattle Post-Intelligencer. "Weather works in favor of crews." August 2, 2002.<http:/Hseattlepi.nwsource.com/local/81086_fireO2.shtml> (June 2003).
D-244
The Olympian. "Fire fighters use backfires in effort." August 17, 2002.<http://www.theolympian.comAhome/specialsections/Outdoors/20020817/33305.shtml> (June2003).
USDA Forest Service. "Biscuit Fire Complex News Release." July 26, 2002.<http://www.fs.fed.us/r6/rogue/mediaO20726.htm> (June 2003).
USDA Forest Service. "Incident Information." July 24, 2002.<http://www.fs.fed.us/r5/sixrivers/fire/2002/biscuit/> (June 2003).
Evacuation Efficiency Score .......................... E-8Community .......................... E-8Population .......................... E-9Number of Evacuees .......................... E-9Percent Evacuated .......................... E-10Population Density During Evacuation ........................... E-10Community Area in Ikm2 .......................................... E-10Evacuation Area in kan2 ................................ ..... E-l IWas Ethnicity, Nationality, or Age Important? ..... ................... E- 1ILand Uses in Evacuation Area ......... ............................ E-12Type of Community . ............................................ E-12Form of Government . ............................................ E-13Community's Main Economic Base ....... ......................... E-13Any Special Characteristics? ......... ............................. E-14Proximity to a Commercial Nuclear Power Plant (kIn) .... .............. E-14Is the Community Located in a State that Contains a Nuclear Power Plant? . E-14Is the Area More Prone to Hazard than Average? .... .................. E-14Has the Community had any Experience with the Hazard? .... ........... E-15Has the Community Experienced Evacuations in the Previous Ten Years? .. E-15Has the Community had any Previous Experience with the AlertingMechanism? ................................................... E-15Did the Community have a Written Emergency Plan? .... .............. E-16Did the Emergency Plan Contain an Evacuation Section? .... ........... E-16Was the Plan Used in This Emergency9 ...... ....................... E-16Did the Plan Conform to NUREG-0654/FEMA-REP-1, Rev_ I? ... ...... E-17Was there an Evacuation Time Estimate (ETE) in the Plan? ... .......... E-17How Did the Actual Evacuation Time Compare to the ETE? .... ......... E-17Is Training Provided to Emergency Response Personnel? .... ............ E-18Is Joint Training Between Industry and Government Regularly Conducted? . E-18Do the Community's Emergency Response Agencies Regularly ConductEmergency Drills and Exercises? ....... ........................... E-18Was the Emergency Plan Used in this Evacuation Previously Tested in aFull-scale Field Exercise? . ........................................ E-19If So, What Type of Exercise was Performed Immediately Prior to thisEvacuation 9 . .E-19Evauaton ................................................... ElHazard that Led to Evacuation ......... ............................ E-20Time of Day ................................................... E-20Road Conditions/Weather Conditions ...... ......................... E-20
Other Unusual Circumstances ............ ......................... E-21Number of Deaths Caused by the Hazard ........ .................... E-21Number of Injuries Caused by the Hazard ........ .................... E-21Number of Deaths Caused by the Evacuation ....... .................. E-22Number of Injuries Caused by the Evacuation ....... .................. E-22Estimated Total Cost of Evacuation Related Expenses and PropertyDamages . ...................................................... E-22Were Political Boundaries Crossed (i.e., more than one county or stateinvolved)? .................................................... E-23Command, Control and Coordination Processes ..... ................. E-23Did the Mayor Participate in the Decision to Evacuate? ...... ........... E-23Did the Fire Chief Participate in the Decision to Evacuate? ..... ......... E-23Did the Police Chief Participate in the Decision to Evacuate? ..... ....... E-24Did Emergency Managers Participate in the Decision to Evacuate? ..... ... E-24Did the Governor Participate in the Decision to Evacuate? ..... .......... E-24Did Others Participate in the Decision to Evacuate? ...... .............. E-24Did Multiple People Participate in the Decision to Evacuate? ..... ....... E-25Were there Issues with the Decision Making Process? ...... ............ E-25Was an Emergency Operations Center (EOC) Used? ...... ............. E-25Was a Field (Incident) Command Post Used? ....... .................. E-25Was Communication Between Field Emergency Responders and EOCby Radio? . ...................................................... E-26Was Communication Between Field Emergency Responders and EOCby Telephone? ................................................. E-26Was Communication Between Field Emergency Responders and EOCby Cell Phone? ................................................. E-26Was Communication Between Field Emergency Responders and EOCby Pager? . .................................................... E-26Was Communication Between Field Emergency Responders and EOCby Multiple Methods? . ........................................... E-27Were there Issues with Communications? ........ .................... E-27How Were Senior Local Officials Notified of the Incident? ..... ......... E-28How Were Emergency Responders Notified of the Incident? ..... ........ E-29ET Between Discovery of the Incident and Mobilization (Minutes) ..... ... E-29Elapsed Time Between Start of Hazard and Decision to Evacuate (Hours) . . E-30Time to Complete the Evacuation (Hours) ........ ................... E-31Were there Issues with Notification of Emergency Personnel or Senior LocalOfficials? .................................................... E-32Was the Public Notified by a Siren? ......... ....................... E-32Was the Public Notified by Telephone? ........ ..................... E-32Was the Public Notified by Radio/TV? ........ ....................... E-33Was the Public Notified by an Emergency Broadcast System? ..... ....... E-33
Was the Public Notified by a PA System? ....... ..................... E-33Was the Public Notified by NOAA? ......... ....................... E-33Was the Public Notified Door-to-Door? ........ ..................... E-34Was the Public Notified by Multiple Methods? ...... ................. E-34Was the Evacuation Staged? ............ .......................... E-34Were there Any Special Issues Regarding Warning and Subsequent CitizenAction?....................................................... E-34Were People Given Specific Instructions About Where to go WhenThey Evacuated? . ................................................ E-35Were People Told to Use Specific Routes? ....... .................... E-35How Were These Routes Designated? ........ ....................... E-35How Many Special Institutions (e.g., Hospitals, Prisons) Were Evacuated? . E-36Road Conditions Prior to Evacuation ........ ....................... E-36Were Any Major Roadways Unavailable for Use? ...... ............... E-36Were there Any Special Traffic Issues Encountered? ...... ............. E-37Did Some People Spontaneously Evacuate Before Being Told to Do So? . . . E-37Was Reverse-laning Used? ............. .......................... E-37Were there Traffic Accidents During the Evacuations? ..... ............ E-38Did Anyone Refuse to Evacuate? .......... ........................ E-38Were Congregate Care Centers Used? ........ ...................... E-38Who Managed the Congregate Care Centers? ......................... E-39Were Schools Used as Congregate Care Centers? ...... ................ E-39Were Churches Used as Congregate Care Centers? ...... .............. E-39Were Public Buildings Used as Congregate Care Centers? ..... .......... E-40Were Other Buildings Used as Congregate Care Centers? ..... .......... E-40Were Multiple Buildings Used as Congregate Care Centers? ..... ........ E-40What Percent of Evacuees Went to Congregate Care Centers? ..... ....... E-41Did People Evacuate From Areas Outside the Designated EvacuationArea? . ........................................................ E-41Did This Cause an Impact on Traffic? ........ ....................... E-42Did This Cause an Impact on Congregate Care Center Capacity? .... ..... E-42How Was the Area Secured Following the Evacuation to Prevent Lootingand Vandalism? ................................................. E-42Were There Any Instances of Looting or Vandalism? ...... ............. E-43Were there Any Issues with Law Enforcement? ...... ................. E-43Did the Mayor Participate in the Authorization for Re-entry? ..... ....... E-43Did the Fire Chief Participate in the Authorization for Re-entry9? .......... E-43Did the Police Chief Participate in the Authorization for Re-entry? .... .... E-44Did the Emergency Manager Participate in the Authorization for Re-entry? . E-44Did the Governor Participate in the Authorization for Re-entry? .... ...... E-4Did Other People Participate in the Authorization for Re-entry? ..... ..... E-44Did Multiple People Participate in the Authorization for Re-entry? .... .... E-45
Describe the Re-entry Process .........................Were Evacuees Compensated for Their Expenses? .........Were there Major Issues During Re-entry? ...............Residential Land Use ................................Commercial Land Use ..............................Retail Land Use ....................................Industrial Land Use .................................Agricultural Land Use ...............................
Appendix E contains the distribution of questionnaire responses. Note that there were somemissing values (i.e., unknowns) because interviewees either did not have all of the information orcould not remember. Missing values were not included in the regression and correlation analyses(i.e., the method of pairwise deletion of missing values was used). For verification purposes, theregression analyses were performed on a select number of imputed datasets, and the results weresimilar to those obtained using the pairwise deletion method, confirming the appropriateness ofpairwise deletion for this analysis.
E-7
Table E-1. Overall Efficiency Score
Overall Efficiency Score
Cumulative Cumulativescore Frequency PercentFrequencyPecn
0 16 32.00 16 32.00
1 21 42.00 37 74.00
2 8 16.00 45 90.00
3 3 6.00 48 96.00
4 1 2.00 49 98.00
5 1 2.00 50 100.00
Table E-2. Evacuation Efficiency Score
Evacuation Efficiency Score
FrPercent Cumulative Cumulativescore reruenty Frequency Percent
0 issues 16 32.00 16 32.00
1 issue 21 42.00 37 74.00
2 issues 8 16.00 45 90.00
3 or more issues 5 10.00 50 100.00
Table E-3. Community
Community
Cumulative CumulativecommFrequency Percent Frequency Percent
Rural (R) 5 10.00 10.00
Suburban (S) 36 72.00 41 82.00
Urban (U) 9 18.00 50 100.00
E-8
Table E4. Population
Population
Cumulative CumulativepnumFrequency Percent Frequency Percent
Cumulative Cumulativec area Frequency Percent Freuency C e
Frequency PercentUnknown 1 2.00 1 2.001-4.9 km2 3 6.00 4 8.005-9.9 km2 2 4.00 6 12.0010-49.9 km2 16 32.00 22 44.0050-99.9 km2 13 26.00 35 70.00100499 km2 6 12.00 41 82.00500-999 km2 2 4.00 43 86.001000 or more km2 7 14.00 50 100.00
E-10
Table E-9. Evacuation Area in km2
Evacuation Area in km2
Cumulative Cumulativee area Frequency Percent Fuency Percent
F requency Percent
Unknown 8 16.00 8 16.00
14.9 km2 13 26.00 21 42.00
5-9.9 km2 12 24.00 33 66.00
1049.9 km2 9 18.00 42 84.00
50-99.9 km2 2 4.00 44 88.00
100499 km2 1 2.00 45 90.00
500-999 km2 1 2.00 46 92.00
1000 or more km2 4 8.00 50 100.00
Table E-10. Was Ethnicity, Nationality, or Age Important?
Table E-28. Is Training Provided to Emergency Response Personnel?
Is Training Provided to Emergency Response Personnel?
training Frequency Percent Cumulative CumulativeFrequency Percent
Yes 50 100.00 50 100.00
Table E-29. Is Joint Training Between Industry and Government Regularly Conducted?
[ Is Joint Training Between Industry and Government Regularly Conducted? ICumulative Cumulativejoint training Frequency PercentFrqecPren_ Frequency Percent
Table F-I. Chi-Square Values for Likelihood Ratio Tests of Association Between EachVariable and Evacuation Efficiency Score ............................... F-6
F-3
Introduction
The results of the regression analyses are contained in Appendices F through K. All datapreparation and analyses were carried out using SAS 8.02 for Windows. Each variable in thequestionnaire was compared to the efficiency score using an ordinal logit model, which is ageneralized linear model. In generalized linear regression, the relationship is constrained to be astraight line and maximum likelihoods are used to determine the best fit. An ordinal logit modelwas chosen because the dependent variable (i.e., efficiency score) is neither normally, norGaussian, distributed, and it is an ordinal random variable. Since hazard type is often associatedwith other variables, the regression results were adjusted for hazard type.
The resulting chi-squared value (probability or p-value) from the likelihood ratio tests wereperformed to test if each variable was significantly associated with the efficiency score. Ap-value is the probability of observing the difference in the data by random chance. Thus, ifp <0.05, there is less than a 5% chance that this association would have occurred if there were noassociation, and the hypothesis that there is no association is rejected in favor of the hypothesisthat there is an association. A variable with a p-value of less than 0.05 is considered to have astatistically significant association to the efficiency score. If the p-value is between 0.05 and0.10, the variable is considered to have a marginal (or weak) statistical association to theefficiency score. Often ap < 0.01 is considered to show a highly significant statisticalassociation.
F-5
Table F-1. Chi-Square Values for Likelihood Ratio Tests of AssociationBetween Each Variable and Evacuation Efficiency Score
DevianceVariable Variable Label n OF Statistic __ P-Value
I traffaccid Were there Traffic accidents during the 44 1 0.3703 16.53 <.0001_.__evacuations?
rentr proc Describe the Re-entry Process 49 1 1.2103 13.22 0.0003. h death Number of deaths from hazard 50 1 10.7082 11.38 0.00074 evac inj Number of injuries caused by the evacuation 47 1 0.0000 11.00 0.0009S natguard Was the National Guard used for law 50 1 0.4219 8.71 0.0032
enforcement?
6 lootvand Were there any instances of looting or 50 1 0.5959 8.14 0.0043vandalism?
7 earlyevac Did some people spontaneously evacuate before 43 1 0.0540 7.95 0.0048being told to do so?
# firechief re Did the fire chief participate in the authorization 49 1 3.3908 6.68 0.0097for re-entry?
9 refus evac Did anyone refuse to evacuate? 47 1 2.0257 6.23 0.0126t0 haz-exp Has the community had any experience with the 49 1 0.5241 5.72 0.0168
hazard?11 schools Were schools used as congregate care centers? 39 1 7.3277 5.53 0.01871e .vac death Number of deaths caused by the evacuation 49 1 0.0000 5.26 0.021813 public-bidg Were public buildings used as congregate care 39 1 0.4690 5.25 0.0220
centers?1 mgmt shelter Who managed the congregate care centers? 39 4 10.7916 11.12 0.02533mayor~re Did the mayor participate in the authorization 49 1 1.0333 4.77 0.0289
for re-entry?n _oaa pn Was the public notified by NOAA? 49 1 0.0000 4.76 0.0291
17 haz type Hazard that led to evacuation 50 2 4.1425 6.95 0.031018 sttime Elapsed time between start of hazard and 41 1 51.0653 4.01 0.0452
decision to evacuate (hours) ___ _
rad haz Were any major roadways unavailable for use? 47 1 0.7908 3.97 0.0463,- 0 eoc used Emergency Operations Center (EOC) used 49 1 1.8256 3.69 0.0549-21 tot time Time to complete the evacuation (hours) 37 1 39.3267 3.55 0.0596
22 door door pn Was the public notified door-to-door? 49 1 3.0670 3.16 0.075623 instevac Were one or more special institutions 44 1 1.6318 3.09 0.0787
evacuated?24 pop dens Population density during evacuation 46 2 2.2197 5.08 0.078723 drills Do the community's emergency response 49 1 8.2453 3.07 0.0796
26 e area Evacuation Area in kmA2 42 1 70.4392 2.89 0.0889
F-6
Table F-1. Chi-Square Values for Likelihood Ratio Tests of AssociationBetween Each Variable and Evacuation Efficiency Score (continued)
DevianceVariable Variably Labe DF Statistilc Ir t-value
27 prone haz Is the area more prone to hazards than average? 50 1 3.1587 2.85 0.0916
28 awarealert Level of community awareness with alerting 49 2 2.6020 4.70 0.0954methods used
comm type Type of Community 50 3 7.9581 6.03 0.1102
_-30 shad traff Did this cause an impact on traffic? 42 1 2.9452 2.46 0.11653J1 pevac Percent Evacuated 48 1 80.3729 2.39 0.122432 resptime ET between discovery of the incident and 42 2 3.8023 4.16 0.1249
mobilization (minutes)33 multiple-sh Were multiple buildings used as congregate care 39 1 4.9626 2.34 0.1259
centers?34 aware_lhaz Level of community awareness with local 59 2 1.2782 4.10 0.1287
hazards . -
35 firechiefev Did the fire chief participate in the decision to 50 1 3.6447 2.30 0.1297evacuate?
36 staged Was the evacuation staged? 50 1 5.4893 1.96 0.1615
37 multiple ev Did multiple people participate in the decision to 50 1 2.3018 1.64 0.2001ievacuate?
38 h inj Number of injuries from hazard 48 1 53.2639 1.62 0.2025
39 nevac Number of Evacuations 49 1 79.7763 1.61 0.2044
40 spec char Were there any special characteristics? 48 1 0.4807 1.56 0.2118
41 coopjlevel Level of cooperation between local, state, and 49 1 4.2447 1.46 0.2264federal agencies
42 ernotif How were emergency responders notified of the 44 3 1.8322 4.23 0.2379incident?
43 pa system pn Was the public notified by a PA system? 49 1 2.6479 1.36 0.2439
44 exp comp Were evacuees compensated for their expenses? 46 1 0.0670 1.35 0.2445
45 multiple-re Did multiple people participate in the 49 1 5.2741 1.32 0.2501-authorization for re-entry? ____ _
46 unus circ Other unusual circumstances 28 1 1.7946 1.31 0.2517
47 churches Were churches used as congregate care centers? 39 1 3.3299 1.27 0.2597
48 conformnureg Did the plan conform to NUREG-0654/FEMA- 22 1 2.2819 1.24 0.2646- ___ _ .REP-, Rev 1?
49 radio Was communication between field emergency 50 1 3.2863 1.20 0.2738responders and EOC by radio? _ _
50 lu Retail Retail Land Use 49 1 0.2387 1.18 0.2774
St ebsjpn Was the public notified by emergency broadcast 49 1 2.5989 1.14 0.2865system?
52 offnotif How were senior local officials notified of the 45 10 20.9546 11.75 0.3019incident? _
53 revIan used Was reverse-laning used? 46 1 1.9220 0.99 0.3190
54 shltr used Were congregate care centers used? 48 1 1.2542 0.97 0.3240
55 em mgr re Did the emergency manager participate in the 49 1 0.4781 0.96 0.3265authorization for re-entry? I
F-7
Table F-1. Chi-Square Values for Likelihood Ratio Tests of AssociationBetween Each Variable and Evacuation Efficiency Score (continued)
DevlanceVariable Variable Label a DP Statistic it di-valuep6police Were the police used for law enforcement? 50 1 0.4416 0.88 0.3479
57 bdry crss Were political boundaries crossed (i.e., more 45 1 1.1540 0.85 0.3567___________than one county or state involved)?
58 icp used Was a field (incident) command post used? 50 1 6.2073 0.85 0.3575M59 multiple pn Was the public notified by multiple methods? 49 1 1.7831 0.85 0.357760 route design How were these routes designated? 27 2 1.7599 2.05 0.359161 time day Time of Day 50 1 5.5379 0.83 0.361162 other Were other buildings used as congregate care 40 1 1.4270 0.80 0.3709
centers?
63 emnplan Did the community have a written emergency 50 1 3.8346 0.78 0.3780plan? _
64 governorev Did the governor participate in the decision to 50 1 2.0218 0.70 0.4016evacuate?
6 road dry Road conditions prior to evacuation 48 1 0.6485 0.69 0.4059* 66 lu Agricultural Agricultural Land Use 49 1 0.2164 0.63 0.425667cond good Road conditions/weather conditions 43 1 0.5639 0.57 0.44886R evac-exp Had the community experienced evacuations in 48 1 0.1241 0.57 0.4519
the previous ten years? _69 exerctype If so, what type of exercise was performed 21 4 9.4252 3.54 0.4711
immediately prior to this evacuation? _ _
70 awareehaz Level of community awareness with hazard that 50 2 4.5303 1.46 0.4810caused evacuation
71 joint-training Is joint training between industry and 48 1 1.2887 0.48 0.4892_ . government regularly conducted? _
72 c area Community Area in km-2 49 1 117.4909 0.44 0.50487 sirens pn Was the public notified by a siren? 49 1 0.7606 0.44 0.506974 alert exp Did the community have previous experience 40 1 0.7895 0.41 0.5201
with the alerting mechanism?
75 plan-tested Was the emergency plan used in this evacuation 40 1 1.9414 0.34 0.5585previously tested in a full-scale field exercise? _
7§ ccc proc Command, control and coordination processes 50 1 3.4652 0.33 0.566477 lu Commercial Commercial Land Use 49 1 1.6215 0.31 0.575878 police-chief re Did the police chief participate in the 49 1 4.2933 0.28 0.5955
authorization for re-entry?_
7 govt type Form of Government 50 3 9.9771 1.79 0.6168
81 ete Was there an Evacuation Time Estimate (ETE) 14 1 1.5570 0.24 0.6234in the plan?
81 evacinstruct Were people given specific instructions about 46 1 3.9407 0.17 0.6783where to go when they evacuated?
82 otherre Did other people participate in the authorization 49 1 2.3693 0.17 0.6822_for re-entry?_
83 radio t pn Was the public notified by radio/TV? 49 1 0.1289 0.17 0.6834
F-8
Table P-1. Chi-Square Values for Likelihood Ratio Tests of AssociationBetween Each Variable and Evacuation Efficiency Score (continued)
Deviance__ Variable Variable Label a Dr Statlitle I I. p-ialue
4 pnum Population 50 1 122.3110 0.16 0.6887
85 multiple Was communication between field emergency 50 1 2.0225 0.15 0.6984. . .W..~ responders and EOC by multiple ways?
86 evac route Were people told to use specific routes? 46 1 0.7840 0.12 0.7286
87 mayor_ev Did the mayor participate in the decision to 50 1 2.0558 0.11 0.7346evacuate?
88 ena fctr Was Ethnicity, nationality, or age imortant? 42 1 8.0793 0.11 0.7433
89 proxnpp Proximity to a commercial nuclear power plant 50 2 2.3497 0.56 0.7570(km)
90 awareevac Level of community awareness with evacuation 50 2 5.1875 0.48 0.7860procedures
91 fsfe Full Scale Field Exercise Immediately prior to 48 1 0.7603 0.05 0.8166Evacuation
92 evac plan Did the emergency plan contain an evacuation 43 1 5.5015 0.04 0.8426section?
93 lu residential Residential Land Use 49 1 0.1747 0.03 0.8703
94 telephone Was communication between field emergency 50 1 2.9855 0.03 0.8711responders and EOC by telephone?
95 telephone pn Was the public notified by telephone? 49 1 1.7498 0.02 0.8747
96 lu Industrial Industrial Land Use 49 1 1.8313 0.02 0.8930
97 cell phone Was communication between field emergency 50 1 2.0194 0.01 0.9042responders and EOC by cell phone?
98 pager Was communication between field emergency 50 1 1.7542 0.01 0.9243responders and EOC by pager? __
99 comm Community 50 2 4.6091 0.15 0.9294
100 statenpp Is the community located in a state that contains 50 1 1.0813 0.01 0.9316_____.__.__ a nuclear power plant?
101 shadevac Did people evacuate from areas outside the 42 1 1.1778 0.01 0.9350designated evacuation area?
102 police chief ev Did the police chief participate in the decision to 50 1 5.3852 0.01 0.9402evacuate?
103 other ev Did other participate in the decision to evacuate? 50 I 0.5610 0.00 0.9456
104 plan used Was the plan used in this emergency? 45 1 3.4162 0.00 0.9739
105 emmgr_cv Did emergency managers participate in the 50 1 3.4133 0.00 0.9859.___ _ .:decision to evacuate? _
106 shl per What percent of evacuees went to congregate 26 1 43.0944 0.00 0.9893_ _ _ care centers? _
F-9
APPENDIX G
CROSS TABULATIONS WITH EVACUATION EFFICIENCYSCORE FOR SIGNIFICANTLY ASSOCIATED VARIABLES
Traffic Accidents ............... ....................... G-5Reentry Process ............. ......................... G-5Deaths from Hazard ................... ................... G-6Evacuation Injuries by Score ...................................... G-7National Guard Use by Score ...................................... G-7Instances of Looting or Vandalism .................................. G-8Early Evacuations ................ ...................... G-8Fire Chief Participation in Reentry .................................. G-9Refusals to Evacuate . ...................................... G-9Previous Hazard Experience ...................................... G-10Use of Schools as Congregate Care Centers ........... ............... G-10Evacuation Deaths ................... ................... G-l 1Use of Public Buildings as Congregate Care Centers ....... ............ G-l 1Management of Congregate Care Center ............ ................ G-12Participation of Mayor in Reentry Authorization ........ .............. G-13Public Notification of NOAA ..................................... G-13Type of Hazard that Led to Evacuation ................ .............. G-14Elapsed Time Between Start of Hazard and Evacuation ...... ........... G-15Unavailability of Roadways for Use ................................ G-16Use of Emergency Operations Center ................. .............. G-16Total Time to Complete Evacuation ................................ G-17Notification by Door to Door ..................................... G-19Evacuation of One or More Institutions .............. ............... G-19Population Density . ...................................... G-20Regular Conduct of Emergency Drills/Exercises ........ .............. G-21Extent of Evacuation in km2 ...................................... G-22Whether Area Is More Prone to Hazards than Average ...... ........... G-23Level of Community Awareness of Alerting Methods ....... ........... G-23
G-3
Table G-1. Traffic Accidents
Table of traff accid by scorectraffaccld (Were there
traMc accidents during theevacuations?) scorec
Row Pet 3 or moreCol Pet 0 Issues I Issue 2 Issues Issues Total
P-VALUES FOR TESTS OF EACH VARIABLE'S ASSOCIATIONWITH HAZARD-TYPE CATEGORICAL VARIABLES TESTED
USING FISHER'S EXACT TEST AND CONTINUOUS VARIABLESTESTED USING THE EXACT MEDIAN TEST
H-1
CONTENTS
Table H-I. P-values for Tests of Each Variable's Association With Hazard-type CategoricalVariables Tested Using Fisher's Exact Test and Continuous Variables TestedUsing the Exact Median Test ............... ..................................... H-5
H-3
Table H-i. P-values for Tests of Each Variable's Association With Hazard-typeCategorical Variables Tested Using Fisher's Exact Test and Continuous Variables
Tested Using the Exact Median Test
Obs Viariable Question Test n -value. haztype Hazard that led to evacuation Fisher's Exact 50 0.00000
2 fire-chiefre Did the fire chief participate in the authorization for re- Fisher's Exact 49 0.00000_ entry?_
3 haz exp Has the community had any experience with the hazard? Fisher's Exact 49 0.00001
4 fire chief ev Did the fire chief participate in the decision to evacuate? Fisher's Exact 50 0.00002
5 aware_ehaz Level of community awareness with hazard that caused Fisher's Exact 50 0.00002__ evacuation
6 comm type Type of Community Fisher's Exact 50 0.00008
7 nat guard Was the National Guard used for law enforcement? Fisher's Exact 50 0.00033
coc used Emergency Operations Center (EOC) used Fisher's Exact 49 0.00093
9 nevac Number of Evacuations Exact Median 49 0.00140
10 govt type Form of Government Fisher's Exact 50 0.00151j lu residential Residential Land Use Fisher's Exact 49 0.00173
_3 icp used Field (incident) command post used Fisher's Exact 50 0.00197tot time Time to complete the evacuation (hours) Exact Median 37 0.00203
14 early_evac Did some people spontaneously evacuate before being told Fisher's Exact 43 0.00221to do so?
c c ares Evacuation Area in kmA2 Exact Median 42 0.00242
)A refus evac Did anyone refuse to evacuate? Fisher's Exact 47 0.00432
t7 police Were the Police used for law enforcement? Fisher's Exact 50 0.00574< revian used Was reverse-laning used? Fisher's Exact 46 0.00716
19 shad traff Did this cause an impact on traffic? Fisher's Exact 42 0.00837
20 evac instruct Were people given specific instructions about where to go Fisher's Exact 46 0.00916when they evacuated?
21 otherre Did other people participate in the authorization for re- Fishees, Exact 49 0.01100entry?
22 other ev Did other people participate in the decision to evacuate? Fisher's Exact 50 0.01487
23 bdiy_crss Were political boundaries crossed (i.e., more than one Fisher's Exact 45 0.01694county or state involved)?
24 shltrused Were congregate care centers used? Fisher's Exact 48 0.01807
H-5
Table H-i. P-values for Tests of Each Variable's Association With Hazard-typeCategorical Variables Tested Using Fisher's Exact Test and Continuous Variables
Tested Using the Exact Median Test (continued)
Oh. Variable Queston Test n p-valhecarea Community Area in km'2 Exact Median 49 0.01850
awareevac Level of community awareness with evacuation procedure Fishers Exact 50 0.02097
X st_time Elapsed time between start of hazard and decision to Exact Median 41 0.02259evacuate (hours)
aware_lhaz Level of community awareness with local hazards Fisher's Exact 50 0.02343
9 h-death Number of deaths from hazard Exact Median 50 0.02500
telephone Was communication between field emergency responders Fisher's Exact 50 0.02942and EOC by telephone?
aware-alert Level of community awareness with alerting methods used Fisher's Exact 49 0.03261
Comm Community Fisher's Exact 50 0.03584
B off notif How were senior local officials notified of the incident? Fisher's Exact 45 0.04035
34 resp_time ET between discovery of the incident and mobilization Fisher's Exact 42 0.04353(minutes)
3 pevac Percent Evacuated Exact Median 48 0.04602
loot vand Were there any instances of looting or vandalism? Fishers Exact 50 0.05843
3 coop_level Level of cooperation between local, state, and federal Fisher's Exact 49 0.05874agencies
popdens Population density during evacuation Fisher's Exact 46 0.06067
X9 plan-tested Was the emergency plan used in this evacuation previously Fisher's Exact 40 0.08698tested in a full-scale field exercise?
governor ev Did the governor participate in the decision to evacuate? Fisher's Exact 50 0.11102
prone haz Is the area more prone to hazards than average? Fisher's Exact 50 0.11580
emmgr re Did the emergency manager participate in the authorizatio Fisher's Exact 49 0.12096_for re-entry?_
A3,! road haz Were any major roadways unavailable for use? Fisher's Exact 47 0.12761
44 multiple re Did multiple people participate in the authorization for re- Fisher's Exact 49 0.13259;_ .entry?_
45 luagricultural Agricultural land use Fisher's Exact 49 0.13705
traff accid Were there traffic accidents during the evacuations? Fisher's Exact 44 0.15938
4 mgmtshelter Who managed the congregate care centers? Fisher's Exact 39 0.17763
mayor_ev Did the mayor participate in the decision to evacuate? Fisher's Exact 50 0.19128
0 shadevac Did people evacuate from areas outside the designated Fisher's Exact 42 0.19939__ evacuation area?
X publicbldg Were public buildings used as congregate care centers? Fisher's Exact 39 0.21255
evac route Were people told to use specific routes? Fisher's Exact 46 0.22192
H-6
Table H-1. P-values for Tests of Each Variable's Association With Hazard-typeCategorical Variables Tested Using Fisher's Exact Test and Continuous Variables
Tested Using the Exact Median Test (continued)
Obs Variable: _ Quesi Test , 0-a.glue
52 rentr proc Describe the re-entry process Fisher's Exact 49 0.22430
53 police-chief re Did the police chief participate in the authorization for re- Fisher's Exact 49 0.23043__A_. ent.
54 prox npp Proximity to a commercial nuclear power plant (km) Fisher's Exact 50 0.26288
55 emrmgr_ev Did emergency managers participate in the decision to Fishers Exact 50 0.27511evacuate?
5 schools Were schools used as congregate care centers? Fisher's Exact 39 0.27991
3~ routedesign How were these routes designated Fisher's Exact 27 0.28917
pnum Population Exact Median 50 0.31943
59 evac death Number of deaths caused by the evacuation Exact Median 49 0.32653
60 state_npp Is the community located in a state that contains a nuclear Fisher's Exact 50 0.34086power plant?
61 ebspn Was the public notified by an emergency broadcast Fisher's Exact 49 0.34694system?
62 noaa_pn Was the public notified by NOAA? Fishers Exact 49 0.34694
hinj Number of injuries from hazard Exact Median 48 0.35151
64 sirens_pn Was the public notified by a siren? Fisher's Exact 49 0.37232
instevac Were one or more special institutions evacuated? Fisher's Exact 44 0.40269
66 ete Was there an Evacuation Time Estimate (ETE) in the plan. Fisher's Exact 14 0.42857
67 alertexp Did the community have previous experience with the Fisher's Exact 40 0.43042alerting mechanism?
68 mayorre Did the mayor participate in the authorization for re-entry? Fisher's Exact 49 0.43527
69 radiotvpn Was the public notified by radiolTV? Fisher's Exact 49 0.44203
70 door doorpn Was the public notified door-to-door? Fisher's Exact 49 0.45661
1_ telephonepn Was the public notified by telephone? Fisher's Exact 49 0.45819
72 expcomp Were evacuees compensated for their expenses? Fisher's Exact 46 0.50881
7_ emplan Did the community have a written emergency plan? Fisher's Exact 50 0.62286
74 joint training Is joint training between industry and government regularl Fisher's Exact 48 0.66791conducted? _
I5 luindustrial Industrial land use Fisher's Exact 49 0.67834
6 unus circ Other unusual circumstances Fisher's Exact 28 0.71146
77 time day Time of Day Fisher's Exact 50 0.72562
78 conform_nureg Did the plan conform to NUREG-0654/FEMA-REP-1, Fisher's Exact 22 0.73463Rev I ?
H-7
Table H-1. P-values for Tests of Each Variable's Association With Hazard-typeCategorical Variables Tested Using Fisher's Exact Test and Continuous Variables
Tested Using the Exact Median Test (continued)
s Variable Quesiion Test n p-valueena fctr Was ethnicity, nationality, or age important? Fisher's Exact 42 0.73790
3°; police chief ev Did the police chief participate in the decision to evacuate. Fisher's Exact 50 0.73981
churches Were churches used as congregate care centers? Fisher's Exact 39 0.78375
$2 drills Do the community's emergency response agencies Fisher's Exact 49 0.78449.__ _ .regularly conduct emergency drills and exercises? _
. staged Was the evacuation staged? Fisher's Exact 50 0.78609
.4 multiple sh Were multiple buildings used as congregate care centers? Fisher's Exact 39 0.82016
85 exerc type If so, what type of exercise was performed immediately Fisher's Exact 21 0.89998. _______prior to this evacuation?
86 evac exp Has the community experienced evacuations in previous Fisher's Exact 48 0.90005. _ _ ten years?
. lu-retail Retail land use Fisher's Exact 49 1.00000
X lu commercial Commercial land use Fisher's Exact 49 1.00000
p pasystem pn Was the public notified by a PA system? Fisher's Exact 49 1.00000
. evac plan Did the emergency plan contain an evacuation section? Fisher's Exact 43 1.00000
multiplepn Was the public notified by multiple methods? Fisher's Exact 49 1.0000092 evac inj Number of injuries caused by the evacuation Exact Median 47 1.00000
93 multiple Was communication between field emergency responders Fisher's Exact 50 1.00000- _ and EOC by multiple ways?
-99 cellphone Was communication between field emergency responders Fisher's Exact 50 1.00000and EOC by cell phone?
_ X er notif How were emergency responders notified of the incident? Fisher's Exact 44 1.00000
i multiple ov Did multiple people participate in the decision to Fisher's Exact 50 1.00000evacuate?
102 other Were other buildings used as congregate care centers? Fisher's Exact 40 1.00000
103 pager Was communication between field emergency responders Fisher's Exact 50 1.00000.... _ _ eand EOC by pager?
104 radio Was communication between field emergency responders Fisher's Exact 50 1.00000._ and EOC by radio?
H-8
APPENDIX I
CMI-SQUARE VALUES FOR LIKELIHOOD RATIOTESTS OF ASSOCIATION BETWEEN EACH
VARIABLE AND EVACUATION EFFICIENCY SCOREAFTER ADJUSTING FOR HAZARD TYPE
I-1
Table I-1. Chi-Square Values for Likelihood Ratio Tests of Association Between EachVariable and Evacuation Efficiency Score After Adjusting for Hazard Type
DevianceVariable Variable Label o Dr statistic xi value
1 rentr proc Describe the re-entry process 49 1 199.4046 12.40 0.0004
2 traffaccid Were there traffic accidents during the 44 1 169.3717 11.76 0.0006. __ .evacuations?
3 awarealert Level of community awareness with alerting 49 2 206.4430 13.33 0.0013methods used
4 evac in Number of injuries caused by the evacuation 47 1 195.8641 10.33 0.0013
S h death Number of deaths from hazard 50 1 217.6996 9.44 0.0021
6 schools Were schools used as congregate care centers? 39 1 170.3390 5.66 0.0174
7 mayor-re Did the mayor participate in the authorization for 49 1 216.1739 5.58 0.0181. __ .re-entry?
8 lootvand Were there any instances of looting or 50 1 226.1756 5.21 0.0225vandalism?
9 early evac Did some people spontaneously evacuate before 43 1 184.3282 4.55 0.0330being told to do so?
10 refus evac Did anyone refuse to evacuate? 47 1 216.6778 4.27 0.0388
It public bldg Were public buildings used as congregate care 39 1 174.1760 3.74 0.0532__ _ _ centers?
12 multiple-sh Were multiple buildings used as congregate care 39 1 174.1827 3.73 0.0533. _. ____ _ centers?
.S door door pn Was the public notified door-to-door? 49 1 225.6766 3.66 0.0559
14 evac death Number of deaths caused by the evacuation 49 1 217.9320 3.63 0.0566
ISnoaa pn Was the public notified by NOAA? 49 1 226.2767 3.36 0.0670
16 nataguard Was the National Guard used for law 50 1 230.2581 3.17 0.0752enforcement?
17 mgmt shelter Who managed the congregate care centers? 39 4 165.7099 8.22 0.083918 h in Number of injuries from hazard 48 1 214.7581 2.67 0.1024
19 spec char Were there any special characteristics? 48 1 215.4062 2.67 0.102420 instevac Were one or more special institutions evacuated? 44 1 207.0517 2.59 0.1078
21 awareevac Level of community awareness with evacuation 50 2 228.0223 4.28 0.1175procedures __
22 churches Were churches used as congregate care centers? 39 1 177.0526 2.30 0.1295
23 road haz Were any major roadways unavailable for use? 47 1 221.7815 2.24 0.1347
24 drills'->, Do the community's emergency response 49 1 228.3709 2.19 0.1389agencies regularly conduct emergency drills andexercises?
25 multipleev Did multiple people participate in the decision 50 1 232.7491 1.92 0.1659to evacuate?
1-5
Table I-l. Chi-Square Values for Likelihood Ratio Tests of Association Between EachVariable and Evacuation Efficiency Score After Adjusting for Hazard Type (continued)
Deviance p-.Variable Variable Label n DF statistit , value
26 radio Was communication between field emergency 50 1 232.8356 1.88 0.1707responders and EOC by radio?
27 awarelhaz Level of community awareness with local 50 2 230.0096 3.29 0.1930hazards
28 hazexp Has the community had any experience with the 49 1 229.9653 1.51 0.2189hazard?
29 alertexp Did the community have previous experience 40 1 186.4828 1.43 0.2323with the alerting mechanism?
30 shadevac Did people evacuate from areas outside the 42 1 189.7794 1.41 0.2343designated evacuation area?
31 pop dens Population density during evacuation 46 2 214.7714 2.88 0.2366
32 unus circ Other unusual circumstances 28 1 131.0810 1.35 0.2454
33 lu Retail Retail Land Use 49 1 228.4968 1.29 0.255934 otherev Did other people participate in the decision to 50 1 234.0418 1.27 0.2591
evacuate? _
35 time day Time of Day 50 1 234.0529 1.27 0.2601
36 pa system pn Was the public notified by a PA system? 49 1 230.5170 1.24 0.2663
37 staged Was the evacuation staged? 50 1 234.1666 1.21 0.2711
38 firechief re Did the fire chief participate in the authorization 49 1 224.9717 1.18 0.2768_ for re-entry?
39 prone haz Is the area more prone to hazards than average? 50 1 234.2903 1.15 0.2837
40 off notif How were senior local officials notified of the 45 10 189.9607 11.87 0.2942incident?
41 evacexp Has the community experienced evacuations in 48 1 227.4132 1.09 0.2956the previous ten years? _ -
42 resp-time ET between discovery of the incident and 42 2 192.1269 2.40 0.3014.__...._,._ _mobilization (minutes)
43 ernotif How were emergency responders notified of the 44 3 202.2238 3.65 0.3019incident?
44 route design How were these routes designated? 27 2 103.3675 2.25 0.3249
45 conform-nureg Did the plan conform to NUREG-0654/FEMA- 22 1 104.8101 0.95 0.3299REP-I Rev 1?
46 sirens pn Was the public notified by a siren? 49 1 231.2000 0.89 0.3443
47 ete Was there an Evacuation Time Estimate (ETE) 14 1 68.8740 0.87 0.3496in the plan?
48 other Were other buildings used as congregate care 40 1 183.2163 0.83 0.3629centers?
49 multiple pn Was the public notified by multiple methods? 49 1 231.4656 0.76 0.3829
50 c area Community Area in kmA2 49 1 110.0815 0.75 0.3870
51 eoc_used Was an Emergency Operations Center (EOC) 49 1 231.5358 0.73 0.3941used?
I-6
Table I-1. Chi-Square Values for Likelihood Ratio Tests of Association Between EachVariable and Evacuation Efficiency Score After Adjusting for Hazard Type (continued)
Dvi~ance PVariable Variable Label o DF Statistic Z- falue
52 sttime Elapsed time between start of hazard and 41 1 183.8800 0.69 0.4050decision to evacuate (hours)
53 comm type Type of Community 50 3 230.8689 2.86 0.4137
54 aware ehaz Level of community awareness with hazard that 50 2 233.0644 1.76 0.4143... ____ Hcaused evacuation
SS telephone Was communication between field emergency 50 1 235.2622 0.66 0.4153. _______responders and EOC by telephone?
56 proxnpp Proximity to a commercial nuclear power plant 50 2 233.0792 1.75 0.4158(kn)
57 ccc proc Command, control and coordination processes 50 1 235.2679 0.66 0.4164
58 otherre Did other people participate in the authorization 49 1 226.0867 0.63 0.4291for re-entry?
e59 xp comp Were evacuees compensated for their expenses? 46 1 212.7030 0.62 0.4326
60 pnum Population 50 1 114.9078 0.61 0.4332
61 em mgr ev Did emergency managers participate in the 50 1 235.3817 0.60 0.4372decision to evacuate?
62 evac instruct Were people given specific instructions about 46 1 215.9498 0.54 0.4610where to go when they evacuated?
63 state npp Is community located in a state that contains a 50 1 235.6393 0.47 0.4907nuclear power plant?
64 mayor ev Did the mayor participate in the decision to 50 1 235.7004 0.44 0.5050evacuate?
65 coop level Level of cooperation between local, state, and 49 1 231.9532 0.40 0.5279_ _ _ federal agencies
66 lu Commercial Commercial Land Use 49 1 230.3341 0.37 0.5418
67 shltr used Were congregate care centers used? 48 1 228.4826 0.36 0.547868 icp used Was a field (incident) command post used? 50 1 235.8784 0.36 0.5511
69 exerc type If so, what type of exercise was performed 21 4 82.8150 3.02 0.5552immediately prior to this evacuation?
_70 telephone pn Was the public notified by telephone? 49 1 232.2996 0.34 0.5573
77 multiple Was communication between field emergency 50 1 236.2370 0.18 0.6748responders and EOC by multiple ways?
1-7
Table I-1. Chi-Square Values for Likelihood Ratio Tests of Association Between EachVariable and Evacuation Efficiency Score After Adjusting for Hazard Type (continued)
Varlable Variable Lbel a DP - Statit it, value
78 pager Was communication between field emergency 50 1 236.2385 0.18 0.6754responders and EOC by pager?
9 joint-training Is joint training between industry and 48 1 226.0342 0.14 0.7078government regularly conducted?
80 shljper What percent of evacuees went to congregate 26 1 114.4758 0.13 0.7160care centers?
81 lu Industrial Industrial Land Use 49 1 230.8281 0.13 0.72358 2 plan used Was the plan used in this emergency? 45 1 210.3203 0.10 0.7502
83 cell_phone Was communication between field emergency 50 1 236.3896 0.10 0.7521responders and EOC by cell phone?
84 evac route Were people told to use specific routes? 46 1 222.3079 0.06 0.8017
i85 tot time Time to complete the evacuation (hours) 37 1 167.2206 0.06 0.802486 firechief ev Did the fire chief participate in the decision to 50 1 236.4868 0.05 0.8210
evacuate?
87 evacjplan Did the emergency plan contain an evacuation 43 1 197.6525 0.05 0.8214section?
88 bdrycrss Were political boundaries crossed (ie, more 45 1 203.8249 0.05 0.8243than one county or state involved)?
89 police-chief ev Did the police chief participate in the decision to 50 1 236.5155 0.04 0.8478evacuate?
90 police-chief re Did the police chief participate in the 49 1 227.2689 0.03 0.8533authorization for re-entry?
91 emmgrre Did the emergency manager participate in the 49 1 227.2704 0.03 0.8549authorization for re-entry?
9 ena fctr Was ethnicity, nationality, or age important? 42 1 194.4006 0.03 0.8710radio tv pn Was the public notified by radio/TV? 49 1 232.9404 0.02 0.8770
94 police Were the police used for law enforcement? 50 1 236.5552 0.02 0.8963
9" lu residential Residential Land Use 49 1 231.0523 0.01 0.9089
i 96 shad traff Did this cause an impact on traffic? 42 1 192.5901 0.01 0.9244
97 plan tested Was the emergency plan used in this evacuation 40 1 190.7405 0.00 0.9588.previously tested in a full-scale field exercise? __
98 revlan used Was reverse-laning used? 46 1 208.0585 0.00 0.9621
99 govemor ev Did the governor participate in the decision to 50 1 236.5852 0.00 0.9644evacuate?
10Dlu-Agricultural Agricultural Land Use 49 1 231.0746 0.00 0.9647
101 e area Evacuation Area in lmA2 42 1 184.4551 0.00 0.9773I0 govt type Form of Government 50 3 236.2856 0.15 0.9850
0 nevac Number of Evacuations 49 1 233.0946 0.00 0.9946
104 comm Community 50 2 250.1955 0.00 1.0000
1-8
APPENDIX J
P-VALUES FOR TESTS OF ASSOCIATION WITHEVACUATION EFFICIENCY SCORE FOR VARIABLESWITH SIGNIFICANT OR MARGINALLY SIGNIFICANT
ASSOCIATIONS WITH EVACUATION EFFICIENCY SCORE
J-1
CONTENTS
Table J-1. P-Values for Tests of Association With Evacuation Efficiency Score forVariables with Significant or Marginally Significant Associations withEvacuation Efficiency Score ............ .............................. J-5
J-3
Table J-1. P-Values for Tests of Association With Evacuation Efficiency Score forVariables with Significant or Marginally Significant Associations with Evacuation
Efficiency Score
p-value fortest of p-value for test
Interaction of association p-value forwith hazard after adjusting test of
Variable Variable Label t y p for hazard type associationI traff accid Were there traffic accidents during the 44 0.1794 0.0006 <.0001
._ evacuations?
2 rentr proc Describe the Re-entry Process 49 0.2020 0.0004 0.0003
3 h death Number of deaths from hazard 50 . 0.0021 0.0007
4 evac in Number of injuries caused by the evacuation 47 . 0.0013 0.0009
S natguard Was the National Guard used for law 50 0.0096 0.0752 0.0032__ _ enforcement?
6 lootvand Were there any instances of looting or 50 0.1698 0.0225 0.0043.______vandalism?
7 earlyevac Did some people spontaneously evacuate 43 0.8356 0.0330 0.0048before being told to do so?
8 firechief re Did the fire chief participate in the 49 . 0.2768 0.0097authorization for re-entry?_
9 refus evac Did anyone refuse to evacuate? 47 0.2759 0.0388 0.0126
10 hazexp Has the community had any experience with 49 0.0310 0.2189 0.0168the hazard?
11 schools Were schools used as congregate care 39 0.0702 0.0174 0.0187centers? _
12 evac death Number of deaths caused by the evacuation 49 . 0.0566 0.0218
13 public bldg Were public buildings used as congregate 39 0.6073 0.0532 0.0220care centers?
14 mgmt shelter Who managed the congregate care centers? 39 . 0.0839 0.0253
15 mayorre Did the mayor participate in the 49 0.1857 0.0181 0.0289authorization for re-entry?
16 noaa pn Was the public notified by NOAA? 49 . 0.0670 0.0291
17haz type Hazard that led to evacuation 50 . . 0.0310
18 st time Elapsed time between start of hazard and 41 . 0.4050 0.0452decision to evacuate (hours)
19 roadhaz Were any major roadways unavailable for 47 0.0380 0.1347 0.0463use? I
20 eoc_used Was an Emergency Operations Center 49 . 0.3941 0.0549_ _ (EOC used?
21 tot time Time to complete the evacuation (hours) 37 . 0.8024 0.0596= could not be calculated
J-5
Table J-1. P-Values for Tests of Association With Evacuation Efficiency Score forVariables with Significant or Marginally Significant Associations with Evacuation
Efficiency Score (continued)
p-value fortest of p-value for test
Interaction of association p-value forwith hazard after adjusting test of
Variable Variable label a p te for hazard type association22door door pn Was the public notified door-to-door? 49 . 0.0559 0.0756
23 instevac Were one or more special institutions 44 . 0.1078 0.0787evacuated?
24 pop dens Population density during evacuation 46 0.8533 0.2366 0.078725 drills Do the community's emergency response 49 0.0947 0.1389 0.0796
National Guard Use/Natural Disaster ......... ....................... K-5National Guard Use/Malevolent Act .......... ....................... K-5National Guard Use/Technological Hazard ........ .................... K-6Community Experience/Natural Disaster ........ ..................... K-6Community Experience/Malevolent Act ......... ..................... K-7Community Experience/Technological Hazard ....... .................. K-7Use of Schools as Congregate Care Centers/Natural Disaster ..... ........ K-8Use of Schools as Congregate Care Centers/Malevolent Act ..... ......... K-8Use of Schools as Congregate Care Centers/Technological Hazard ..... .... K-9Unavailability of Major Roadways/Natural Disaster ...... ............... K-9Unavailability of Major Roadways/Malevolent Act ...... .............. K-10Unavailability of Major Roadways/Technological Hazard ..... .......... K-10Regular Conduct of Emergency Drills and Exercises/Natural Disaster .... . K-1 1Regular Conduct of Emergency Drills and Exercises/Malevolent Act ...... K-lIRegular Conduct of Emergency Drills and Exercises/TechnologicalHazard ................................................... K-12Whether Area is More Prone to Hazards than Average/Natural Disaster .... K-12Whether Area is More Prone to Hazards than Average/MalevolentAct .................................................. K-13Whether Area is More Prone to Hazards than Average/TechnologicalHazard ................................................... K-13
K-3
Table K-1. National Guard Use/Natural Disaster
Table I of nat guard by Scorec
Controlling for haz type=Natural Disaster
natguard (Was the NationalGuard used for law
enforcement?) scorec
FrequencyPercentRow Pct 3 or moreCol Pet 0 Issues I issue 2 Issues Issues Total
CROSS TABULATIONS FOR VARIABLESIN THE CORRELATION ANALYSIS
L1
CONTENTS
Introduction ............................................................... L-5Table L-1. Traffic Accidents/Issues ............ ................................ L-6Table L-2. Road Hazards/Issues .............. ................................. L-6Table L-3. Evacuation Instructions/Issues ....................................... L-7Table L4. Instructions to Use Specific Routes/Issues .............................. L-7Table L-5. Ad Hoc Command, Control, and Coordination Processes/Traffic Issues .... ... L-8Table L-6. Evacuations from Outside Designated Areas/Special Traffic Issues .... ...... L-8Table L-7. Crossing of Political (County, State) Boundaries/Decision-Making Issues ..... L-9Table L-8. Ad Hoc Command, Control, and Coordination Processes/Decision-Making
Table L-9.
Table L-10.
Table L-l 1.
Table L-12.
Table L-13.
Table L-14.
Table L-15.
Table L-16.
Table L-17.
Table L-18.
Table L-19.
Table L-20.
Table L-21.
Table L-22.
Table L-23.
Table L-24.Table L-25.Table L-26.
Issues ....................................................... L-9Communication Between Field Emergency Responders and EOC byRadio/Communications Issues ........... ........................... L-10Communication Between Field Emergency Responders and EOC byTelephone/Communications Issues ......... .......................... L-10Communication Between Field Emergency Responders and EOC byCell Phone/Communications Issues ......... ......................... L-l ICommunication Between Field Emergency Responders and EOC byPager/Communications Issues ........... ........................... L- 11Communication Between Field Emergency Responders and EOC/Communications Issues ............... ............................ L-12Ad Hoc Command, Control, and Coordination Processes/CommunicationsIssues ........................................................ L- 12Notification of Public by Siren/Warning and Subsequent Citizen ActionIssues ....................................................... L-13Notification of Public by Telephone/Special Issues Regarding Warningand Subsequent Citizen Action ........... ........................... L- 13Notification of Public by Radio/Special Issues Regarding Warning andSubsequent Citizen Action ............. ............................ L-14Notification of Public by Emergency Broadcast System/Special IssuesRegarding Warning and Subsequent Citizen Action ...... ............... L-14Notification of Public by PA System/Special Issues Regarding Warning andSubsequent Citizen Action ............. ............................ L-15Notification of Public by NOAA/Special Issues Regarding Warning andSubsequent Citizen Action ............. ............................ L-15Notification of Public by Door-to-Door Contact/Special Issues RegardingWarning and Subsequent Citizen Action .............................. L- 16Notification of Public by Multiple Methods/Special Issues Regarding Warningand Subsequent Citizen Action ........... ........................... L-16Ad Hoc Command, Control, and Coordination Processes/Special IssuesRegarding Warning and Subsequent Citizen Action ...... ............... L-17Instances of Looting or Vandalism/Issues with Law Enforcement ..... ...... L-17Use of National Guard for Law Enforcement/Issues with Law Enforcement ... L-18Use of Police for Law Enforcement/Issues with Law Enforcement .......... L- 18
L-3
Introduction
The results of the correlation analysis are contained in Appendix L. Correlation coefficientswere calculated for variables suspected of having a correlation to one of the variables used todefine the evacuation efficiency score. Data preparation and analysis were carried out usingSAS 8.02 for Windows.
L-5
Table L-1. Traffic Accidents/Issues
Table of trafacel b trafftProbtraff accid (Traffc accidents during traff prob (Were there any special
the evacuations?) traffi problems encountered?)FrequencyPercentRaw PetCol Pet ____No Yes Total
NRC FORM 335 U.S. NUCLEAR REGULATORY COMMISSION 1. REPORT NUMBER(9-2004) (Assigned by NRC, Add Vol.. Supp., Rev.,NRCMD 3.7 and Addendum Numbers, It any.)
BIBLIOGRAPHIC DATA SHEET(See instructions on the reverse) NUREG/CR-6864, Vol.2
2. TITLE AND SUBTITLE 3. DATE REPORT PUBLISHED
Identification and Analysis of Factors Affecting Emergency Evacuations (Volume II: MONTH YEARAppendices)
Janua r v20054. FIN OR GRANT NUMBER
J30565. AUTHOR(S) 6. TYPE OF REPORT
L.J. Dotson / J. Jones (SNL) Technical
7. PERIOD COVERED (Incusive Dares)
Not ApplicableB. PERFORMING ORGANIZATION - NAME AND ADDRESS (If NRC, provide Divsion, Office orRegion, US. Nudear Regulatory Commission, and mailing address; Icontractor,
provide name and mailngV address.)
Sandia National LaboratoriesP.O. Box 5800Albuquerque, NM 87185-0779
9. SPONSORING ORGANIZATION - NAME AND ADDRESS (It NRC, type 'Same as above'; if contractor, provide NRC Divisio Ofce or Region, U.S. Nuclear RagutatotyComnimsson,and maiing address.)
Division of Preparedness and ResponseOffice of Nuclear Security and Incident ResponseU.S. Nuclear Regulatory Commission
-Washington, DC 20555-000110. SUPPLEMENTARY NOTES
D. Schneck, NRC Proiect Manacqer11. ABSTRACT (200 words or less)
This study examines the efficiency and effectiveness of public evacuations of 1,000 or more people, in response to naturaldisasters, technological hazards, and malevolent acts, occurring in the United States between January 1, 1990 and June 30,2003. A universe of 230 evacuation incidents was identified and a subset of 50 incidents was selected for case study analysis.Case study selection was based on a profiling and ranking scheme designed to identify evacuation incidents of sufficientcomplexity to challenge the local and regional emergency response capabilities. Case study analysis included completion of adetailed survey for each incident. Advanced statistical methods, including Fisher's exact test, multiple ordinal logisticregression analysis, and correlation analysis, were used to identify factors contributing to evacuation efficiency. The analysisidentified that community familiarity with alerting methods and door-to-door notification were statistically significant for a moreefficient evacuation. The following factors were statistically significant for a less efficient evacuation: traffic accidents, numberof deaths from the hazard, number of injuries caused by the evacuation, people spontaneously evacuating before being told todo so, people refusing to evacuate, and looting or vandalism. All 50 evacuation cases studied safely evacuated people fromthe area, saved lives, and reduced the potential number of injuries from the hazard.
Volume I contains the Main Report. Volume II contains appendices supporting case studies.
12. KEY WORDS/DESCRIPTORS (List words orphrases that wdi assist researchers in locating the report.) 13. AVAILABILITY STATEMENT