NUREG/IA-0184 International Agreement Report In-Tube Steam Condensation in the Presence of Air Prepared by A. Tanrikut/TAEA 0. Yesin/METU Turkish Atomic Energy Authority Eskisehir Yolu 06530 Ankara, Turkey Middle East Technical University 06531 Ankara, Turkey Office of Nuclear Regulatory Research U.S. Nuclear Regulatory Commission Washington, DC 20555-0001 June 2000 Prepared as part of The Agreement on Research Participation and Technical Exchange under the International Code Application and Maintenance Program (CAMP) Published by U.S. Nuclear Regulatory Commission
Transcript
NUREG/IA-0184
International Agreement Report
In-Tube Steam Condensation in the Presence of Air
Prepared by
A. Tanrikut/TAEA 0. Yesin/METU
Turkish Atomic Energy Authority Eskisehir Yolu 06530 Ankara, Turkey
Middle East Technical University 06531 Ankara, Turkey
Office of Nuclear Regulatory Research U.S. Nuclear Regulatory Commission Washington, DC 20555-0001
June 2000
Prepared as part of The Agreement on Research Participation and Technical Exchange under the International Code Application and Maintenance Program (CAMP)
Published by U.S. Nuclear Regulatory Commission
AVAILABILITY OF REFERENCE MATERIALS IN NRC PUBLICATIONS
NRC Reference Material
As of November 1999, you may electronically access NUREG-senes publications and other NRC records at NRC's Public Electronic Reading Room at www.nrc.gov/NRC/ADAMSfinde•xhtml. Publicly released records include, to name a few, NUREG-senes publications; Federal Register notices; applicant, licensee, and vendor documents and correspondence; NRC correspondence and internal memoranda; bulletins and information notices; inspection and investigative reports; licensee event reports; and Commission papers and their attachments.
NRC publications in the NUREG series, NRC regulations, and Title 10, Energy, in the Code of Federal Regulations may also be purchased from one of these two sources. 1. The Superintendent of Documents
U.S. Government Printing Office P. 0. Box 37082 Washington. DC 20402-9328 www.access.gpo.gov/su-docs 202-512-1800
2. The National Technical Information Service Springfield, VA 22161-0002 www.ntis.gov 1-800-553-6847 or, locally, 703-605-6000
A single copy of each NRC draft report for comment is available free, to the extent of supply, upon written request as follows: Address: Office of the Chief Information Officer,
Reproduction and Distribution Services Section
U.S. Nuclear Regulatory Commission Washington, DC 20555-0001
Some publications in the NUREG series that are posted at NRC's Web site address www.nrc.gov/NRC/NUREGS/indexnum.html are updated regularly and may differ from the last printed version.
V
-I
Non-NRC Reference Material
Documents available from public and special technical libraries include all open literature items, such as books, journal articles, and transactions, Federal Register notices, Federal and State legislation, and congressional reports. Such documents as theses, dissertations, foreign reports and translations, and non-NRC conference proceedings may be purchased from their sponsoring organization.
Copies of industry codes and standards used in a substantive manner in the NRC regulatory process are maintained at
The NRC Technical Library Two White Flint North 11545 Rockville Pike Rockville, MD 20852-2738
These standards are available in the library for reference use by the public. Codes and standards are usually copyrighted and may be purchased from the originating organization or, if they are American National Standards, from
American National Standards Institute 11 West 4 2nd Street New York, NY 10036-8002 www.ansi org 212-642-4900
The NUREG series comprises (1) technical and administrative reports and books prepared by the staff (NUREG-XXYX) or agency contractors (NUREG/CR-XXXX), (2) proceedings of conferences (NUREG/CP-XXXX), (3) reports resulting from international agreements (NUREG/IA-XXXX), (4) brochures (NUREG/BR-XXX.X), and (5) compilations of legal decisions and orders of the Commission and Atomic and Safety Licensing Boards and of Directors' decisions under Section 2.206 of NRC's regulations (NUREG-0750).
DISCLAIMER: This report was prepared under an international cooperative agreement for the exchange of
technical information. Neither the U.S. Government nor any agency thereof, nor any employee, makes any
warranty, expressed or implied, or assumes any legal liability or responsibility for any third party's use, or the
results of such use, of any information, apparatus, product or process disclosed in this publication, or represents
that its use by such third party would not infringe privately owned rights.
NUREG/IA-0184
International Agreement Report
In-Tube Steam Condensation in the Presence of Air
Prepared by
A. Tanrikut/TAEA 0. Yesin/METU
Turkish Atomic Energy Authority Eskisehir Yolu 06530 Ankara, Turkey
Middle East Technical University 06531 Ankara, Turkey
Office of Nuclear Regulatory Research U.S. Nuclear Regulatory Commission Washington, DC 20555-0001
June 2000
Prepared as part of The Agreement on Research Participation and Technical Exchange under the International Code Application and Maintenance Program (CAMP)
Published by U.S. Nuclear Regulatory Commission
ABSTRACT
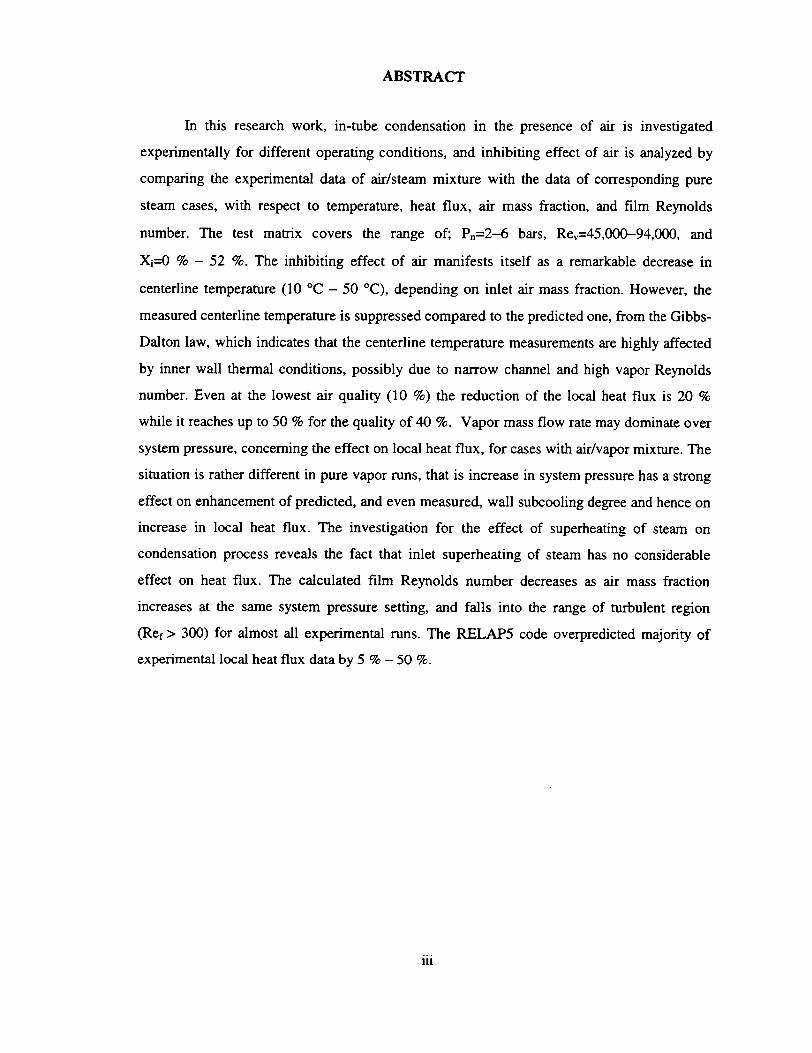
In this research work, in-tube condensation in the presence of air is investigated
experimentally for different operating conditions, and inhibiting effect of air is analyzed by
comparing the experimental data of air/steam mixture with the data of corresponding pure
steam cases, with respect to temperature, heat flux, air mass fraction, and film Reynolds
number. The test matrix covers the range of; Pn=2-6 bars, Re,=45,000-94,000, and
Xi=0 % - 52 %. The inhibiting effect of air manifests itself as a remarkable decrease in
centerline temperature (10 'C - 50 °C), depending on inlet air mass fraction. However, the
measured centerline temperature is suppressed compared to the predicted one, from the Gibbs
Dalton law, which indicates that the centerline temperature measurements are highly affected
by inner wall thermal conditions, possibly due to narrow channel and high vapor Reynolds
number. Even at the lowest air quality (10 %) the reduction of the local heat flux is 20 %
while it reaches up to 50 % for the quality of 40 %. Vapor mass flow rate may dominate over
system pressure, concerning the effect on local heat flux, for cases with air/vapor mixture. The
situation is rather different in pure vapor runs, that is increase in system pressure has a strong
effect on enhancement of predicted, and even measured, wall subcooling degree and hence on
increase in local heat flux. The investigation for the effect of superheating of steam on
condensation process reveals the fact that inlet superheating of steam has no considerable
effect on heat flux. The calculated film Reynolds number decreases as air mass fraction
increases at the same system pressure setting, and falls into the range of turbulent region
(Ref > 300) for almost all experimental runs. The RELAP5 code overpredicted majority of
experimental local heat flux data by 5 % - 50 %.
iii
TABLE OF CONTENTS
ABSTRACT iii
TABLE OF CONTENTS v
NOMENCLATURE vii
CHAPTER
1. INTRODUCTION 1
2. DESCRIPTION OF THE TEST FACILITY 3
2.1 Steam/gas Supply 3
2.2 Connecting Piping and Pipe Fittings 4
2.3 Test Section 5
2.3.1 Condenser Tube 5
2.3.2 Jacket Pipe 6
2.4 Instrumentation 7
2.4.1 Thermocouples 7
2.4.2 Pressure Transducer 12
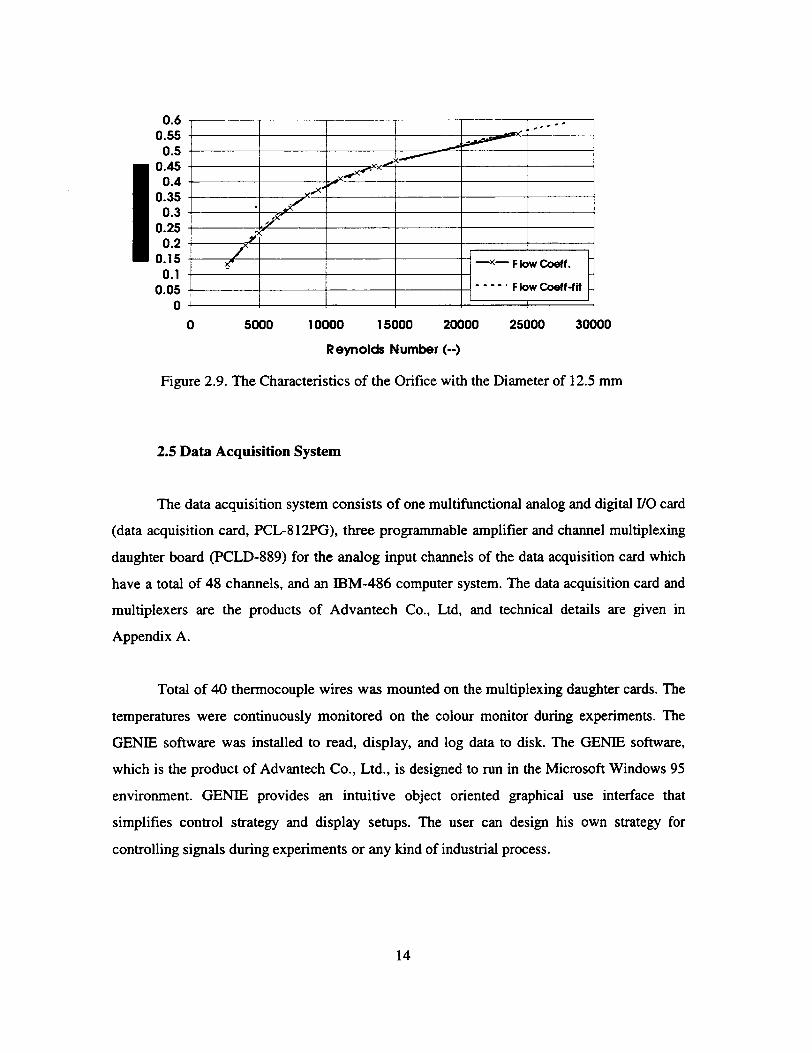
2.4.3 Flowmeter 13
2.5 Data Acquisition System 14
3. OPERATING PROCEDURES OF THE TEST FACILITY 15
3.1 System Check 15
3.1.1 Isothermal Check of Thermocouples 15
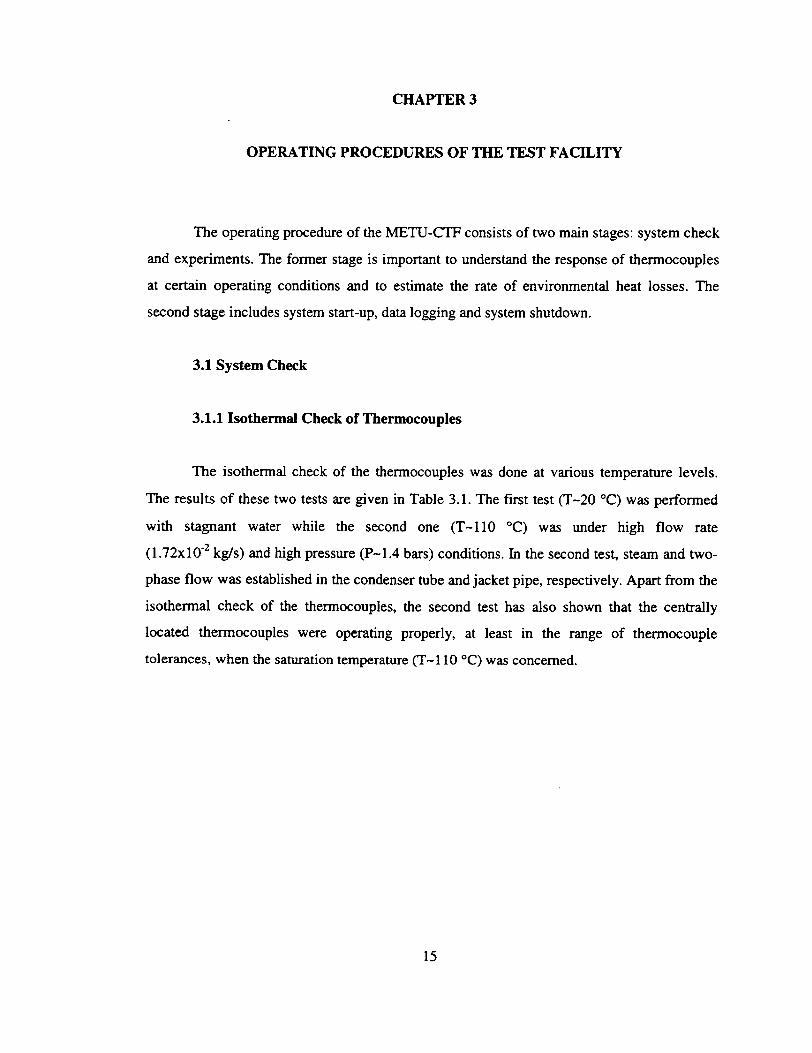
3.1.2 Prediction of Environmental Heat Loss 17
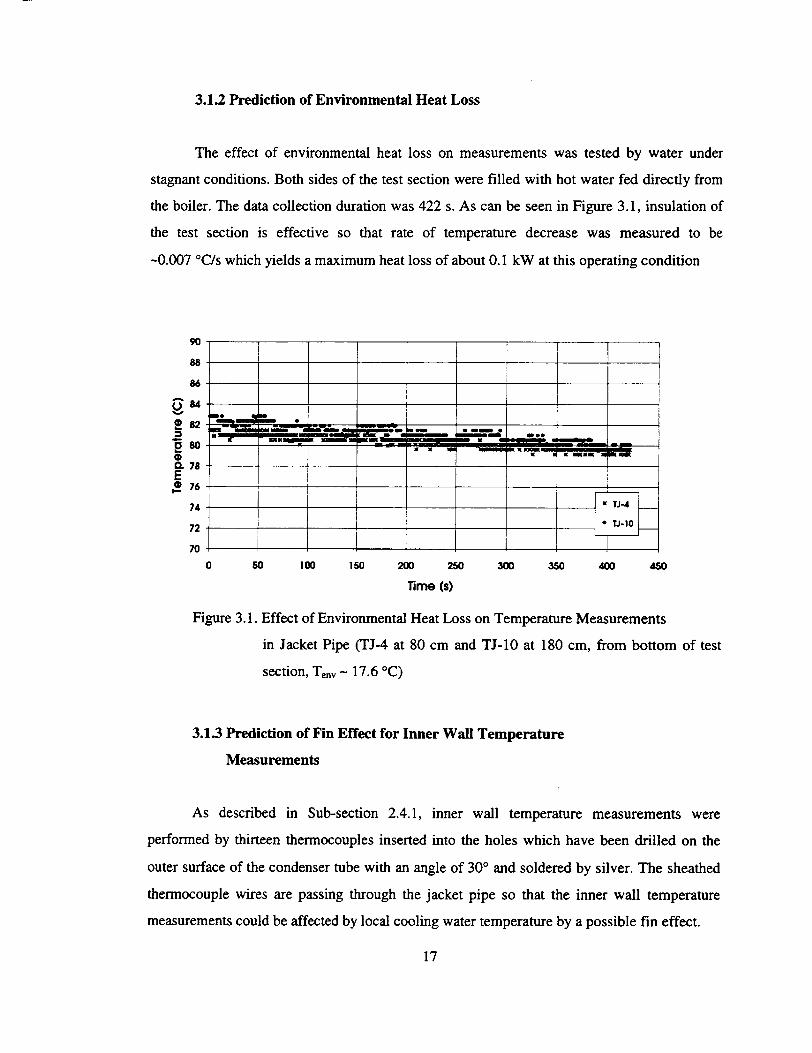
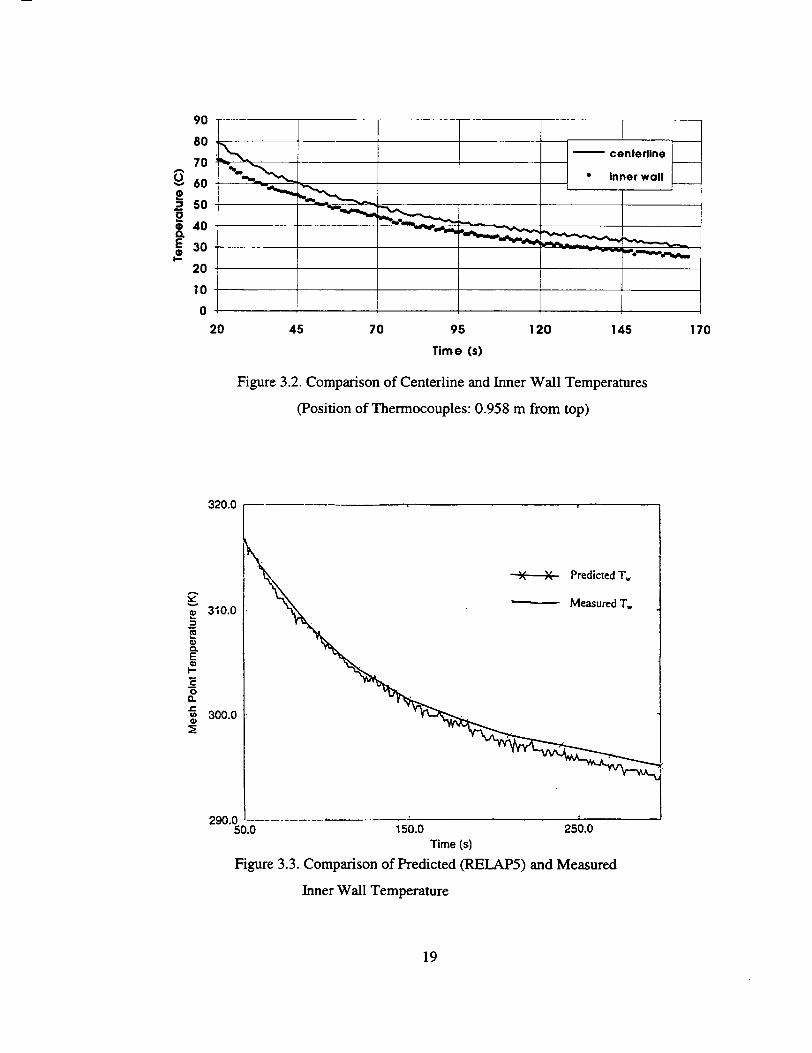
3.1.3 Prediction of Fin Effect for Inner Wall Temperature
Measurements 17
3.1.4 Reproducibility of Data 20
3.2 Experiments 21
3.2.1 System Start-up 21
3.2.2 Operating at Steady-state Conditions and
Data Logging 22
3.2.3 System Shutdown 22
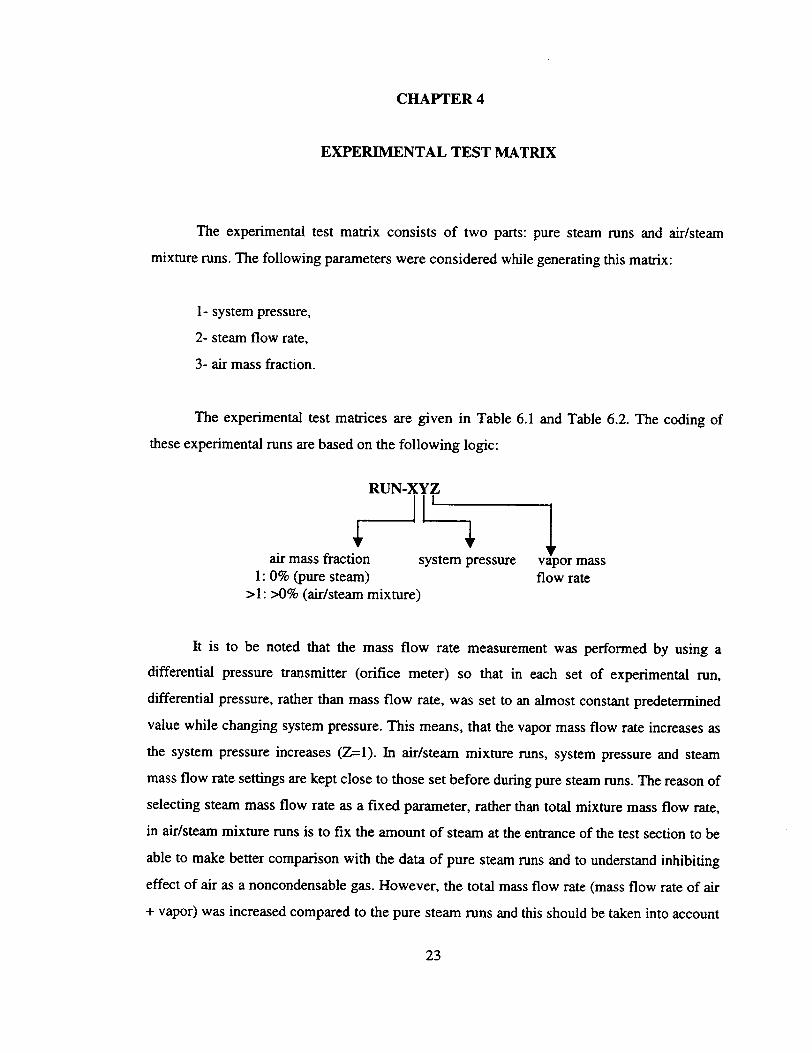
4. EXPERIMENTAL TEST MATRIX 23
5. DATA REDUCTION PROCEDURE 26
V
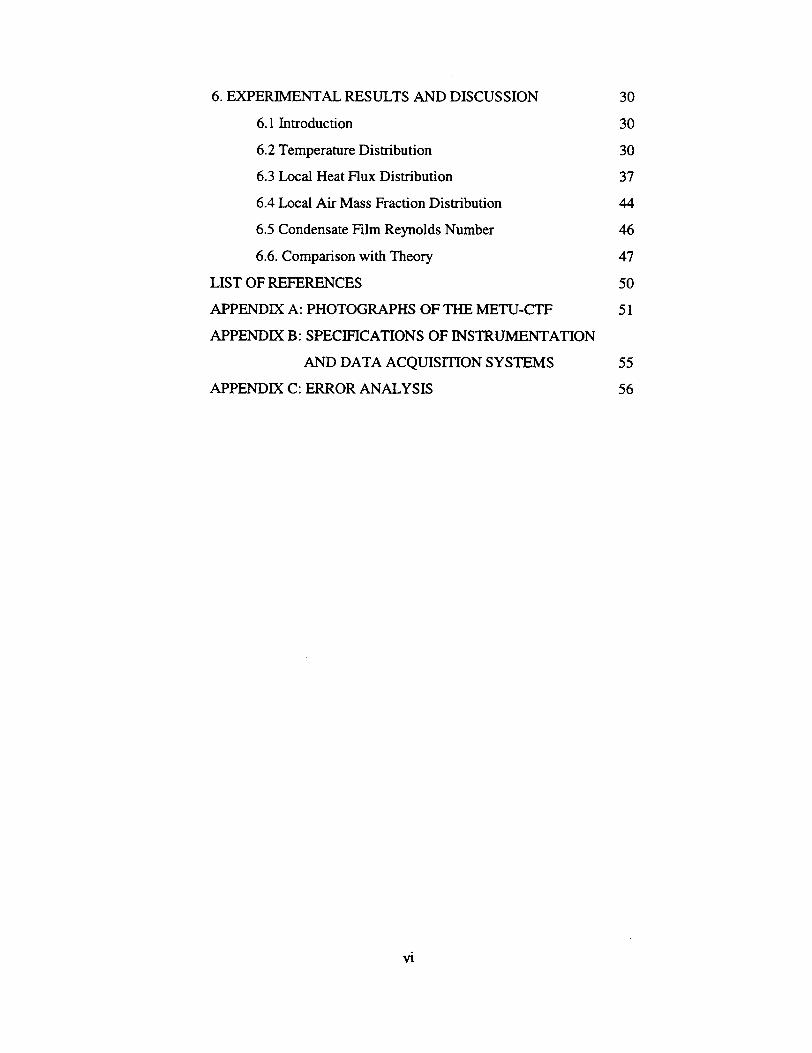
6. EXPERIMENTAL RESULTS AND DISCUSSION 30
6.1 Introduction 30
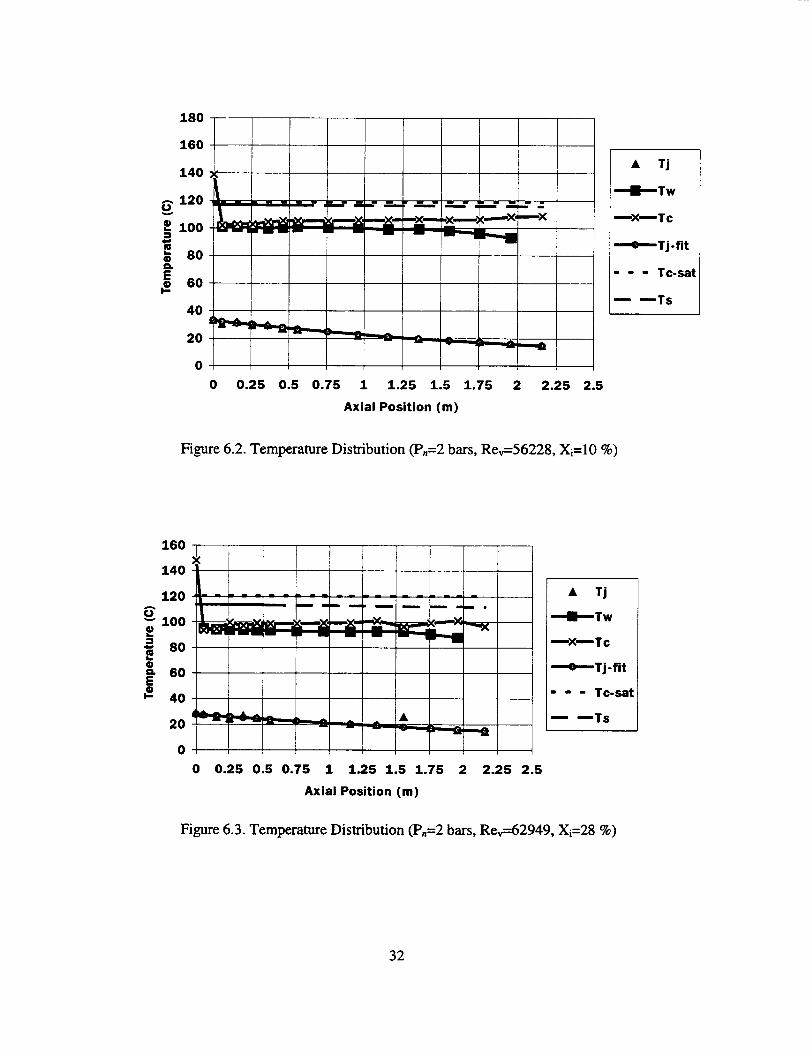
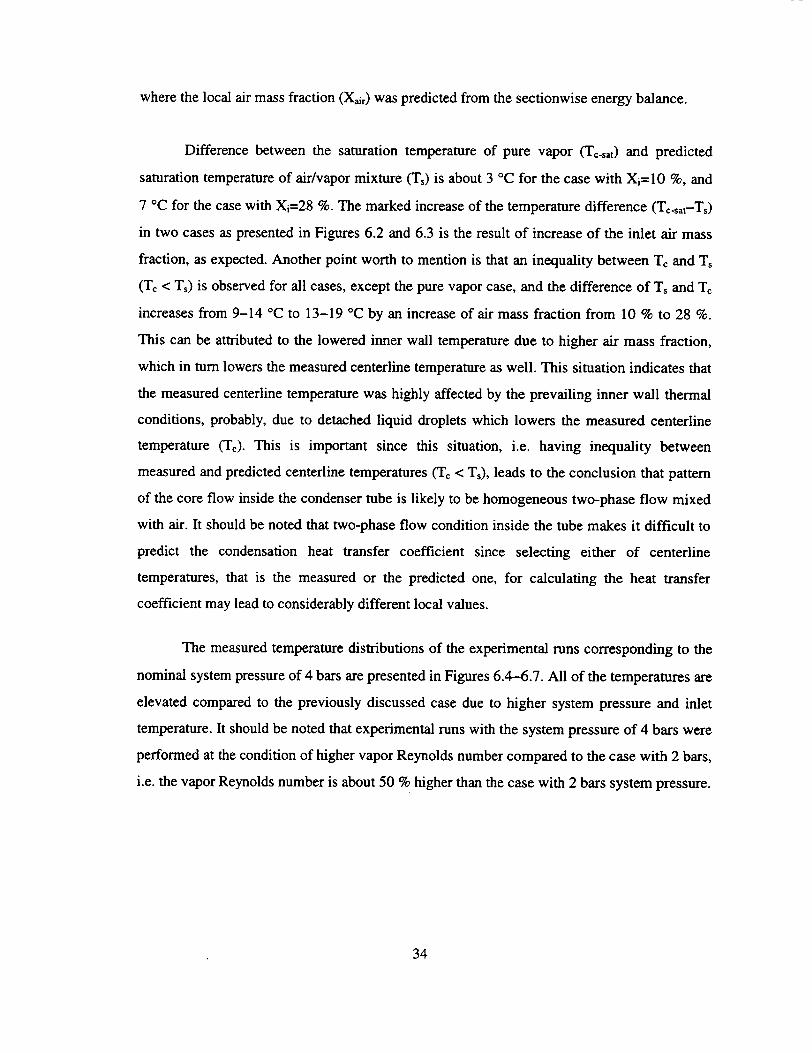
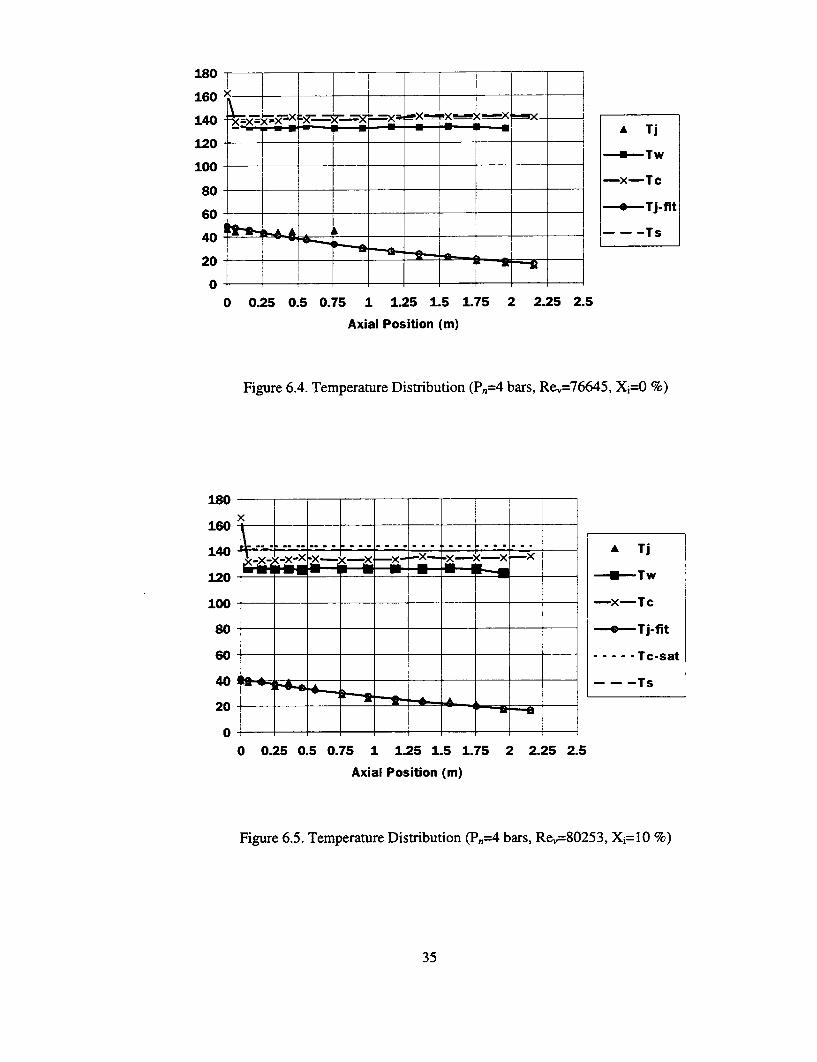
6.2 Temperature Distribution 30
6.3 Local Heat Flux Distribution 37
6.4 Local Air Mass Fraction Distribution 44
6.5 Condensate Film Reynolds Number 46
6.6. Comparison with Theory 47
LIST OF REFERENCES 50
APPENDIX A: PHOTOGRAPHS OF THE METU-CTF 51
APPENDIX B: SPECIFICATIONS OF INSTRUMENTATION
AND DATA ACQUISITION SYSTEMS 55
APPENDIX C: ERROR ANALYSIS 56
vi
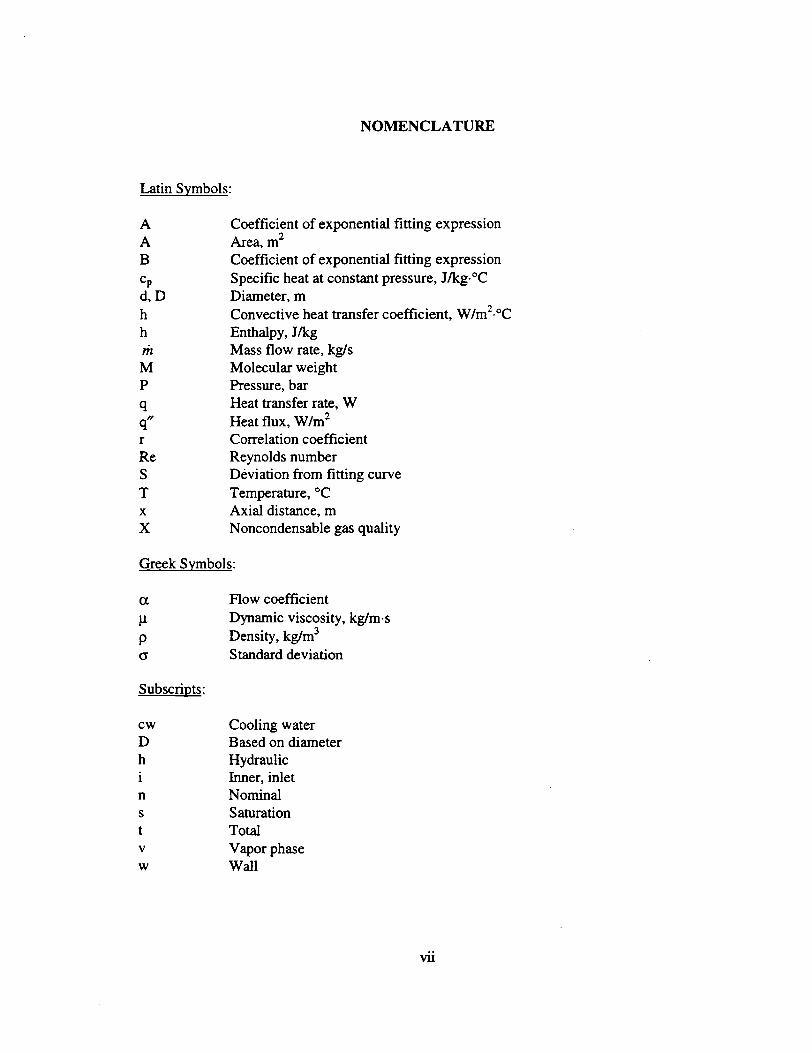
NOMENCLATURE
Latin Symbols:
A Coefficient of exponential fitting expression A Area, m2
B Coefficient of exponential fitting expression Cp Specific heat at constant pressure, J/kg-°C d, D Diameter, m h Convective heat transfer coefficient, W/m 2-°C h Enthalpy, J/kg rh Mass flow rate, kg/s M Molecular weight P Pressure, bar q Heat transfer rate, W q" Heat flux, W/m2 r Correlation coefficient Re Reynolds number S Deviation from fitting curve T Temperature, 'C x Axial distance, m X Noncondensable gas quality
Greek Symbols:
(X Flow coefficient Ax Dynamic viscosity, kg/m-s p Density, kg/M3
( Standard deviation
Subscripts:
cw Cooling water D Based on diameter h Hydraulic i Inner, inlet n Nominal s Saturation t Total v Vapor phase w Wall
vii
CHAPTER 1
INTRODUCTION
The introduction of nuclear power becomes an attractive solution to the problem of
increasing demand for electricity power capacity in Turkey. Thus, Turkey is willing to follow
the technological development trends in advanced reactor systems. A part of our long-term
research and development efforts is planned to concentrate on passive cooling systems. The
primary objectives of the passive design features are to simplify the design, which assures the
minimized demand on operator, and to improve plant safety. The research on passive systems
mainly comprises the computer code assessment studies and includes the applications for both
old and new generation reactor systems. To accomplish these features the operating principles
of passive safety systems should be well understood by an experimental validation program.
Such a validation program is also important for the assessment of advanced computer codes,
which are currently used for design and licensing procedures. The condensation mode of heat
transfer plays an important role for the passive heat removal applications in the current
nuclear power plants (e.g. decay heat removal via steam generators in case of loss of heat
removal system) and advanced water-cooled reactor systems. But it is well established that the
presence of noncondensable gases can greatly inhibit the condensation process due to the
build-up of noncondensable gas concentration at the liquid/gas interface. The isolation
condenser of passive containment cooling system of the simplified boiling water reactors is a
typical application area of in-tube condensation in the presence of noncondensable. The
research work concerning the application of condensation in the presence of air, as a
noncondensable gas, was first undertaken for a Once Through Steam Generator (OTSG) type
of PWR for which experimental data were available. These experimental data were obtained
from the 2X4 test loop of the University of Maryland at College Park (UMCP), addressing a
very important safety issue called the loss of residual heat removal system after reactor
shutdown. The experimental data were used for the assessment of RELAP5/mod3 (v5m5)
thermal-hydraulic computer code and both the effect of Nusselt model, incorporated in the
code as the condensation model, and the effect of nodalization model were investigated [1].
1
But the lack of measurements for the inside of the steam generator has led us to the conclusion
that the separate effect test is strongly needed for the investigation of in-tube condensation and
the effect of noncondensables on the condensation mode of heat transfer. Thus, an
experimental study which could enable us for the fundamental investigation of condensation
in the presence of air was planned in cooperation with the Mechanical Engineering
Department of the Middle East Technical University (METU), Ankara, in the frame of a
project (Project No: 94403507) between the Turkish Atomic Energy Authority (TAEA) and
METU. The project is partially sponsored by the International Atomic Energy Authority
(IAEA) under the Coordinated Research Program (Contract No: 8905/RO) which is entitled
"Thermohydraulic Relationships for Advanced Water Cooled Reactors '"
The experimental program [2] covers a wide range of steam and air/steam mixture
flow rates under forced convection conditions -which partly falls outside the range
encountered in typical passive heat removal applications in NPPs due to high Reynolds
number- and has the purpose to investigate the inhibiting effect of air on steam condensation
process. The results of this experimental study are also planned to be supplementary in nature
for other experimental investigations such as those performed at the Massachusetts Institute of
Technology (MIT), Cambridge, and University of California, Berkeley, (UCB). These
investigations undertaken at MIT and UCB aim to support GE's Passive Containment Cooling
System (PCCS) and Isolation Condenser (IC) designs, with relatively lower Reynolds number.
As stated in the CAMP (Thermalhydraulic Code Applications and Maintenance
Program) agreement between the Turkish Atomic Energy Authority (TAEA) and the US
Nuclear Regulatory Commission (USNRC), the experimental data on in-tube steam
condensation in the presence of air are opened to the USNRC. The data will be utilized for the
assessment and validation of the RELAP5/mod3 thermal-hydraulic system analysis code. The
assessment of this computer code, based on the data of MIT and UCB for pure steam
condensation and condensation in the presence of air and helium was finished. [3].
2
CHAPTER 2
DESCRIPTION OF THE TEST FACILITY
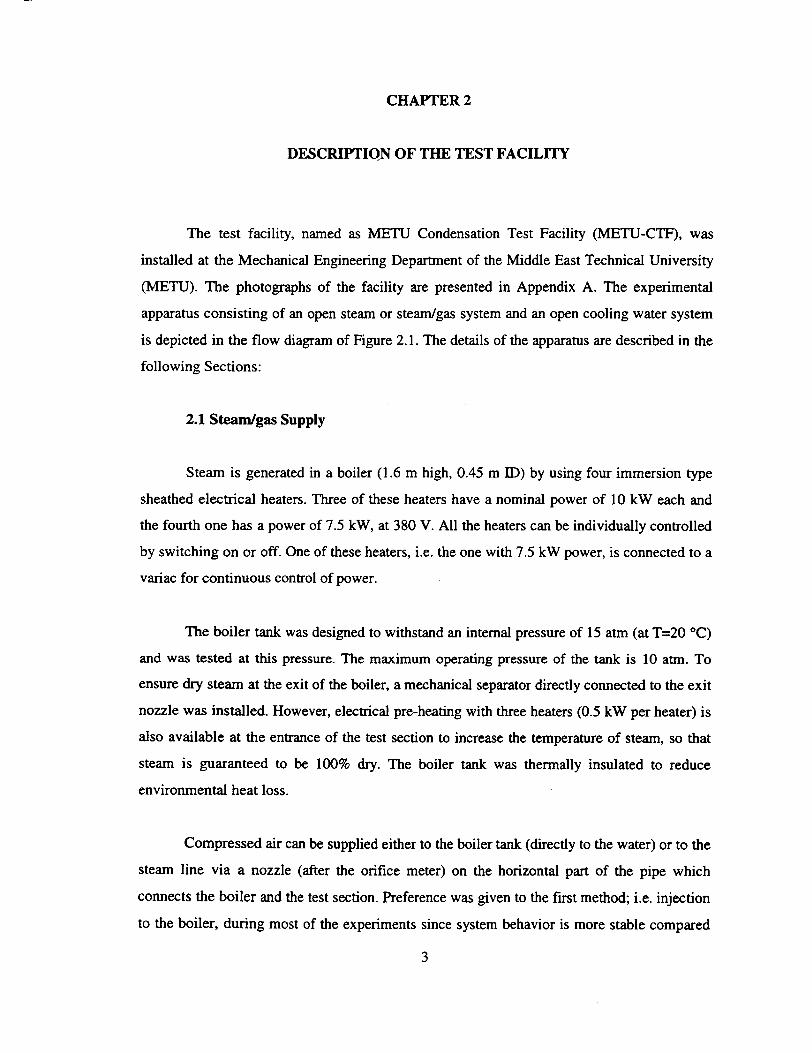
The test facility, named as METU Condensation Test Facility (METU-CTF), was
installed at the Mechanical Engineering Department of the Middle East Technical University
(METU). The photographs of the facility are presented in Appendix A. The experimental
apparatus consisting of an open steam or steam/gas system and an open cooling water system
is depicted in the flow diagram of Figure 2.1. The details of the apparatus are described in the
following Sections:
2.1 Steam/gas Supply
Steam is generated in a boiler (1.6 m high, 0.45 m ID) by using four immersion type
sheathed electrical heaters. Three of these heaters have a nominal power of 10 kW each and
the fourth one has a power of 7.5 kW, at 380 V. All the heaters can be individually controlled
by switching on or off. One of these heaters, i.e. the one with 7.5 kW power, is connected to a
variac for continuous control of power.
The boiler tank was designed to withstand an internal pressure of 15 atm (at T=20 °C)
and was tested at this pressure. The maximum operating pressure of the tank is 10 atm. To
ensure dry steam at the exit of the boiler, a mechanical separator directly connected to the exit
nozzle was installed. However, electrical pre-heating with three heaters (0.5 kW per heater) is
also available at the entrance of the test section to increase the temperature of steam, so that
steam is guaranteed to be 100% dry. The boiler tank was thermally insulated to reduce
environmental heat loss.
Compressed air can be supplied either to the boiler tank (directly to the water) or to the
steam line via a nozzle (after the orifice meter) on the horizontal part of the pipe which
connects the boiler and the test section. Preference was given to the first method; i.e. injection
to the boiler, during most of the experiments since system behavior is more stable compared
3
to the second method, when air mass flow rate is increased. When air injection was performed
by the second method (to the horizontal piping), air injected passes through the preheating
section so that local steam condensation was avoided at the entrance of the test section due to
thermal inequilibrium of steam and air. The air supply system consists of an air compressor
and three compressed air tanks with a total capacity of 600 liters. The maximum pressure of
the compressed air system is 10 bars.
The boiler tank is equipped with the measuring instruments given below;
- level gauge with an operating pressure of 16 bars and a test pressure of 32 bars,
- safety vent valve of spring lift type with an operating pressure of 12 bars,
- pressure controller for cutting the power off at a predetermined maximum pressure
setting,
- pressure gauge (1-16 bars),
- relief valve (19.05 mm ID).
2.2 Connecting Piping and Pipe Fittings
The pipe connecting the boiler tank and the test section has a length of approximately
2 m and an ID of 38.1 mm. The pipe was connected to the boiler tank via an isolation valve.
This isolation valve (38.1 mm ID) is used to isolate the boiler until inside pressure of the tank
is increased to a pre-determined level. The measurements performed on this part of the
experimental facility are mass flow rate via a differential pressure transmitter and temperature.
There are three electric heaters (0.5 kW each at 220 V) installed to the horizontal part of the
piping between the orifice meter and the test section. The pipe connecting the boiler and the
test section was thermally insulated.
4
ID: 38. Imm L" 2 600nu
Jackct Pipe (8 1/89 ID/OD, L: 2133 mm)
makeup %vx Uir ne (D T*W l Prb To Drain (® P Tre zns• T.du
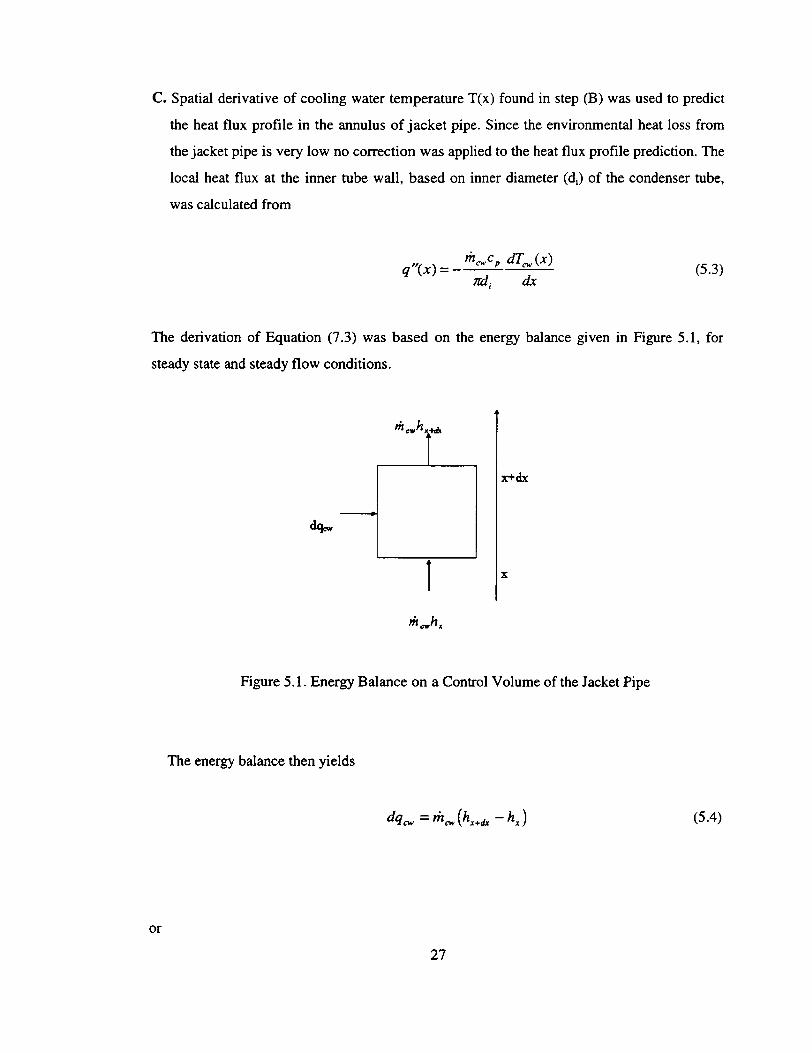
Figure 2. 1. The Flow Diagram of the METU-CTF
2.3 Test Section
The test section is a heat exchanger of countercurrent type, that is steam or steam/gas
mixture flows downward inside the condenser tube (inner tube) and cooling water flows
upward inside the jacket pipe (outer pipe).
2.3.1 Condenser Tube
The condenser tube consists of a 2.15 m long seamless stainless steel tube with
33/39 mm ID/OD and is flanged at both ends with sealing materials. The condenser tube was
flanged to the inlet (33.5/42.6 mm ID/OD) and exit (33.5/42.6 mm ID/OD) pipes of the test
5
section. The total length of the inlet pipe from the horizontal part of the pipe section down to
the condenser tube is approximately 33 cm (10 x di , where di is the inner diameter of the tube)
and this length is long enough for the mixture flow to become fully developed before entering
the condenser. It should also be noted that some uncertainties (such as irregular film
development or dropwise condensation) associated with the liquid film development at the
entrance of the condenser tube are expected to occur in this development region since the
entrance region was not thermally insulated. A pressure measurement port was located at the
vertical part of the inlet pipe flanged to the condenser tube.
A total of 13 holes (1.5 mm diameter) were drilled with an angle of 300 at different
elevations along the condenser tube length to fix the thermocouples for inner wall temperature
measurements. The condenser tube was tested at 10 atm pressure to check that inner wall of
the tube was not pierced during the drilling process.
The outlet of the condenser tube is connected to a tank via exit part of the test section.
This tank is used to keep the system pressure at a constant level by controlling the flow rate of
steam or air/steam mixture through a valve connected to the tank. The measured parameters at
the exit of the test section are pressure and temperature.
2.3.2 Jacket Pipe
The jacket pipe surrounding the condenser tube is made of sheet iron and has a length
of 2.133 m and 81.2/89 mm ID/OD. The cooling water is supplied via a nozzle which has
been welded on the jacket pipe. Similarly, cooling water outlet consists of a nozzle which is
connected to the building water discharge system. Inner diameter of all these nozzles is 12.7
mm. A total of 15 holes (1.5 mm diameter) were drilled radially at different elevations for
installation of the thermocouples to be used for cooling water temperature measurements. The
measured cooling water temperature is used to determine heat flux profile along the annulus
region. The jacket pipe was thermally insulated to reduce environmental heat losses.
6
2.4 Instrumentation
The details of the technical features of the equipment are given in Appendix B.
2.4.1 Thermocouples
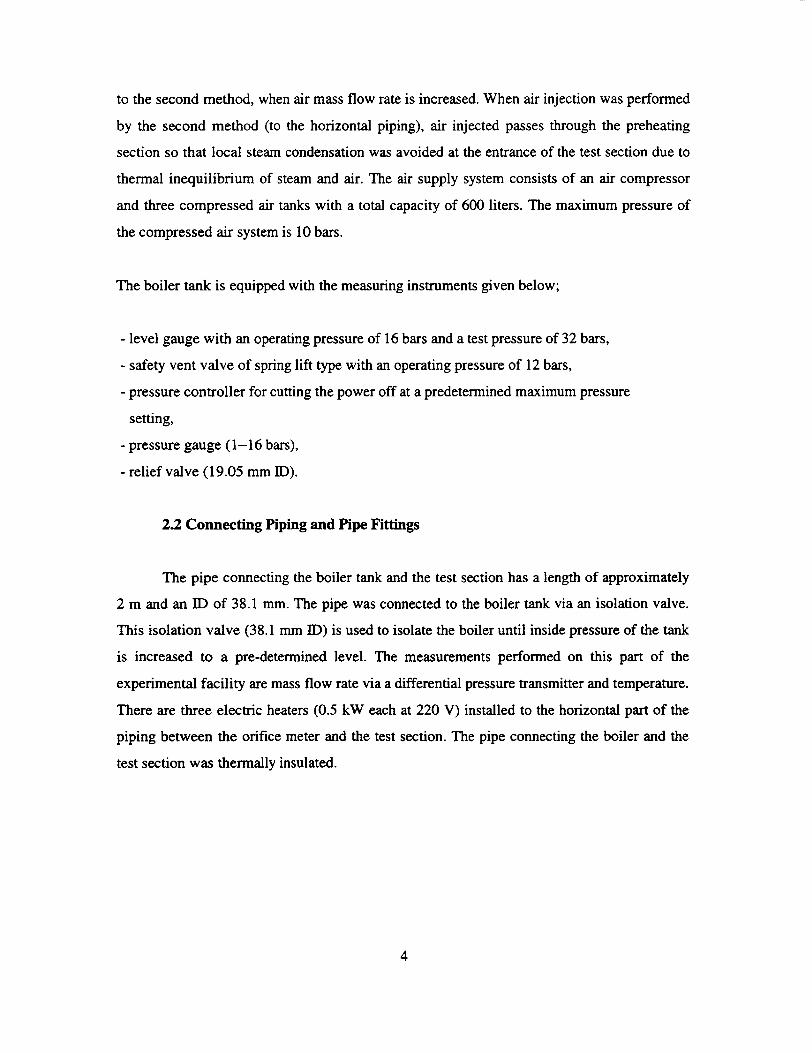
Thirteen thermocouples were inserted into the holes which have been drilled on the
outer surface of the stainless steel condenser tube with an angle of 301 and soldered by silver.
The distance between the inner wall and the tips of thermocouples is approximately 0.5 mm.
(Figure 2.2)
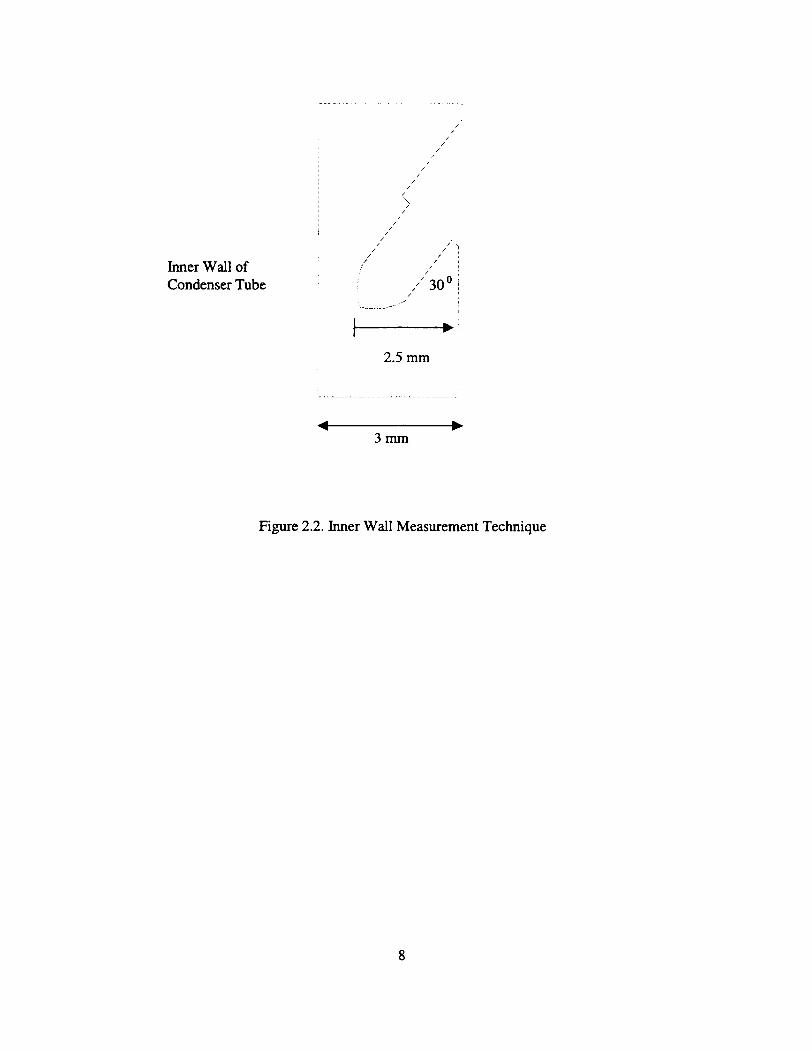
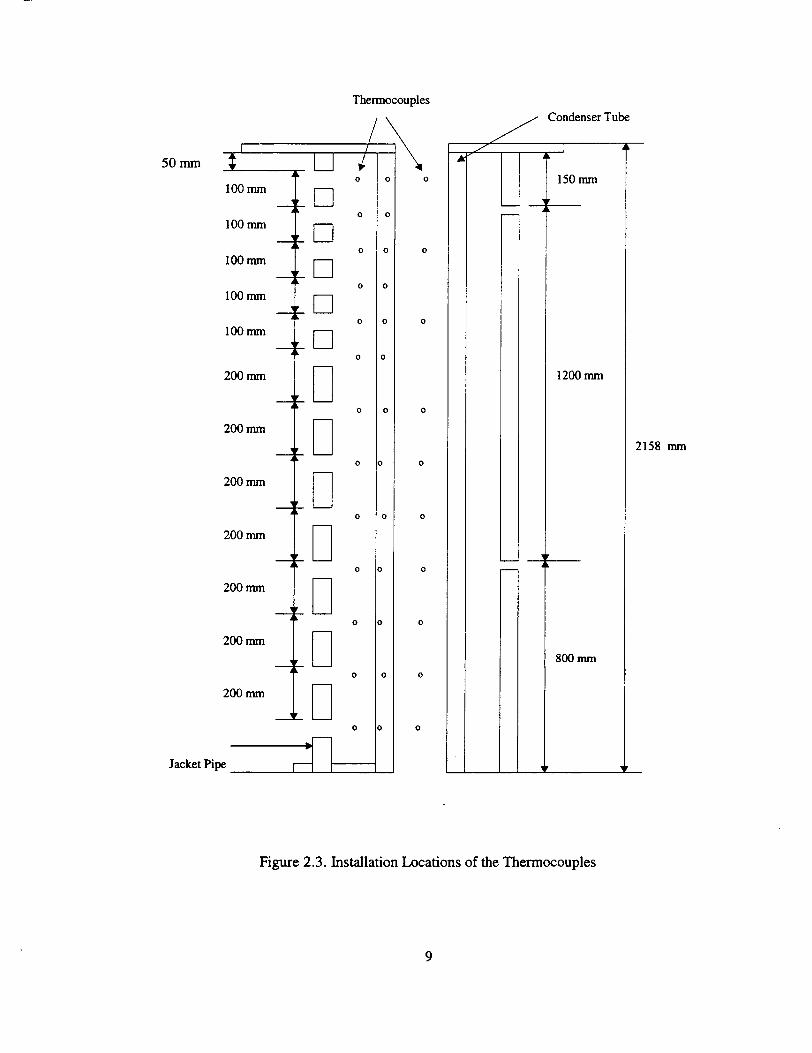
Fifteen thermocouples were inserted into the holes, drilled on the outer surface of the
jacket pipe, and fixed by compression fittings sealed by Teflon material. Thirteen of these
thermocouples are at the same elevation as the thermocouples to be used for inner wall
temperature measurements. Besides this, two additional thermocouples were inserted at the
same elevation but at a 1800 offset orientation. The purpose of these two additional
temperature measurements is to observe the angular variation of the cooling water
temperature.
Ten thermocouples were fixed to a 2 mm diameter Inconel guide wire and installed at
the central position of the condenser tube for the central temperature measurements. The guide
wire was fixed at both ends of the test section.
The installation locations of all thermocouples are given in Figure 2.3.
7
Inner Wall of : Condenser Tube ," 30 0
2.5 mm
3 mm
Figure 2.2. Inner Wall Measurement Technique
8
\ i /
Thermocouples
0101 00
0
0
0
0
0
100mm
100mm
100mm
200 mm
200 mm
200 mm
200 mm
200 mm
200 mm
200 mm
0
0
0
0
a
0
0
0
0
0
Condenser Tube
D D D
D
D Dl ED
Figure 2.3. Installation Locations of the Thermocouples
9
50 mm
100 nnm
100 mm
-I-
-I-
i _
2158 mm
I
-D I
0
0
0
Jacket PipeI r I
-A
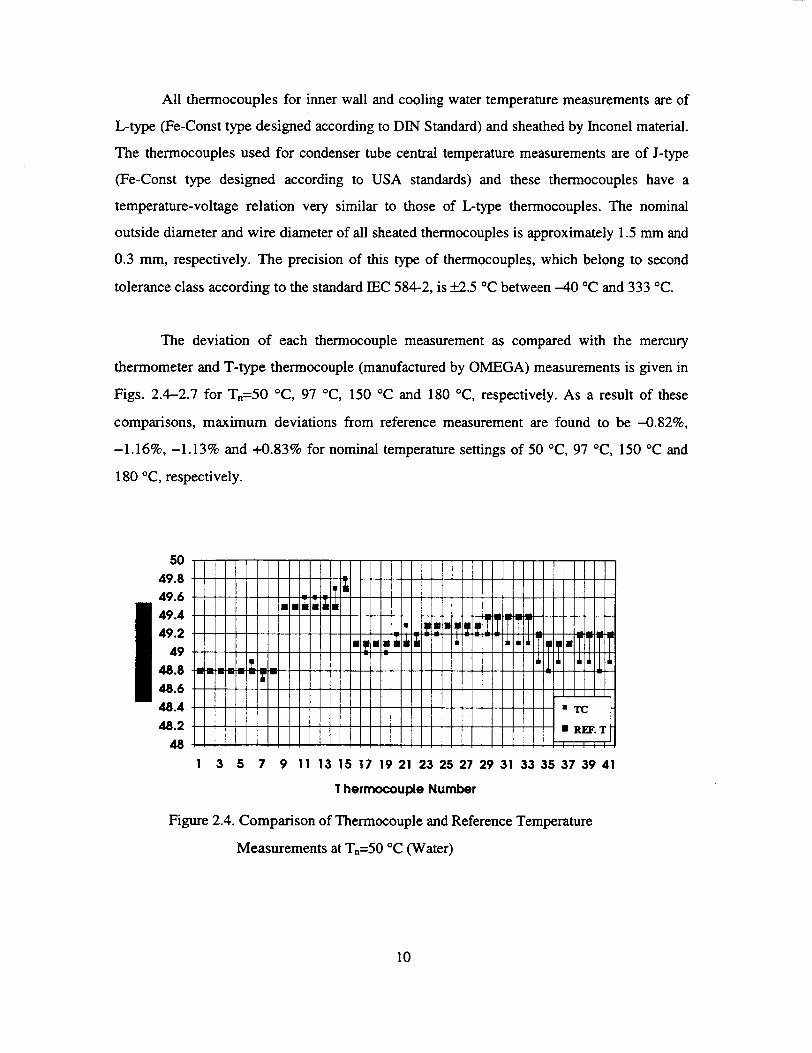
All thermocouples for inner wall and cooling water temperature measurements are of
L-type (Fe-Const type designed according to DIN Standard) and sheathed by Inconel material.
The thermocouples used for condenser tube central temperature measurements are of J-type
(Fe-Const type designed according to USA standards) and these thermocouples have a
temperature-voltage relation very similar to those of L-type thermocouples. The nominal
outside diameter and wire diameter of all sheated thermocouples is approximately 1.5 mm and
0.3 mm, respectively. The precision of this type of thermocouples, which belong to second
tolerance class according to the standard IEC 584-2, is ±2.5 'C between -40 'C and 333 'C.
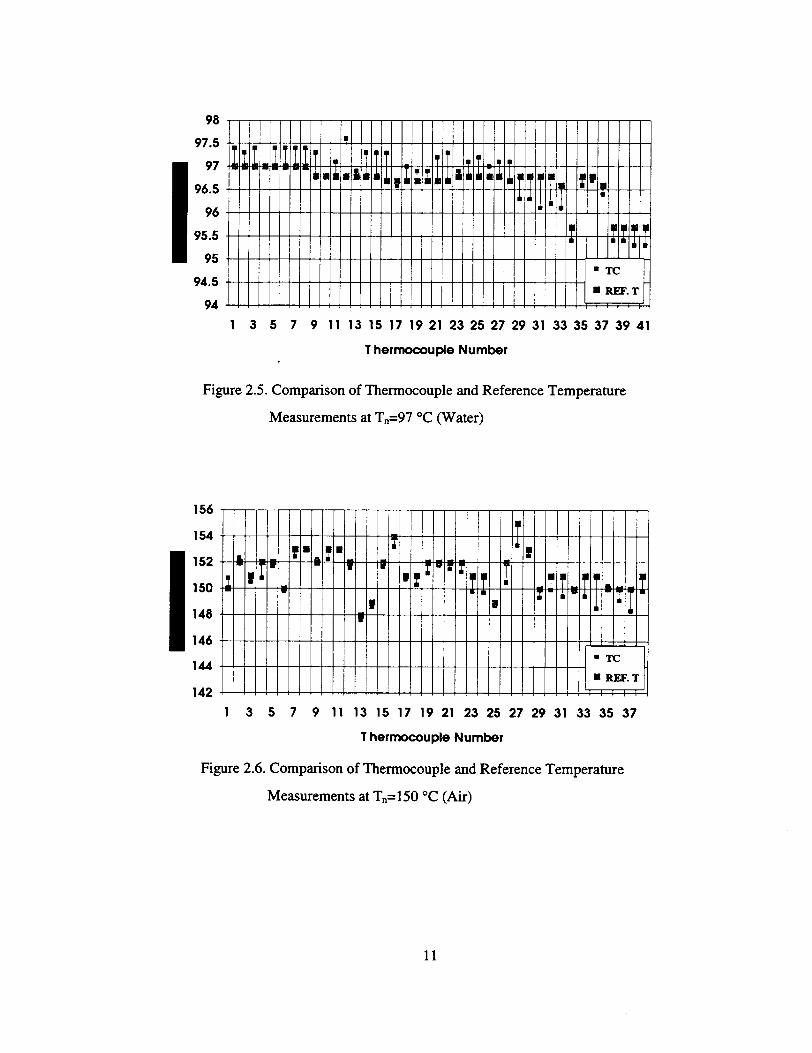
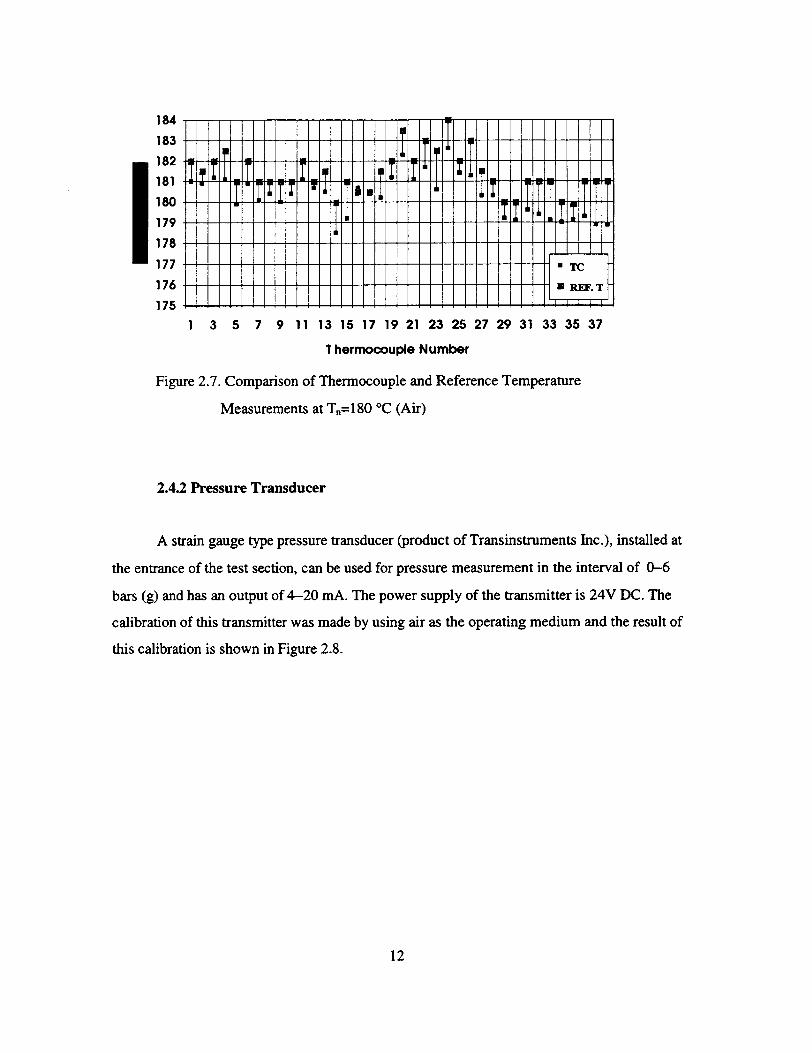
The deviation of each thermocouple measurement as compared with the mercury
thermometer and T-type thermocouple (manufactured by OMEGA) measurements is given in
Figs. 2.4-2.7 for T,,=50 'C, 97 °C, 150 'C and 180 'C, respectively. As a result of these
comparisons, maximum deviations from reference measurement are found to be -0.82%,
-1.16%, -1.13% and +0.83% for nominal temperature settings of 50 'C, 97 'C, 150 'C and
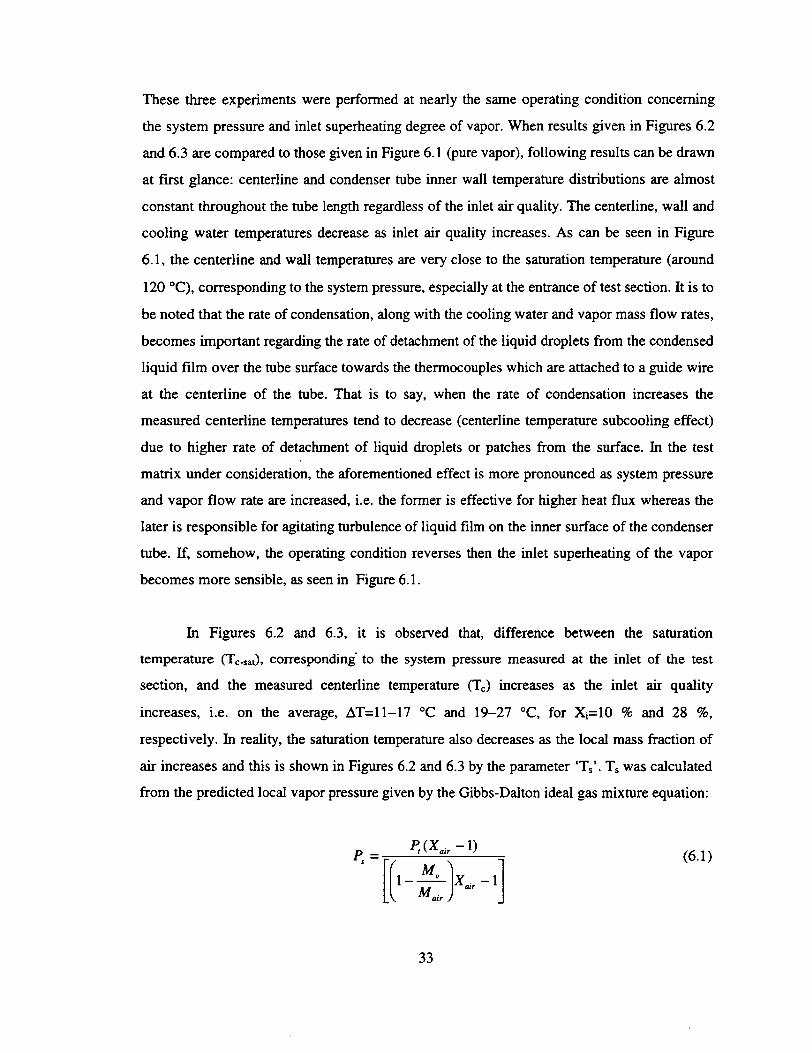
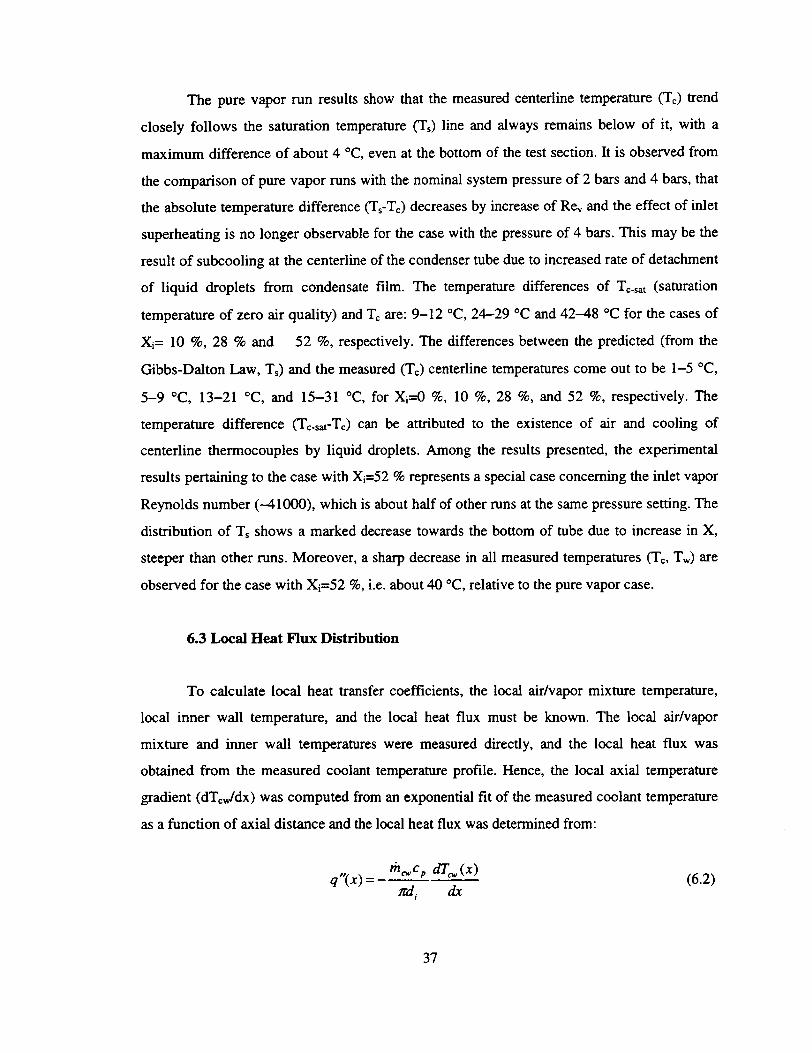
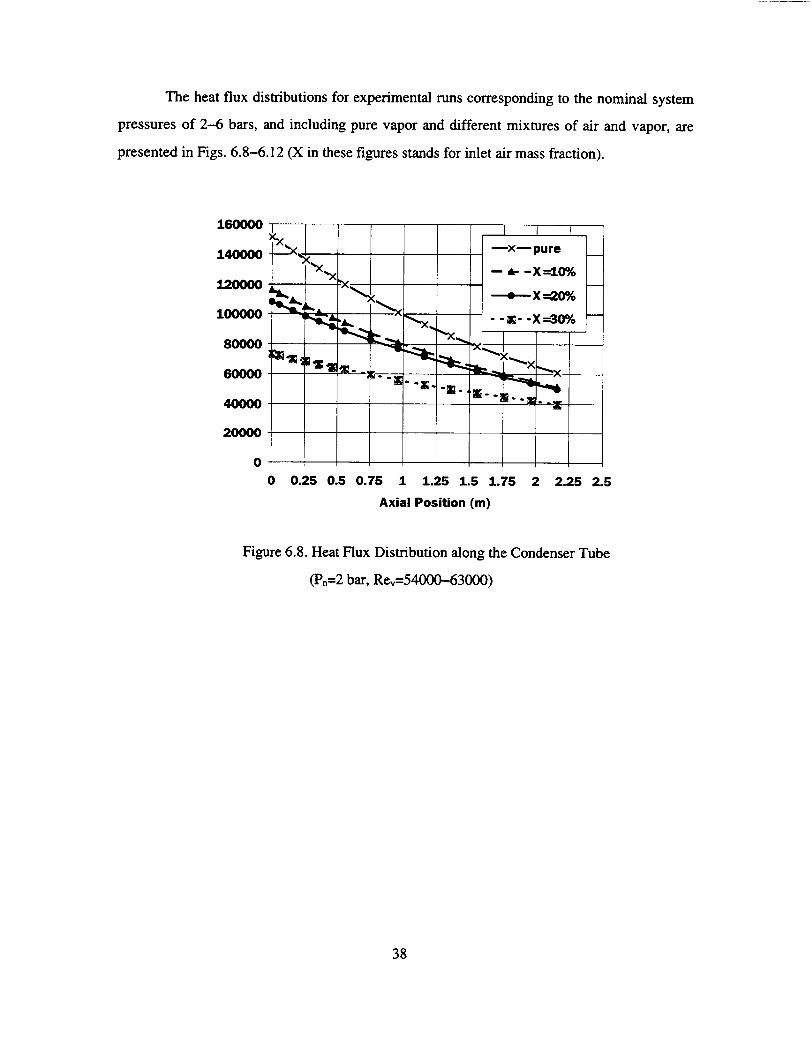
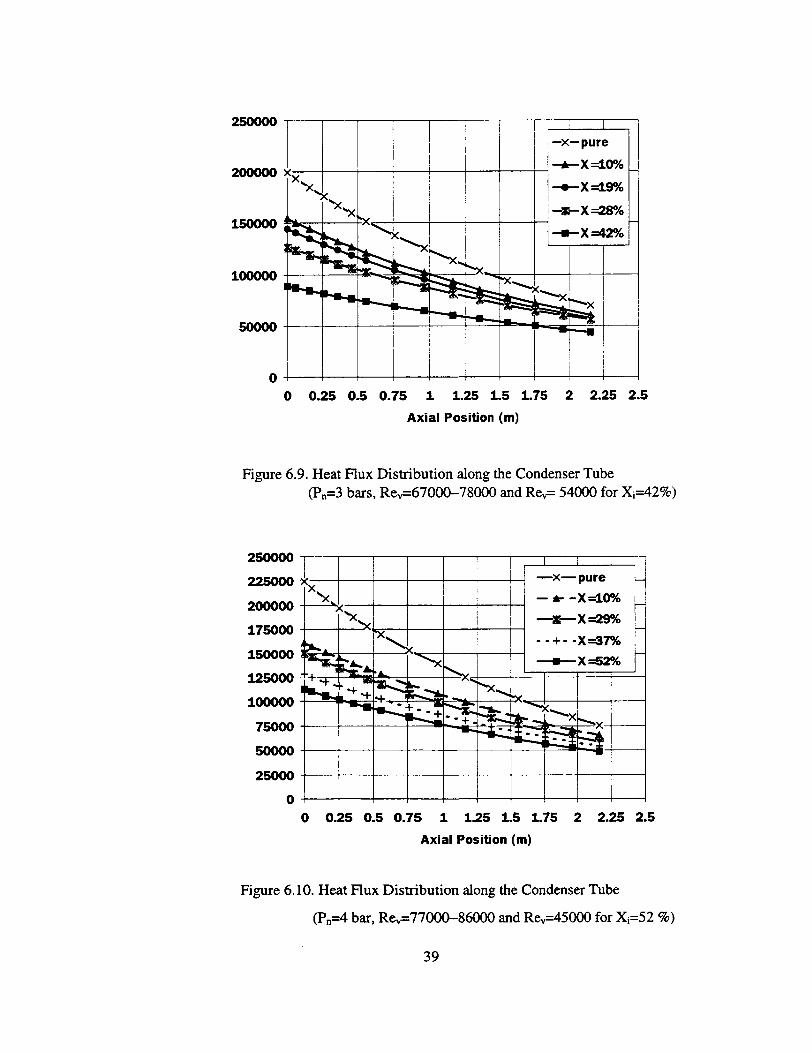
Another point to be emphasized is that local heat flux values for pure steam and
air/steam mixture runs get closer towards the bottom of the condenser tube due to diminishing
condensation rate as the result of increased resistance of condensate film. This means that
condensate film resistance in pure steam runs tends to dominate over diffusion resistance in
air/steam mixture runs, at the bottom of the condenser tube.
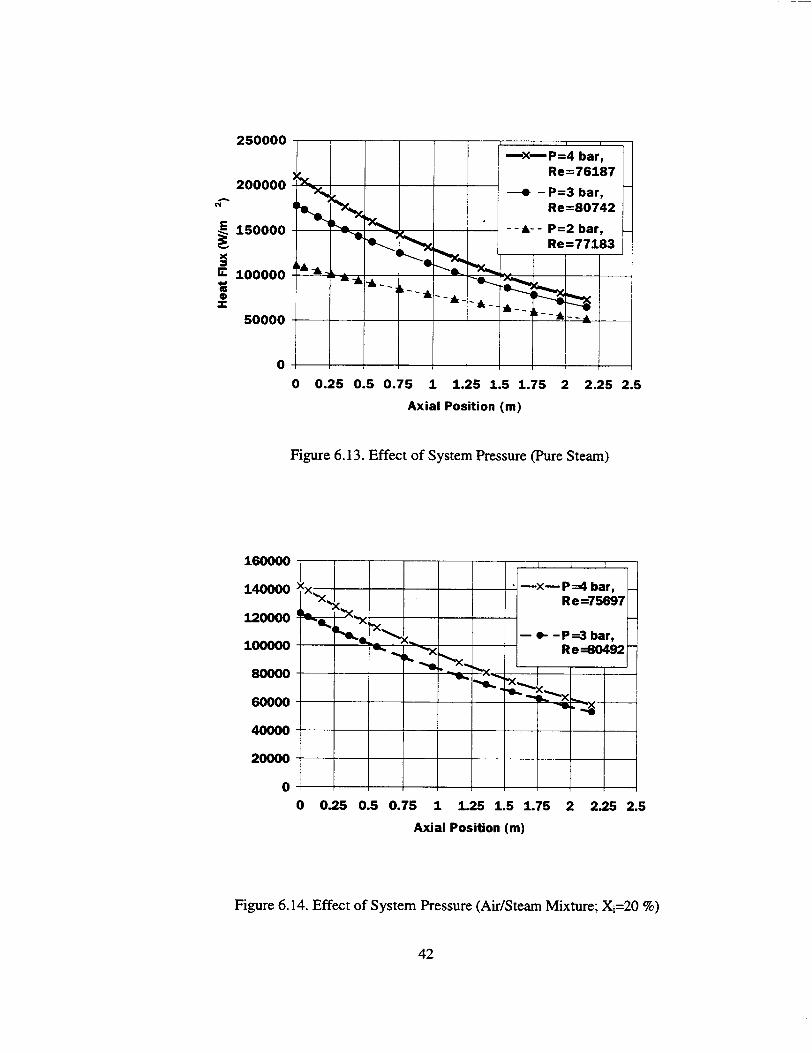
An increase in system pressure increases local heat flux and this can be attributed to
the increase in wall subcooling degree that enhances the thermal driving force for heat transfer.
Moreover, higher system pressure associated with the higher inlet temperature leads to a
greater number of molecular collisions helping in the diffusive transport of energy. However,
in our experimental investigation, the dependency of the wall subcooling degree, either
measured (Tc-Tw) or predicted from Gibbs-Dalton Law (Ts-T,), on system pressure is such
that the wall subcooling degree remains nearly the same for the same inlet air mass fraction
and for the different system pressure. This implies that the vapor mass flow rate may dominate
over system pressure, concerning the effect on local heat flux, for cases with air/vapor mixture
(Figure 6.14). The situation is rather different in pure vapor runs, that is increase in system
pressure has a strong effect on enhancement of predicted, and even measured, wall subcooling
degree and hence on increase of local heat flux (Figure 6.13).
41
250000
200000
E 150000
100000
z
50000
00 0.25 0.5 0.75 1 1.25 1.5 1.75 2 2.25 2.5
Axial Position (m)
Figure 6.13. Effect of System Pressure (Pure Steam)
160000
140000
L20000
100000
60000
40000
20000
0
x• - P-x-P:=4 bar, "Re=75697
.X -- - ---P=3 bar, "• -"Re=80492
0 0.25 0.5 0.75 1 1.25 1.5 1.75 2 2.25 2.5
Axial Position (m)
Figure 6.14. Effect of System Pressure (Air/Steam Mixture; Xi=20 %)
42
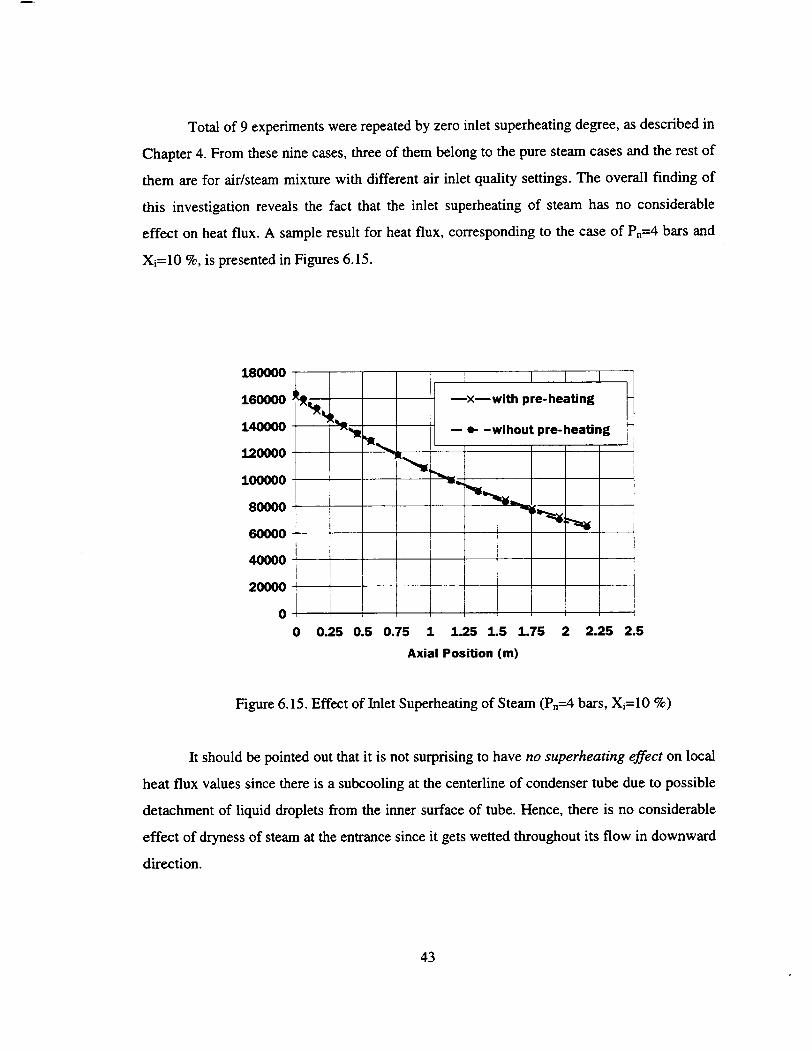
Total of 9 experiments were repeated by zero inlet superheating degree, as described in
Chapter 4. From these nine cases, three of them belong to the pure steam cases and the rest of
them are for air/steam mixture with different air inlet quality settings. The overall finding of
this investigation reveals the fact that the inlet superheating of steam has no considerable
effect on heat flux. A sample result for heat flux, corresponding to the case of Pn=4 bars and
Xi=10 %, is presented in Figures 6.15.
180000
160000
140000
120000
100000
80000
60000
40000
20000
0
0 0.25 0.5 0.75 1 1.25 1.5 1.75
Axial Position (W)
2 2.25 2.5
Figure 6.15. Effect of Inlet Superheating of Steam (Pn=4 bars, Xi=10 %)
It should be pointed out that it is not surprising to have no superheating effect on local
heat flux values since there is a subcooling at the centerline of condenser tube due to possible
detachment of liquid droplets from the inner surface of tube. Hence, there is no considerable
effect of dryness of steam at the entrance since it gets wetted throughout its flow in downward
direction.
43
6.4 Local Air Mass Fraction Distribution
The local air mass fraction was predicted by using the data of predicted heat flux
distribution. The local air mass fraction is defined as:
Xair (X) = .ir (6.3) ?ha + rhm(x)
To obtain the local air mass fraction (or air quality), the data for the local vapor mass
flow rate changing along the channel due to condensation are needed. To calculate the local
vapor mass flow rate, first the sectional condensate flow rate was obtained from a sectionwise
steady state heat balance by neglecting the gas phase sensible heat transfer and considering
only the latent heat transfer, which is given as
Aq = Ahizcod hfg (6.4)
Here the latent heat of condensation (hfg) was calculated at the measured local inner
wall temperature since film temperature is much closer to the inner wall temperature than that
of bulk temperature. The local condensate flow rate, then, was calculated by summing up the
incremental values up to that point. The local vapor mass flow rate was calculated by
subtracting the local condensate mass flow rate from the known vapor flow rate measured at
the inlet of the test section. Since the air mass flow rate is constant, Equation (6.3) can be used
for determining the local air mass fraction.
The predicted data for the air mass fraction distribution along the channel helps us
understand the trend of vapor mass flow rate that decreases towards the bottom of the channel,
along with phase change due to condensation process. The predicted results of the air mass
fraction are presented in Figures 6.16 and 6.17 which correspond to the system pressure of
2 bars and 4 bars, respectively.
44
0.4
0.3
S0.2
0.1
0
0 0.2 0.5 0.7 1 1.2 1.5 1.7 2 2.2 2.5 5 5 5 5 5
Axial Position (m)
Figure 6.16. Distribution of Air Mass Fraction (P,=2 bars)
0.8
0.7
0.6
0.5
0.4
0.3
0.2
0.1
0
2r
. .. .- XX t • X .--X-X
.Xt-X-l.X-- Xi•4
0 0.25 0.5 0.75 1 1.25 1.5 1.75 2 2.25
Axial Position (m)
-x- 10%
- 1W -20%
--- o-30%
- -)K- -37%
•--e.-- 52%
2.5
Figure 6.17. Distribution of Air Mass Fraction (Pn=4 bars)
45
It is seen from the predicted data that the air mass fraction increases steadily along the
channel as a result of condensate accumulation. This is known as "suction effect" since vapor
liquid phase change due to condensation sucks air towards the bottom of the test section. We
can extract a general conclusion that the air quality is a linear function of the axial distance in
spite of the heat flux behavior which exhibits an exponential trend.
6.5 Condensate Film Reynolds Number
When there is a sufficient amount of condensate flow, turbulence may appear in the
condensate film which results in higher heat transfer rates. The criterion for determining
whether the flow is laminar or turbulent is the Reynolds number, and for the condensation
system it is defined as
VDhpf 4AVpf Re =- =- (6.5)
and by inserting P---Kd for vertical tube, we get
Ref - (6.6) irdlgi
where rhn is the mass flow rate through the particular section of the condensate film.
As the condensate layer thickness increases it can undergo a transition from laminar to
turbulent flow. McAdams [10] suggests that transition could occur at a condensate Reynolds
number of 1800 where the Reynolds number is defined in Eq. (6.5). At high values of the
shear stress, however, Carpenter and Colburn found transition values as low as 200-300 [11].
Since Reynolds number of vapor is high (-54000-94000) in the experiments conducted at the
METU-CTF, the later values of the condensate Reynolds number (200-300) are applicable for
criteria of transition from laminar to turbulent flow. The sectional condensate flow rate was
obtained from a sectionwise steady state heat balance and, then, the local condensate flow rate
46
was calculated by summing up the incremental values up to that point. The local values
of the condensate film Reynolds number were calculated and the results are presented in
Figures 6.18 for system pressures of 2 bars. The calculated film Reynolds number decreases as
air mass fraction increases at the same system pressure setting, and falls into the range of
turbulent region for all experimental runs (other than those performed at a system pressure of
about 1.5 bars), i.e. Ref > 300. For example; the film Reynolds number increases up to about
3500 for pure vapor run performed at the nominal system pressure of 6 bars.
1800
1600
1400
1200
1000
80
600
400
200
00 0.2 0.4 0.6 0.8
x/L
1 1.2
Figure 6.18. Distribution of Condensate Film Reynolds Number (Pn=2 bars)
6.6. Comparison with Theory
A set of simulations was performed by using the RELAP5/mod-3.2.1.2 thermal
hydraulic system analysis computer code. The code solves six equations (mass, momentum,
and energy) for two-phase and one equation (mass) for noncondensable gas. The heat transfer
solution scheme of the code also includes condensation of water vapor containing
noncondensable gas, such as air, hydrogen, nitrogen, helium. The RELAP5 code calculates a
wall heat transfer coefficient based on condensation logic under the following conditions:
47
- The wall temperature is below the saturation temperature based on the bulk partial pressure
of vapor calculated by using the Gibbs-Dalton ideal gas mixture equation.
- The liquid temperature is above the wall temperature.
- The liquid void fraction is greater than 0.1.
- The bulk noncondensable quality is less than 0.999.
- The pressure is below the critical pressure.
- Only filmwise condensation exists.
The default model used currently is the Shah-Colburn-Hougen model. The Shah model
replaces the Nusselt model for pure steam condensation if the heat transfer coefficient
calculated by this model is greater than that of Nusselt model. The Colburn-Hougen diffusion
model, used for taking into account the inhibiting effect of a noncondensable gas, involves an
iteration process to solve for the steam saturation temperature at the interface between the
steam/gas boundary layer and water film. The model was developed under the following
assumptions:
- The sensible heat transfer through the diffusion layer to the interface is negligible.
- Stratification of the gas in vapor by buoyancy effects is negligible.
- Required mass transfer coefficients can be obtained by applying the analogy between the
heat and mass transfer.
- The gas is not removed from the vapor region by dissolving it in the condensate.
The formulation is based on the principle that the heat transferred by condensing vapor
at liquid-vapor interface which is diffusing through the noncondensable gas is equal to the
heat transfer through the condensate. This energy conservation principle, obviously, needs
interface pressure (or temperature) to be determined since the interface pressure is always
lower than the bulk pressure (total pressure) at the core due to existence of the
noncondensable gas at the interface. One of the deficiency of the model is the assumption of
having same gas and vapor velocities which is not necessarily correct in reality. Moreover, the
effect of superheating of steam was not incorporated in the formulation.
48
Some of the experimental cases with air/steam mixture were simulated by the
RELAP5/mod-3.2.1.2 beta test version by imposing the measured inner wall temperatures as
boundary condition which means that the jacket pipe was not modelled for not to increase the
uncertainty associated with the flow inside the jacket pipe. The results of heat flux predictions
are plotted against the experimental data as given in Figure 6.19.
200000
150000
100000
50000
00 50000 100000 150000
Heat Flux-RELAP5 (W/m2)
200000
Figure 6.19. Comparison of Measured and Predicted Local Heat Flux Values
It is clear that the RELAP5 code overpredicted majority of experimental local heat flux
data by 5 % - 50 %. In general, the deviation increases by increase of inlet air mass fraction.
49
LIST OF REFERENCES
1. Tanrikut, A., Heper, H., Bayraktar, N. and Gunel, I., "The Simulation of Loss of Heat
Residual System after Reactor Shutdown," Annual Meeting on Nuclear Technology '94,
Stuttgart, 1994.
2. Tanrikut, A., "In-Tube Condensation in the Presence of Air," Ph.D. Thesis, Mechanical
Engineering Department, Middle East Technical University, Ankara, 1998.
3. Tanrikut, A., "An Assessment of RELAP5 Code for Pure Steam Condensation and
Condensation in the Presence of Air," Annual Meeting for Nuclear Technology, Mannheim
(Germany), 21-24 May 1996.
4. RELAP5/MOD3 Code Manual, Code Structure, System Models and Solution Methods,
Idaho National Engineering Laboratory, NUREG/CR-5535, Vol. 1, 1995.
5. Methods of Measurements of Fluid in Closed Conduits, British Standard Institution, BS
1042, Section 1.1, 1981.
6. Brinkworth, B. J., An Introduction to Experimentation, The English Universities Press Ltd.,
1968.
7. Kuhn, S. Z., Schrock, V. E. and Peterson, P. F., "Final Report on U. C. Berkeley Single
Tube Condensation Studies," Dept. of Nuclear Eng., UCB-NE-4201, 1994.
8. Siddique, M., Golay, M. W. and Kazimi, M. S., "The Effect of Noncondensable Gases on
Steam Condensation under Forced Convection Conditions," Dept. of Nuclear Eng., MIT,
MIT-ANP-TR-010, 1992.
9. Tanrikut, A., Yesin, 0., "An Experimental Research on In-tube Condensation in the
Presence of Air," 2nd International Symposium on Two-phase Flow and Experimentation,
Pisa (Italy), 23-26 May 1999.
10. W. H. McAdams, Heat Transmission, McGraw-Hill Book Company, Inc., New York,
1954.
11. W. H. Rohsenow, J. H. Webber and A. T. Ling, Effect of Vapor Velocity on Laminar and
Turbulent Film Condensation, Trans. ASME, Vol. 78, 1956.
50
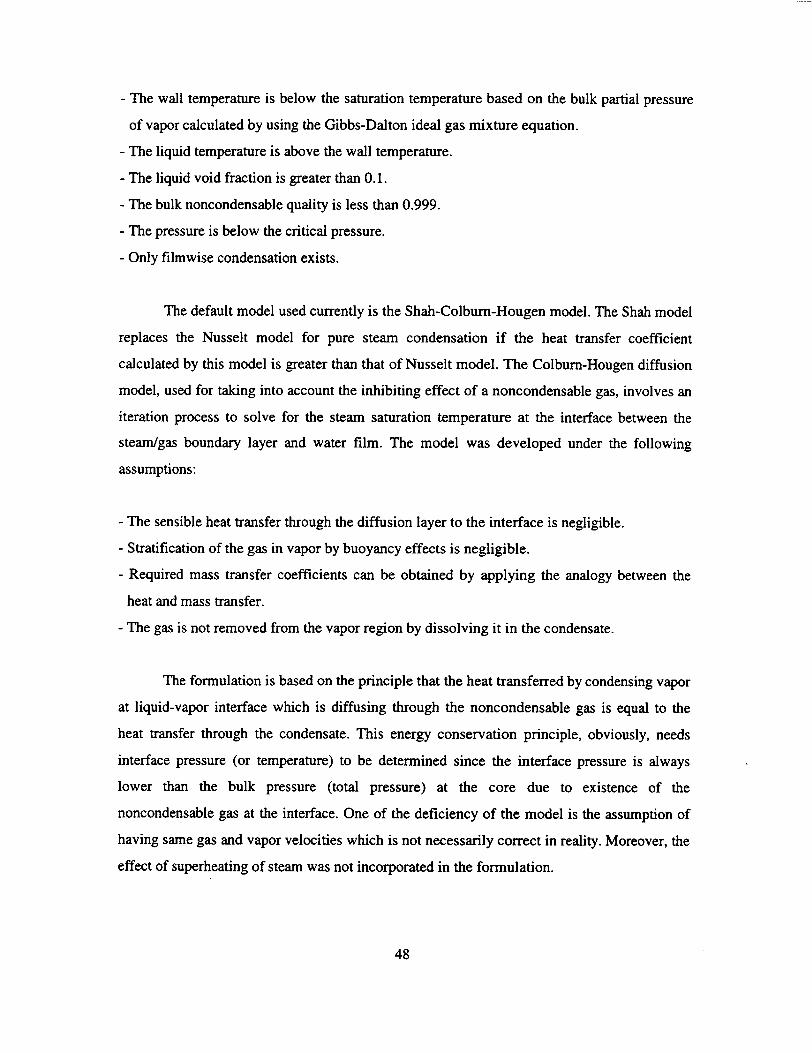
APPENDIX A
PHOTOGRAPHS OF THE METU-CTF
Figure A. 1. General View of the METU-CTF
51
/-
It~ *
Figure A.2. The Compressed Air Supply System
F -U
Figure A.3. The Upper Part of the Test Section (without the Jacket Pipe)
52
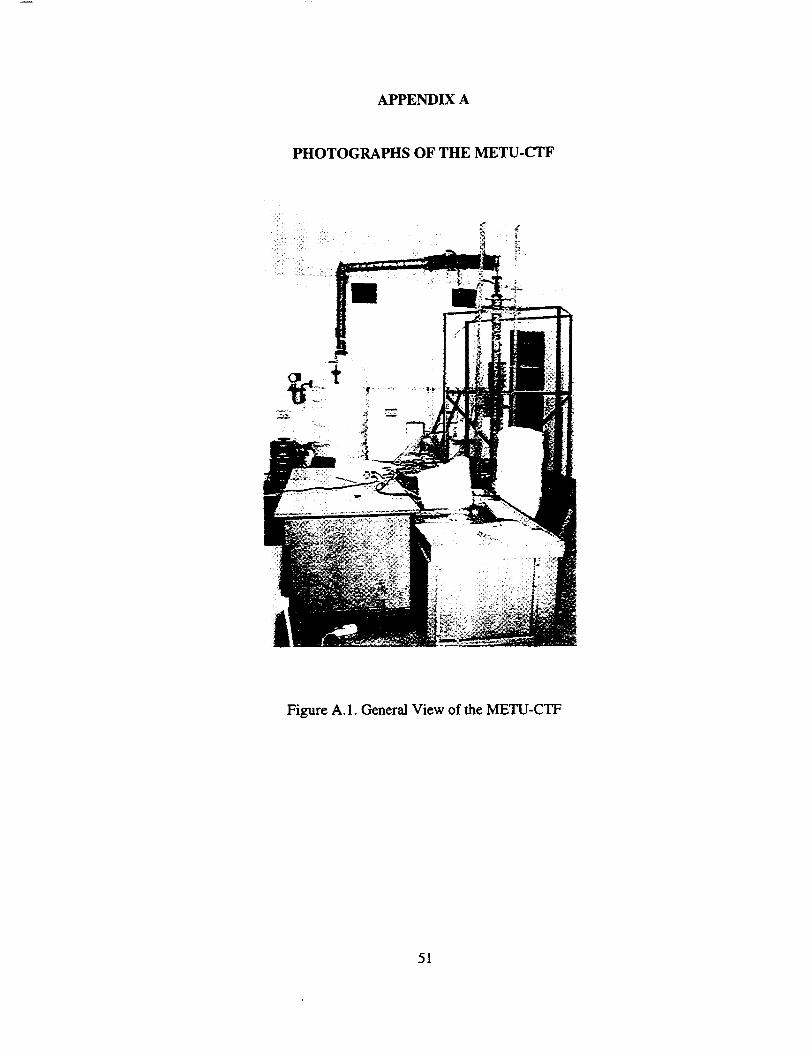
Figure A.4. The Thermocouple (D=1.5 mm) Fixed to the Guide Wire (D=2 mm) to be
Placed Inside the Condenser Tube for Central Temperature Measurement
Figure A.5. The Thermocouple (D=1.5 mm) Fixed Inside the Condenser Tube for Inner Wall
Temperature Measurement
53
Figure A.6. The Lower Flange of Test Section and Penetration of Thermocouples Used for
Central Temperature Measurement
54
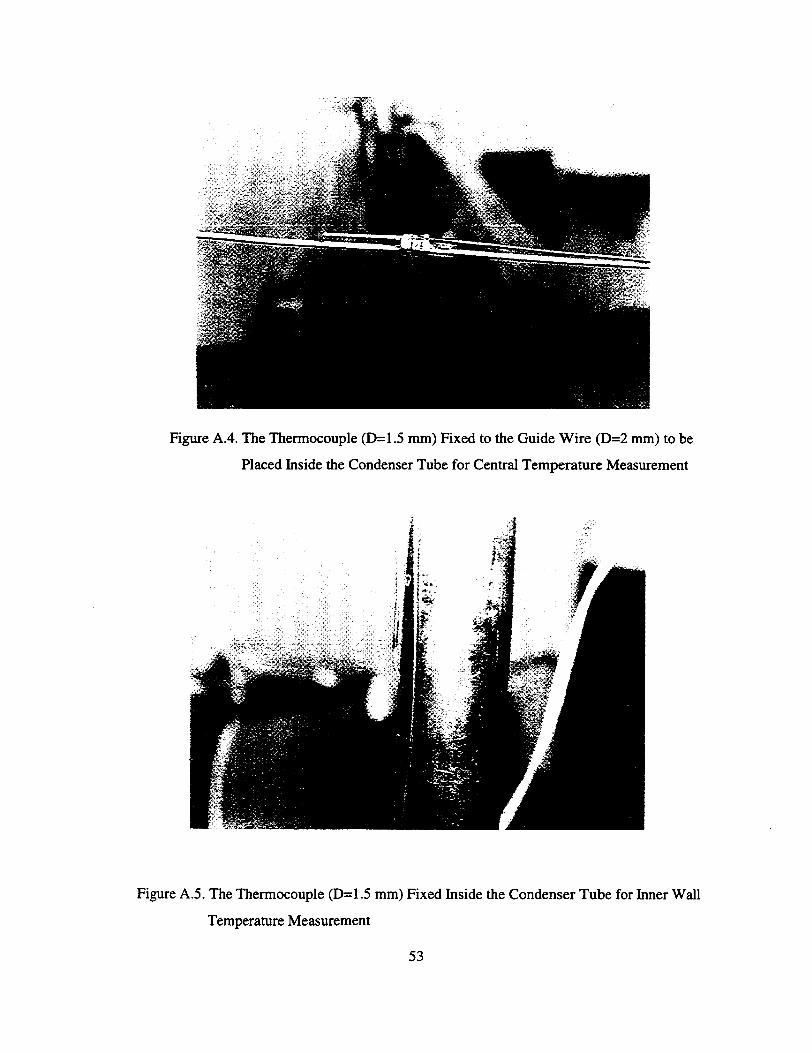
APPENDIX B
SPECIFICATIONS OF INSTRUMENTATION AND
DATA ACQUISITION SYSTEMS
1) Thermocouples:
Manufacturer: ELIMKO Co., Turkey Type: L (Fe-Const type designed according to German DIN standard)
J (Fe-Const type designed according to USA standard)
Class: 2 Temperature Range: -40 °C to 333 'C Tolerance Value: ±2.5 'C according to the standard IEC 584-2
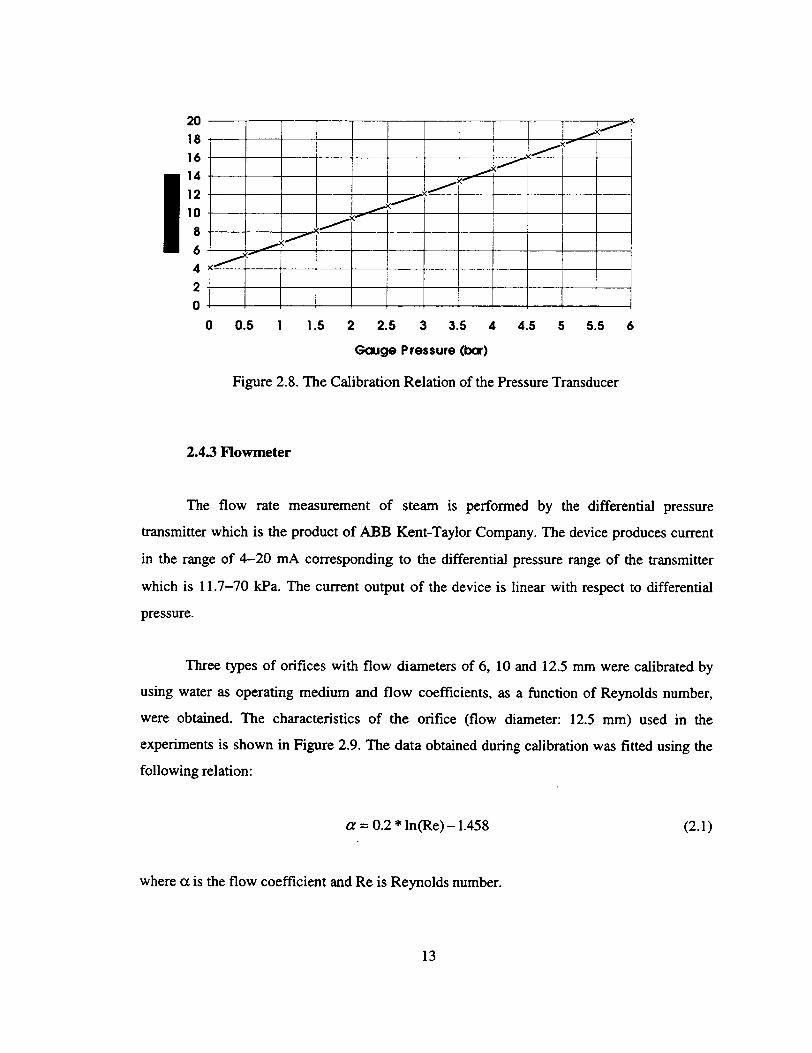
2) Pressure Transducer:
Manufacturer: Transinstruments Inc., England Type: Strain gauge Working Medium: Water, steam, gas Pressure Range: 0-6 bar (g) Output Signal: 4-20 mA (linear)
3) Flowmeter:
Manufacturer: ABB Kent-Taylor, Italy Type: Differential pressure transmitter Working Medium: Water, steam, gas dP Range: 11.7-70 kPa Output Signal: 4-20 mA (linear)
4) Data Acquisition System:
Manufacturer: Advantech Co., Ltd. Data Acquisition Card: PCL-812PG
Analog Input: 16 single-ended channels 12 bits resolution ±5V, ±2.5V, ±1.25V, ±0.625V, and ±0.3125V input range 0.0 15% of reading ±1 bit accuracy
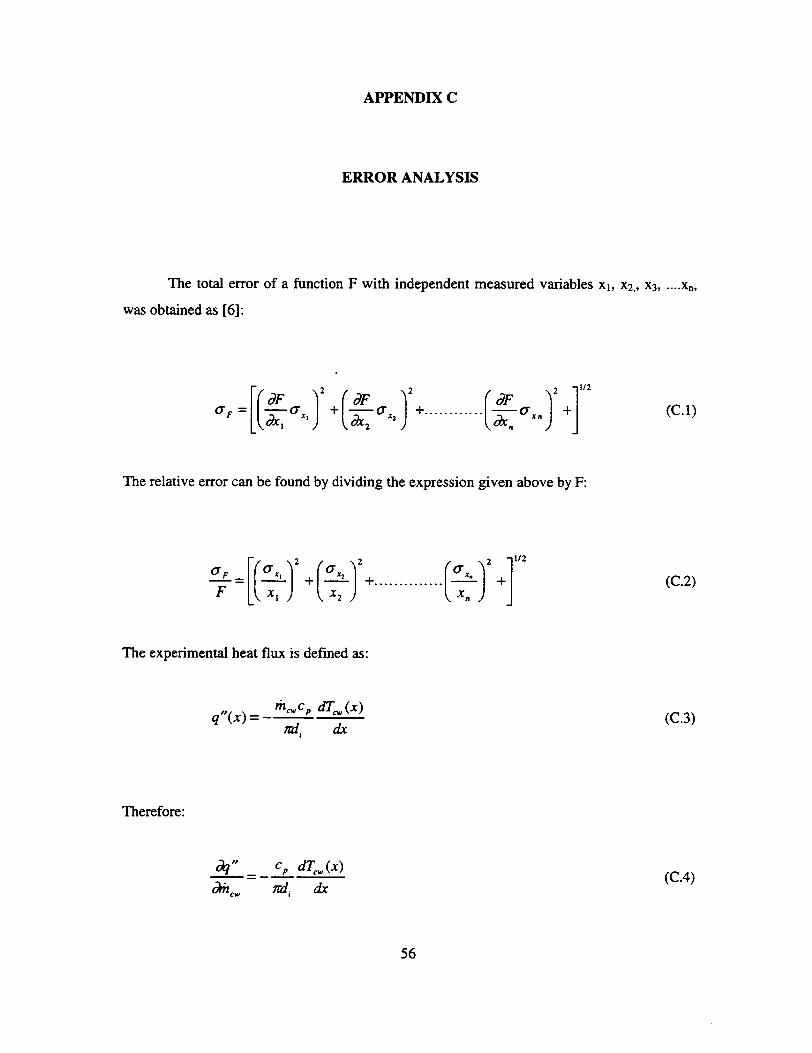
The total error of a function F with independent measured variables xi, X2,, X3 ... xn,
was obtained as [6]:
F < + • 2+ .............
The relative error can be found by dividing the expression given above by F:
UF ... 2 + ( 2+ ............... ( x.2 +11/2
The experimental heat flux is defined as:
) ,cc dT,.,(x)
-rai ax
Therefore:
q_"= cp dT,(x)
Acý Trdi dx
56
(C.1)
(C.2)
(C.3)
(C.4)
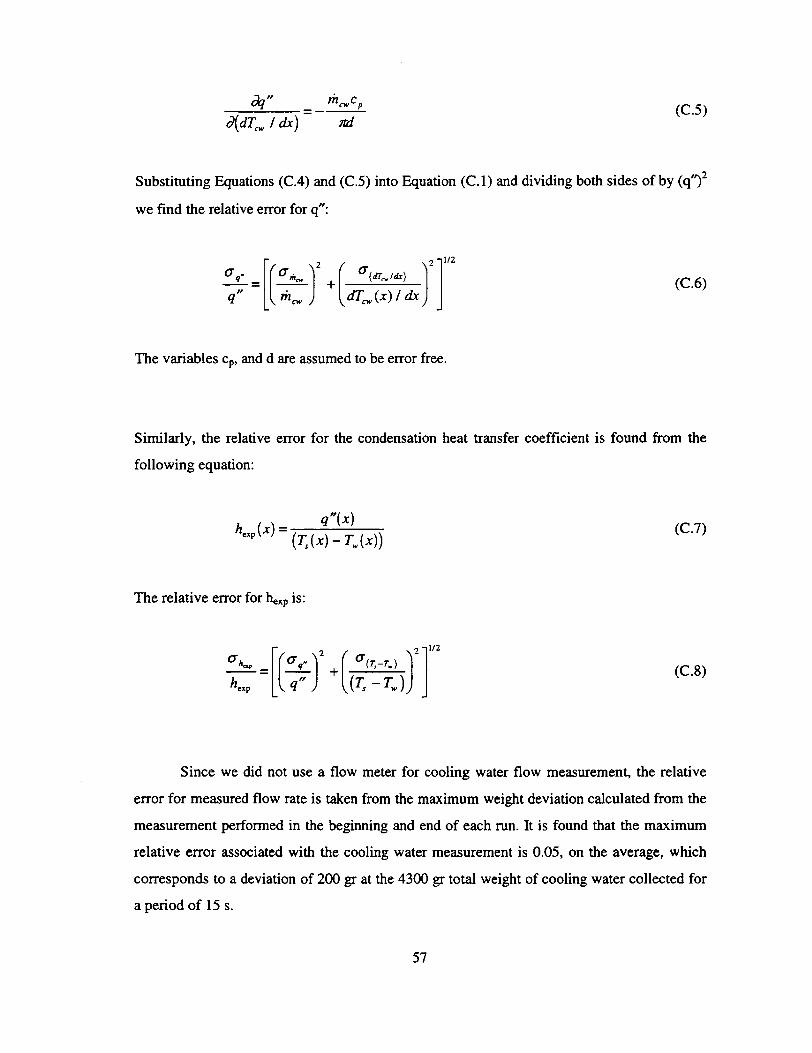
-dq" h, cnp (C.5) d(dTc. / dx) MC.
Substituting Equations (C.4) and (C.5) into Equation (C.1) and dividing both sides of by (q,) 2
we find the relative error for q":
__ =( _ 2dr) 2(C.6)
The variables cp, and d are assumed to be error free.
Similarly, the relative error for the condensation heat transfer coefficient is found from the
following equation:
hexp (W) q"(x) (C.7) (TI(x) - TW(x))
The relative error for hlp is:
____ F(O~ (7(T _____)
= ),-/ )2 (C.8)
Since we did not use a flow meter for cooling water flow measurement, the relative
error for measured flow rate is taken from the maximum weight deviation calculated from the
measurement performed in the beginning and end of each run. It is found that the maximum
relative error associated with the cooling water measurement is 0.05, on the average, which
corresponds to a deviation of 200 gr at the 4300 gr total weight of cooling water collected for
a period of 15 s.
57
The slope of the coolant water axial temperature profile, i.e. dTcw/dx, was determined
from an exponential fit of the measured coolant temperatures as the function of the
measurement distance, and for almost all the runs the R2 value for the fit of the data to the
exponential relation was greater than 0.98. This means that error associated to the curve fitting
is very small. However, it is difficult to predict the error associated with the temperature
gradient directly. Only an estimation was made by considering the effect of measured
temperature data with higher deviation than the general trend of the temperature distribution.
It was found that the effect of measured temperature data with high deviation yields an error
of ± 10 %. The percent error of the temperature gradient assumed for the UCB-4 data was
also ± 10 % [7].
For the prediction of the uncertainty associated with the heat transfer coefficient, the
standard deviation of the thermocouples must be known. The experimental data of isothermal
check of thermocouples were used for determining the standard deviation of thermocouples.
The experimental data, as given in Table 3.1, yields a maximum standard deviation of 0.762.
Since this is an experimental result, the calculated standard deviation includes the tolerances
given by the factory.
The aforementioned values of standard deviations and data needed for Equations (C.6)
and (C.8) are summarized as follows:
Ym --0.05 rn, (C.9)
(YTS = YTw = 0.762 (C. 10)
C(dr/dx) = 0.10 (dT,,/dx) (C.11)
(Ts-Tw) = 5 °C (C. 12)
o(Tg-Tw) = (O'Ts+O'Tw) 1 2 (C. 13)
Substituting values from Equations (C.9) to (C. 13) in Equations (C.6) and (C.8) we get:
58
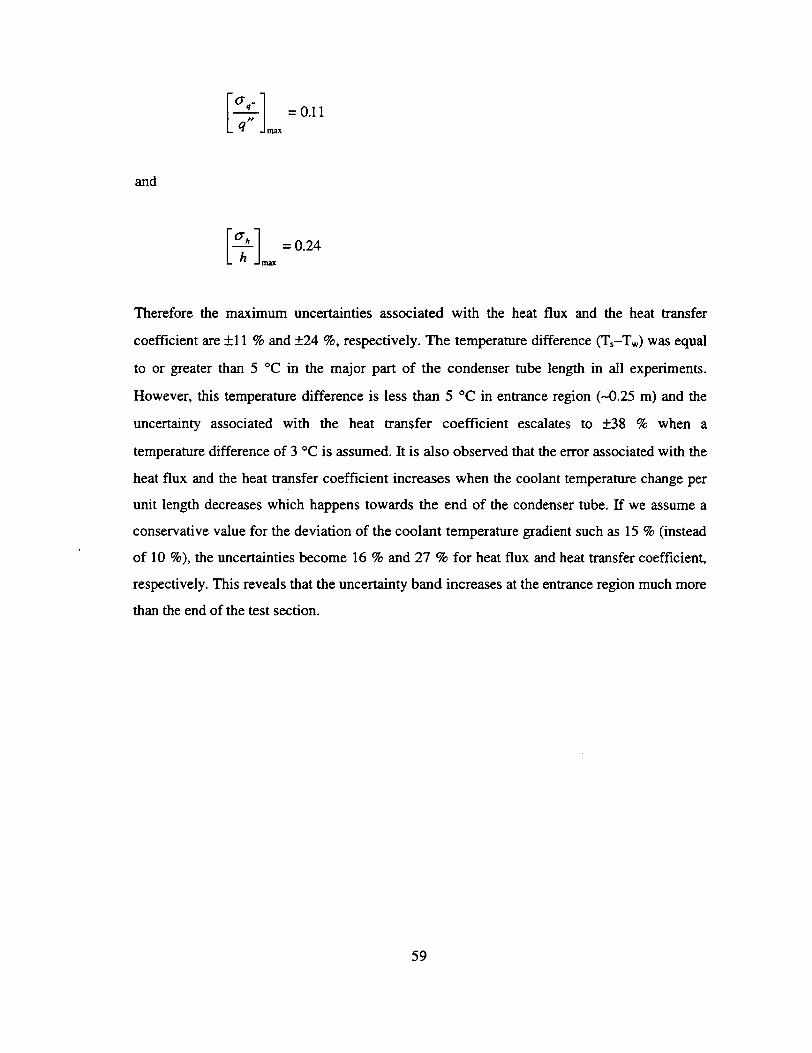
[6q-] 0.11
and
[hma 0.24
Therefore the maximum uncertainties associated with the heat flux and the heat transfer
coefficient are ±11 % and ±24 %, respectively. The temperature difference (T,-Tw) was equal
to or greater than 5 °C in the major part of the condenser tube length in all experiments.
However, this temperature difference is less than 5 'C in entrance region (-0.25 m) and the
uncertainty associated with the heat transfer coefficient escalates to ±38 % when a
temperature difference of 3 'C is assumed. It is also observed that the error associated with the
heat flux and the heat transfer coefficient increases when the coolant temperature change per
unit length decreases which happens towards the end of the condenser tube. If we assume a
conservative value for the deviation of the coolant temperature gradient such as 15 % (instead
of 10 %), the uncertainties become 16 % and 27 % for heat flux and heat transfer coefficient,
respectively. This reveals that the uncertainty band increases at the entrance region much more
than the end of the test section.
59
NRC FORM 336 U.S. NUCLEAR REGULATORY COMMISSION 1. REPORT NUMBER (2.-9) (Asned by NRC. Add VoL, Supp., Rev.. NRCM 1102. nd Addendum Numbe., It any.) 3201.3202 BIB OGRAPHC DATA SHEET
(See minsuconh an h reverse)
2. TITLE AND SUBTITLE NUREG/IA-0184
In-Tube Steam Condensation in the Presence of Air 3. DATE REPORT PUBLISHED
June 2000 4. FIN OR GRANT NUMBER
5. AUTHOR(S) 6. TYPE OF REPORT
A Tanrikut, 0. Yesin Technical
7. PERIOD COVERED Mn*si Dwie)
8. PERFORMING ORGANIZATION - NAME AND ADDRESS (YNRC, provide Division, Ofts or Region, U.S. Nudew Regutatay Cww=s=, and mailing addess, ffoonra
-rovide erwe nd rai/lg addmss.)
Turkish Atomic Energy Authority Eskisehir Yolu 06530 Ankara, Turkey
9. SPONSORING ORGANIZATION - NAME AND ADORESS (tf NRC, type 'Same &s aboved dconfclor, provide NRC Division, Offie or Region, U.S. Nucow Regultoy Cammsib aid medliug address.)
Division of Systems Analysis and Regulatory Effectiveness Office of Nuclear Regulatory Research U.S. Nuclear Regulatory Commission Washington, DC 20555-0001
10. SUPPLEMENTARY NOTES
11. ABSTRACT r" words ar les)
In this research work, in-tube condensation in the presence of air is investigated experimentally for different operating conditions, and inhibiting effect of air is analyzed by comparing the experimental data of air/steam mixture with the data of corresponding pure steam cases, with respect to temperature, heat flux, air masses fraction, and film Reynolds number. The test matrix covers the range of Pn=2-6 bars, Rev=45,000-94,000, and Xj+0% - 52%. The inhibiting effect of air manifests itself as a remarkable decrease in centerline temperature (10 oC - 50 oC), depending on inlet air mass fraction. However, the measured centerline temperature is suppressed compared to the predicted one, from the Gibbs-Dalton law, which indicated that the centerline temperature measurements are highly affected by inner wall thermal conditions, possibly due to narrow channel and high vapor Reynolds number.
12. KEY WORDSIDESCRIPTORS 1ist words orpiases &at wo assist remeennw in locating fth repor) 13. AVAILABAIlY STATEMENT