1 Paper for submission to the Board of Directors on 5 th June 2014 TITLE: Nurse Staffing AUTHOR: Denise McMahon Director of Nursing PRESENTER: Denise McMahon Director of Nursing CORPORATE OBJECTIVE: SGO1: Quality, Safety & Service Transformation Reputation - To become well known for the safety and quality of our services through a systematic approach to service transformation , research and innovation SGO2: Patient Experience - To provide the best possible patient experience SGO5: Staff Commitment - To create a high commitment culture from our staff with positive morale and a “can do” attitude SUMMARY OF KEY ISSUES: This paper has been prepared in response to the NHS England National Quality Board (NQB) document ‘How to ensure the right people, with the right skills, are in the right place at the right time’ and the document called ‘Hard Truths’ authored by Jane Cummings, Chief Nursing Officer for England and Mike Richards, Chief Hospital Inspector for the Care Quality Commission (CQC). PART 1 The first part is the first six monthly detailed review of staffing levels when two methods have been used: 1) An evidence based tool – Safer Nursing Care Tool (SNCT) and 2) An internal professional judgment process called Ward Review. Both methods are described in the paper and the results of each are provided and compared with a number of caveats. There are similarities in the results, but as the Ward Review takes into consideration the new national guideline of at least 1:8 Registered Nurse (RN)/patient ratio, the Board is asked to agree the funding of the calculated establishments from the Ward Review. The costs of these establishments can be seen to be more than the costs of the present establishments but less than present spending when factoring in bank and agency staff. PART 2 The second part of the paper contains the first monthly assessment (for April 2014) of the actual registered nurses and midwives available each day compared to the planned levels. The general wards are planned at 1:8 RN/patient and other national ratios apply to specialist areas such as intensive care, midwifery and paediatric areas. The Board is asked to note that it is required to consider the following papers: Every six months - the results of an evidenced based review of staffing Every month - the comparison of daily planned and actual staffing levels These have to be published on the Trust website (and NHS Choices) initially no later than end of June together with a monthly data submission of detailed planned and actual nursing hours by day and night for each ward. In the absence of a national template the Board is asked to agree to the format of the public document that will be available on the Trust website (and linked to NHS Choices). IMPLICATIONS OF PAPER: RISK Y Risk Score and Description: Nurse staffing levels are sub-optimal (20) Loss of experienced midwives (15) Risk Register: Y COMPLIANCE and/or CQC Y Details: 13: Staffing NHSLA N Details:
Transcript
1
Paper for submission to the Board of Directors on 5th June 2014
TITLE: Nurse Staffing
AUTHOR:
Denise McMahon Director of Nursing
PRESENTER: Denise McMahon Director of Nursing
CORPORATE OBJECTIVE: SGO1: Quality, Safety & Service Transformation Reputation - To become well known for the safety and quality of our services through a systematic approach to service transformation , research and innovation SGO2: Patient Experience - To provide the best possible patient experience SGO5: Staff Commitment - To create a high commitment culture from our staff with positive morale and a “can do” attitude
SUMMARY OF KEY ISSUES:
This paper has been prepared in response to the NHS England National Quality Board (NQB) document ‘How to ensure the right people, with the right skills, are in the right place at the right time’ and the document called ‘Hard Truths’ authored by Jane Cummings, Chief Nursing Officer for England and Mike Richards, Chief Hospital Inspector for the Care Quality Commission (CQC). PART 1 The first part is the first six monthly detailed review of staffing levels when two methods have been used: 1) An evidence based tool – Safer Nursing Care Tool (SNCT) and 2) An internal professional judgment process called Ward Review. Both methods are described in the paper and the results of each are provided and compared with a number of caveats. There are similarities in the results, but as the Ward Review takes into consideration the new national guideline of at least 1:8 Registered Nurse (RN)/patient ratio, the Board is asked to agree the funding of the calculated establishments from the Ward Review. The costs of these establishments can be seen to be more than the costs of the present establishments but less than present spending when factoring in bank and agency staff. PART 2 The second part of the paper contains the first monthly assessment (for April 2014) of the actual registered nurses and midwives available each day compared to the planned levels. The general wards are planned at 1:8 RN/patient and other national ratios apply to specialist areas such as intensive care, midwifery and paediatric areas. The Board is asked to note that it is required to consider the following papers:
Every six months - the results of an evidenced based review of staffing
Every month - the comparison of daily planned and actual staffing levels These have to be published on the Trust website (and NHS Choices) initially no later than end of June together with a monthly data submission of detailed planned and actual nursing hours by day and night for each ward. In the absence of a national template the Board is asked to agree to the format of the public document that will be available on the Trust website (and linked to NHS Choices).
IMPLICATIONS OF PAPER:
RISK Y Risk Score and Description: Nurse staffing levels are sub-optimal (20) Loss of experienced midwives (15)
Risk Register: Y
COMPLIANCE and/or
CQC Y Details: 13: Staffing
NHSLA N Details:
2
LEGAL REQUIREMENTS
Monitor Y Details: Compliance with the Risk Assessment Framework
Equality Assured
Y Details: Better Health Outcomes for all
Improved patients access and experience
Other N Details:
ACTION REQUIRED OF BOARD:
Decision Approval Discussion Other
RECOMMENDATIONS FOR THE BOARD: To approve the proposed funding from the Ward Review and agree the format for publication of on the Trust website.
1
The Dudley Group NHS Foundation Trust
PART 1 Nurse Staffing Review
Introduction
This paper provides an overview of the nurse staffing situation at the Trust. It follows the recommendations of the recent national publications ‘How to ensure the right people, with the right skills, are in the right place at the right time’ and ‘Hard Truths’ authored by Jane Cummings, Chief Nursing Office for England and Mike Richards, Chief Hospital Inspector at the Care Quality Commission. It contains data from a recent exercise using the Safer Nursing Care Tool (SNCT) for all wards in the Trust for which the tool is applicable and a comparative internal extensive Ward Review process undertaken on a wider range of areas that include EAU and the Emergency Department. It also provides information on the financial implications that arise from these exercises for which the Board is asked to make a decision on further funding. In Part 2, the paper provides information for the month of April on present staffing levels at the Trust in relation to recommended/planned registered staff/patient ratios.
A. Safer Nursing Care Tool (SNCT)
1. Introduction
The AUKUH (Association of UK University Hospitals) staffing tool was formally launched at the CNO Summit on 1 November 2007. Further development work was then carried out by the NHS Institute and later, The Shelford Group. Following an extensive review of the tool, its definitions and multipliers, commissioned by the Shelford Group's Chief Nurses' Sub-Group, it was relaunched as The Safer Nursing Care Tool in mid 2013. It can be seen there have been a number of organisations involved in this tool and a number of changes to it.
2. The Trust and the Safer Nursing Care Tool Initially, following the Keogh review in March 2013 the Trust was asked to implement this tool by Ruth May, Regional Chief Nurse NHS England (Midlands & East), who led the review at the Trust. The Trust undertook data collection in July 2013. This includes staff on all wards assessing every patient’s dependency (and categorising every patient into 1 of 5 care groups) over a twenty day period (Monday to Friday over four weeks). We were then informed not to input the data into the existing spreadsheets as they should not be used and a new spreadsheet would soon be available. In fact, that new spreadsheet only became available in April 2014 and so following many conversations and emails with hospitals and Ruth May herself we decided to use the old spreadsheet in August 2013. In the meantime, the tool was re-launched with new descriptions of the five patient categories and the multipliers
2
associated with each category had changed. In effect, due to data reliability reasons, we have been unable to compare this first tranche of data. The system is such that the twenty day data collection should be undertaken every six months. This was done again in February 2014 with the Trust still awaiting the new spreadsheet. As indicated, this arrived in April, hence this delayed report, which contains the February 2014 data. It is important that the reader is aware of the details of the tool itself and its associated calculations. The tool is described as a ‘scientific’ or ‘objective’ method of calculating staffing levels as opposed to existing ‘professional judgement’ methods. However, the tool itself depends on professional judgement in a number of ways. As stated, it consists of all patients being assessed as one of five categories (see Appendix 2). As the descriptions of each category are open to interpretation, it can be seen that in fact it contains a professional judgement of which group every patient falls into. There needs to be consistency of assessment. At a recent webinar on the tool this was seen to be one of the key issues with the tool. At the Trust, we set up a spot check system of the assessments. It can be also seen in Appendix 1 that as part of the daily collection of data the ward staff are asked to record the numbers of admissions, discharges, transfers in/out, ward attenders, deaths and internal/external escorts they have as these issues will affect the workload on any day. However, this data is not fed into the calculation. The paperwork associated with the tool says: ‘One (ward) may have few admissions, discharges or ward attenders whereas another may have many. Professional judgement is required to ensure that establishments are adjusted appropriately under these circumstances’. The SNCT data in this report have not been adjusted for these issues.
3. Specialties the tool covers It is worth noting that the originators of the tool indicate that this is an ‘adult, generic’ tool. It stipulates that the tool is not validated for use in ‘Acute/Medical Unit/Medical admission wards’. It also says the tool is being developed for use in these areas. In addition, it states that the tool is being further developed to better reflect the complexities of caring for older people in acute care wards. It stated in July 2013 that this latter version ‘is almost ready for use’, although this has not been published to date. It also states a tool is being developed for Accident and Emergency Departments.
4. Second Element of the Tool This report so far has just described what is called the first element of the tool, determining the level of acuity/dependency of all patients and calculating the nurse staffing required per ward based on the actual needs of those patients. The second element of the tool describes Nurse Sensitive Indicators (NSIs) such as infection rates, complaints, pressure ulcers and falls. It is recommended that these should be monitored to ensure that the staffing levels determined in Element 1 are enabling the delivery of expected patient outcomes.
3
At present this report does not include this element with the Board receiving separate reports on quality data such as complaints, nursing care indicators, incidents, safety thermometer results, healthcare associated infections and patient and staff experience data.
5. Overview of Data
The tool requires both fixed data and the Trust data that contribute to the calculation. With regards to the Trust data, it has been decided to use an average 23% time out/headroom for annual leave etc (only one value for all staff can be used and it can be seen the tool suppliers suggest between 22-25%) while the accompanying Ward Review (see Section B below) data uses 23.2% for permanent RN staff and 22.46% for permanent unqualified staff. In addition, within the SNCT it has been decided to use the same RN to unqualified split throughout (60:40 split RN to unqualified staff) unlike the Ward Review, which has used differing figures for each ward. The SNCT default 68:32 has not been used. It also needs to be pointed out that the SNCT calculation does not take into consideration the new national at least 1:8 RN/patient ratio directive while this forms the basis of the RN calculations in the Ward Review. This therefore means that when comparing the two calculations (SNCT/Ward Review) only the total WTE should be looked at. It can be seen that the spreadsheet also gives ‘benchmarks’ of the average percentage of each type of patient per speciality from a number of wards that were involved in the study that the tool originated from.
B. Ward Review
Matrons, the Director of Nursing and her Deputy discussed and debated the nurse requirements of each area, ensuring consistency with the recent national guideline of the at least 1:8 registered nurse to patient ratio. This method therefore consists of experienced nurses considering a range of issues associated with a ward, from its layout, the range of associated support staff such as ward clerks etc, the types of patient and their dependencies, skill mix within the team, the specialties of medical staff using the ward and such issues as the throughput and turnover of patients, any associated ward attenders etc. The system looked at the staffing and grade mix needs for each of the seven days of the week both for the day and night shifts for both RN and unqualified staff. The resultant figures went through a number of iterations, ensuring that there was consistency between similar wards etc. With expert help from the Finance Department the result has been a large detailed spreadsheet of data for each ward from which an establishment and associated cost has been calculated. This whole process was validated by Mr S Davies, Interim Turnaround Director.
C. Data
4
Section 6 below contains the summaries of key data from both the SNCT and the Ward Review for each ward. In summary, with regards to the comparison between the ward review and SNCT figures, this needs to be interpreted with caution for the following reasons:
For some of the wards there have been changes to the bed numbers and specialities since the study in February 2014.
It also needs to be remembered that the SNCT figures below do not take into account the workload associated with the numbers of admissions, discharges, transfers, escorts or deaths that occur on a ward and all of these activities take nursing time. Each ward will be different in this respect with some wards having a stable population of patients while others having possibly more than one person in a bed space during a twenty four hour period.
In addition, the SNCT tool is based purely on the patient types and numbers in the 20 day study period.
There are different percentages added in for relief/time-out/headroom
Most importantly, the 1:8 RN/patient ratio is not built into the SNCT.
6. SNCT and Comparative FTE Data Ward A1
Patient Level % of patients Benchmark % Med
0 60 40
1a 5 10
1b 34 48
2 1 1
3 0 2
Beds at Present 14 Ward Review Patient/Staff Ratio M-F
Ward Review Patient/Staff Ratio SS
Av Patients (in 20 day period) 18
Required Staff SNCT Ward Review
RNs required/ratio 13.7 12.27 D 1:7 N 1:7
D 1:7 N 1:7
HCAs required/ratio 9.2 8.22 D 1:7 N 1:14
D 1:7 N 1:14
Total FTE required 22.9 20.49
Note: During the study period there were extra beds and EMU beds open due to a peak in demand but the Ward Review does not take these into consideration. As there are 14 beds on the ward, decreasing the RN staff by one person would reduce the 1:7 ratio to 1:14.
5
Ward A2
Patient Level % of patients Benchmark % Med Eld
0 17 32
1a 0 2
1b 83 66
2 0 0
3 0 0
Beds at Present 42 Ward Review Patient/Staff Ratio M-F
Ward Review Patient/Staff Ratio SS
Av Patients (in 20 day period) 41.8
Required Staff SNCT Ward Review
RNs required/ratio 40.2 34.35 D 1:7 N 1:7
D 1:7 N 1:7
HCAs required/ratio 26.8 32.88 D 1:7 N 1:7
D 1:7 N 1:7
Total FTE required 67.0 67.23
Note: As there are 42 beds on the ward, decreasing the RN staff by one person would reduce the 1:7 ratio to 1:8.4. Ward A3
Patient Level % of patients Benchmark % Rehab
0 19 38
1a 0 7
1b 80 52
2 0 4
3 0 0
Beds at Present 28 Ward Review Patient/Staff Ratio M-F
Ward Review Patient/Staff Ratio SS
Av Patients (in 20 day period) 27.9
Required Staff SNCT Ward Review
RNs required/ratio 26.6 18.58 D 1:7 N 1:9.3
D 1:7 N 1:9.3
HCAs required/ratio 17.7 21.92 D 1:7 N 1:7
D 1:7 N 1:7
Total FTE required 44.4 40.50
Note: As there are 28 beds on the ward, decreasing the RN staff during the day by one person would reduce the 1:7 ratio to 1:9.3.
6
Ward A4
Patient Level % of patients Benchmark % Stroke
0 35 21
1a 14 7
1b 47 67
2 4 6
3 0 0
Beds at Present 12 Ward Review Patient/Staff Ratio M-F
Ward Review Patient/Staff Ratio SS
Av Patients (in 20 day period) 11.2
Required Staff SNCT Ward Review
RNs required/ratio 9.7 10.3 D 1:6 N 1:6
D 1:6 N 1:6
HCAs required/ratio 6.4 5.48 D 1:12 N 1:12
D 1:12 N 1:12
Total FTE required 16.1 15.78
Note: As there are 12 beds on the ward, decreasing the RN staff by one person would reduce the 1:6 ratio to 1:12.
Ward B1
Patient Level % of patients Benchmark % Surgery
0 81 62
1a 18 15
1b 0 22
2 0 1
3 0 0
Beds at Present 26 Ward Review Patient/Staff Ratio M-F
Ward Review Patient/Staff Ratio SS
Av Patients (in 20 day period) 23.9
Required Staff SNCT Ward Review
RNs required/ratio 15.4 18.58 D 1:6.5 N 1:8.7
D 1:6.5 N 1:8.7
HCAs required/ratio 10.3 10.96 D 1:13 N 1:13
D 1:13 N 1:13
Total FTE required 25.7 29.54
Note: As there are 26 beds on the ward, decreasing the RN staff by one person in the day would reduce the 1:6.5 ratio to 1:8.7.
7
Ward B2 Trauma
Patient Level % of patients Benchmark % Trauma
0 65 34
1a 16 5
1b 19 57
2 0 2
3 0 3
Beds at Present 24 Ward Review Patient/Staff Ratio M-F
Ward Review Patient/Staff Ratio SS
Av Patients (in 20 day period) 23.2
Required Staff SNCT Ward Review
RNs required/ratio 16.8 17.79 D 1:8 N 1:8
D 1:8 N 1:8
HCAs required/ratio 11.2 13.7 D 1:8 N 1:12
D 1:8 N 1:12
Total FTE required 27.9 31.49
Ward B2 Hip
Patient Level % of patients Benchmark % Ortho
0 62 42
1a 19 22
1b 19 34
2 0 1
3 0 0
Beds at Present 30 Ward Review Patient/Staff Ratio M-F
Ward Review Patient/Staff Ratio SS
Av Patients (in 20 day period) 28.4
Required Staff SNCT Ward Review
RNs required/ratio 20.6 18.58 D 1:7.5 N 1:7.5
D 1:7.5 N 1:7.5
HCAs required/ratio 13.8 19.18 D 1:10 N 1:10
D 1:10 N 1:10
Total FTE required 34.4 37.76
Note: As there are 30 beds on the ward, decreasing the RN staff by one person would reduce the 1:7.5 ratio to 1:10.
8
Ward B3
Patient Level % of patients Benchmark % Surgery
0 54 62
1a 12 15
1b 34 22
2 0 1
3 0 0
Beds at Present 38+4 HDU Ward Review Patient/Staff Ratio M-F
Ward Review Patient/Staff Ratio SS
Av Patients (in 20 day period) 25.3
Required Staff SNCT Ward Review
RNs required/ratio 19.6 (27.6) 26.07 D 1:7.6 N 1:9.5
D 1:7.6 N 1:9.5
HCAs required/ratio 13.1 (18.4) 21.92 D 1:9.5 N 1:9.5
D 1:9.5 N 1:9.5
Total FTE required 32.7 (46.0) 47.99
Note: For the SCNT survey, B3 had 28 beds. SAU (10 beds) was treated separately during the study (see below) and so the SAU results have now been added (figures in brackets) to the 28 bed results for a comparison with the new 38 bed ward Note: As there are now 42 (38 plus 4 HDU) beds on the ward, decreasing the RN staff by one person during the day would reduce the 1:76 ratio to 1:9.5. B3 Surgical Assessment Unit (SAU) (Treated separately to B3 in the SNCT study)
Patient Level % of patients Benchmark % Surgery
0 5 62
1a 94 15
1b 1 22
2 0 1
3 0 0
Beds at Present 10
Av Patients (in 20 day period) 9.7
Required Staff SNCT Ward Review
RNs required 8.0 -
HCAs required 5.3 -
Total FTE required 13.4 -
Note: B3 SAU is now on B5 ward
9
Ward B4
Patient Level % of patients Benchmark % Surgery
0 81 62
1a 5 15
1b 14 22
2 1 1
3 0 0
Beds at Present 46 Ward Review Patient/Staff Ratio M-F
Ward Review Patient/Staff Ratio SS
Av Patients (in 20 day period) 45.1
Required Staff SNCT Ward Review
RNs required 30.4 32.38 D 1:7.7 N 1:7.7
D 1:7.7 N 1:7.7
HCAs required 20.3 27.40 D 1:6.6 N 1:11.5
D 1:6.6 N 1:11.5
Total FTE required 50.7 59.78
Note: As there are 46 beds on the ward, decreasing the RN staff by one person would reduce the 1:7 ratio to 1:9.2. Ward B5
Patient Level % of patients Benchmark % Surgery
0 87 62
1a 9 15
1b 5 22
2 0 1
3 0 0
Beds at Present 30 + 4GAU Ward Review Patient/Staff Ratio M-F
Ward Review Patient/Staff Ratio SS
Av Patients (in 20 day period) 21.9
Required Staff SNCT Ward Review
RNs required/ratio 14.0 (23.2) 24.1 D 1:7.5 N 1:7.5
D 1:7.5 N 1:7.5
HCAs required/ratio 9.3 (15.4) 16.44 D 1:8 N 1:16
D 1:8 N 1:16
Total FTE required 23.3 (38.6) 40.54
Note: There were 22 beds on B5 for the SNCT study but now there are 20 beds + SAU (10 beds) and Gynaecology Assessment Unit (GAU) (4 beds). The figures in brackets include the SNCT figures for SAU and GAU to assist with any comparison. Note: As there are 30 beds on the ward, decreasing the RN staff by one person would reduce the 1:7.5 ratio to 1:10.
10
B5 Gynaecology Assessment Unit (GAU) (Treated separately to B5 in the SNCT study)
Patient Level % of patients Benchmark %
0 100
1a 0
1b 0
2 0
3 0
Beds at Present 4
Av Patients (in 20 day period) 2.1
Required Staff SNCT Ward Review
RNs required 1.2 -
HCAs required 0.8 -
Total FTE required 2.0 -
Ward B6
Patient Level % of patients Benchmark % ENT
0 88 73
1a 2 12
1b 10 7
2 0 3
3 0 6
Beds at Present 17 Ward Review Patient/Staff Ratio M-F
Ward Review Patient/Staff Ratio SS
Av Patients (in 20 day period) 28.2
Required Staff SNCT Ward Review
RNs required/ratio 18.3 13.06 D 1:5.7 N 1:8.5
D 1:5.7 N 1:8.5
HCAs required/ratio 12.2 8.22 D 1:8.5 N 1:17
D 1:8.5 N 1:17
Total FTE required 30.4 21.28
Note: B6 had 29 beds (lost 12 beds). Note: As there are 17 beds on the ward, decreasing the RN staff by one person during the day would reduce the 1:5.7 ratio to 1:8.5.
11
Ward C1
Patient Level % of patients Benchmark % Med
0 39 40
1a 14 10
1b 47 48
2 0 1
3 0 2
Beds at Present 48 Ward Review Patient/Staff Ratio M-F
Ward Review Patient/Staff Ratio SS
Av Patients (in 20 day period) 47.9
Required Staff SNCT Ward Review
RNs required/ratio 40.3 31.59 D 1:8 N 1:9.6
D 1:8 N 1:9.6
HCAs required/ratio 26.9 32.88 D 1:6.9 N 1:9.6
D 1:6.9 N 1:9.6
Total FTE required 67.2 64.47
Note: As there are 48 beds on the ward, decreasing the RN staff by one person would reduce the 1:8 ratio to 1:9.6. Ward C3 (now C3A and C3B)
Patient Level % of patients
Benchmark % Med Eld
0 12 32
1a 7 2
1b 81 66
2 0 0
3 0 0 C3A C3B
Beds at Present 52 (C3A=24, C3B=28) Ward Review Patient/ Staff Ratio M-F
Note: Since the SNCT study this ward has now been divided into C3A (24 beds) and C3B (28 beds). Note: As there are 28 beds on ward C3B, decreasing the RN staff by one person during the day would reduce the 1:7 ratio to 1:9.3.
12
Ward C4
Patient Level % of patients Benchmark % Onc/Haem
0 79 38
1a 3 26
1b 17 35
2 0 2
3 0 0
Beds at Present 16+6 Isolation Ward Review Patient/Staff Ratio M-F
Ward Review Patient/Staff Ratio SS
Av Patients (in 20 day period) 22.1
Required Staff SNCT Ward Review
RNs required/ratio 15.1 12.27 D 1:5.3 N 1:8
D 1:8 N 1:8
HCAs required/ratio 10.1 10.96 D 1:8 N 1:8
D 1:8 N 1:8
Total FTE required 25.1 23.23
Note: The Ward Review ratios are based on the necessary extra funding resulting from the external JACIE assessment (Joint Accreditation Committee – I(ST)(International Society of Cellular Therapy) and E(BMT) (European Society of Blood and Marrow Transplantation). Ward C5
Patient Level % of patients Benchmark % Med
0 53 40
1a 12 10
1b 27 48
2 8 1
3 0 2
Beds at Present 48 Ward Review Patient/Staff Ratio M-F
Ward Review Patient/Staff Ratio SS
Av Patients (in 20 day period) 47.7
Required Staff SNCT Ward Review
RNs required/ratio 37.9 31.59 D 1:8 N 1:9.6
D 1:8 N 1:9.6
HCAs required/ratio 25.3 32.88 D 1:6.9 N 1:9.6
D 1:6.9 N 1:9.6
Total FTE required 63.1 64.47
13
Ward C6
Patient Level % of patients Benchmark % Surgery
0 89 62
1a 4 15
1b 7 22
2 0 1
3 0 0
Beds at Present 20 Ward Review Patient/Staff Ratio M-F
Ward Review Patient/Staff Ratio SS
Av Patients (in 20 day period) 19.1
Required Staff SNCT Ward Review
RNs required/ratio 12.2 15.82 D 1:6.7 N 1:6.7
D 1:6.7 N 1:6.7
HCAs required/ratio 8.1 10.96 D 1:10 N 1:10
D 1:10 N 1:10
Total FTE required 20.3 26.78
Note: As there are 20 beds on the ward, decreasing the RN staff by one person would reduce the 1:6.7 ratio to 1:10. Ward C7
Patient Level % of patients Benchmark % Med
0 68 40
1a 2 10
1b 30 48
2 0 1
3 0 2
Beds at Present 36 Ward Review Patient/Staff Ratio M-F
Ward Review Patient/Staff Ratio SS
Av Patients (in 20 day period) 35.7
Required Staff SNCT Ward Review
RNs required/ratio 26.2 26.86 D 1:7.2 N 1:7.2
D 1:7.2 N 1:7.2
HCAs required/ratio 17.5 21.92 D 1:7.2 N 1:12
D 1:7.2 N 1:12
Total FTE required 43.7 48.78
Note: As there are 36 beds on the ward, decreasing the RN staff by one person would reduce the 1:7.2 ratio to 1:9.
14
Ward C8 Acute Medical Unit
Patient Level % of patients Benchmark % Med
0 69 40
1a 2 10
1b 29 48
2 0 1
3 0 2
Beds at Present 36 Ward Review Patient/Staff Ratio M-F
Ward Review Patient/Staff Ratio SS
Av Patients (in 20 day period) 40.1
Required Staff SNCT Ward Review
RNs required/ratio 29.3 34.35 D 1:5.14 N 1:6
D 1:6 N 1:6
HCAs required/ratio 19.5 27.6 D 1:7.2 N 1:7.2
D 1:7.2 N 1:7.2
Total FTE required 48.8 61.95
Note: C8 is now an Acute Medical Unit and works as an extension to the Emergency and EAU Departments, having to assess and discharge patients quickly, hence ratios better than 1:8. The SNCT is not designed for AMU.
7. Conclusion
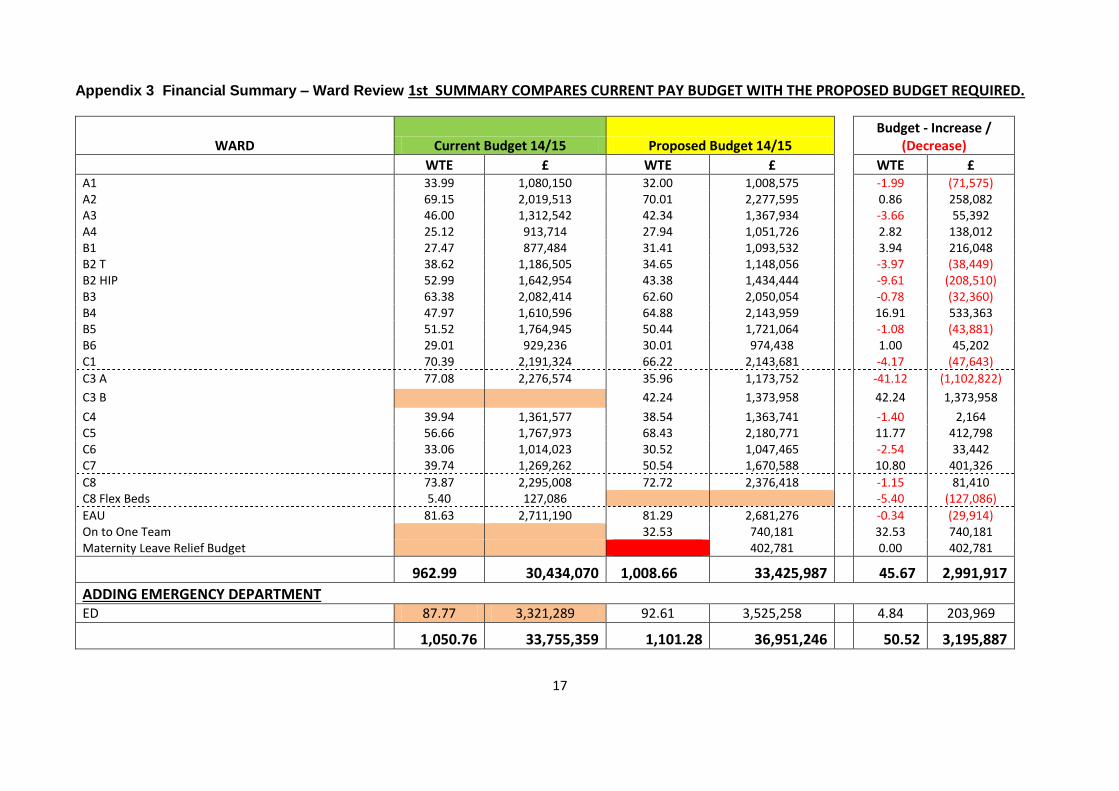
Due to similarities in the results, the difficulties in making direct comparisons between the two tools and because the Ward Review takes into consideration the required 1:8 RN/patient ratio the Directors are asked to agree the results of the Ward Review and its associated budget and provide the funding for the resultant establishments. It can be seen in Appendix 3 (Financial Summary – Ward Review), which takes into consideration maternity leave, that the difference between the current pay budget and the proposed pay budget is £2,991,917. Also taking into consideration a similar exercise as the Ward Review on the Emergency Department the extra funding requirement is £3,195,887.
15
Appendix 1 Example SNCT Data Collection Tool
16
Appendix 2 SNCT Patient Categories
3
17
Appendix 3 Financial Summary – Ward Review 1st SUMMARY COMPARES CURRENT PAY BUDGET WITH THE PROPOSED BUDGET REQUIRED.
1. Introduction In response to the final report of the Mid Staffordshire NHS Foundation Trust Public Inquiry (Francis Report) published in February 2013 and the local Keogh review in March 2013, significant work was undertaken to assess nurse staffing levels across inpatient areas.
2. Data Collection From January 2014 wards have displayed and recorded daily, nurse staffing levels; in March 2014, the hospital introduced ‘Huddle Boards’ and this information is included in this display. In addition Lead Nurses record the daily Registered Nurse (RN) to patient ratio and this information is provided in a report to the Nursing Director. Information relating to the shortfalls in planned staffing levels is provided to the Trust Board. The ratio used for main ward areas is 1:8 It is important to note that the ratios are not straight forward in the following departments: Critical Care Patients in this area require either Intensive Care – level 1 care, 6 beds or High Dependency care - level 2 care, 8 beds. The ratios for these different types of care are different. The assessment has been based on the provision of 1:1 care Neonatal Unit Babies in this area require Intensive care – level 1 care 3 cots, High Dependency Care – level 2 care, 2 cots or Special Care – level 3 care 14 cots plus 3 transitional care beds. The assessment has been based on the provision of 1:2 care Children’s Ward Children in this area require a range of different ratios accommodating Direct Supervision – 1:1, High Dependency care -1:2, under 2years of age – 1:3, other paediatrics – 1:4. There are no designated bed numbers for the types of care The assessment has been based on 1:4 care Maternity The maternity unit undertook the ‘Birthrate plus’ assessment that identified that the birth to midwife ration should be 1:33.8. Birth to midwife ratios are assessed against this figure
20
THE DUDLEY GROUP NHS FOUNDATION TRUST
Planned and actual Nurse/Midwifery staffing ratios by ward each day
This staffing grid does not take into account the 241 specialist nurses that are ward based and provide a direct care to patients across the Trust. This information only includes ward nurses. Planned ratio achieved or exceeded × Planned ratio not achieved. When this occurs this is escalated to the matron and extra support staff are sought from the Trust’s internal staff bank and in extreme situations staff are moved from a ward with less dependent patients to ensure safe care at all times. * Critical Care has 6 ITU beds and 8 HDU beds ** Neonatal Unit has 3 ITU cots, 2 HDU cots and 18 Special care cots *** Children’s ward accommodates children needing direct supervision care, HDU care 2 beds, under 2 years of age care and general paediatric care. There are no designated beds for these categories, other than HDU and the beds are utilised for whatever category of patient requires care. Midwifery staffing levels are assessed as the midwife: birth ratio. For the month of April this was 1:32 which was compliant with the ‘Birthrate +’ staffing assessment