June 19, 2014 1 Nursing Practice In Rural and Remote Nova Scotia: An Analysis of CIHI’s Nursing Database www.ruralnursing.unbc.ca Highlights In the period between 2003 and 2010, the regulated nursing workforce in Nova Scotia grew by 11.0%, reaching a total of 12,809 regulated nurses. The greatest increase in the regulated nursing workforce during this time was in NPs (360.9%). In 2010, 28.5% of the regulated nursing workforce in Nova Scotia was located in rural areas of the province where 34.9% of the population lived. In urban areas, the nurse-to-population ratio increased for RNs and LPNs. In rural areas it held steady for RNs, but increased for LPNs. Fewer rural than urban RNs worked full-time. In 2010, rural LPNs had the highest proportion holding casual positions. The numbers of RNs in rural Nova Scotia achieving baccalaureate degrees increased from 2003 to 2010. The number of rural RNs achieving Master’s degrees also increased during this time. However, these proportions remained higher in urban than in rural Nova Scotia. In 2003 and 2010, the proportion of rural nurses working in primary healthcare settings was 17%. The greatest increase between 2003 and 2010 was in rural NPs (from 0% to 77%). Although the majority of nurses educated in Nova Scotia stay in Nova Scotia, in 2010, 23% of RNs, 10% of LPNs and 35% of NPs received their initial education elsewhere. Introduction People who live in rural and remote parts of Canada (including the North) tend to have more health challenges than people living in urban areas. Rural and remote communities also experience limited numbers and chronic shortages of health care workers, including nurses. In order to keep improving health services and support nurses in rural and remote communities, planners and policy makers need up-to-date information. Nursing Practice in Rural and Remote Canada II provides some of that information. Nursing Practice in Rural and Remote Canada II is a study conducted in partnership with planners and policy makers who will make sure that the findings can be used to improve nursing services and access to care in rural and remote Canada. A key activity of the Nursing Practice in Rural and Remote Canada II study was the analysis of the Canadian Institute for Health Information's (CIHI) Nursing Database (NDB). This analysis was undertaken in order to identify key characteristics of the regulated nursing workforce in rural and remote Canada, as well as changes in the workforce over the last decade. Data for the years 2003 and 2010 were analyzed. Data for registered nurses (RNs), nurse practitioners (NPs), and licensed practical nurses
Transcript
June 19, 2014 1
Nursing Practice In Rural and Remote Nova Scotia:
An Analysis of CIHI’s Nursing Database
www.ruralnursing.unbc.ca
Highlights
In the period between 2003 and 2010, the regulated nursing workforce in Nova Scotia grew
by 11.0%, reaching a total of 12,809 regulated nurses. The greatest increase in the regulated
nursing workforce during this time was in NPs (360.9%).
In 2010, 28.5% of the regulated nursing workforce in Nova Scotia was located in rural areas
of the province where 34.9% of the population lived.
In urban areas, the nurse-to-population ratio increased for RNs and LPNs. In rural areas it
held steady for RNs, but increased for LPNs.
Fewer rural than urban RNs worked full-time. In 2010, rural LPNs had the highest proportion
holding casual positions.
The numbers of RNs in rural Nova Scotia achieving baccalaureate degrees increased from
2003 to 2010. The number of rural RNs achieving Master’s degrees also increased during
this time. However, these proportions remained higher in urban than in rural Nova Scotia.
In 2003 and 2010, the proportion of rural nurses working in primary healthcare settings was
17%. The greatest increase between 2003 and 2010 was in rural NPs (from 0% to 77%).
Although the majority of nurses educated in Nova Scotia stay in Nova Scotia, in 2010, 23% of
RNs, 10% of LPNs and 35% of NPs received their initial education elsewhere.
Introduction
People who live in rural and remote parts of Canada (including the North) tend to have more
health challenges than people living in urban areas. Rural and remote communities also
experience limited numbers and chronic shortages of health care workers, including nurses.
In order to keep improving health services and support nurses in rural and remote communities,
planners and policy makers need up-to-date information. Nursing Practice in Rural and Remote
Canada II provides some of that information.
Nursing Practice in Rural and Remote Canada II is a study conducted in partnership with
planners and policy makers who will make sure that the findings can be used to improve nursing
services and access to care in rural and remote Canada.
A key activity of the Nursing Practice in Rural and Remote Canada II study was the analysis of
the Canadian Institute for Health Information's (CIHI) Nursing Database (NDB). This analysis
was undertaken in order to identify key characteristics of the regulated nursing workforce in rural
and remote Canada, as well as changes in the workforce over the last decade.
Data for the years 2003 and 2010 were analyzed.
Data for registered nurses (RNs), nurse practitioners (NPs), and licensed practical nurses
June 19, 2014 2
(LPNs) were included.
This document reports key findings from the NDB analysis for Nova Scotia (NS). It provides an
overview of the regulated nursing workforce in Nova Scotia, with a special focus on rural and
remote locations.
Definition of Rural
We use the Statistics Canada definition of Rural and Small Town Canada (du Plessis et al.,
2001, p. 6). Rural refers to communities with a core population of less than 10,000 people, where
less than 50% of the population commutes to larger urban centres for work. This Statistics
Canada definition of rural includes northern communities, as well as remote areas with little or no
metropolitan influence as measured, in a labour market context, by the size of commuting flows
to any larger urban centre.
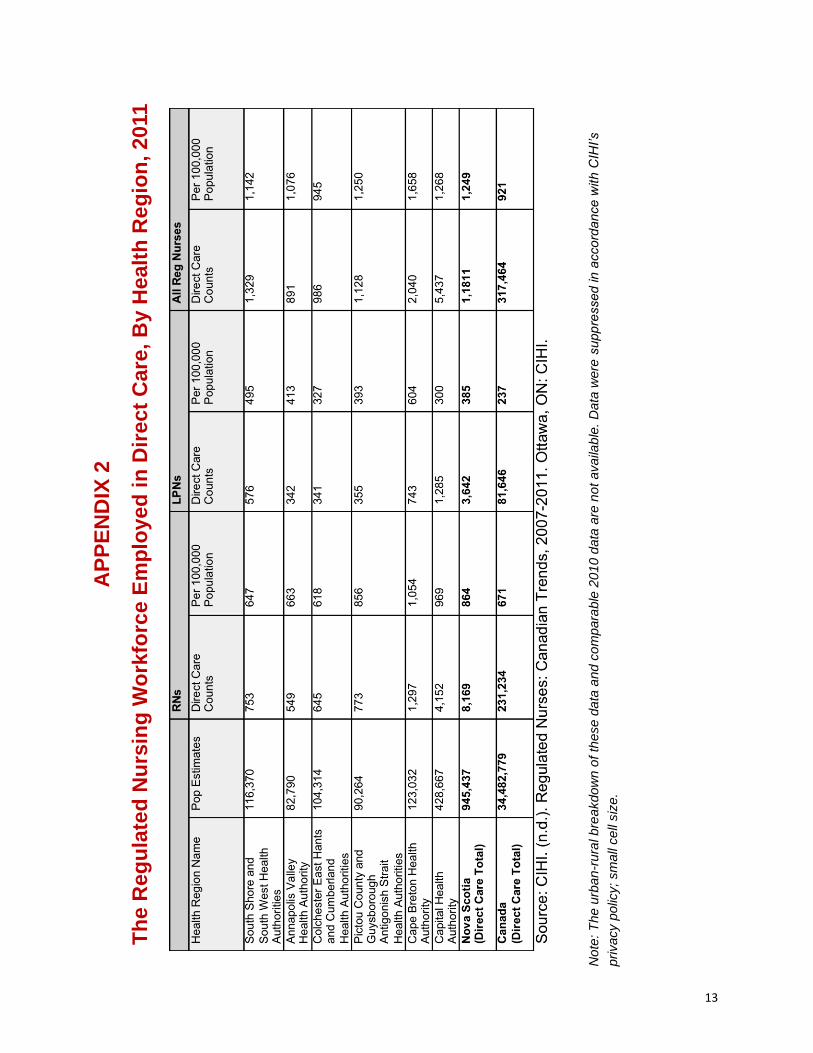
According to the 2011 Census, Nova Scotia had a population of 921,732. As of 2011, the rural
population was 321,727, which accounted for 34.9% of the total and represented a decrease of
1.7% since 2006. Table 1 lists population by health region.
Table 1. Population by health region, 2011, NS
Health Region Name Population South Shore and South West Health Authorities 116,370 Annapolis Valley Health Authority 82,790 Colchester East Hants and Cumberland Health Authorities 104,314 Pictou County and Guysborough Antigonish Strait Health Authorities 90,264 Cape Breton Health Authority 123,032 Capital Health Authority 428,667 Source: CIHI. (2013). Regulated Nurses: Canadian Trends, 2007 to 2011. Ottawa, ON: CIHI.
Nursing Database Analysis: Findings
1. Nursing Workforce Numbers in Nova Scotia
In the period between 2003 and 2010, Nova Scotia’s overall regulated nursing workforce grew
from 11,543 to 12,809, which represented an 11.0% increase. When this increase was examined
in terms of nurse type, we found that the total number of RNs increased from 8,498 to 9,173 (up
7.9%), the total number of LPNs increased from 3,022 to 3,530 (up 16.8%), and the total number
of NPs increased from 23 to 106 (up 360.9%).
The changes in the regulated nursing workforce were also examined in terms of urban and rural
comparisons. The numbers of urban RNs, LPNs, and NPs all increased between 2003 and 2010.
In rural locations, the number of LPNs and NPs increased (up 24.0% and 342.9%, respectively),
and the number of rural RNs decreased (down 2.7%). With the exception of the decrease in rural
RNs, these changes generally reflected the wider trends found at the national scale.
Of the total regulated nursing workforce in Nova Scotia in 2010, 25.3% of RNs, 36.8% of LPNs,
and 29.3% of NPs worked in rural communities. When we considered the rural regulated nursing
workforce with respect to the rural population, we found that 28.5% of Nova Scotia nurses served
34.9% of Nova Scotia residents. The situation in urban locations was reversed; here we found
that 71.5% of the regulated nursing workforce served 65.1% of the population.
June 19, 2014 3
2. Nurse-to-Population Ratios
Nurse-to-population ratios represent the number of nurses per 100,000 population. In rural Nova
Scotia, the nurse-to-population ratios for RNs and NPs were lower than in urban locations for
both data years (2003 and 2010). Nurse-to-population ratios for LPNs were higher in urban
locations in 2003, but by 2010, rural locations had more LPNs per 100,000 population than urban
locations. Table 2 illustrates the increase in nurse-to-population ratios for urban RNs and urban
and rural LPNs. There was a decrease in the nurse-to-population ratio for rural RNs.
Table 2. Percentage (%) changes in 2003-2010 nurse-to-population ratios, NS and Canada
Jurisdiction
RNs LPNs
Urban Rural Urban Rural
NS 10.4 -11.0 2.7 25.2
Canada †† †† 20.7 6.8 Note: †† - no urban/rural allocations of RNs were available for RNs in Quebec in 2003. Data were suppressed for the territories due to small cell sizes.
3. Demographics
Age:
RNs in rural Nova Scotia tended to be slightly older than in urban parts of the province. The
pattern for LPNs, however, was reversed. Table 3 provides information about the average ages
of RNs and LPNs in urban and rural locations for 2003 and 2010. The average age of RNs and
LPNs working in both urban and rural locations continues to increase.
Table 3. Average age (in years) of the regulated nursing workforce, 2003-2010, NS and Canada
Jurisdiction
RNs LPNs
Urban Rural Urban Rural
2003 2010 2003 2010 2003 2010 2003 2010
NS 44.4 46.5 45.6 47.8 43.1 45.3 42.6 44.9
Canada †† ††† †† ††† 44.4 42.8 44.6 44.8 Note: †† no urban/rural allocation was made of 2003 Quebec NDB records for RNs. ††† data to compute average ages were not submitted by Manitoba for the 2010 NDB data year.
Gender:
The proportions of males in the regulated nursing workforce remained low for all nurse types in
both rural and urban locations. However, the proportion of male regulated nurses working in rural
Nova Scotia was lower than in urban Nova Scotia. In urban areas, the proportion of male RNs
increased, the proportion of male NPs decreased, and the proportion of male LPNs stayed the
same. In rural areas, the proportion of male RNs held steady, the proportion of NPs remained
zero, and the proportion of male LPNs increased slightly.
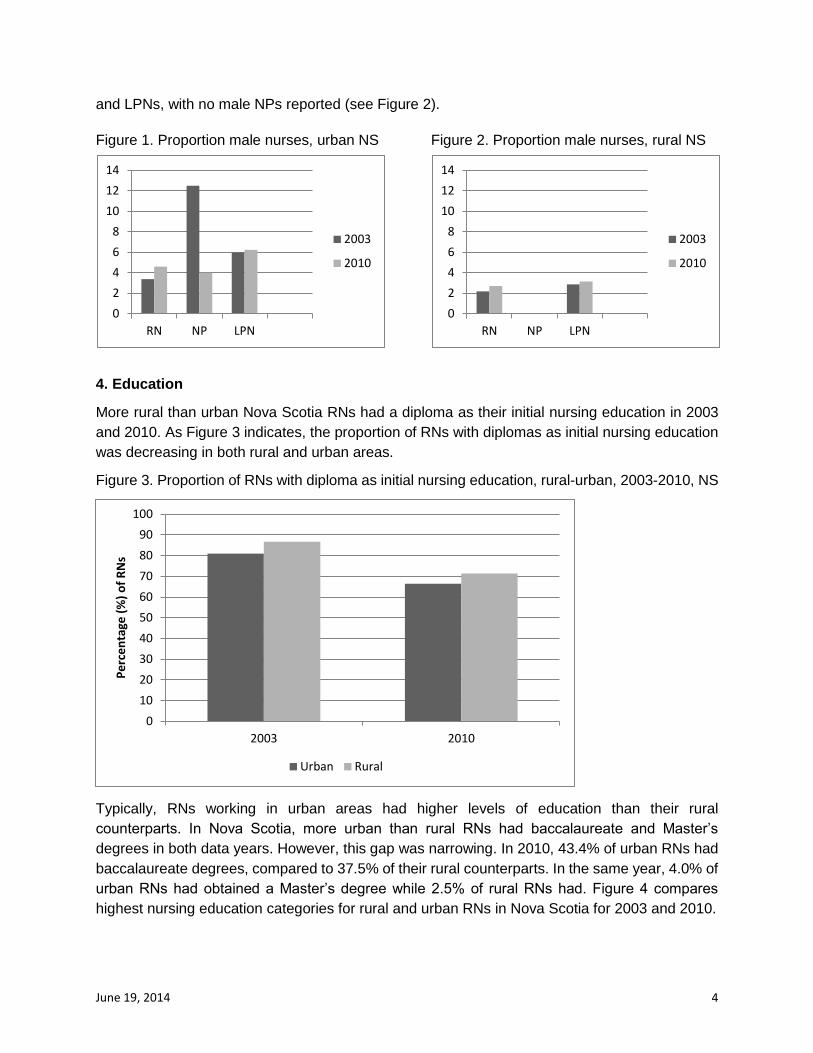
In 2003, NPs were the nurse type with the largest proportion of males in urban areas. In 2010,
6.2% of LPNs in rural Nova Scotia were male compared to 4.0% of NPs and 4.6% of RNs (see
Figure 1). In the same year in rural Nova Scotia, the proportions of males were similar for RNs
June 19, 2014 4
and LPNs, with no male NPs reported (see Figure 2).
Figure 1. Proportion male nurses, urban NS Figure 2. Proportion male nurses, rural NS
4. Education
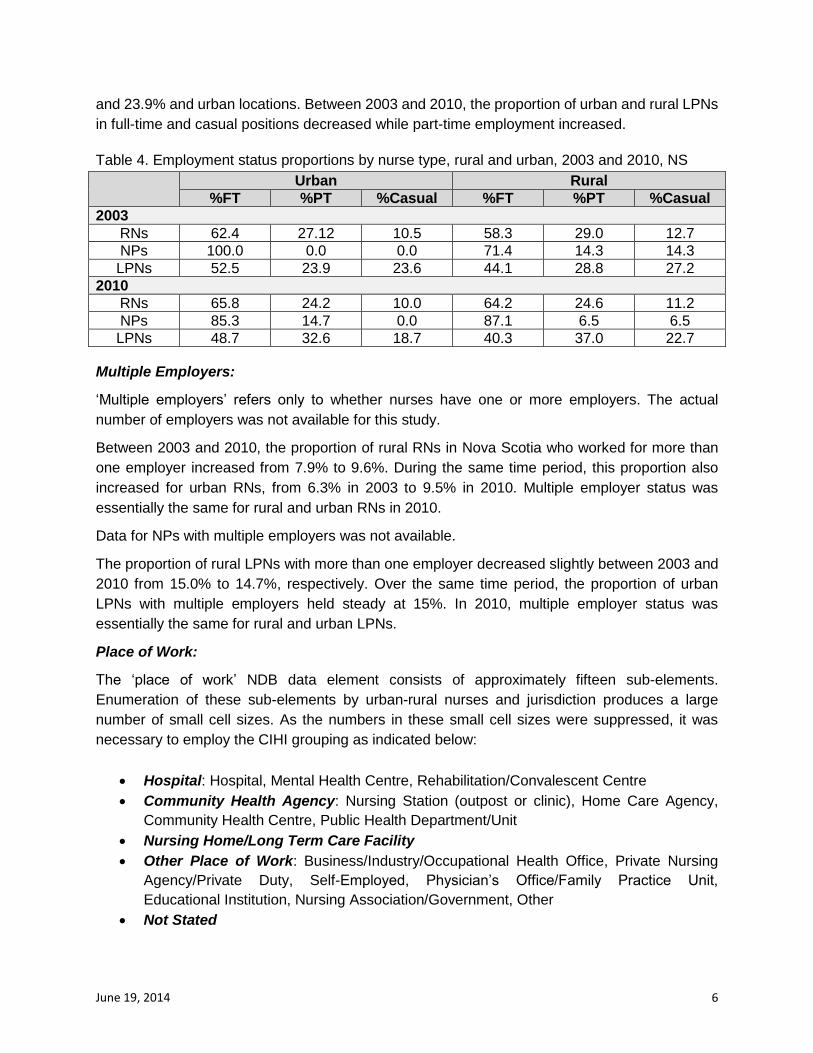
More rural than urban Nova Scotia RNs had a diploma as their initial nursing education in 2003
and 2010. As Figure 3 indicates, the proportion of RNs with diplomas as initial nursing education
was decreasing in both rural and urban areas.
Figure 3. Proportion of RNs with diploma as initial nursing education, rural-urban, 2003-2010, NS
Typically, RNs working in urban areas had higher levels of education than their rural
counterparts. In Nova Scotia, more urban than rural RNs had baccalaureate and Master’s
degrees in both data years. However, this gap was narrowing. In 2010, 43.4% of urban RNs had
baccalaureate degrees, compared to 37.5% of their rural counterparts. In the same year, 4.0% of
urban RNs had obtained a Master’s degree while 2.5% of rural RNs had. Figure 4 compares
highest nursing education categories for rural and urban RNs in Nova Scotia for 2003 and 2010.
0
10
20
30
40
50
60
70
80
90
100
2003 2010
Pe
rce
nta
ge (
%)
of
RN
s
Urban Rural
0
2
4
6
8
10
12
14
RN NP LPN
2003
2010
0
2
4
6
8
10
12
14
RN NP LPN
2003
2010
June 19, 2014 5
Figure 4. Proportion of RNs by highest nursing education categories, rural-urban, 2003-2010, NS
5. Employment
Employment Status:
The NDB ‘employment status’ categories are: full-time, part-time, casual and not stated. The
nursing colleges and CIHI define regular nursing employment as guaranteeing “a fixed number
of hours of work per pay period. May be defined by the employer as full-time or part-time, but
reflects permanent employment even though it may be time limited” (CIHI 2012, p. 8). Casual
nursing employment “does not guarantee a fixed number of hours of work per pay period” (CIHI
2012, p. 8). Table 4 provides employment status proportions by nurse type, rural/urban, and
year.
In 2003, more urban RNs were in full-time positions than their rural counterparts (62.4%
compared to 58.3%). In the same year, the proportions of rural RNs in part-time and casual
positions were marginally higher than for urban RNs (29.0% compared to 27.2%, and 12.7%
compared to 10.5%, respectively).
The proportion of RNs working full-time increased between 2003 and 2010 in both urban and
rural locations, although this proportion remained slightly lower for rural than for urban RNs. For
both urban and rural RNs, the proportion in part-time and casual positions decreased between
2003 and 2010. In 2010, the proportion of rural RNs in casual positions was higher than it was for
their urban counterparts.
In 2003, 100% of urban NPs and 71.4% of rural NPs reported being in full-time positions.
Between 2003 and 2010, the proportion of NPs in full-time positions decreased in urban areas to
85.3% and increased in rural areas to 87.1%, respectively. During this time, the proportion of
rural NPs in part-time and casual positions decreased.
More LPNs reported full-time than part-time or casual status in both 2003 and 2010, in rural and
urban areas. The proportion of LPNs in part-time positions in 2003 was 28.8% for rural locations
0
20
40
60
80
100
Urban 2003 Rural 2003 Urban 2010 Rural 2010
Pe
rce
nta
ge (
%)
of
RN
s
Diploma Baccalaureate Master's
June 19, 2014 6
and 23.9% and urban locations. Between 2003 and 2010, the proportion of urban and rural LPNs
in full-time and casual positions decreased while part-time employment increased.
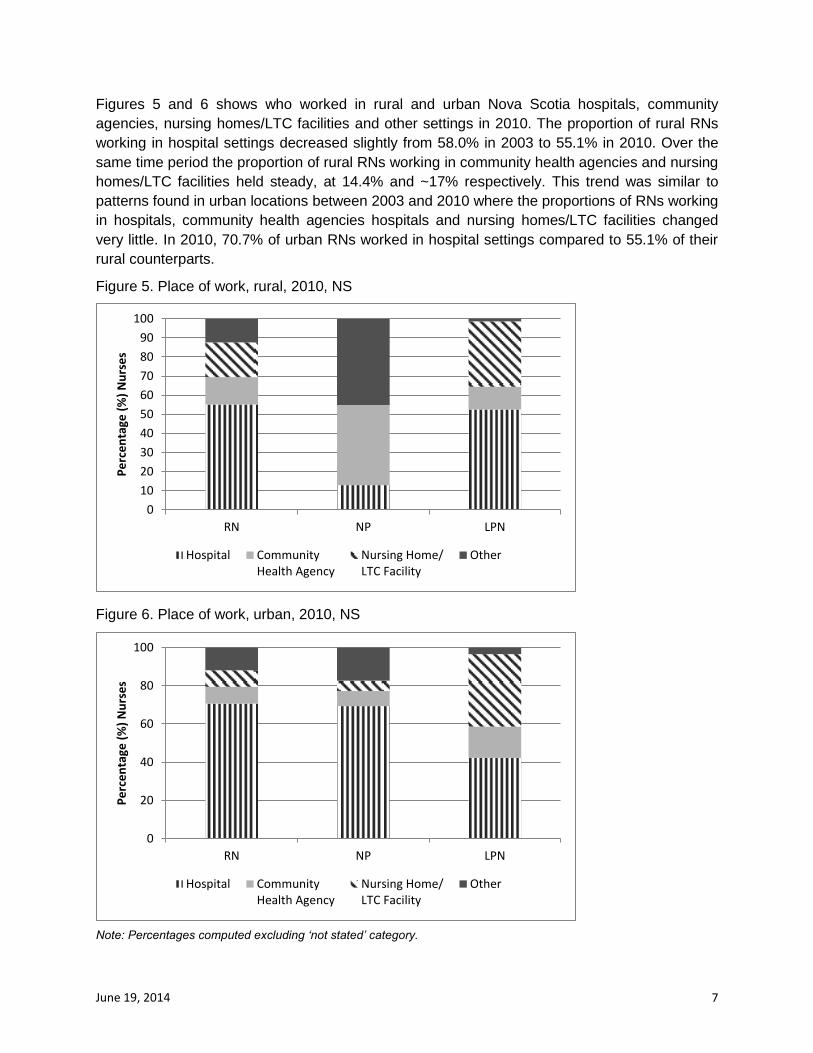
Table 4. Employment status proportions by nurse type, rural and urban, 2003 and 2010, NS
Urban Rural
%FT %PT %Casual %FT %PT %Casual
2003
RNs 62.4 27.12 10.5 58.3 29.0 12.7
NPs 100.0 0.0 0.0 71.4 14.3 14.3
LPNs 52.5 23.9 23.6 44.1 28.8 27.2
2010
RNs 65.8 24.2 10.0 64.2 24.6 11.2
NPs 85.3 14.7 0.0 87.1 6.5 6.5
LPNs 48.7 32.6 18.7 40.3 37.0 22.7
Multiple Employers:
‘Multiple employers’ refers only to whether nurses have one or more employers. The actual
number of employers was not available for this study.
Between 2003 and 2010, the proportion of rural RNs in Nova Scotia who worked for more than
one employer increased from 7.9% to 9.6%. During the same time period, this proportion also
increased for urban RNs, from 6.3% in 2003 to 9.5% in 2010. Multiple employer status was
essentially the same for rural and urban RNs in 2010.
Data for NPs with multiple employers was not available.
The proportion of rural LPNs with more than one employer decreased slightly between 2003 and
2010 from 15.0% to 14.7%, respectively. Over the same time period, the proportion of urban
LPNs with multiple employers held steady at 15%. In 2010, multiple employer status was
essentially the same for rural and urban LPNs.
Place of Work:
The ‘place of work’ NDB data element consists of approximately fifteen sub-elements.
Enumeration of these sub-elements by urban-rural nurses and jurisdiction produces a large
number of small cell sizes. As the numbers in these small cell sizes were suppressed, it was
necessary to employ the CIHI grouping as indicated below:
Hospital: Hospital, Mental Health Centre, Rehabilitation/Convalescent Centre
Community Health Agency: Nursing Station (outpost or clinic), Home Care Agency,
Community Health Centre, Public Health Department/Unit
Nursing Home/Long Term Care Facility
Other Place of Work: Business/Industry/Occupational Health Office, Private Nursing
Agency/Private Duty, Self-Employed, Physician’s Office/Family Practice Unit,
Educational Institution, Nursing Association/Government, Other
Not Stated
June 19, 2014 7
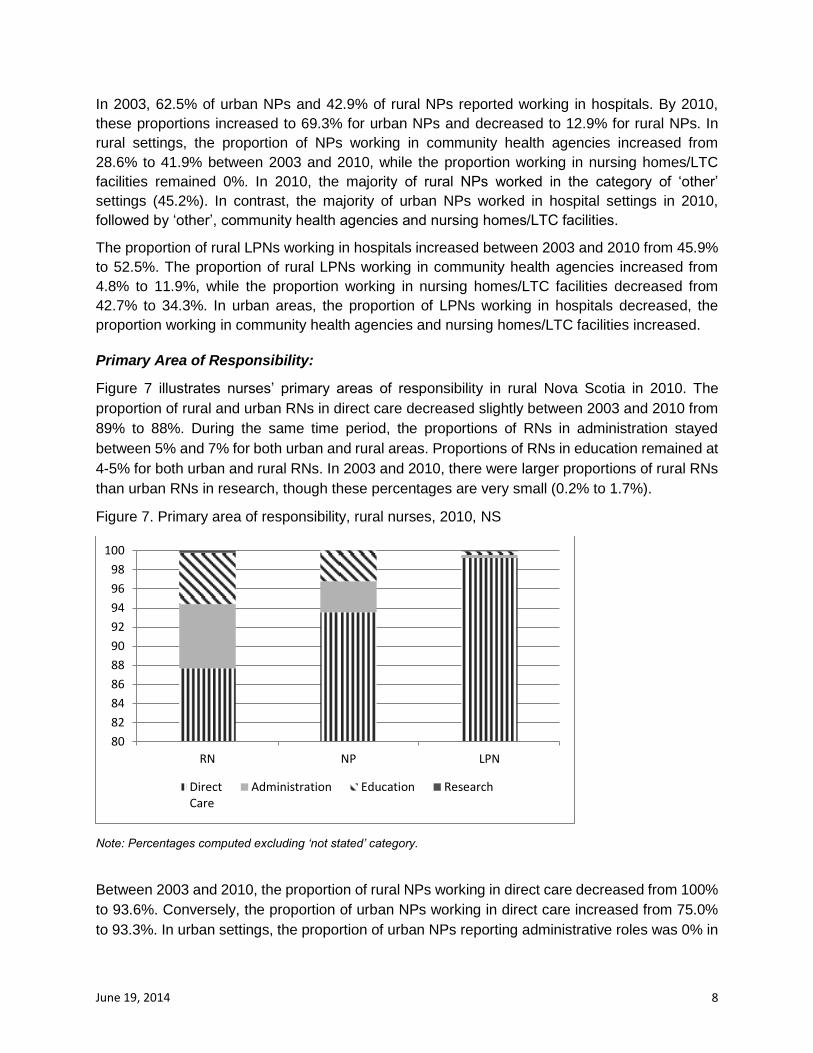
Figures 5 and 6 shows who worked in rural and urban Nova Scotia hospitals, community
agencies, nursing homes/LTC facilities and other settings in 2010. The proportion of rural RNs
working in hospital settings decreased slightly from 58.0% in 2003 to 55.1% in 2010. Over the
same time period the proportion of rural RNs working in community health agencies and nursing
homes/LTC facilities held steady, at 14.4% and ~17% respectively. This trend was similar to
patterns found in urban locations between 2003 and 2010 where the proportions of RNs working
in hospitals, community health agencies hospitals and nursing homes/LTC facilities changed
very little. In 2010, 70.7% of urban RNs worked in hospital settings compared to 55.1% of their
self-employed/private practice; mental health centre; physician’s office; home care agency; and,
public health agency/community health centre (Wong et al., 2009).
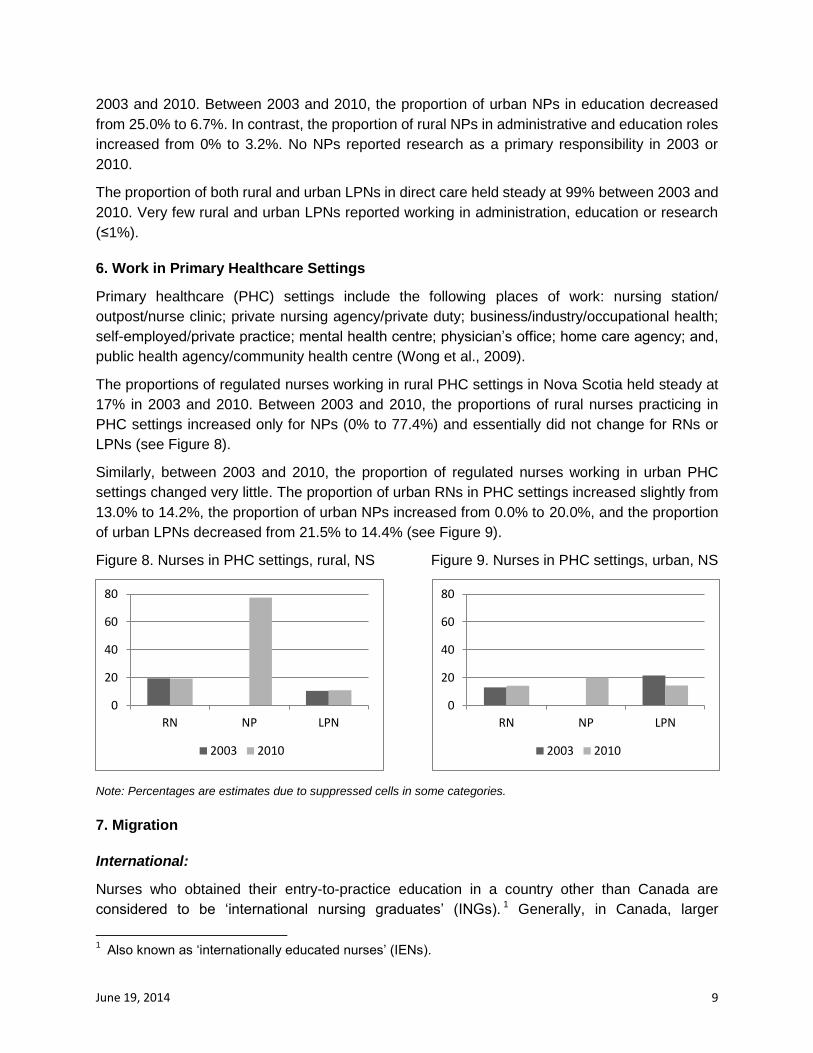
The proportions of regulated nurses working in rural PHC settings in Nova Scotia held steady at
17% in 2003 and 2010. Between 2003 and 2010, the proportions of rural nurses practicing in
PHC settings increased only for NPs (0% to 77.4%) and essentially did not change for RNs or
LPNs (see Figure 8).
Similarly, between 2003 and 2010, the proportion of regulated nurses working in urban PHC
settings changed very little. The proportion of urban RNs in PHC settings increased slightly from
13.0% to 14.2%, the proportion of urban NPs increased from 0.0% to 20.0%, and the proportion
of urban LPNs decreased from 21.5% to 14.4% (see Figure 9).
Figure 8. Nurses in PHC settings, rural, NS Figure 9. Nurses in PHC settings, urban, NS
Note: Percentages are estimates due to suppressed cells in some categories.
7. Migration
International:
Nurses who obtained their entry-to-practice education in a country other than Canada are
considered to be ‘international nursing graduates’ (INGs). 1 Generally, in Canada, larger
1 Also known as ‘internationally educated nurses’ (IENs).
0
20
40
60
80
RN NP LPN
2003 2010
0
20
40
60
80
RN NP LPN
2003 2010
June 19, 2014 10
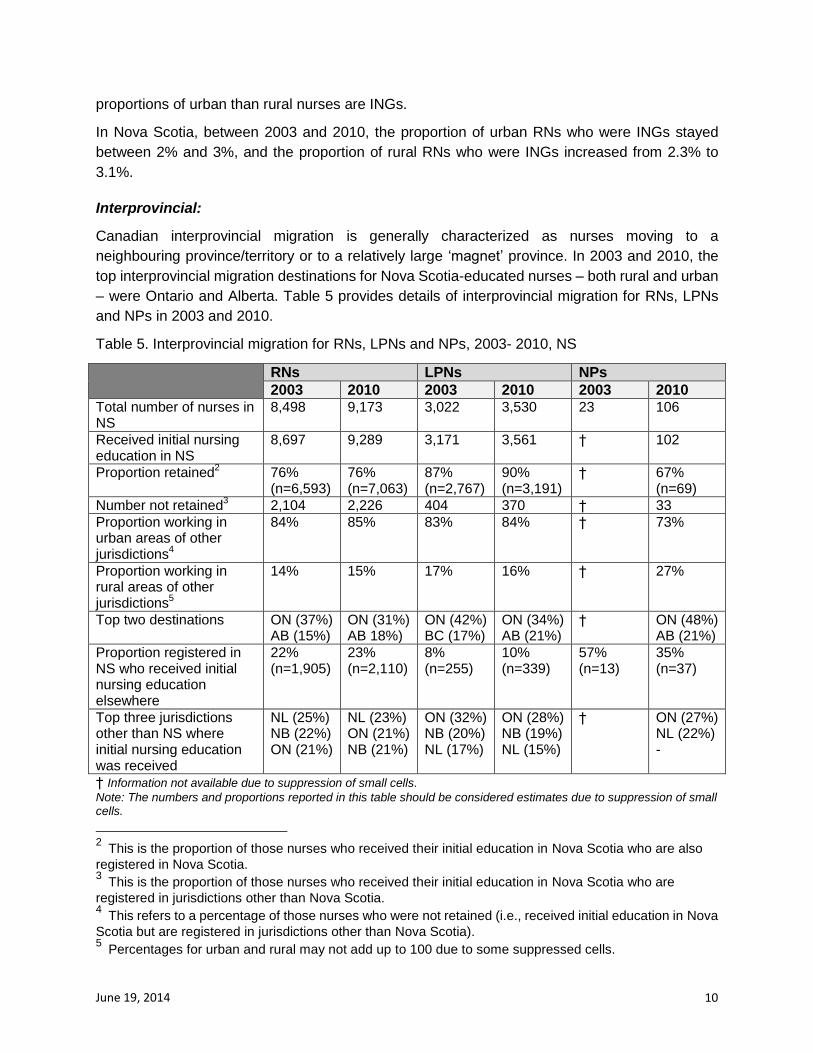
proportions of urban than rural nurses are INGs.
In Nova Scotia, between 2003 and 2010, the proportion of urban RNs who were INGs stayed
between 2% and 3%, and the proportion of rural RNs who were INGs increased from 2.3% to
3.1%.
Interprovincial:
Canadian interprovincial migration is generally characterized as nurses moving to a
neighbouring province/territory or to a relatively large ‘magnet’ province. In 2003 and 2010, the
top interprovincial migration destinations for Nova Scotia-educated nurses – both rural and urban
– were Ontario and Alberta. Table 5 provides details of interprovincial migration for RNs, LPNs
and NPs in 2003 and 2010.
Table 5. Interprovincial migration for RNs, LPNs and NPs, 2003- 2010, NS
RNs LPNs NPs
2003 2010 2003 2010 2003 2010 Total number of nurses in NS
8,498 9,173 3,022 3,530 23 106
Received initial nursing education in NS
8,697 9,289 3,171 3,561 † 102
Proportion retained2 76%
(n=6,593) 76% (n=7,063)
87% (n=2,767)
90% (n=3,191)
† 67% (n=69)
Number not retained3 2,104 2,226 404 370 † 33
Proportion working in urban areas of other jurisdictions
4
84% 85% 83% 84% † 73%
Proportion working in rural areas of other jurisdictions
5
14% 15% 17% 16% † 27%
Top two destinations ON (37%) AB (15%)
ON (31%) AB 18%)
ON (42%) BC (17%)
ON (34%) AB (21%)
† ON (48%) AB (21%)
Proportion registered in NS who received initial nursing education elsewhere
22% (n=1,905)
23% (n=2,110)
8% (n=255)
10% (n=339)
57% (n=13)
35% (n=37)
Top three jurisdictions other than NS where initial nursing education was received
NL (25%) NB (22%) ON (21%)
NL (23%) ON (21%) NB (21%)
ON (32%) NB (20%) NL (17%)
ON (28%) NB (19%) NL (15%)
† ON (27%) NL (22%) -
† Information not available due to suppression of small cells.
Note: The numbers and proportions reported in this table should be considered estimates due to suppression of small cells.
2 This is the proportion of those nurses who received their initial education in Nova Scotia who are also
registered in Nova Scotia. 3 This is the proportion of those nurses who received their initial education in Nova Scotia who are
registered in jurisdictions other than Nova Scotia. 4 This refers to a percentage of those nurses who were not retained (i.e., received initial education in Nova
Scotia but are registered in jurisdictions other than Nova Scotia). 5 Percentages for urban and rural may not add up to 100 due to some suppressed cells.
June 19, 2014 11
References
CIHI. (2012). Registered Nurses Data Dictionary and Processing Manual, Version 12.0. Ottawa, ON: Canadian Institute for Health Information.
CIHI. (2013). Regulated Nurses: Canadian Trends, 2007 to 2011. Ottawa, ON: Canadian Institute for Health Information.
du Plessis, V., Beshiri, R., Bollman, R.D. and Clemenson, H. (2001). Definitions of rural. Rural and Small Town Canada Analysis, Bulletin 3:1-16.
Wong, S. T., Watson, D. E., Young, E., & Mooney, D. (2009). Supply and distribution of primary healthcare registered nurses in British Columbia. Health Policy 5, 91-104.
To cite this report: Place, J., MacLeod, M. & Pitblado, R. (June, 2014). Nursing Practice In Rural and Remote Nova
Scotia: An Analysis of CIHI’s Nursing Database. Prince George, BC: Nursing Practice in Rural
and Remote Canada II. RRN2-01-8
This short report is derived from: Pitblado, R., Koren, I., MacLeod, M., Place, J., Kulig, J., & Stewart, N. (2013). Characteristics
and Distribution of the Regulated Nursing Workforce in Rural and Small Town Canada, 2003 and 2010. Prince George, BC: Nursing Practice in Rural and Remote Canada II. RRN2-01
Further information about the full study is available from:
Nursing Practice in Rural and Remote Canada, II University of Northern British Columbia