37
NURSING Workforce Supply and Employment Characteristics 2017
| Date post: | 10-Apr-2018 |
| Category: |
Documents |
| Upload: | trankhuong |
| View: | 219 times |
| Download: | 1 times |
NURSING Wo r k f o r c e S u p p l y a n d
E m p l o y m e n t C h a r a c t e r i s t i c s
2017
2
Suggested Citation: South Dakota Center for Nursing Workforce, South Dakota Nursing Workforce Supply and Employment Characteristics: 2017. ©2017 South Dakota Board of Nursing. All materials related to this copyright may be photocopied for non-commercial scientific or education advancement.
South Dakota Board of Nursing 4305 S. Louise Avenue, Suite 201 Sioux Falls, SD 57106-3115 http://www.doh.sd.gov/boards/nursing http://www.doh.sd.gov/boards/nursing/sdcenter.htm
South Dakota Board of Nursing, Center for Nursing Workforce Staff Contributor: Linda J. Young, MS, RN, FRE, BC Acknowledgements:
Thank you to all of the nurses who took time to complete the questions on their renewal application.
Thank you to the South Dakota Board of Nursing staff for their assistance in collecting, compiling the data,
and reviewing the report: Gloria Damgaard, MS, RN, EO; Erin Matthies, Licensure Manager; and Tessa
Stob, RN, Nursing Program Specialist.
3
Table of Contents
Introduction ..................................................................................................................................................................... 4
Overview and Methods ................................................................................................................................................... 5
Trends in Supply of South Dakota Nurses ....................................................................................................................... 5
Licensed Practical Nurses ............................................................................................................................................... 6
South Dakota Supply Trends .................................................................................................................................... 6
Demographics of LPN Supply .................................................................................................................................... 6
Employment Characteristics ..................................................................................................................................... 8
Practice Characteristics ............................................................................................................................................ 9
LPN Distribution in South Dakota ............................................................................................................................. 10
Registered Nurses ............................................................................................................................................................ 12
South Dakota Supply Trends .................................................................................................................................... 12
Demographics of RN Supply ..................................................................................................................................... 12
Employment Characteristics ..................................................................................................................................... 15
Practice Characteristics ............................................................................................................................................ 16
RN Distribution in South Dakota .............................................................................................................................. 18
Advanced Practice Registered Nurses ............................................................................................................................. 21
Certified Nurse Midwives ......................................................................................................................................... 21
South Dakota Supply Trends ............................................................................................................................. 21
Demographics of CNM Supply ........................................................................................................................... 21
Employment Characteristics.............................................................................................................................. 22
CNM Distribution in South Dakota .................................................................................................................... 23
Certified Nurse Practitioners .................................................................................................................................... 24
South Dakota Supply Trends ............................................................................................................................. 24
Demographics of CNP Supply ............................................................................................................................ 25
Employment and Practice Characteristics ......................................................................................................... 26
CNP Distribution in South Dakota ..................................................................................................................... 27
Certified Registered Nurse Anesthetists................................................................................................................... 28
South Dakota Supply Trends ............................................................................................................................. 28
Demographics of CRNA Supply .......................................................................................................................... 28
Employment Characteristics.............................................................................................................................. 29
CRNA Distribution in South Dakota ................................................................................................................... 30
Clinical Nurse Specialists .......................................................................................................................................... 31
South Dakota Supply Trends ............................................................................................................................. 31
Demographics of CNS Supply ............................................................................................................................ 31
Employment and Practice Characteristics ......................................................................................................... 32
CNS Distribution in South Dakota ...................................................................................................................... 33
Employment and Education Data Form ........................................................................................................................... 35
References ....................................................................................................................................................................... 37
4
Introduction This 2017 Report on South Dakota’s Nursing Workforce was prepared by the South Dakota Center for Nursing Workforce (SD CNW). The report provides information on South Dakota’s current nursing workforce supply and compares it with historical data and with future projections regarding supply and demand for nurses. The report also includes findings from data gathered from each nurse license renewal application submitted to the South Dakota Board of Nursing (SD BON). Similar supply reports were published biannually from 1996 to 2015; copies are available from the SD CNW.
The SD CNW, initially funded by the Robert Wood Johnson Foundation, was established in 1996 as the SD Colleagues in Caring Project. At the completion of the grant in 2002, state legislation was enacted in the Nurse Practice Act. This legislation, SDCL 36-9-95 and 36-9-96, created the Nursing Workforce Center and a source for funding. The SD BON is the lead agency for the SD CNW. The mission of the Center is to design a nursing workforce prepared to partner with South Dakota citizens to meet their changing health needs. Members of the SD CNW Governance Council provide guidance and strategic direction to the CNW.
The SD CNW is proactively preparing to meet the demands of citizens to ensure South Dakota continues to have a nursing workforce prepared to meet
South Dakota citizens’ changing health needs.
Center for Nursing Workforce Strategic Initiatives
Dialog on issues related to a culture of safety for all aspects of nursing practice.
o Support a culture of civility in the work place to promote nurses and patient safety.
o Promote strategies to decrease nursing fatigue in the work place.
o Support engagement in nursing learning opportunities to maintain a competent nursing workforce.
Collect, analyze and leverage nursing workforce supply and demand data for the purpose of mission implementation.
Build the leadership capacity of the nursing workforce.
o Utilize concepts for the Art of Hosting to increase leadership capacity of nursing community.
o Support Action Coalition goals and objectives relating to workforce development to meet recommendations in the IOM’s 2010 Future of Nursing report.
o Support leadership development for nurses at all levels.
Be a catalyst for public policy development that affects the health of the public.
o Provide opportunities to bring nurses, educators, administrators, policy makers, and healthcare stakeholders together to hold conversations on public policy issues that focus on: new models of care, culture of safety for all aspects of nursing practice, nursing education, and nursing workforce solutions for SD.
Governance Council Members Diana Berkland, PhD, CNS, RN
Linda Burdette, MS, RN Gloria Damgaard, MS, RN, FRE
Barbara Hobbs, PhD, RN, NEA, BC Josie Petersen, Office of Rural Health, DOH
Darcy Sherman Justice, MS, RN, NE, BC Deb Soholt, MS, RN
Kayleen Werner, LPN Linda Young, MS, RN, FRE, BC
5
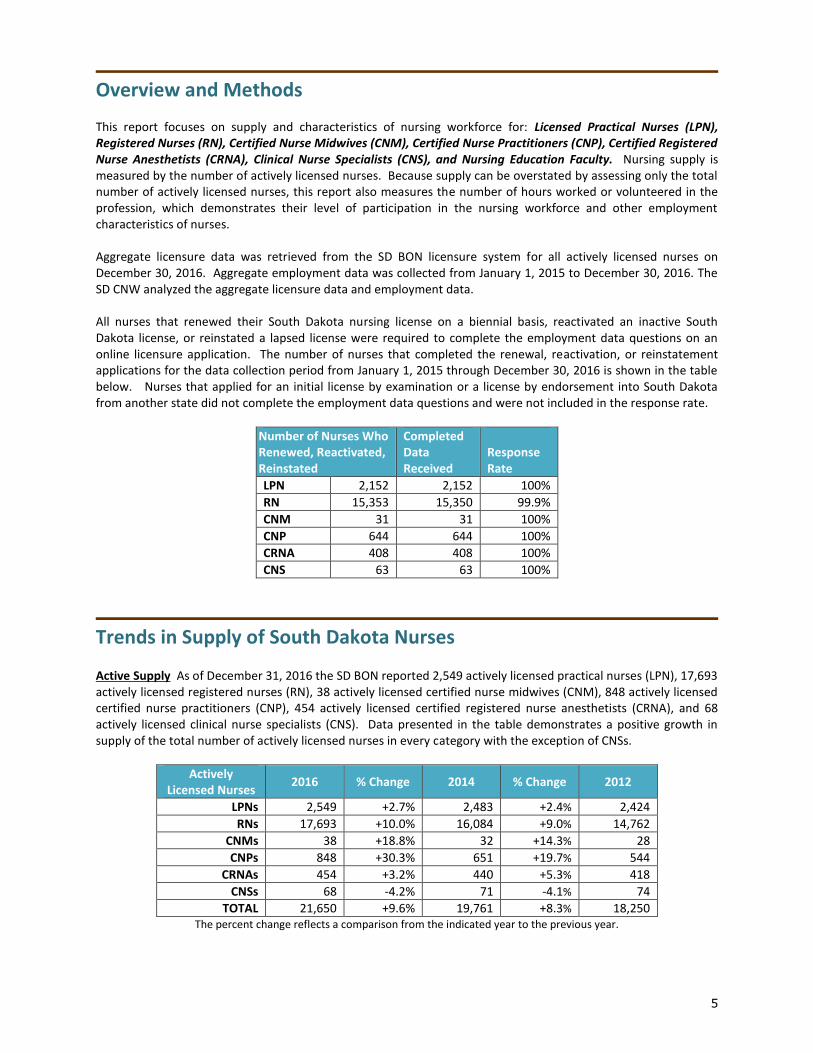
Overview and Methods This report focuses on supply and characteristics of nursing workforce for: Licensed Practical Nurses (LPN), Registered Nurses (RN), Certified Nurse Midwives (CNM), Certified Nurse Practitioners (CNP), Certified Registered Nurse Anesthetists (CRNA), Clinical Nurse Specialists (CNS), and Nursing Education Faculty. Nursing supply is measured by the number of actively licensed nurses. Because supply can be overstated by assessing only the total number of actively licensed nurses, this report also measures the number of hours worked or volunteered in the profession, which demonstrates their level of participation in the nursing workforce and other employment characteristics of nurses. Aggregate licensure data was retrieved from the SD BON licensure system for all actively licensed nurses on December 30, 2016. Aggregate employment data was collected from January 1, 2015 to December 30, 2016. The SD CNW analyzed the aggregate licensure data and employment data. All nurses that renewed their South Dakota nursing license on a biennial basis, reactivated an inactive South Dakota license, or reinstated a lapsed license were required to complete the employment data questions on an online licensure application. The number of nurses that completed the renewal, reactivation, or reinstatement applications for the data collection period from January 1, 2015 through December 30, 2016 is shown in the table below. Nurses that applied for an initial license by examination or a license by endorsement into South Dakota from another state did not complete the employment data questions and were not included in the response rate.
Number of Nurses Who Renewed, Reactivated, Reinstated
Completed Data Received
Response Rate
LPN 2,152 2,152 100%
RN 15,353 15,350 99.9%
CNM 31 31 100%
CNP 644 644 100%
CRNA 408 408 100%
CNS 63 63 100%
Trends in Supply of South Dakota Nurses Active Supply As of December 31, 2016 the SD BON reported 2,549 actively licensed practical nurses (LPN), 17,693 actively licensed registered nurses (RN), 38 actively licensed certified nurse midwives (CNM), 848 actively licensed certified nurse practitioners (CNP), 454 actively licensed certified registered nurse anesthetists (CRNA), and 68 actively licensed clinical nurse specialists (CNS). Data presented in the table demonstrates a positive growth in supply of the total number of actively licensed nurses in every category with the exception of CNSs.
Actively Licensed Nurses
2016 % Change 2014 % Change 2012
LPNs 2,549 +2.7% 2,483 +2.4% 2,424
RNs 17,693 +10.0% 16,084 +9.0% 14,762
CNMs 38 +18.8% 32 +14.3% 28
CNPs 848 +30.3% 651 +19.7% 544
CRNAs 454 +3.2% 440 +5.3% 418
CNSs 68 -4.2% 71 -4.1% 74
TOTAL 21,650 +9.6% 19,761 +8.3% 18,250 The percent change reflects a comparison from the indicated year to the previous year.

6
Licensed Practical Nurses
South Dakota Supply Trends
Licensure Status As of December 31, 2016 the SDBON reported 2,549 actively licensed LPNs in South Dakota’s supply, a gain of 66 nurses from 2014 to 2016 and a 2.7% increase since 2014.
Workforce Gains and Losses From January 1, 2015 to December 31, 2016 a total of 532 LPNs were added to South Dakota’s active supply of LPNs; 348 were added as new graduates and 184 were added by endorsement from another state as shown in the figure below. Overall, South Dakota had an increase in supply during this time period of 66 nurses with a net loss of 466 LPNs. Licensure data during the previous two time periods revealed similar findings with net losses of 409 LPNs in 2013 to 2014 and 379 nurses from 2011-2012. Reasons for the loss were due to retirement, LPNs leaving the profession, moving out of South Dakota, or inactivation of the license. Many LPNs inactivate their LPN license after completion of an RN education program and obtaining an RN license. LPN Workforce Gains and Losses
Demographics of LPN Supply
Gender Consistent with previous reports the majority, 95.3%, of actively licensed LPNs in South Dakota were female. Nationally female LPNs comprised 92.5% of the population
1.
2016 2014 2012
Male LPNs 120 4.7% 109 4.4% 102 4.2%
Female LPNs 2,429 95.3% 2,374 95.6% 2,322 95.8%
TOTAL 2,549 100% 2,483 100% 2,424 100%
2,424
2,483
2,549
2,360 2,380 2,400 2,420 2,440 2,460 2,480 2,500 2,520 2,540 2,560
2012
2014
2016
532 468 456
66 59 77
-466 -409 -379
-600
-400
-200
0
200
400
600
2015-2016 2013-2014 2011-2012
Additions to LPN Workforce Supply Increase/Decrease Net Increase/Loss of LPNs
7
Race/Ethnicity The majority of LPNs were white/Caucasian. Minority nurse populations continue to be under-represented. The table below presents comparisons of ethnic distribution of the United States, South Dakota, and actively licensed LPNs in the United States and South Dakota.
American Indian
Black/African American
White/ Caucasian
Asian/Pacific Islander
Two or More Races / Other
Hispanic/ Latino
U.S. Population3 1.2% 13.3% 61.6% 5.8% 2.6% 17.6%
U.S. LPNs1
0.9% 15.3% 68.1% 5.7% 3.7% 6.4%
SD Population2
8.9% 1.8% 82.9% 1.5% 2.2% 3.6%
SD LPNs 4.1% (105) 2.5% (63) 90.3% (2,303) 0.7% (17) 1.3% (33) 1.1% (28)
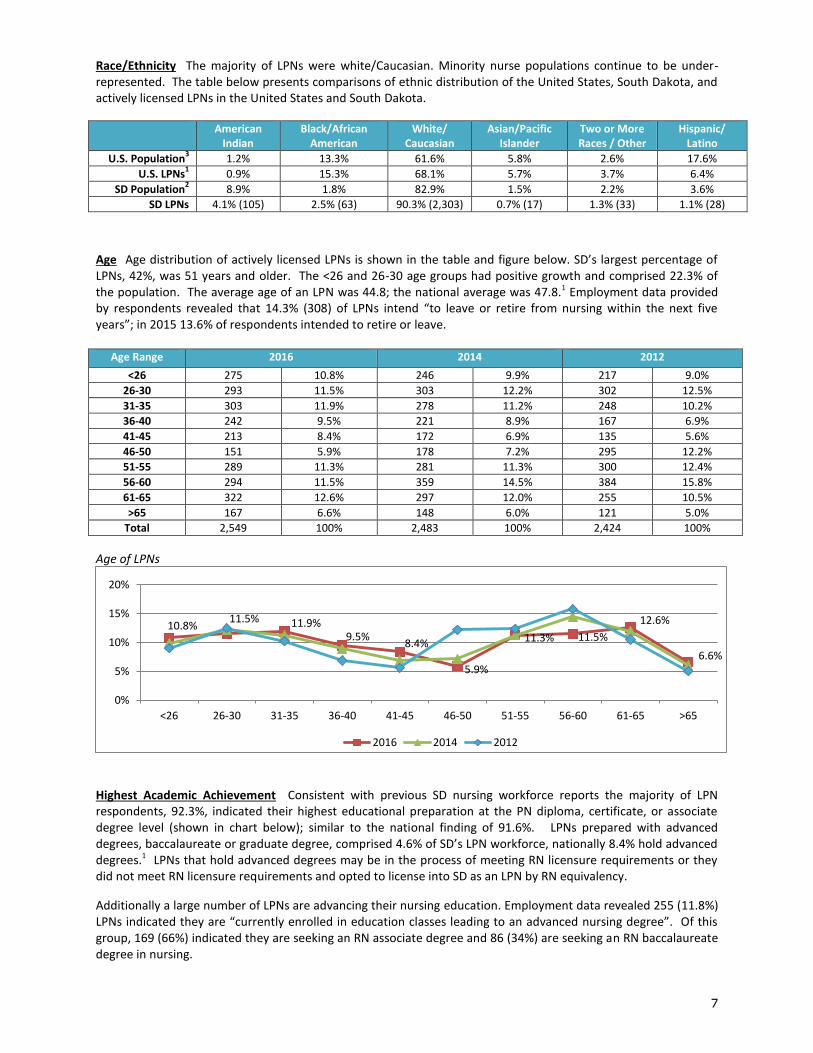
Age Age distribution of actively licensed LPNs is shown in the table and figure below. SD’s largest percentage of LPNs, 42%, was 51 years and older. The <26 and 26-30 age groups had positive growth and comprised 22.3% of the population. The average age of an LPN was 44.8; the national average was 47.8.1 Employment data provided by respondents revealed that 14.3% (308) of LPNs intend “to leave or retire from nursing within the next five years”; in 2015 13.6% of respondents intended to retire or leave.
Age Range 2016 2014 2012
<26 275 10.8% 246 9.9% 217 9.0%
26-30 293 11.5% 303 12.2% 302 12.5%
31-35 303 11.9% 278 11.2% 248 10.2%
36-40 242 9.5% 221 8.9% 167 6.9%
41-45 213 8.4% 172 6.9% 135 5.6%
46-50 151 5.9% 178 7.2% 295 12.2%
51-55 289 11.3% 281 11.3% 300 12.4%
56-60 294 11.5% 359 14.5% 384 15.8%
61-65 322 12.6% 297 12.0% 255 10.5%
>65 167 6.6% 148 6.0% 121 5.0%
Total 2,549 100% 2,483 100% 2,424 100%
Age of LPNs
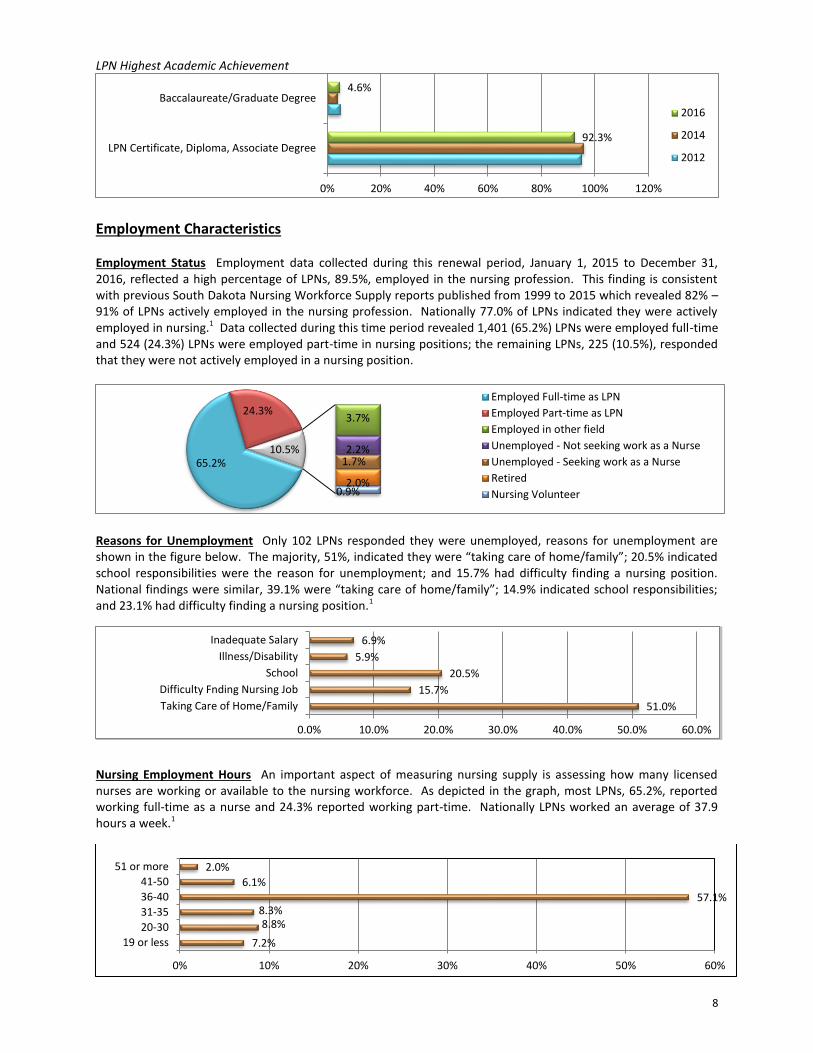
Highest Academic Achievement Consistent with previous SD nursing workforce reports the majority of LPN respondents, 92.3%, indicated their highest educational preparation at the PN diploma, certificate, or associate degree level (shown in chart below); similar to the national finding of 91.6%. LPNs prepared with advanced degrees, baccalaureate or graduate degree, comprised 4.6% of SD’s LPN workforce, nationally 8.4% hold advanced degrees.1 LPNs that hold advanced degrees may be in the process of meeting RN licensure requirements or they did not meet RN licensure requirements and opted to license into SD as an LPN by RN equivalency.
Additionally a large number of LPNs are advancing their nursing education. Employment data revealed 255 (11.8%) LPNs indicated they are “currently enrolled in education classes leading to an advanced nursing degree”. Of this group, 169 (66%) indicated they are seeking an RN associate degree and 86 (34%) are seeking an RN baccalaureate degree in nursing.
10.8% 11.5% 11.9%
9.5% 8.4%
5.9%
11.3% 11.5%
12.6%
6.6%
0%
5%
10%
15%
20%
<26 26-30 31-35 36-40 41-45 46-50 51-55 56-60 61-65 >65
2016 2014 2012
8
LPN Highest Academic Achievement
Employment Characteristics Employment Status Employment data collected during this renewal period, January 1, 2015 to December 31, 2016, reflected a high percentage of LPNs, 89.5%, employed in the nursing profession. This finding is consistent with previous South Dakota Nursing Workforce Supply reports published from 1999 to 2015 which revealed 82% – 91% of LPNs actively employed in the nursing profession. Nationally 77.0% of LPNs indicated they were actively employed in nursing.1 Data collected during this time period revealed 1,401 (65.2%) LPNs were employed full-time and 524 (24.3%) LPNs were employed part-time in nursing positions; the remaining LPNs, 225 (10.5%), responded that they were not actively employed in a nursing position.
Reasons for Unemployment Only 102 LPNs responded they were unemployed, reasons for unemployment are shown in the figure below. The majority, 51%, indicated they were “taking care of home/family”; 20.5% indicated school responsibilities were the reason for unemployment; and 15.7% had difficulty finding a nursing position. National findings were similar, 39.1% were “taking care of home/family”; 14.9% indicated school responsibilities; and 23.1% had difficulty finding a nursing position.1
Nursing Employment Hours An important aspect of measuring nursing supply is assessing how many licensed nurses are working or available to the nursing workforce. As depicted in the graph, most LPNs, 65.2%, reported working full-time as a nurse and 24.3% reported working part-time. Nationally LPNs worked an average of 37.9 hours a week.1
92.3%
4.6%
0% 20% 40% 60% 80% 100% 120%
LPN Certificate, Diploma, Associate Degree
Baccalaureate/Graduate Degree2016
2014
2012
65.2%
24.3% 3.7%
2.2% 1.7%
2.0% 0.9%
10.5%
Employed Full-time as LPN
Employed Part-time as LPN
Employed in other field
Unemployed - Not seeking work as a Nurse
Unemployed - Seeking work as a Nurse
Retired
Nursing Volunteer
51.0%
15.7%
20.5%
5.9%
6.9%
0.0% 10.0% 20.0% 30.0% 40.0% 50.0% 60.0%
Taking Care of Home/Family
Difficulty Fnding Nursing Job
School
Illness/Disability
Inadequate Salary
7.2%
8.8% 8.3%
57.1%
6.1%
2.0%
0% 10% 20% 30% 40% 50% 60%
19 or less
20-30
31-35
36-40
41-50
51 or more
9
Data collected on nursing employment hours was used to formulate a LPN full-time and part-time equivalency (FTE) status. As shown in the table, an estimated 1,971.6 2,044.2 LPN FTEs are available to the workforce; a decrease of 72.6 FTEs since 2015.
Percentage Full-time Responses Percentage Part-time Responses Estimated Actively Licensed LPN FTEs Available
2,549 LPNs x 65.2% FT = 1661.9 FTEs 2,549 LPNs x 24.3% PT / 0.5 = 309.7 FTEs 1661.9 + 309.7= 1,971.6 Total FTEs
Practice Characteristics
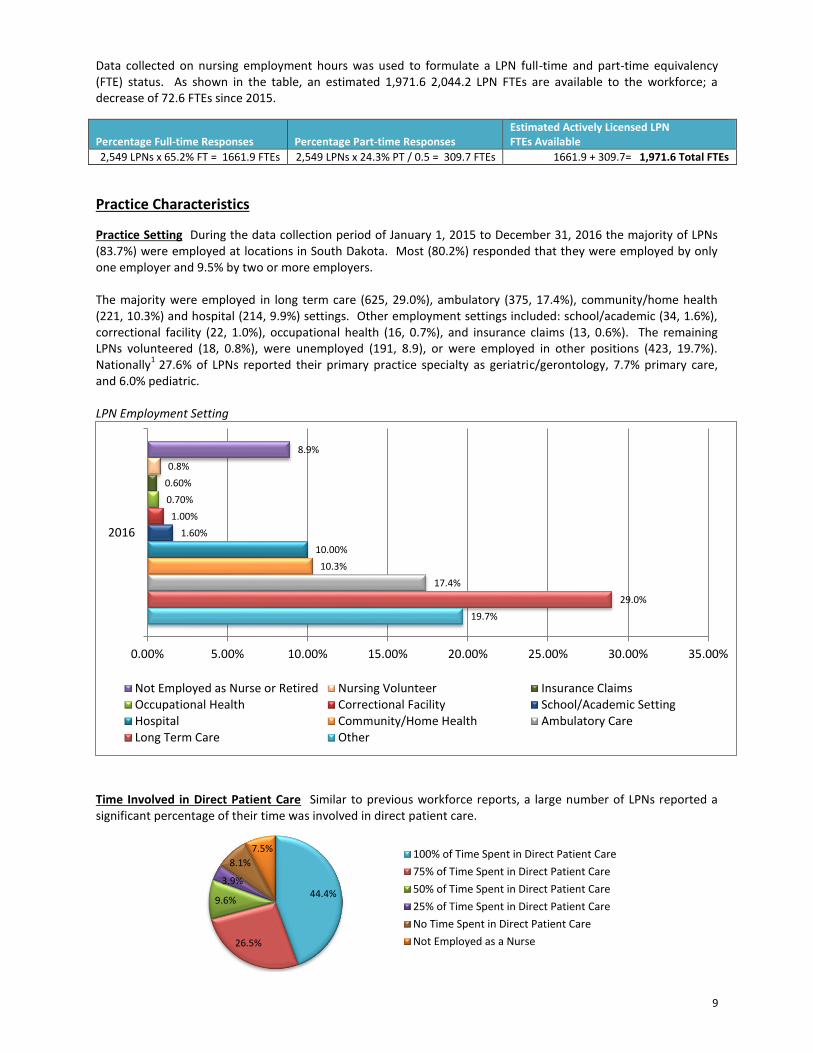
Practice Setting During the data collection period of January 1, 2015 to December 31, 2016 the majority of LPNs (83.7%) were employed at locations in South Dakota. Most (80.2%) responded that they were employed by only one employer and 9.5% by two or more employers. The majority were employed in long term care (625, 29.0%), ambulatory (375, 17.4%), community/home health (221, 10.3%) and hospital (214, 9.9%) settings. Other employment settings included: school/academic (34, 1.6%), correctional facility (22, 1.0%), occupational health (16, 0.7%), and insurance claims (13, 0.6%). The remaining LPNs volunteered (18, 0.8%), were unemployed (191, 8.9), or were employed in other positions (423, 19.7%). Nationally
1 27.6% of LPNs reported their primary practice specialty as geriatric/gerontology, 7.7% primary care,
and 6.0% pediatric. LPN Employment Setting
Time Involved in Direct Patient Care Similar to previous workforce reports, a large number of LPNs reported a significant percentage of their time was involved in direct patient care.
19.7%
29.0%
17.4%
10.3%
10.00%
1.60%
1.00%
0.70%
0.60%
0.8%
8.9%
0.00% 5.00% 10.00% 15.00% 20.00% 25.00% 30.00% 35.00%
2016
Not Employed as Nurse or Retired Nursing Volunteer Insurance ClaimsOccupational Health Correctional Facility School/Academic SettingHospital Community/Home Health Ambulatory CareLong Term Care Other
44.4%
26.5%
9.6%
3.9%
8.1%
7.5% 100% of Time Spent in Direct Patient Care
75% of Time Spent in Direct Patient Care
50% of Time Spent in Direct Patient Care
25% of Time Spent in Direct Patient Care
No Time Spent in Direct Patient Care
Not Employed as a Nurse
10
LPN Distribution in South Dakota
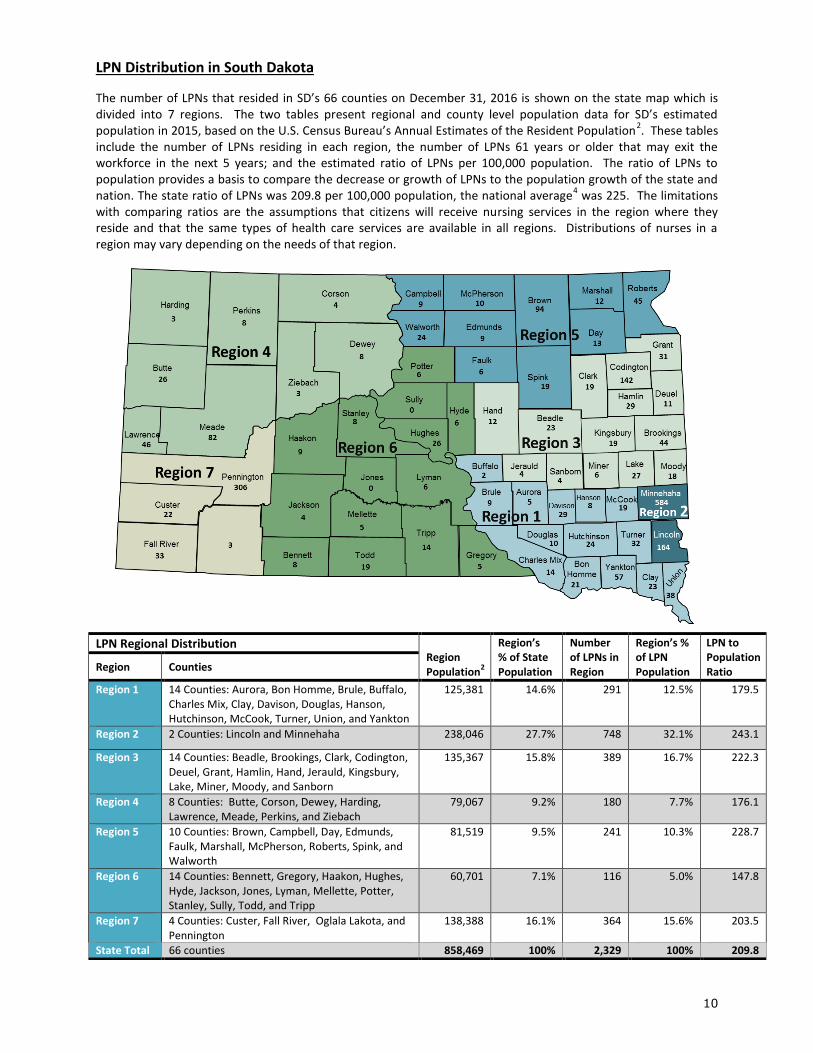
The number of LPNs that resided in SD’s 66 counties on December 31, 2016 is shown on the state map which is divided into 7 regions. The two tables present regional and county level population data for SD’s estimated population in 2015, based on the U.S. Census Bureau’s Annual Estimates of the Resident Population
2. These tables
include the number of LPNs residing in each region, the number of LPNs 61 years or older that may exit the workforce in the next 5 years; and the estimated ratio of LPNs per 100,000 population. The ratio of LPNs to population provides a basis to compare the decrease or growth of LPNs to the population growth of the state and nation. The state ratio of LPNs was 209.8 per 100,000 population, the national average
4 was 225. The limitations
with comparing ratios are the assumptions that citizens will receive nursing services in the region where they reside and that the same types of health care services are available in all regions. Distributions of nurses in a region may vary depending on the needs of that region.
LPN Regional Distribution Region Population
2
Region’s % of State Population
Number of LPNs in Region
Region’s % of LPN Population
LPN to Population Ratio Region Counties
Region 1
14 Counties: Aurora, Bon Homme, Brule, Buffalo, Charles Mix, Clay, Davison, Douglas, Hanson, Hutchinson, McCook, Turner, Union, and Yankton
125,381 14.6% 291 12.5% 179.5
Region 2 2 Counties: Lincoln and Minnehaha 238,046 27.7% 748 32.1% 243.1
Region 3
14 Counties: Beadle, Brookings, Clark, Codington, Deuel, Grant, Hamlin, Hand, Jerauld, Kingsbury, Lake, Miner, Moody, and Sanborn
135,367 15.8% 389 16.7% 222.3
Region 4
8 Counties: Butte, Corson, Dewey, Harding, Lawrence, Meade, Perkins, and Ziebach
79,067 9.2% 180 7.7% 176.1
Region 5
10 Counties: Brown, Campbell, Day, Edmunds, Faulk, Marshall, McPherson, Roberts, Spink, and Walworth
81,519 9.5% 241 10.3% 228.7
Region 6
14 Counties: Bennett, Gregory, Haakon, Hughes, Hyde, Jackson, Jones, Lyman, Mellette, Potter, Stanley, Sully, Todd, and Tripp
60,701 7.1% 116 5.0% 147.8
Region 7
4 Counties: Custer, Fall River, Oglala Lakota, and Pennington
138,388 16.1% 364 15.6% 203.5
State Total 66 counties 858,469 100% 2,329 100% 209.8
11
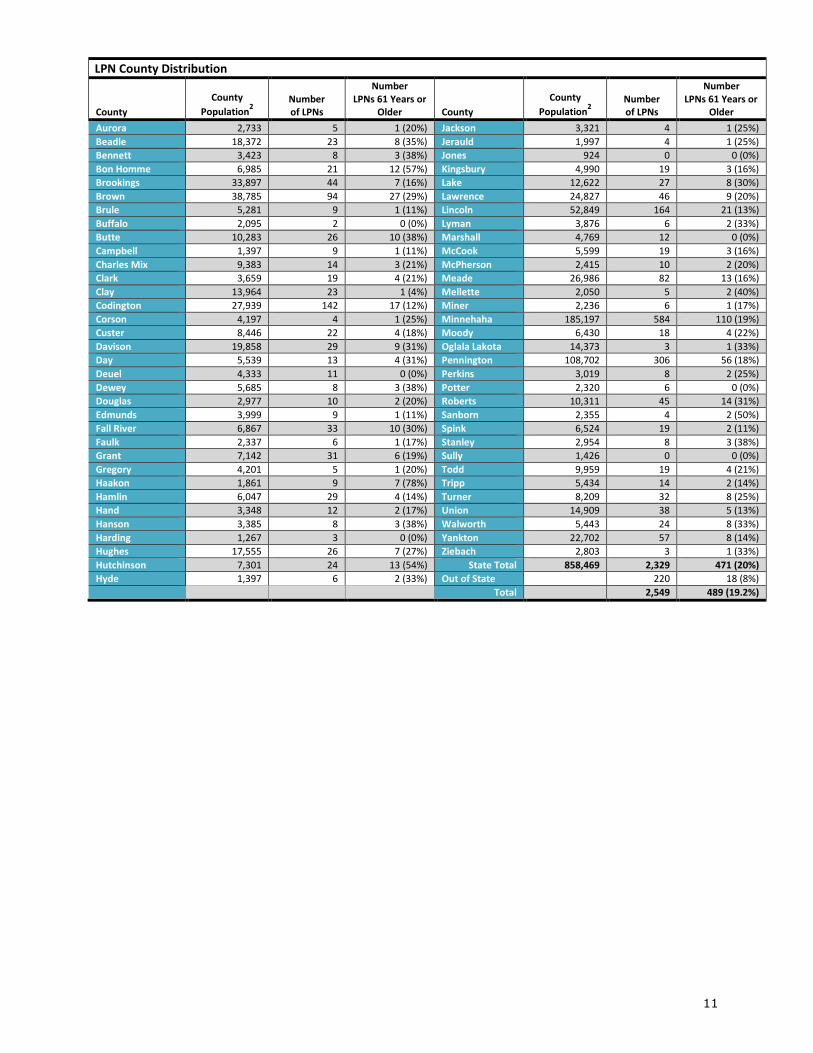
LPN County Distribution
County
County
Population2
Number of LPNs
Number LPNs 61 Years or
Older County
County
Population2
Number of LPNs
Number LPNs 61 Years or
Older
Aurora 2,733 5 1 (20%) Jackson 3,321 4 1 (25%)
Beadle 18,372 23 8 (35%) Jerauld 1,997 4 1 (25%)
Bennett 3,423 8 3 (38%) Jones 924 0 0 (0%)
Bon Homme 6,985 21 12 (57%) Kingsbury 4,990 19 3 (16%)
Brookings 33,897 44 7 (16%) Lake 12,622 27 8 (30%)
Brown 38,785 94 27 (29%) Lawrence 24,827 46 9 (20%)
Brule 5,281 9 1 (11%) Lincoln 52,849 164 21 (13%)
Buffalo 2,095 2 0 (0%) Lyman 3,876 6 2 (33%)
Butte 10,283 26 10 (38%) Marshall 4,769 12 0 (0%)
Campbell 1,397 9 1 (11%) McCook 5,599 19 3 (16%)
Charles Mix 9,383 14 3 (21%) McPherson 2,415 10 2 (20%)
Clark 3,659 19 4 (21%) Meade 26,986 82 13 (16%)
Clay 13,964 23 1 (4%) Mellette 2,050 5 2 (40%)
Codington 27,939 142 17 (12%) Miner 2,236 6 1 (17%)
Corson 4,197 4 1 (25%) Minnehaha 185,197 584 110 (19%)
Custer 8,446 22 4 (18%) Moody 6,430 18 4 (22%)
Davison 19,858 29 9 (31%) Oglala Lakota 14,373 3 1 (33%)
Day 5,539 13 4 (31%) Pennington 108,702 306 56 (18%)
Deuel 4,333 11 0 (0%) Perkins 3,019 8 2 (25%)
Dewey 5,685 8 3 (38%) Potter 2,320 6 0 (0%)
Douglas 2,977 10 2 (20%) Roberts 10,311 45 14 (31%)
Edmunds 3,999 9 1 (11%) Sanborn 2,355 4 2 (50%)
Fall River 6,867 33 10 (30%) Spink 6,524 19 2 (11%)
Faulk 2,337 6 1 (17%) Stanley 2,954 8 3 (38%)
Grant 7,142 31 6 (19%) Sully 1,426 0 0 (0%)
Gregory 4,201 5 1 (20%) Todd 9,959 19 4 (21%)
Haakon 1,861 9 7 (78%) Tripp 5,434 14 2 (14%)
Hamlin 6,047 29 4 (14%) Turner 8,209 32 8 (25%)
Hand 3,348 12 2 (17%) Union 14,909 38 5 (13%)
Hanson 3,385 8 3 (38%) Walworth 5,443 24 8 (33%)
Harding 1,267 3 0 (0%) Yankton 22,702 57 8 (14%)
Hughes 17,555 26 7 (27%) Ziebach 2,803 3 1 (33%)
Hutchinson 7,301 24 13 (54%) State Total 858,469 2,329 471 (20%)
Hyde 1,397 6 2 (33%) Out of State 220 18 (8%)
Total 2,549 489 (19.2%)
12
Registered Nurses South Dakota Supply Trends
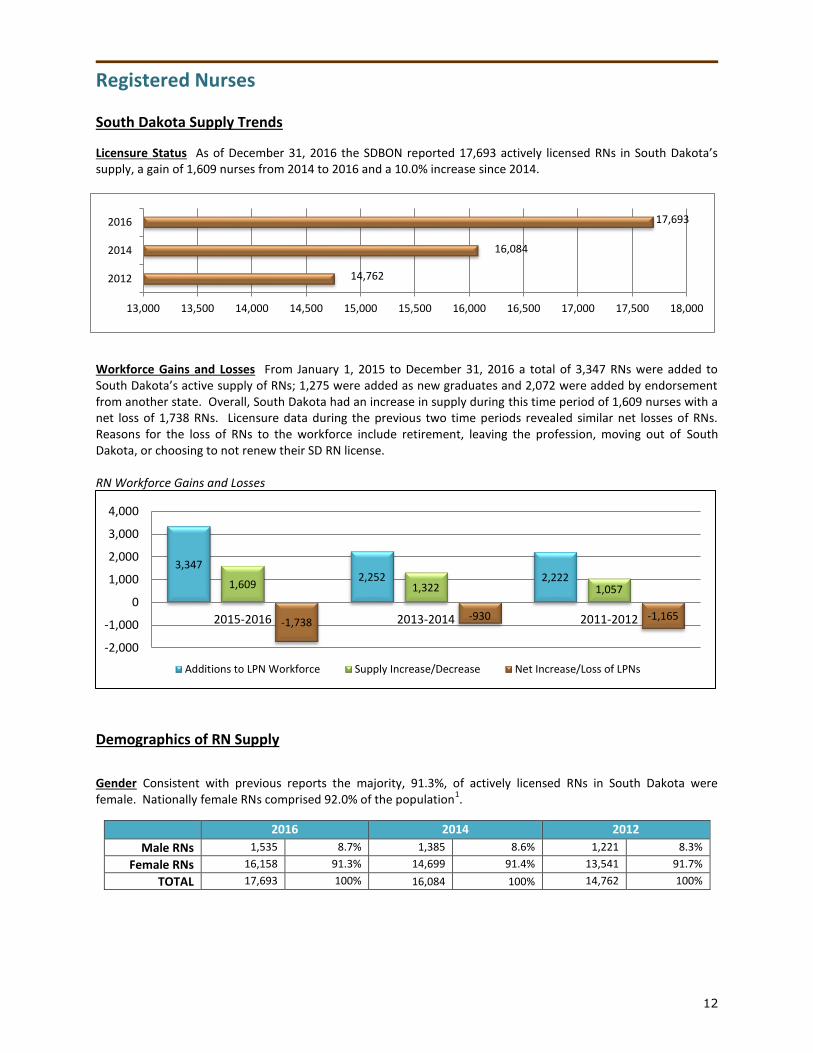
Licensure Status As of December 31, 2016 the SDBON reported 17,693 actively licensed RNs in South Dakota’s supply, a gain of 1,609 nurses from 2014 to 2016 and a 10.0% increase since 2014.
Workforce Gains and Losses From January 1, 2015 to December 31, 2016 a total of 3,347 RNs were added to South Dakota’s active supply of RNs; 1,275 were added as new graduates and 2,072 were added by endorsement from another state. Overall, South Dakota had an increase in supply during this time period of 1,609 nurses with a net loss of 1,738 RNs. Licensure data during the previous two time periods revealed similar net losses of RNs. Reasons for the loss of RNs to the workforce include retirement, leaving the profession, moving out of South Dakota, or choosing to not renew their SD RN license. RN Workforce Gains and Losses
Demographics of RN Supply
Gender Consistent with previous reports the majority, 91.3%, of actively licensed RNs in South Dakota were female. Nationally female RNs comprised 92.0% of the population
1.
2016 2014 2012
Male RNs 1,535 8.7% 1,385 8.6% 1,221 8.3%
Female RNs 16,158 91.3% 14,699 91.4% 13,541 91.7%
TOTAL 17,693 100% 16,084 100% 14,762 100%
14,762
16,084
17,693
13,000 13,500 14,000 14,500 15,000 15,500 16,000 16,500 17,000 17,500 18,000
2012
2014
2016
3,347 2,252 2,222
1,609 1,322 1,057
-1,738 -930 -1,165
-2,000
-1,000
0
1,000
2,000
3,000
4,000
2015-2016 2013-2014 2011-2012
Additions to LPN Workforce Supply Increase/Decrease Net Increase/Loss of LPNs
13
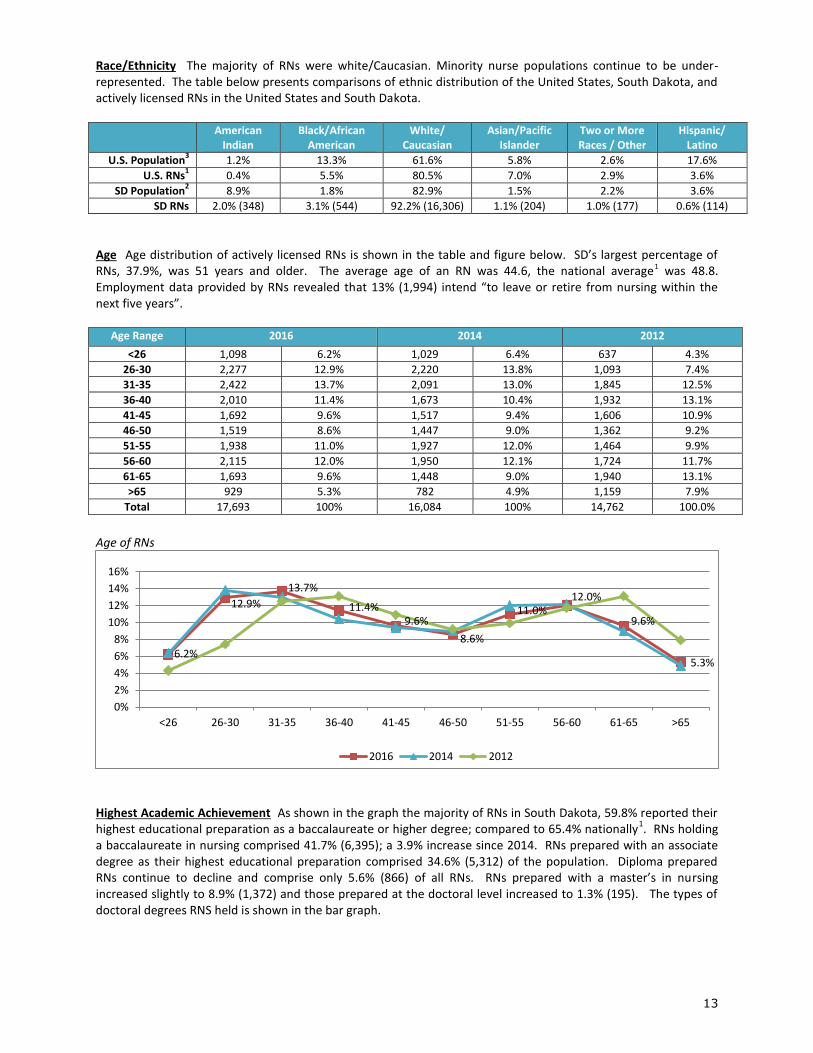
Race/Ethnicity The majority of RNs were white/Caucasian. Minority nurse populations continue to be under-represented. The table below presents comparisons of ethnic distribution of the United States, South Dakota, and actively licensed RNs in the United States and South Dakota.
American Indian
Black/African American
White/ Caucasian
Asian/Pacific Islander
Two or More Races / Other
Hispanic/ Latino
U.S. Population3 1.2% 13.3% 61.6% 5.8% 2.6% 17.6%
U.S. RNs1
0.4% 5.5% 80.5% 7.0% 2.9% 3.6%
SD Population2
8.9% 1.8% 82.9% 1.5% 2.2% 3.6%
SD RNs 2.0% (348) 3.1% (544) 92.2% (16,306) 1.1% (204) 1.0% (177) 0.6% (114)
Age Age distribution of actively licensed RNs is shown in the table and figure below. SD’s largest percentage of RNs, 37.9%, was 51 years and older. The average age of an RN was 44.6, the national average1 was 48.8.
Employment data provided by RNs revealed that 13% (1,994) intend “to leave or retire from nursing within the next five years”.
Age Range 2016 2014 2012
<26 1,098 6.2% 1,029 6.4% 637 4.3%
26-30 2,277 12.9% 2,220 13.8% 1,093 7.4%
31-35 2,422 13.7% 2,091 13.0% 1,845 12.5%
36-40 2,010 11.4% 1,673 10.4% 1,932 13.1%
41-45 1,692 9.6% 1,517 9.4% 1,606 10.9%
46-50 1,519 8.6% 1,447 9.0% 1,362 9.2%
51-55 1,938 11.0% 1,927 12.0% 1,464 9.9%
56-60 2,115 12.0% 1,950 12.1% 1,724 11.7%
61-65 1,693 9.6% 1,448 9.0% 1,940 13.1%
>65 929 5.3% 782 4.9% 1,159 7.9%
Total 17,693 100% 16,084 100% 14,762 100.0%
Age of RNs
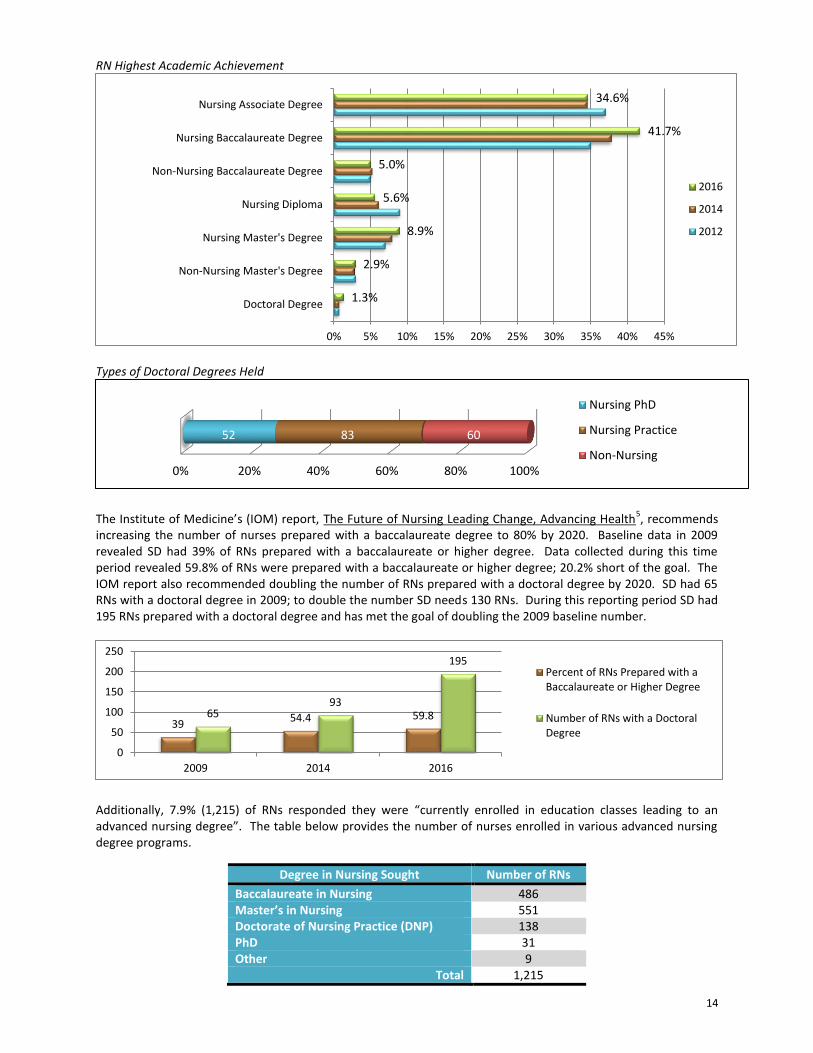
Highest Academic Achievement As shown in the graph the majority of RNs in South Dakota, 59.8% reported their highest educational preparation as a baccalaureate or higher degree; compared to 65.4% nationally
1. RNs holding
a baccalaureate in nursing comprised 41.7% (6,395); a 3.9% increase since 2014. RNs prepared with an associate degree as their highest educational preparation comprised 34.6% (5,312) of the population. Diploma prepared RNs continue to decline and comprise only 5.6% (866) of all RNs. RNs prepared with a master’s in nursing increased slightly to 8.9% (1,372) and those prepared at the doctoral level increased to 1.3% (195). The types of doctoral degrees RNS held is shown in the bar graph.
6.2%
12.9%
13.7%
11.4% 9.6%
8.6%
11.0% 12.0%
9.6%
5.3%
0%
2%
4%
6%
8%
10%
12%
14%
16%
<26 26-30 31-35 36-40 41-45 46-50 51-55 56-60 61-65 >65
2016 2014 2012
14
RN Highest Academic Achievement
Types of Doctoral Degrees Held
The Institute of Medicine’s (IOM) report, The Future of Nursing Leading Change, Advancing Health
5, recommends
increasing the number of nurses prepared with a baccalaureate degree to 80% by 2020. Baseline data in 2009 revealed SD had 39% of RNs prepared with a baccalaureate or higher degree. Data collected during this time period revealed 59.8% of RNs were prepared with a baccalaureate or higher degree; 20.2% short of the goal. The IOM report also recommended doubling the number of RNs prepared with a doctoral degree by 2020. SD had 65 RNs with a doctoral degree in 2009; to double the number SD needs 130 RNs. During this reporting period SD had 195 RNs prepared with a doctoral degree and has met the goal of doubling the 2009 baseline number.
Additionally, 7.9% (1,215) of RNs responded they were “currently enrolled in education classes leading to an advanced nursing degree”. The table below provides the number of nurses enrolled in various advanced nursing degree programs.
Degree in Nursing Sought Number of RNs
Baccalaureate in Nursing 486 Master’s in Nursing 551 Doctorate of Nursing Practice (DNP) 138 PhD 31 Other 9
Total 1,215
1.3%
2.9%
8.9%
5.6%
5.0%
41.7%
34.6%
0% 5% 10% 15% 20% 25% 30% 35% 40% 45%
Doctoral Degree
Non-Nursing Master's Degree
Nursing Master's Degree
Nursing Diploma
Non-Nursing Baccalaureate Degree
Nursing Baccalaureate Degree
Nursing Associate Degree
2016
2014
2012
0% 20% 40% 60% 80% 100%
52 83 60
Nursing PhD
Nursing Practice
Non-Nursing
39 54.4 59.8 65
93
195
0
50
100
150
200
250
2009 2014 2016
Percent of RNs Prepared with aBaccalaureate or Higher Degree
Number of RNs with a DoctoralDegree
15
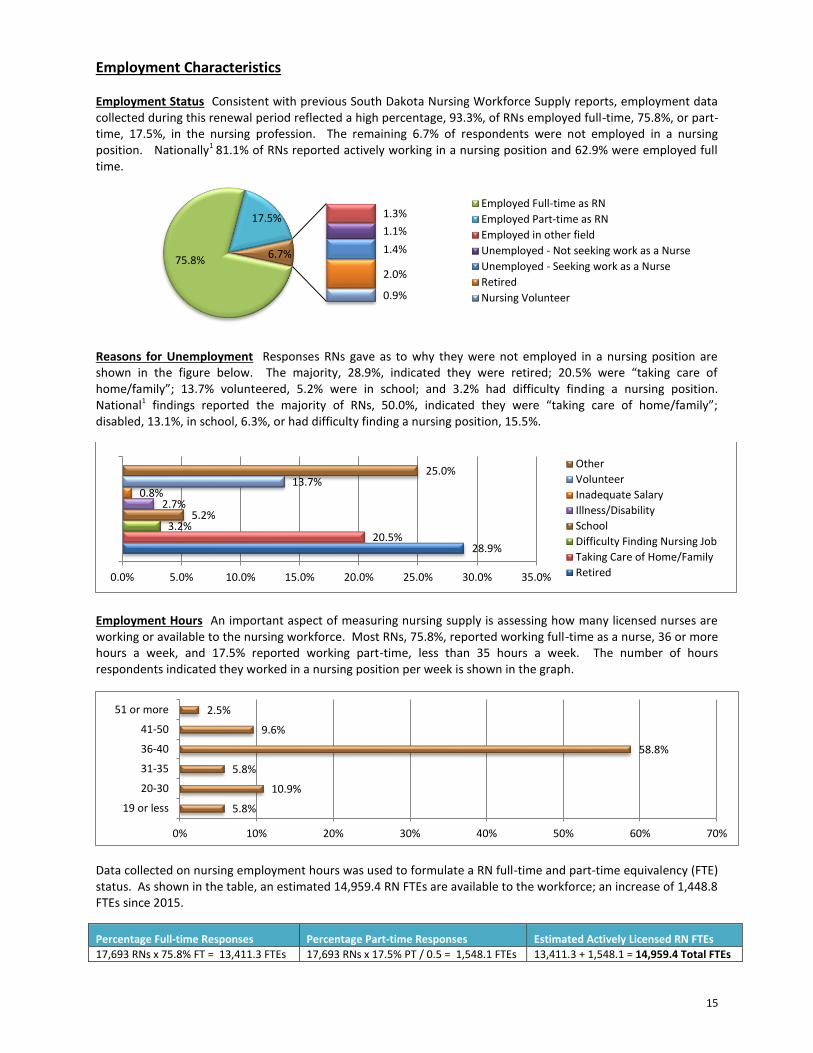
Employment Characteristics Employment Status Consistent with previous South Dakota Nursing Workforce Supply reports, employment data collected during this renewal period reflected a high percentage, 93.3%, of RNs employed full-time, 75.8%, or part-time, 17.5%, in the nursing profession. The remaining 6.7% of respondents were not employed in a nursing position. Nationally1 81.1% of RNs reported actively working in a nursing position and 62.9% were employed full time.
Reasons for Unemployment Responses RNs gave as to why they were not employed in a nursing position are shown in the figure below. The majority, 28.9%, indicated they were retired; 20.5% were “taking care of home/family”; 13.7% volunteered, 5.2% were in school; and 3.2% had difficulty finding a nursing position. National1 findings reported the majority of RNs, 50.0%, indicated they were “taking care of home/family”; disabled, 13.1%, in school, 6.3%, or had difficulty finding a nursing position, 15.5%.
Employment Hours An important aspect of measuring nursing supply is assessing how many licensed nurses are working or available to the nursing workforce. Most RNs, 75.8%, reported working full-time as a nurse, 36 or more hours a week, and 17.5% reported working part-time, less than 35 hours a week. The number of hours respondents indicated they worked in a nursing position per week is shown in the graph.
Data collected on nursing employment hours was used to formulate a RN full-time and part-time equivalency (FTE) status. As shown in the table, an estimated 14,959.4 RN FTEs are available to the workforce; an increase of 1,448.8 FTEs since 2015.
Percentage Full-time Responses Percentage Part-time Responses Estimated Actively Licensed RN FTEs
17,693 RNs x 75.8% FT = 13,411.3 FTEs 17,693 RNs x 17.5% PT / 0.5 = 1,548.1 FTEs 13,411.3 + 1,548.1 = 14,959.4 Total FTEs
75.8%
17.5% 1.3%
1.1%
1.4%
2.0%
0.9%
6.7%
Employed Full-time as RN
Employed Part-time as RN
Employed in other field
Unemployed - Not seeking work as a Nurse
Unemployed - Seeking work as a Nurse
Retired
Nursing Volunteer
28.9% 20.5%
3.2% 5.2%
2.7% 0.8%
13.7% 25.0%
0.0% 5.0% 10.0% 15.0% 20.0% 25.0% 30.0% 35.0%
Other
Volunteer
Inadequate Salary
Illness/Disability
School
Difficulty Finding Nursing Job
Taking Care of Home/Family
Retired
5.8%
10.9%
5.8%
58.8%
9.6%
2.5%
0% 10% 20% 30% 40% 50% 60% 70%
19 or less
20-30
31-35
36-40
41-50
51 or more
16
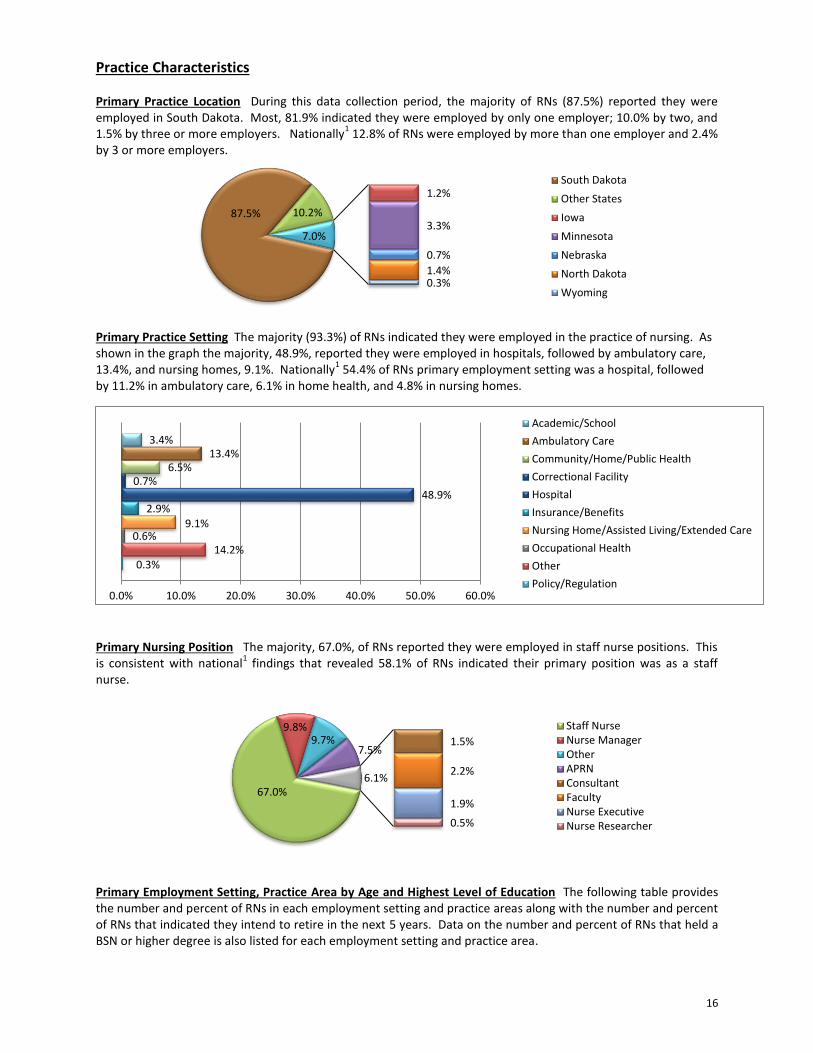
Practice Characteristics Primary Practice Location During this data collection period, the majority of RNs (87.5%) reported they were employed in South Dakota. Most, 81.9% indicated they were employed by only one employer; 10.0% by two, and 1.5% by three or more employers. Nationally
1 12.8% of RNs were employed by more than one employer and 2.4%
by 3 or more employers.
Primary Practice Setting The majority (93.3%) of RNs indicated they were employed in the practice of nursing. As shown in the graph the majority, 48.9%, reported they were employed in hospitals, followed by ambulatory care, 13.4%, and nursing homes, 9.1%. Nationally
1 54.4% of RNs primary employment setting was a hospital, followed
by 11.2% in ambulatory care, 6.1% in home health, and 4.8% in nursing homes.
Primary Nursing Position The majority, 67.0%, of RNs reported they were employed in staff nurse positions. This is consistent with national
1 findings that revealed 58.1% of RNs indicated their primary position was as a staff
nurse.
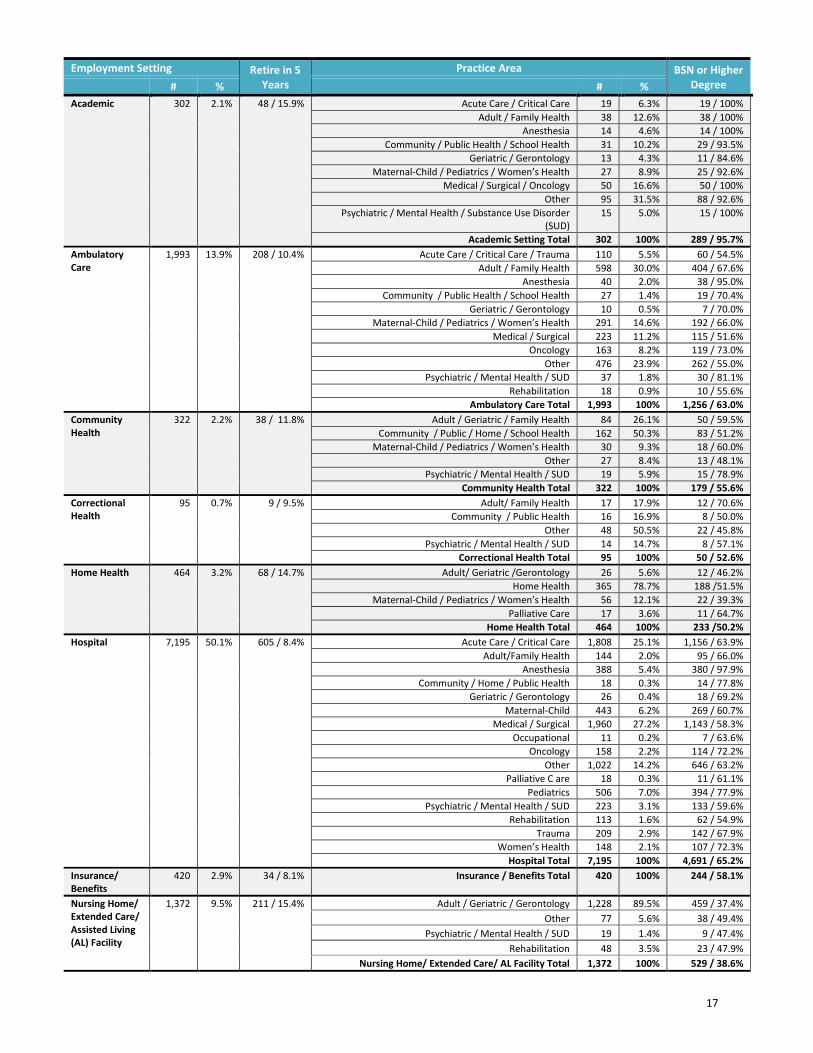
Primary Employment Setting, Practice Area by Age and Highest Level of Education The following table provides the number and percent of RNs in each employment setting and practice areas along with the number and percent of RNs that indicated they intend to retire in the next 5 years. Data on the number and percent of RNs that held a BSN or higher degree is also listed for each employment setting and practice area.
87.5% 10.2%
1.2%
3.3%
0.7%
1.4% 0.3%
7.0%
South Dakota
Other States
Iowa
Minnesota
Nebraska
North Dakota
Wyoming
0.3% 14.2%
0.6% 9.1%
2.9% 48.9%
0.7% 6.5%
13.4% 3.4%
0.0% 10.0% 20.0% 30.0% 40.0% 50.0% 60.0%
Academic/School
Ambulatory Care
Community/Home/Public Health
Correctional Facility
Hospital
Insurance/Benefits
Nursing Home/Assisted Living/Extended Care
Occupational Health
Other
Policy/Regulation
67.0%
9.8% 9.7%
7.5% 1.5%
2.2%
1.9%
0.5%
6.1%
Staff NurseNurse ManagerOtherAPRNConsultantFacultyNurse ExecutiveNurse Researcher
17
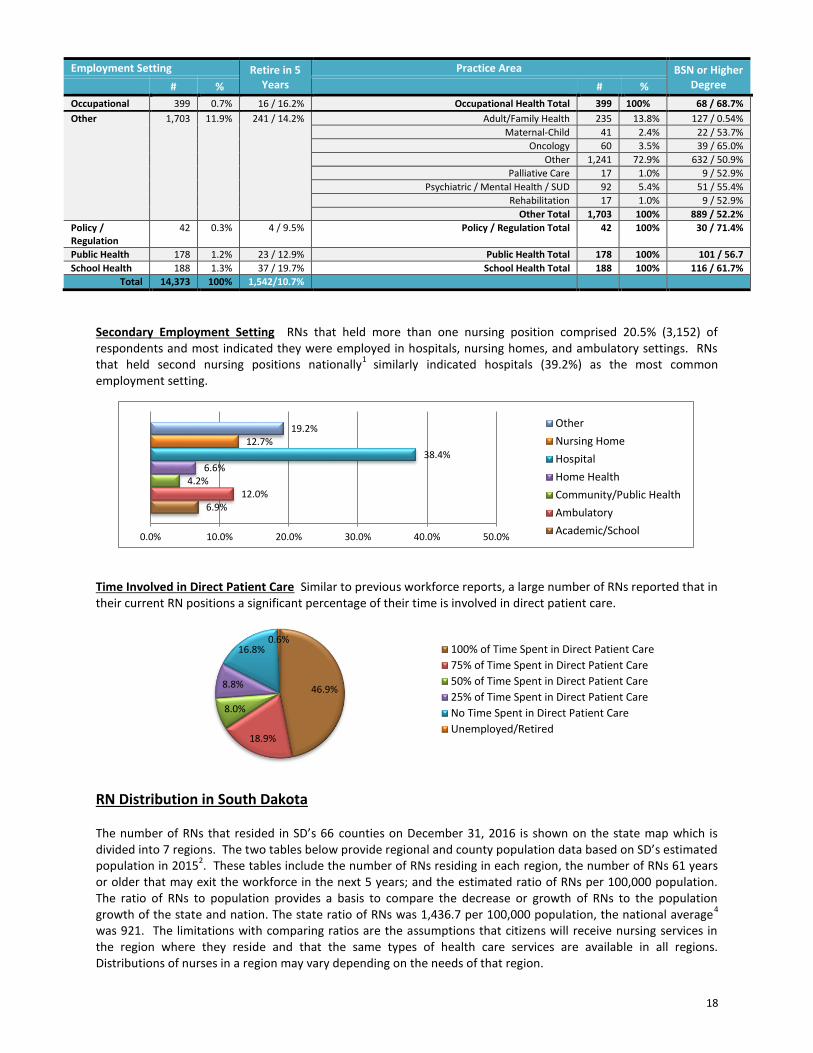
Employment Setting Retire in 5 Years
Practice Area BSN or Higher Degree # % # %
Academic 302 2.1% 48 / 15.9% Acute Care / Critical Care 19 6.3% 19 / 100%
Adult / Family Health 38 12.6% 38 / 100%
Anesthesia 14 4.6% 14 / 100%
Community / Public Health / School Health 31 10.2% 29 / 93.5%
Geriatric / Gerontology 13 4.3% 11 / 84.6%
Maternal-Child / Pediatrics / Women’s Health 27 8.9% 25 / 92.6%
Medical / Surgical / Oncology 50 16.6% 50 / 100%
Other 95 31.5% 88 / 92.6%
Psychiatric / Mental Health / Substance Use Disorder (SUD)
15 5.0% 15 / 100%
Academic Setting Total 302 100% 289 / 95.7%
Ambulatory Care
1,993 13.9% 208 / 10.4% Acute Care / Critical Care / Trauma 110 5.5% 60 / 54.5%
Adult / Family Health 598 30.0% 404 / 67.6%
Anesthesia 40 2.0% 38 / 95.0%
Community / Public Health / School Health 27 1.4% 19 / 70.4%
Geriatric / Gerontology 10 0.5% 7 / 70.0%
Maternal-Child / Pediatrics / Women’s Health 291 14.6% 192 / 66.0%
Medical / Surgical 223 11.2% 115 / 51.6%
Oncology 163 8.2% 119 / 73.0%
Other 476 23.9% 262 / 55.0%
Psychiatric / Mental Health / SUD 37 1.8% 30 / 81.1%
Rehabilitation 18 0.9% 10 / 55.6%
Ambulatory Care Total 1,993 100% 1,256 / 63.0%
Community Health
322 2.2% 38 / 11.8% Adult / Geriatric / Family Health 84 26.1% 50 / 59.5%
Community / Public / Home / School Health 162 50.3% 83 / 51.2%
Maternal-Child / Pediatrics / Women’s Health 30 9.3% 18 / 60.0%
Other 27 8.4% 13 / 48.1%
Psychiatric / Mental Health / SUD 19 5.9% 15 / 78.9%
Community Health Total 322 100% 179 / 55.6%
Correctional Health
95 0.7% 9 / 9.5% Adult/ Family Health 17 17.9% 12 / 70.6%
Community / Public Health 16 16.9% 8 / 50.0%
Other 48 50.5% 22 / 45.8%
Psychiatric / Mental Health / SUD 14 14.7% 8 / 57.1%
Correctional Health Total 95 100% 50 / 52.6%
Home Health 464 3.2% 68 / 14.7% Adult/ Geriatric /Gerontology 26 5.6% 12 / 46.2%
Home Health 365 78.7% 188 /51.5%
Maternal-Child / Pediatrics / Women’s Health 56 12.1% 22 / 39.3%
Palliative Care 17 3.6% 11 / 64.7%
Home Health Total 464 100% 233 /50.2%
Hospital 7,195 50.1% 605 / 8.4% Acute Care / Critical Care 1,808 25.1% 1,156 / 63.9%
Adult/Family Health 144 2.0% 95 / 66.0%
Anesthesia 388 5.4% 380 / 97.9%
Community / Home / Public Health 18 0.3% 14 / 77.8%
Geriatric / Gerontology 26 0.4% 18 / 69.2%
Maternal-Child 443 6.2% 269 / 60.7%
Medical / Surgical 1,960 27.2% 1,143 / 58.3%
Occupational 11 0.2% 7 / 63.6%
Oncology 158 2.2% 114 / 72.2%
Other 1,022 14.2% 646 / 63.2%
Palliative C are 18 0.3% 11 / 61.1%
Pediatrics 506 7.0% 394 / 77.9%
Psychiatric / Mental Health / SUD 223 3.1% 133 / 59.6%
Rehabilitation 113 1.6% 62 / 54.9%
Trauma 209 2.9% 142 / 67.9%
Women’s Health 148 2.1% 107 / 72.3%
Hospital Total 7,195 100% 4,691 / 65.2%
Insurance/ Benefits
420 2.9% 34 / 8.1% Insurance / Benefits Total 420 100% 244 / 58.1%
Nursing Home/ Extended Care/ Assisted Living (AL) Facility
1,372 9.5% 211 / 15.4% Adult / Geriatric / Gerontology 1,228 89.5% 459 / 37.4%
Other 77 5.6% 38 / 49.4%
Psychiatric / Mental Health / SUD 19 1.4% 9 / 47.4%
Rehabilitation 48 3.5% 23 / 47.9%
Nursing Home/ Extended Care/ AL Facility Total 1,372 100% 529 / 38.6%
18
Employment Setting Retire in 5 Years
Practice Area BSN or Higher Degree # % # %
Occupational 399 0.7% 16 / 16.2% Occupational Health Total 399 100% 68 / 68.7%
Other 1,703 11.9% 241 / 14.2% Adult/Family Health 235 13.8% 127 / 0.54%
Maternal-Child 41 2.4% 22 / 53.7%
Oncology 60 3.5% 39 / 65.0%
Other 1,241 72.9% 632 / 50.9%
Palliative Care 17 1.0% 9 / 52.9%
Psychiatric / Mental Health / SUD 92 5.4% 51 / 55.4%
Rehabilitation 17 1.0% 9 / 52.9%
Other Total 1,703 100% 889 / 52.2%
Policy / Regulation
42 0.3% 4 / 9.5% Policy / Regulation Total 42 100% 30 / 71.4%
Public Health 178 1.2% 23 / 12.9% Public Health Total 178 100% 101 / 56.7
School Health 188 1.3% 37 / 19.7% School Health Total 188 100% 116 / 61.7%
Total 14,373 100% 1,542/10.7%
Secondary Employment Setting RNs that held more than one nursing position comprised 20.5% (3,152) of respondents and most indicated they were employed in hospitals, nursing homes, and ambulatory settings. RNs that held second nursing positions nationally
1 similarly indicated hospitals (39.2%) as the most common
employment setting.
Time Involved in Direct Patient Care Similar to previous workforce reports, a large number of RNs reported that in their current RN positions a significant percentage of their time is involved in direct patient care.
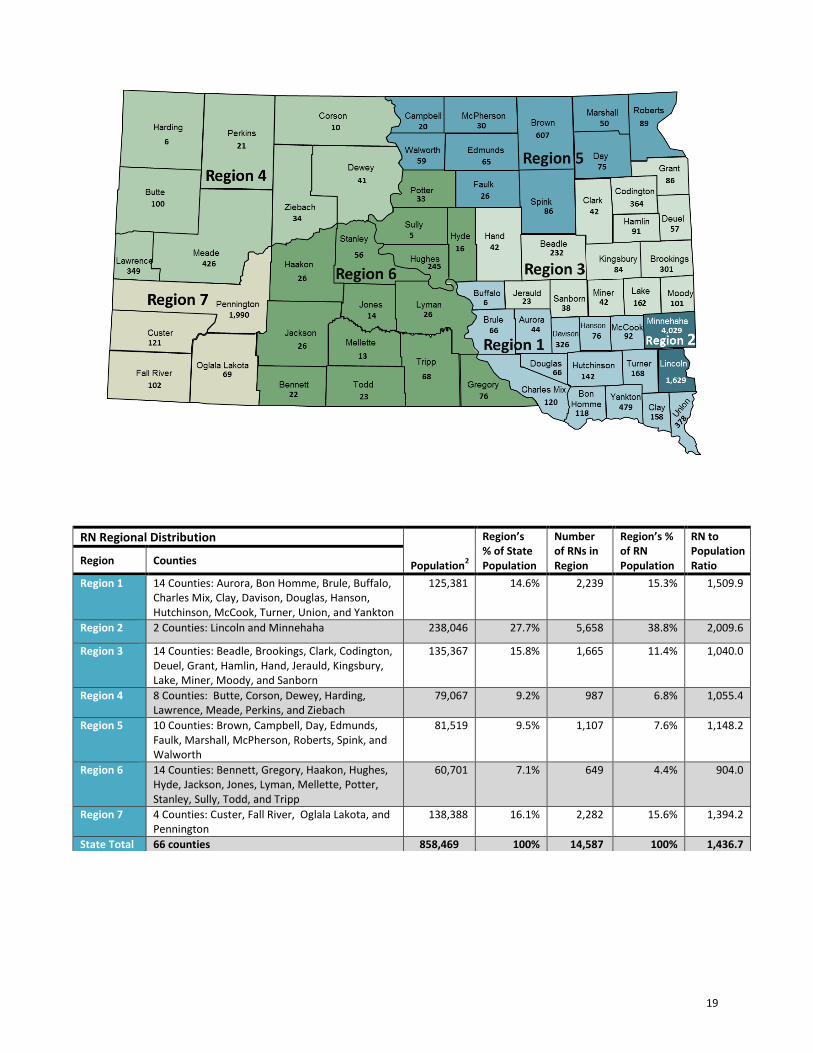
RN Distribution in South Dakota The number of RNs that resided in SD’s 66 counties on December 31, 2016 is shown on the state map which is divided into 7 regions. The two tables below provide regional and county population data based on SD’s estimated population in 2015
2. These tables include the number of RNs residing in each region, the number of RNs 61 years
or older that may exit the workforce in the next 5 years; and the estimated ratio of RNs per 100,000 population. The ratio of RNs to population provides a basis to compare the decrease or growth of RNs to the population growth of the state and nation. The state ratio of RNs was 1,436.7 per 100,000 population, the national average
4
was 921. The limitations with comparing ratios are the assumptions that citizens will receive nursing services in the region where they reside and that the same types of health care services are available in all regions. Distributions of nurses in a region may vary depending on the needs of that region.
6.9% 12.0%
4.2% 6.6%
38.4% 12.7%
19.2%
0.0% 10.0% 20.0% 30.0% 40.0% 50.0%
Other
Nursing Home
Hospital
Home Health
Community/Public Health
Ambulatory
Academic/School
46.9%
18.9%
8.0%
8.8%
16.8% 0.6%
100% of Time Spent in Direct Patient Care
75% of Time Spent in Direct Patient Care
50% of Time Spent in Direct Patient Care
25% of Time Spent in Direct Patient Care
No Time Spent in Direct Patient Care
Unemployed/Retired
19
RN Regional Distribution Population
2
Region’s % of State Population
Number of RNs in Region
Region’s % of RN Population
RN to Population Ratio Region Counties
Region 1
14 Counties: Aurora, Bon Homme, Brule, Buffalo, Charles Mix, Clay, Davison, Douglas, Hanson, Hutchinson, McCook, Turner, Union, and Yankton
125,381 14.6% 2,239 15.3% 1,509.9
Region 2 2 Counties: Lincoln and Minnehaha 238,046 27.7% 5,658 38.8% 2,009.6
Region 3
14 Counties: Beadle, Brookings, Clark, Codington, Deuel, Grant, Hamlin, Hand, Jerauld, Kingsbury, Lake, Miner, Moody, and Sanborn
135,367 15.8% 1,665 11.4% 1,040.0
Region 4
8 Counties: Butte, Corson, Dewey, Harding, Lawrence, Meade, Perkins, and Ziebach
79,067 9.2% 987 6.8% 1,055.4
Region 5
10 Counties: Brown, Campbell, Day, Edmunds, Faulk, Marshall, McPherson, Roberts, Spink, and Walworth
81,519 9.5% 1,107 7.6% 1,148.2
Region 6
14 Counties: Bennett, Gregory, Haakon, Hughes, Hyde, Jackson, Jones, Lyman, Mellette, Potter, Stanley, Sully, Todd, and Tripp
60,701 7.1% 649 4.4% 904.0
Region 7
4 Counties: Custer, Fall River, Oglala Lakota, and Pennington
138,388 16.1% 2,282 15.6% 1,394.2
State Total 66 counties 858,469 100% 14,587 100% 1,436.7
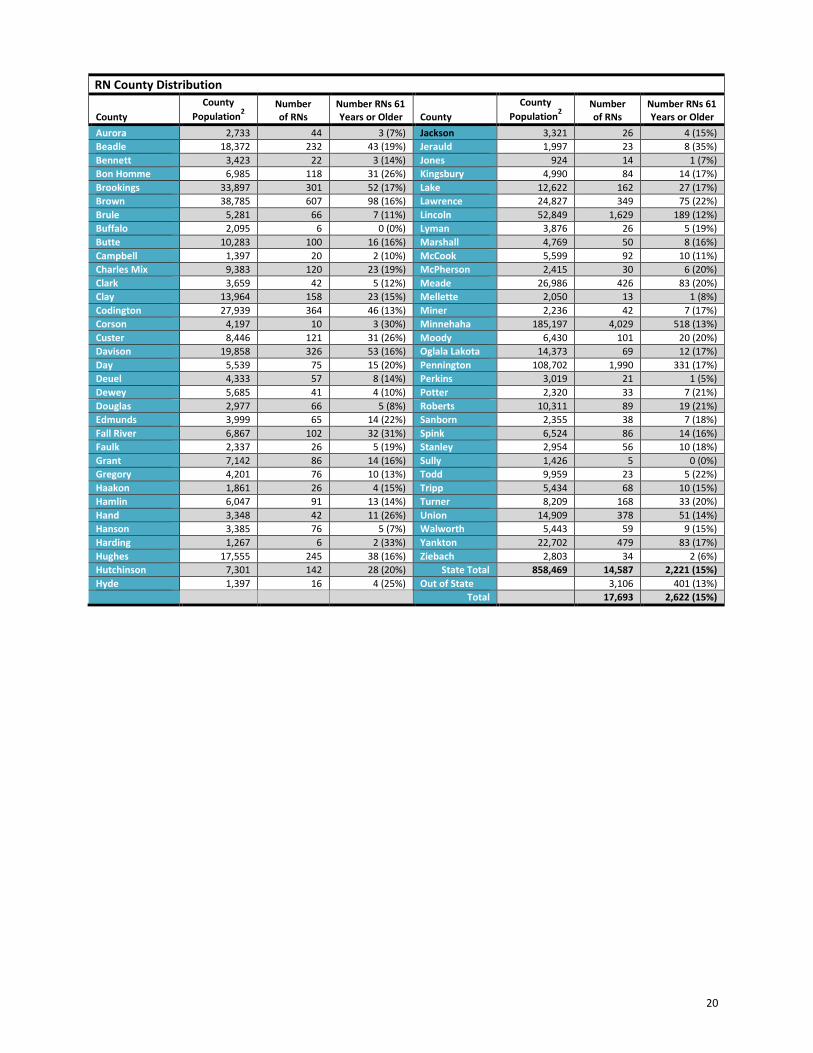
20
RN County Distribution
County
County
Population2
Number of RNs
Number RNs 61 Years or Older County
County
Population2
Number of RNs
Number RNs 61 Years or Older
Aurora 2,733 44 3 (7%) Jackson 3,321 26 4 (15%)
Beadle 18,372 232 43 (19%) Jerauld 1,997 23 8 (35%)
Bennett 3,423 22 3 (14%) Jones 924 14 1 (7%)
Bon Homme 6,985 118 31 (26%) Kingsbury 4,990 84 14 (17%)
Brookings 33,897 301 52 (17%) Lake 12,622 162 27 (17%)
Brown 38,785 607 98 (16%) Lawrence 24,827 349 75 (22%)
Brule 5,281 66 7 (11%) Lincoln 52,849 1,629 189 (12%)
Buffalo 2,095 6 0 (0%) Lyman 3,876 26 5 (19%)
Butte 10,283 100 16 (16%) Marshall 4,769 50 8 (16%)
Campbell 1,397 20 2 (10%) McCook 5,599 92 10 (11%)
Charles Mix 9,383 120 23 (19%) McPherson 2,415 30 6 (20%)
Clark 3,659 42 5 (12%) Meade 26,986 426 83 (20%)
Clay 13,964 158 23 (15%) Mellette 2,050 13 1 (8%)
Codington 27,939 364 46 (13%) Miner 2,236 42 7 (17%)
Corson 4,197 10 3 (30%) Minnehaha 185,197 4,029 518 (13%)
Custer 8,446 121 31 (26%) Moody 6,430 101 20 (20%)
Davison 19,858 326 53 (16%) Oglala Lakota 14,373 69 12 (17%)
Day 5,539 75 15 (20%) Pennington 108,702 1,990 331 (17%)
Deuel 4,333 57 8 (14%) Perkins 3,019 21 1 (5%)
Dewey 5,685 41 4 (10%) Potter 2,320 33 7 (21%)
Douglas 2,977 66 5 (8%) Roberts 10,311 89 19 (21%)
Edmunds 3,999 65 14 (22%) Sanborn 2,355 38 7 (18%)
Fall River 6,867 102 32 (31%) Spink 6,524 86 14 (16%)
Faulk 2,337 26 5 (19%) Stanley 2,954 56 10 (18%)
Grant 7,142 86 14 (16%) Sully 1,426 5 0 (0%)
Gregory 4,201 76 10 (13%) Todd 9,959 23 5 (22%)
Haakon 1,861 26 4 (15%) Tripp 5,434 68 10 (15%)
Hamlin 6,047 91 13 (14%) Turner 8,209 168 33 (20%)
Hand 3,348 42 11 (26%) Union 14,909 378 51 (14%)
Hanson 3,385 76 5 (7%) Walworth 5,443 59 9 (15%)
Harding 1,267 6 2 (33%) Yankton 22,702 479 83 (17%)
Hughes 17,555 245 38 (16%) Ziebach 2,803 34 2 (6%)
Hutchinson 7,301 142 28 (20%) State Total 858,469 14,587 2,221 (15%)
Hyde 1,397 16 4 (25%) Out of State 3,106 401 (13%)
Total 17,693 2,622 (15%)
21
Advanced Practice Registered Nurses
Certified Nurse Midwives
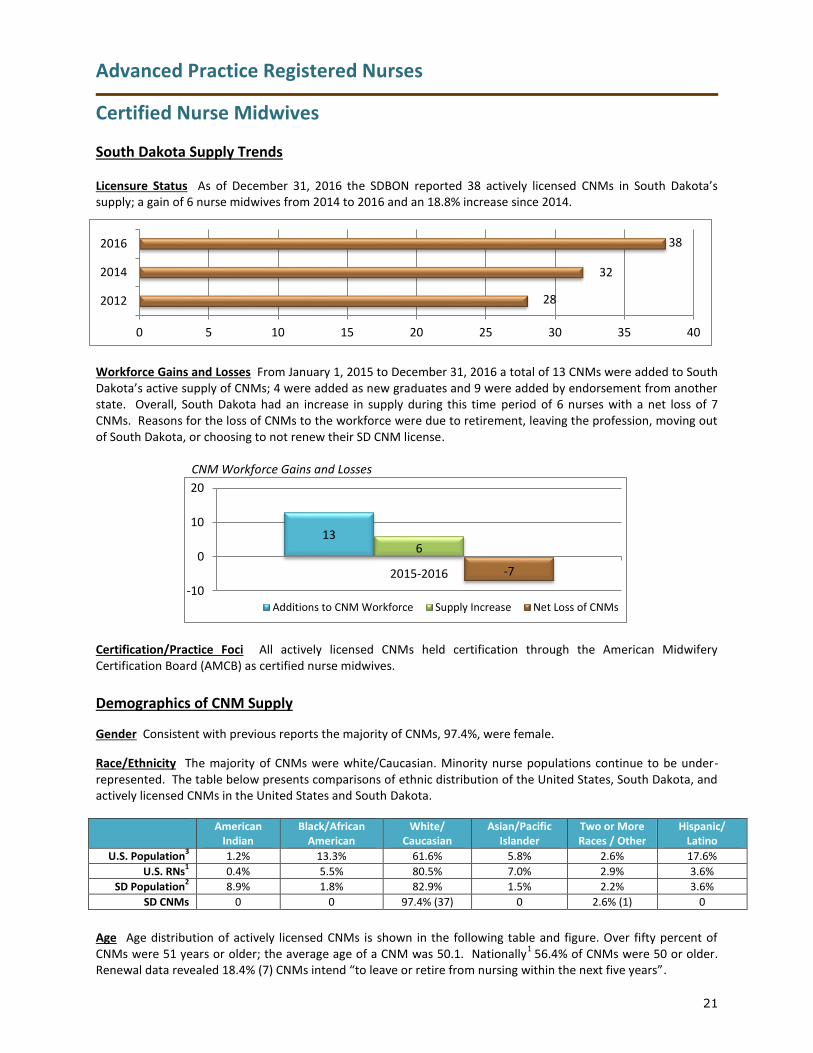
South Dakota Supply Trends Licensure Status As of December 31, 2016 the SDBON reported 38 actively licensed CNMs in South Dakota’s supply; a gain of 6 nurse midwives from 2014 to 2016 and an 18.8% increase since 2014.
Workforce Gains and Losses From January 1, 2015 to December 31, 2016 a total of 13 CNMs were added to South Dakota’s active supply of CNMs; 4 were added as new graduates and 9 were added by endorsement from another state. Overall, South Dakota had an increase in supply during this time period of 6 nurses with a net loss of 7 CNMs. Reasons for the loss of CNMs to the workforce were due to retirement, leaving the profession, moving out of South Dakota, or choosing to not renew their SD CNM license.
CNM Workforce Gains and Losses
Certification/Practice Foci All actively licensed CNMs held certification through the American Midwifery Certification Board (AMCB) as certified nurse midwives.
Demographics of CNM Supply
Gender Consistent with previous reports the majority of CNMs, 97.4%, were female.
Race/Ethnicity The majority of CNMs were white/Caucasian. Minority nurse populations continue to be under-represented. The table below presents comparisons of ethnic distribution of the United States, South Dakota, and actively licensed CNMs in the United States and South Dakota.
American Indian
Black/African American
White/ Caucasian
Asian/Pacific Islander
Two or More Races / Other
Hispanic/ Latino
U.S. Population3 1.2% 13.3% 61.6% 5.8% 2.6% 17.6%
U.S. RNs1
0.4% 5.5% 80.5% 7.0% 2.9% 3.6%
SD Population2
8.9% 1.8% 82.9% 1.5% 2.2% 3.6%
SD CNMs 0 0 97.4% (37) 0 2.6% (1) 0
Age Age distribution of actively licensed CNMs is shown in the following table and figure. Over fifty percent of CNMs were 51 years or older; the average age of a CNM was 50.1. Nationally
1 56.4% of CNMs were 50 or older.
Renewal data revealed 18.4% (7) CNMs intend “to leave or retire from nursing within the next five years”.
28
32
38
0 5 10 15 20 25 30 35 40
2012
2014
2016
13 6
-7
-10
0
10
20
2015-2016
Additions to CNM Workforce Supply Increase Net Loss of CNMs
22
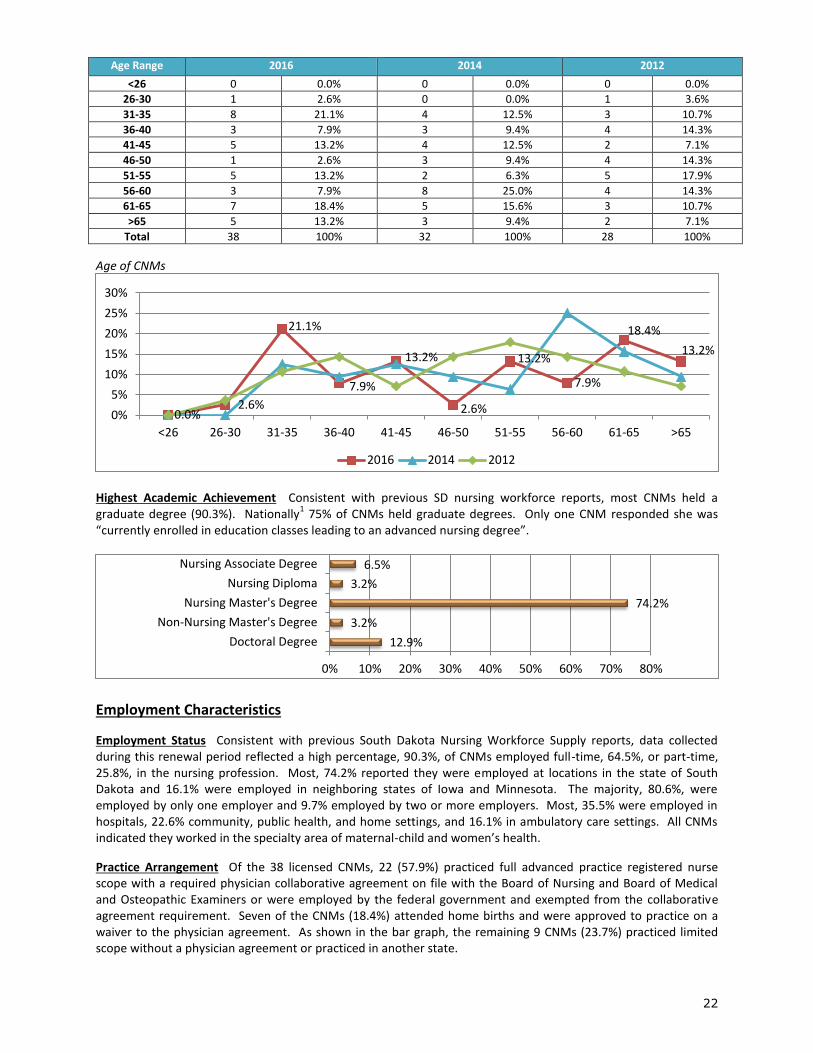
Age Range 2016 2014 2012
<26 0 0.0% 0 0.0% 0 0.0%
26-30 1 2.6% 0 0.0% 1 3.6%
31-35 8 21.1% 4 12.5% 3 10.7%
36-40 3 7.9% 3 9.4% 4 14.3%
41-45 5 13.2% 4 12.5% 2 7.1%
46-50 1 2.6% 3 9.4% 4 14.3%
51-55 5 13.2% 2 6.3% 5 17.9%
56-60 3 7.9% 8 25.0% 4 14.3%
61-65 7 18.4% 5 15.6% 3 10.7%
>65 5 13.2% 3 9.4% 2 7.1%
Total 38 100% 32 100% 28 100%
Age of CNMs
Highest Academic Achievement Consistent with previous SD nursing workforce reports, most CNMs held a graduate degree (90.3%). Nationally
1 75% of CNMs held graduate degrees. Only one CNM responded she was
“currently enrolled in education classes leading to an advanced nursing degree”.
Employment Characteristics
Employment Status Consistent with previous South Dakota Nursing Workforce Supply reports, data collected during this renewal period reflected a high percentage, 90.3%, of CNMs employed full-time, 64.5%, or part-time, 25.8%, in the nursing profession. Most, 74.2% reported they were employed at locations in the state of South Dakota and 16.1% were employed in neighboring states of Iowa and Minnesota. The majority, 80.6%, were employed by only one employer and 9.7% employed by two or more employers. Most, 35.5% were employed in hospitals, 22.6% community, public health, and home settings, and 16.1% in ambulatory care settings. All CNMs indicated they worked in the specialty area of maternal-child and women’s health.
Practice Arrangement Of the 38 licensed CNMs, 22 (57.9%) practiced full advanced practice registered nurse scope with a required physician collaborative agreement on file with the Board of Nursing and Board of Medical and Osteopathic Examiners or were employed by the federal government and exempted from the collaborative agreement requirement. Seven of the CNMs (18.4%) attended home births and were approved to practice on a waiver to the physician agreement. As shown in the bar graph, the remaining 9 CNMs (23.7%) practiced limited scope without a physician agreement or practiced in another state.
0.0% 2.6%
21.1%
7.9%
13.2%
2.6%
13.2%
7.9%
18.4%
13.2%
0%
5%
10%
15%
20%
25%
30%
<26 26-30 31-35 36-40 41-45 46-50 51-55 56-60 61-65 >65
2016 2014 2012
12.9%
3.2%
74.2%
3.2%
6.5%
0% 10% 20% 30% 40% 50% 60% 70% 80%
Doctoral Degree
Non-Nursing Master's Degree
Nursing Master's Degree
Nursing Diploma
Nursing Associate Degree

23
CNM Practice Arrangement
CNM Distribution in South Dakota
The number of CNMs who resided in SD’s 66 counties on December 31, 2016 is shown on the state map which is divided into 7 regions. The table provides regional population data based on SD’s estimated population in 20152. (The 15 CNMs who resided outside of South Dakota were not included.)
23.7% 57.9%
18.4%
0.0% 10.0% 20.0% 30.0% 40.0% 50.0% 60.0% 70.0%
Perform Out-of-Hospital Births - Waiver of Physician Collaborative Agreement on FilePerform Full APRN Scope - Approved Physician Collaborative Agreement on File (or Federally Exempted)Perform Limited Advanced Nursing Practice Only - No Physician Agreement on File
CNM Regional Distribution Population
2
Region’s % of State Population
Number of CNMs in Region
Region’s % of CNM Population Region Counties
Region 1
14 Counties: Aurora, Bon Homme, Brule, Buffalo, Charles Mix, Clay, Davison, Douglas, Hanson, Hutchinson, McCook, Turner, Union, and Yankton
125,381 14.6% 1 4.3%
Region 2 2 Counties: Lincoln and Minnehaha 238,046 27.7% 12 52.2%
Region 3
14 Counties: Beadle, Brookings, Clark, Codington, Deuel, Grant, Hamlin, Hand, Jerauld, Kingsbury, Lake, Miner, Moody, and Sanborn
135,367 15.8% 0 0.0%
Region 4
8 Counties: Butte, Corson, Dewey, Harding, Lawrence, Meade, Perkins, and Ziebach
79,067 9.2% 0 0.0%
Region 5
10 Counties: Brown, Campbell, Day, Edmunds, Faulk, Marshall, McPherson, Roberts, Spink, and Walworth
81,519 9.5% 1 4.3%
Region 6
14 Counties: Bennett, Gregory, Haakon, Hughes, Hyde, Jackson, Jones, Lyman, Mellette, Potter, Stanley, Sully, Todd, and Tripp
60,701 7.1% 0 0.0%
Region 7
4 Counties: Custer, Fall River, Oglala Lakota, and Pennington
138,388 16.1% 9 39.1%
State Total 66 counties 858,469 100% 23 100%
24
Advanced Practice Registered Nurses
Certified Nurse Practitioners
South Dakota Supply Trends
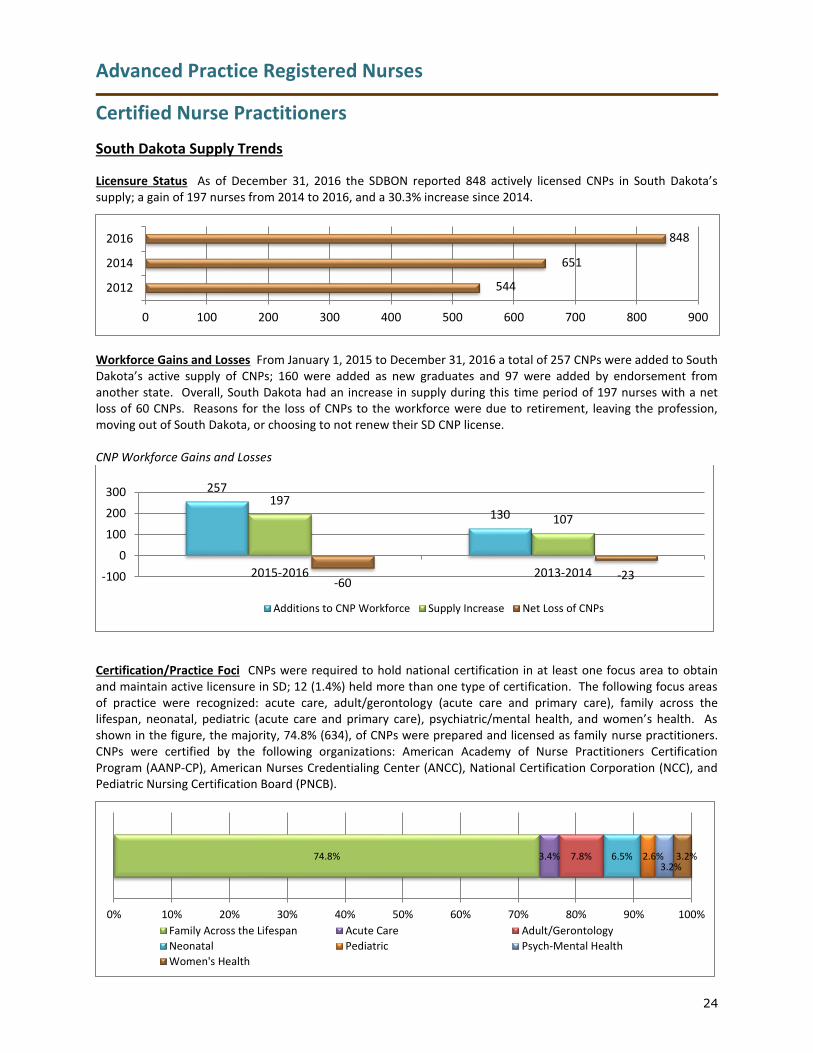
Licensure Status As of December 31, 2016 the SDBON reported 848 actively licensed CNPs in South Dakota’s supply; a gain of 197 nurses from 2014 to 2016, and a 30.3% increase since 2014.
Workforce Gains and Losses From January 1, 2015 to December 31, 2016 a total of 257 CNPs were added to South Dakota’s active supply of CNPs; 160 were added as new graduates and 97 were added by endorsement from another state. Overall, South Dakota had an increase in supply during this time period of 197 nurses with a net loss of 60 CNPs. Reasons for the loss of CNPs to the workforce were due to retirement, leaving the profession, moving out of South Dakota, or choosing to not renew their SD CNP license. CNP Workforce Gains and Losses
Certification/Practice Foci CNPs were required to hold national certification in at least one focus area to obtain and maintain active licensure in SD; 12 (1.4%) held more than one type of certification. The following focus areas of practice were recognized: acute care, adult/gerontology (acute care and primary care), family across the lifespan, neonatal, pediatric (acute care and primary care), psychiatric/mental health, and women’s health. As shown in the figure, the majority, 74.8% (634), of CNPs were prepared and licensed as family nurse practitioners. CNPs were certified by the following organizations: American Academy of Nurse Practitioners Certification Program (AANP-CP), American Nurses Credentialing Center (ANCC), National Certification Corporation (NCC), and Pediatric Nursing Certification Board (PNCB).
544
651
848
0 100 200 300 400 500 600 700 800 900
2012
2014
2016
257
130 197
107
-60 -23 -100
0
100
200
300
2015-2016 2013-2014
Additions to CNP Workforce Supply Increase Net Loss of CNPs
74.8% 3.4% 7.8% 6.5% 2.6% 3.2%
3.2%
0% 10% 20% 30% 40% 50% 60% 70% 80% 90% 100%
Family Across the Lifespan Acute Care Adult/Gerontology
Neonatal Pediatric Psych-Mental Health
Women's Health
25
Demographics of CNP Supply
Gender Consistent with previous reports the majority of CNPs, 93.4%, were female; 6.6% male.
Race/Ethnicity The majority of CNPs were white/Caucasian. Minority nurse populations continue to be under-represented. The table below presents comparisons of ethnic distribution of the United States, South Dakota, and actively licensed CNPs in the United States and South Dakota.
American Indian
Black/African American
White/ Caucasian
Asian/Pacific Islander
Two or More Races / Other
Hispanic/ Latino
U.S. Population3 1.2% 13.3% 61.6% 5.8% 2.6% 17.6%
U.S. RNs1
0.4% 5.5% 80.5% 7.0% 2.9% 3.6%
SD Population2
8.9% 1.8% 82.9% 1.5% 2.2% 3.6%
SD CNPs 1.3% (11) 1.1% (9) 96.0% (814) 0.6% (5) 0.7% (6) 0.4% (3)
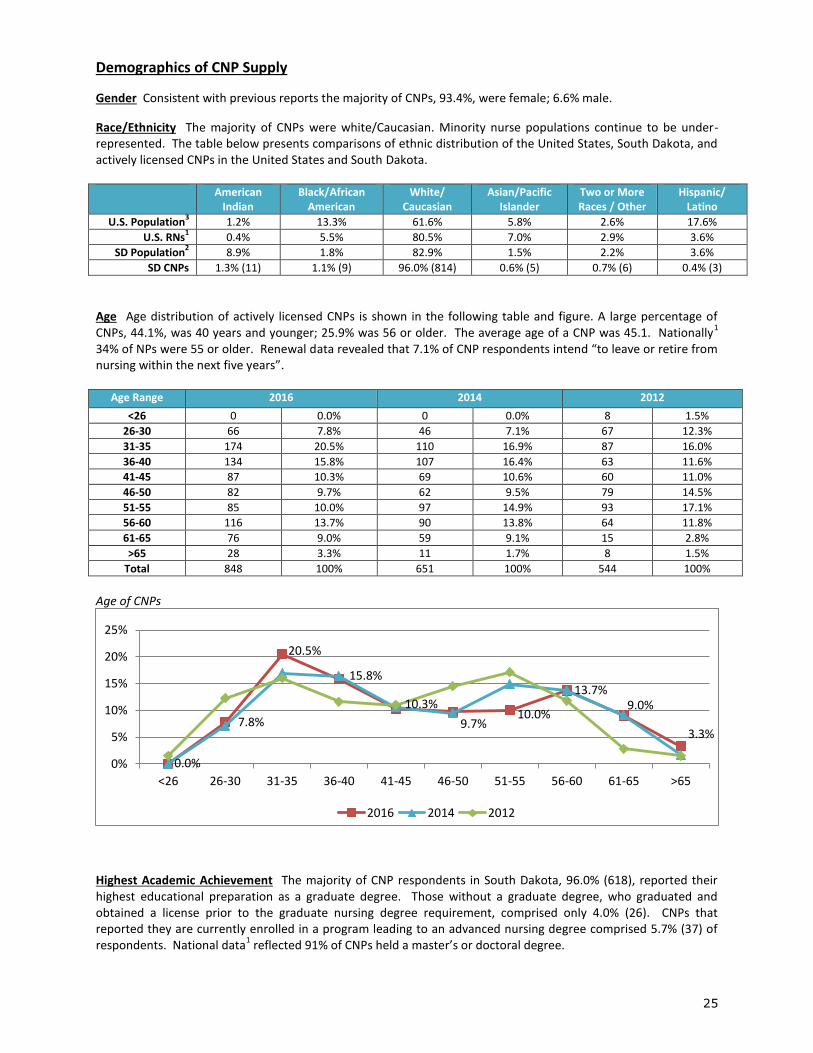
Age Age distribution of actively licensed CNPs is shown in the following table and figure. A large percentage of CNPs, 44.1%, was 40 years and younger; 25.9% was 56 or older. The average age of a CNP was 45.1. Nationally
1
34% of NPs were 55 or older. Renewal data revealed that 7.1% of CNP respondents intend “to leave or retire from nursing within the next five years”.
Age Range 2016 2014 2012
<26 0 0.0% 0 0.0% 8 1.5%
26-30 66 7.8% 46 7.1% 67 12.3%
31-35 174 20.5% 110 16.9% 87 16.0%
36-40 134 15.8% 107 16.4% 63 11.6%
41-45 87 10.3% 69 10.6% 60 11.0%
46-50 82 9.7% 62 9.5% 79 14.5%
51-55 85 10.0% 97 14.9% 93 17.1%
56-60 116 13.7% 90 13.8% 64 11.8%
61-65 76 9.0% 59 9.1% 15 2.8%
>65 28 3.3% 11 1.7% 8 1.5%
Total 848 100% 651 100% 544 100%
Age of CNPs
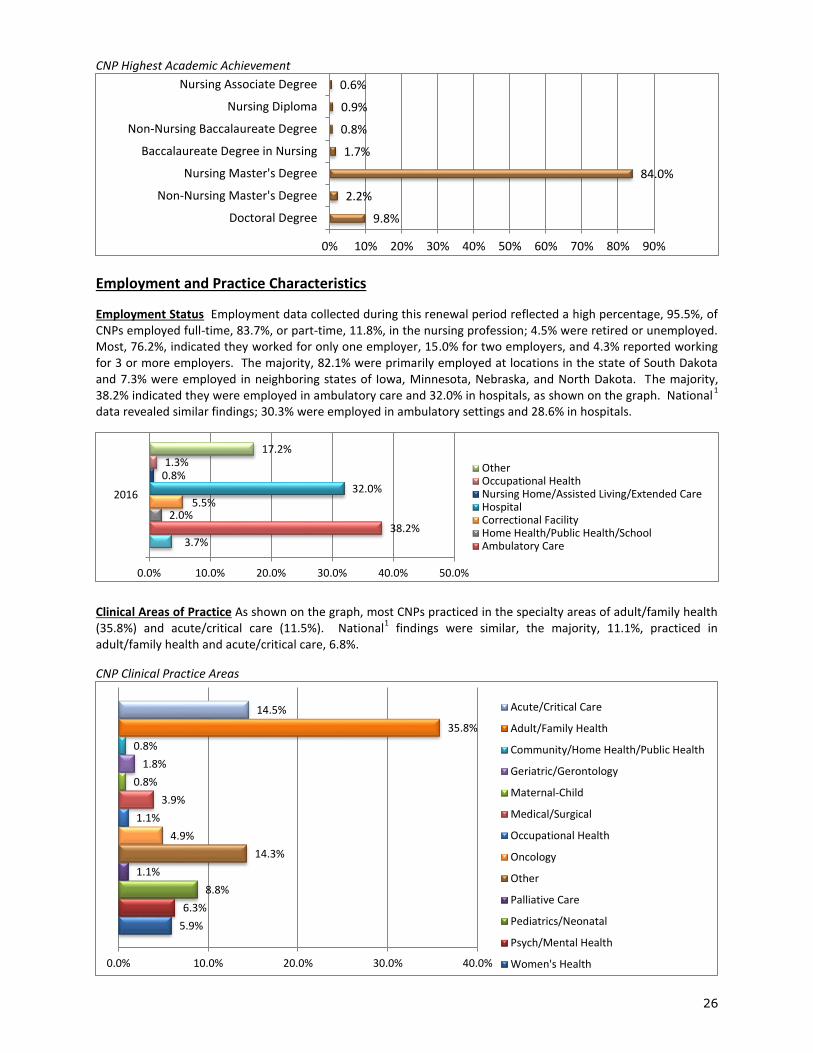
Highest Academic Achievement The majority of CNP respondents in South Dakota, 96.0% (618), reported their highest educational preparation as a graduate degree. Those without a graduate degree, who graduated and obtained a license prior to the graduate nursing degree requirement, comprised only 4.0% (26). CNPs that reported they are currently enrolled in a program leading to an advanced nursing degree comprised 5.7% (37) of respondents. National data
1 reflected 91% of CNPs held a master’s or doctoral degree.
0.0%
7.8%
20.5%
15.8%
10.3%
9.7% 10.0%
13.7% 9.0%
3.3%
0%
5%
10%
15%
20%
25%
<26 26-30 31-35 36-40 41-45 46-50 51-55 56-60 61-65 >65
2016 2014 2012
26
CNP Highest Academic Achievement
Employment and Practice Characteristics
Employment Status Employment data collected during this renewal period reflected a high percentage, 95.5%, of CNPs employed full-time, 83.7%, or part-time, 11.8%, in the nursing profession; 4.5% were retired or unemployed. Most, 76.2%, indicated they worked for only one employer, 15.0% for two employers, and 4.3% reported working for 3 or more employers. The majority, 82.1% were primarily employed at locations in the state of South Dakota and 7.3% were employed in neighboring states of Iowa, Minnesota, Nebraska, and North Dakota. The majority, 38.2% indicated they were employed in ambulatory care and 32.0% in hospitals, as shown on the graph. National
1
data revealed similar findings; 30.3% were employed in ambulatory settings and 28.6% in hospitals.
Clinical Areas of Practice As shown on the graph, most CNPs practiced in the specialty areas of adult/family health (35.8%) and acute/critical care (11.5%). National
1 findings were similar, the majority, 11.1%, practiced in
adult/family health and acute/critical care, 6.8%.
CNP Clinical Practice Areas
9.8%
2.2%
84.0%
1.7%
0.8%
0.9%
0.6%
0% 10% 20% 30% 40% 50% 60% 70% 80% 90%
Doctoral Degree
Non-Nursing Master's Degree
Nursing Master's Degree
Baccalaureate Degree in Nursing
Non-Nursing Baccalaureate Degree
Nursing Diploma
Nursing Associate Degree
3.7% 38.2%
2.0% 5.5%
32.0% 0.8% 1.3%
17.2%
0.0% 10.0% 20.0% 30.0% 40.0% 50.0%
2016
OtherOccupational HealthNursing Home/Assisted Living/Extended CareHospitalCorrectional FacilityHome Health/Public Health/SchoolAmbulatory Care
5.9%
6.3%
8.8%
1.1%
14.3%
4.9%
1.1%
3.9%
0.8%
1.8%
0.8%
35.8%
14.5%
0.0% 10.0% 20.0% 30.0% 40.0%
Acute/Critical Care
Adult/Family Health
Community/Home Health/Public Health
Geriatric/Gerontology
Maternal-Child
Medical/Surgical
Occupational Health
Oncology
Other
Palliative Care
Pediatrics/Neonatal
Psych/Mental Health
Women's Health
27
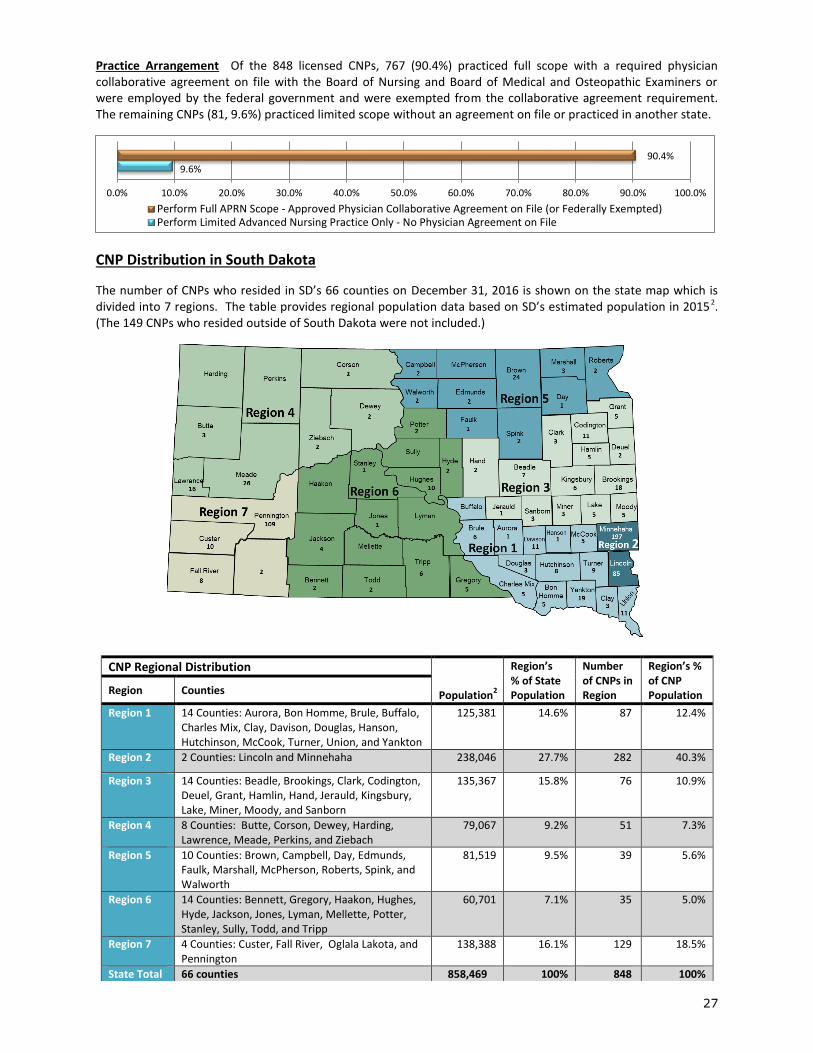
Practice Arrangement Of the 848 licensed CNPs, 767 (90.4%) practiced full scope with a required physician collaborative agreement on file with the Board of Nursing and Board of Medical and Osteopathic Examiners or were employed by the federal government and were exempted from the collaborative agreement requirement. The remaining CNPs (81, 9.6%) practiced limited scope without an agreement on file or practiced in another state.
CNP Distribution in South Dakota
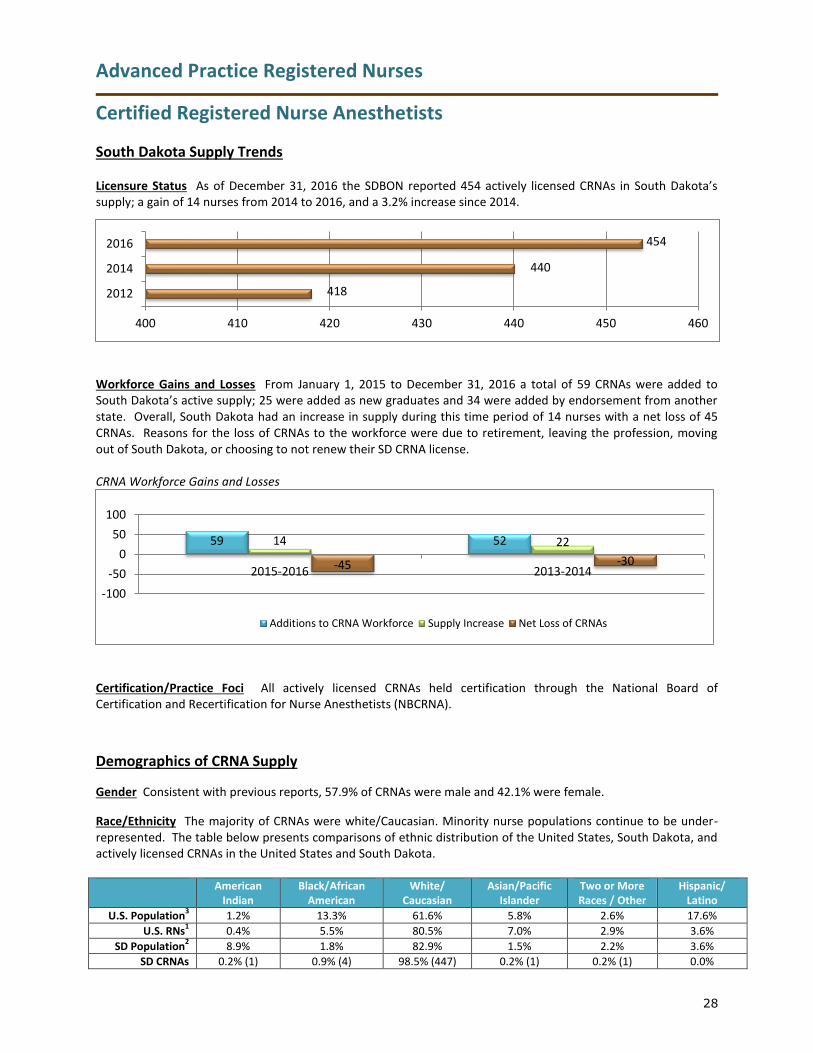
The number of CNPs who resided in SD’s 66 counties on December 31, 2016 is shown on the state map which is divided into 7 regions. The table provides regional population data based on SD’s estimated population in 20152. (The 149 CNPs who resided outside of South Dakota were not included.)
9.6% 90.4%
0.0% 10.0% 20.0% 30.0% 40.0% 50.0% 60.0% 70.0% 80.0% 90.0% 100.0%
Perform Full APRN Scope - Approved Physician Collaborative Agreement on File (or Federally Exempted)Perform Limited Advanced Nursing Practice Only - No Physician Agreement on File
CNP Regional Distribution Population
2
Region’s % of State Population
Number of CNPs in Region
Region’s % of CNP Population Region Counties
Region 1
14 Counties: Aurora, Bon Homme, Brule, Buffalo, Charles Mix, Clay, Davison, Douglas, Hanson, Hutchinson, McCook, Turner, Union, and Yankton
125,381 14.6% 87 12.4%
Region 2 2 Counties: Lincoln and Minnehaha 238,046 27.7% 282 40.3%
Region 3
14 Counties: Beadle, Brookings, Clark, Codington, Deuel, Grant, Hamlin, Hand, Jerauld, Kingsbury, Lake, Miner, Moody, and Sanborn
135,367 15.8% 76 10.9%
Region 4
8 Counties: Butte, Corson, Dewey, Harding, Lawrence, Meade, Perkins, and Ziebach
79,067 9.2% 51 7.3%
Region 5
10 Counties: Brown, Campbell, Day, Edmunds, Faulk, Marshall, McPherson, Roberts, Spink, and Walworth
81,519 9.5% 39 5.6%
Region 6
14 Counties: Bennett, Gregory, Haakon, Hughes, Hyde, Jackson, Jones, Lyman, Mellette, Potter, Stanley, Sully, Todd, and Tripp
60,701 7.1% 35 5.0%
Region 7
4 Counties: Custer, Fall River, Oglala Lakota, and Pennington
138,388 16.1% 129 18.5%
State Total 66 counties 858,469 100% 848 100%
28
Advanced Practice Registered Nurses
Certified Registered Nurse Anesthetists
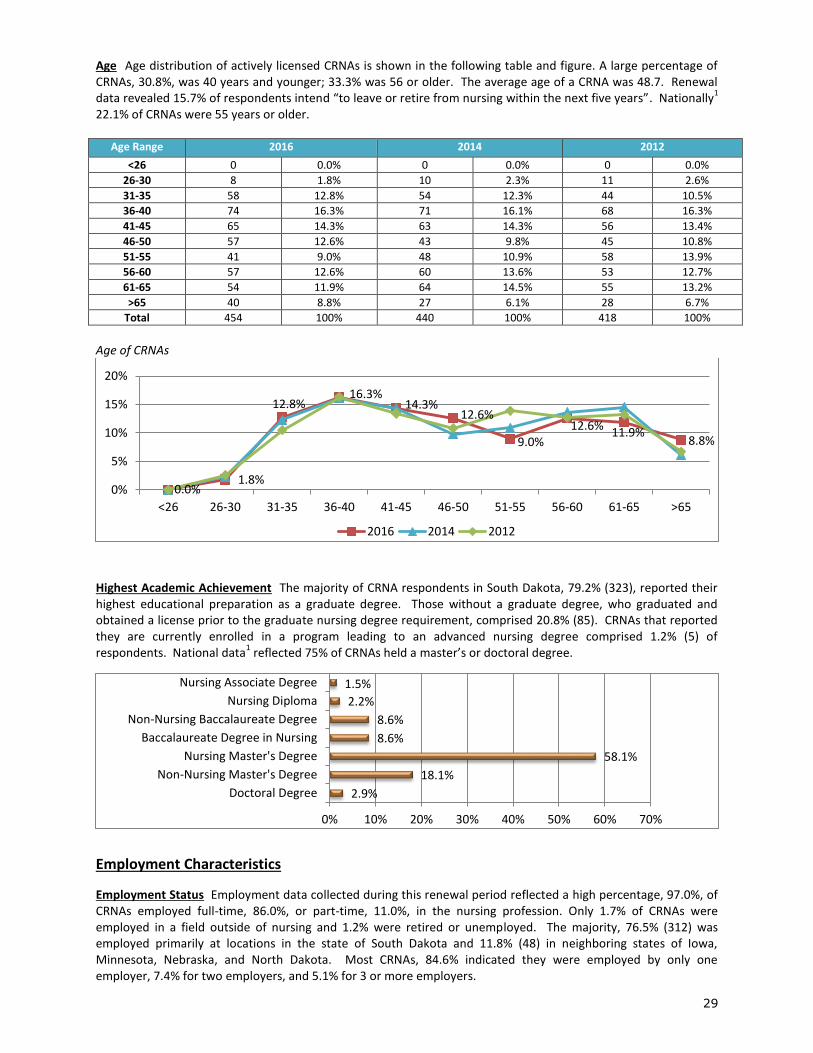
South Dakota Supply Trends Licensure Status As of December 31, 2016 the SDBON reported 454 actively licensed CRNAs in South Dakota’s supply; a gain of 14 nurses from 2014 to 2016, and a 3.2% increase since 2014.
Workforce Gains and Losses From January 1, 2015 to December 31, 2016 a total of 59 CRNAs were added to South Dakota’s active supply; 25 were added as new graduates and 34 were added by endorsement from another state. Overall, South Dakota had an increase in supply during this time period of 14 nurses with a net loss of 45 CRNAs. Reasons for the loss of CRNAs to the workforce were due to retirement, leaving the profession, moving out of South Dakota, or choosing to not renew their SD CRNA license. CRNA Workforce Gains and Losses
Certification/Practice Foci All actively licensed CRNAs held certification through the National Board of Certification and Recertification for Nurse Anesthetists (NBCRNA).
Demographics of CRNA Supply
Gender Consistent with previous reports, 57.9% of CRNAs were male and 42.1% were female.
Race/Ethnicity The majority of CRNAs were white/Caucasian. Minority nurse populations continue to be under-represented. The table below presents comparisons of ethnic distribution of the United States, South Dakota, and actively licensed CRNAs in the United States and South Dakota.
American Indian
Black/African American
White/ Caucasian
Asian/Pacific Islander
Two or More Races / Other
Hispanic/ Latino
U.S. Population3 1.2% 13.3% 61.6% 5.8% 2.6% 17.6%
U.S. RNs1
0.4% 5.5% 80.5% 7.0% 2.9% 3.6%
SD Population2
8.9% 1.8% 82.9% 1.5% 2.2% 3.6%
SD CRNAs 0.2% (1) 0.9% (4) 98.5% (447) 0.2% (1) 0.2% (1) 0.0%
418
440
454
400 410 420 430 440 450 460
2012
2014
2016
59 52 14 22
-45 -30
-100
-50
0
50
100
2015-2016 2013-2014
Additions to CRNA Workforce Supply Increase Net Loss of CRNAs
29
Age Age distribution of actively licensed CRNAs is shown in the following table and figure. A large percentage of CRNAs, 30.8%, was 40 years and younger; 33.3% was 56 or older. The average age of a CRNA was 48.7. Renewal data revealed 15.7% of respondents intend “to leave or retire from nursing within the next five years”. Nationally
1
22.1% of CRNAs were 55 years or older.
Age Range 2016 2014 2012
<26 0 0.0% 0 0.0% 0 0.0%
26-30 8 1.8% 10 2.3% 11 2.6%
31-35 58 12.8% 54 12.3% 44 10.5%
36-40 74 16.3% 71 16.1% 68 16.3%
41-45 65 14.3% 63 14.3% 56 13.4%
46-50 57 12.6% 43 9.8% 45 10.8%
51-55 41 9.0% 48 10.9% 58 13.9%
56-60 57 12.6% 60 13.6% 53 12.7%
61-65 54 11.9% 64 14.5% 55 13.2%
>65 40 8.8% 27 6.1% 28 6.7%
Total 454 100% 440 100% 418 100%
Age of CRNAs
Highest Academic Achievement The majority of CRNA respondents in South Dakota, 79.2% (323), reported their highest educational preparation as a graduate degree. Those without a graduate degree, who graduated and obtained a license prior to the graduate nursing degree requirement, comprised 20.8% (85). CRNAs that reported they are currently enrolled in a program leading to an advanced nursing degree comprised 1.2% (5) of respondents. National data
1 reflected 75% of CRNAs held a master’s or doctoral degree.
Employment Characteristics
Employment Status Employment data collected during this renewal period reflected a high percentage, 97.0%, of CRNAs employed full-time, 86.0%, or part-time, 11.0%, in the nursing profession. Only 1.7% of CRNAs were employed in a field outside of nursing and 1.2% were retired or unemployed. The majority, 76.5% (312) was employed primarily at locations in the state of South Dakota and 11.8% (48) in neighboring states of Iowa, Minnesota, Nebraska, and North Dakota. Most CRNAs, 84.6% indicated they were employed by only one employer, 7.4% for two employers, and 5.1% for 3 or more employers.
0.0% 1.8%
12.8% 16.3%
14.3% 12.6%
9.0% 12.6%
11.9% 8.8%
0%
5%
10%
15%
20%
<26 26-30 31-35 36-40 41-45 46-50 51-55 56-60 61-65 >65
2016 2014 2012
2.9%
18.1%
58.1%
8.6%
8.6%
2.2%
1.5%
0% 10% 20% 30% 40% 50% 60% 70%
Doctoral Degree
Non-Nursing Master's Degree
Nursing Master's Degree
Baccalaureate Degree in Nursing
Non-Nursing Baccalaureate Degree
Nursing Diploma
Nursing Associate Degree
30
Hospitals employed the majority (85.1% 347) of CRNAs in the specialty area of anesthesia. Ambulatory care settings employed 7.9% (32) and academia employed 2.0% (8). Nationally
1 81.8% were employed in hospitals and
12.0% in ambulatory settings.
CRNA Distribution in South Dakota
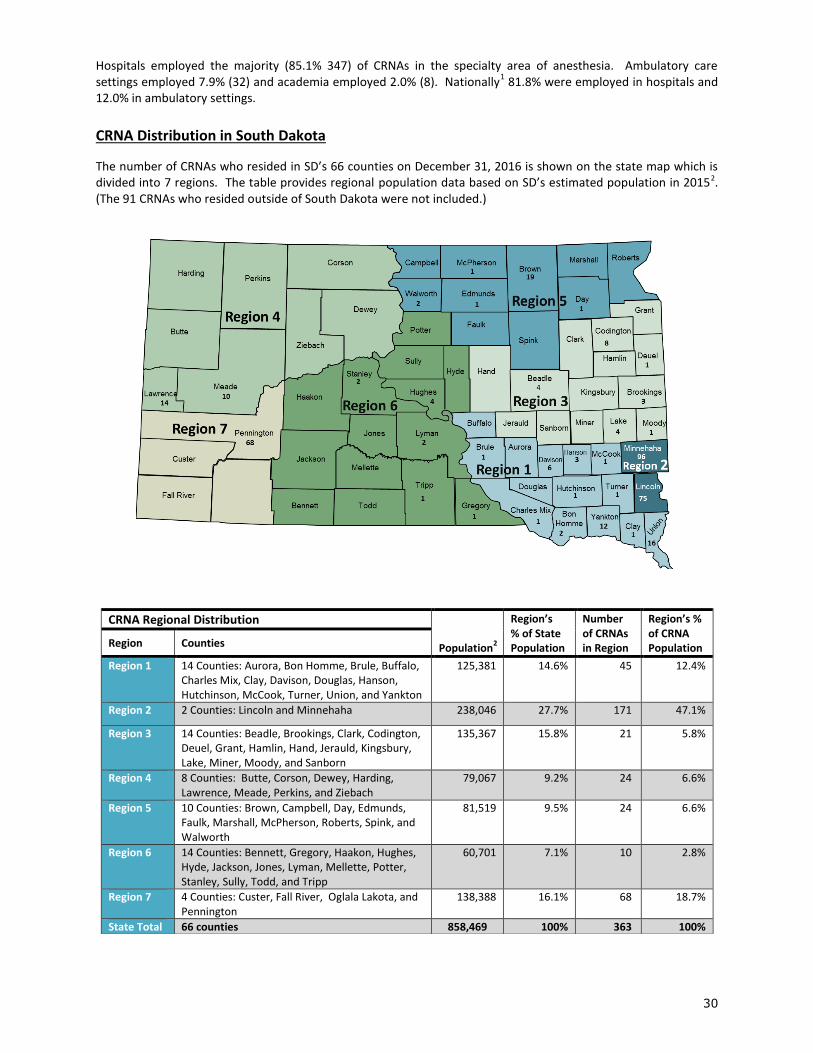
The number of CRNAs who resided in SD’s 66 counties on December 31, 2016 is shown on the state map which is divided into 7 regions. The table provides regional population data based on SD’s estimated population in 20152. (The 91 CRNAs who resided outside of South Dakota were not included.)
CRNA Regional Distribution Population
2
Region’s % of State Population
Number of CRNAs in Region
Region’s % of CRNA Population Region Counties
Region 1
14 Counties: Aurora, Bon Homme, Brule, Buffalo, Charles Mix, Clay, Davison, Douglas, Hanson, Hutchinson, McCook, Turner, Union, and Yankton
125,381 14.6% 45 12.4%
Region 2 2 Counties: Lincoln and Minnehaha 238,046 27.7% 171 47.1%
Region 3
14 Counties: Beadle, Brookings, Clark, Codington, Deuel, Grant, Hamlin, Hand, Jerauld, Kingsbury, Lake, Miner, Moody, and Sanborn
135,367 15.8% 21 5.8%
Region 4
8 Counties: Butte, Corson, Dewey, Harding, Lawrence, Meade, Perkins, and Ziebach
79,067 9.2% 24 6.6%
Region 5
10 Counties: Brown, Campbell, Day, Edmunds, Faulk, Marshall, McPherson, Roberts, Spink, and Walworth
81,519 9.5% 24 6.6%
Region 6
14 Counties: Bennett, Gregory, Haakon, Hughes, Hyde, Jackson, Jones, Lyman, Mellette, Potter, Stanley, Sully, Todd, and Tripp
60,701 7.1% 10 2.8%
Region 7
4 Counties: Custer, Fall River, Oglala Lakota, and Pennington
138,388 16.1% 68 18.7%
State Total 66 counties 858,469 100% 363 100%
31
Advanced Practice Registered Nurses
Clinical Nurse Specialists
South Dakota Supply Trends
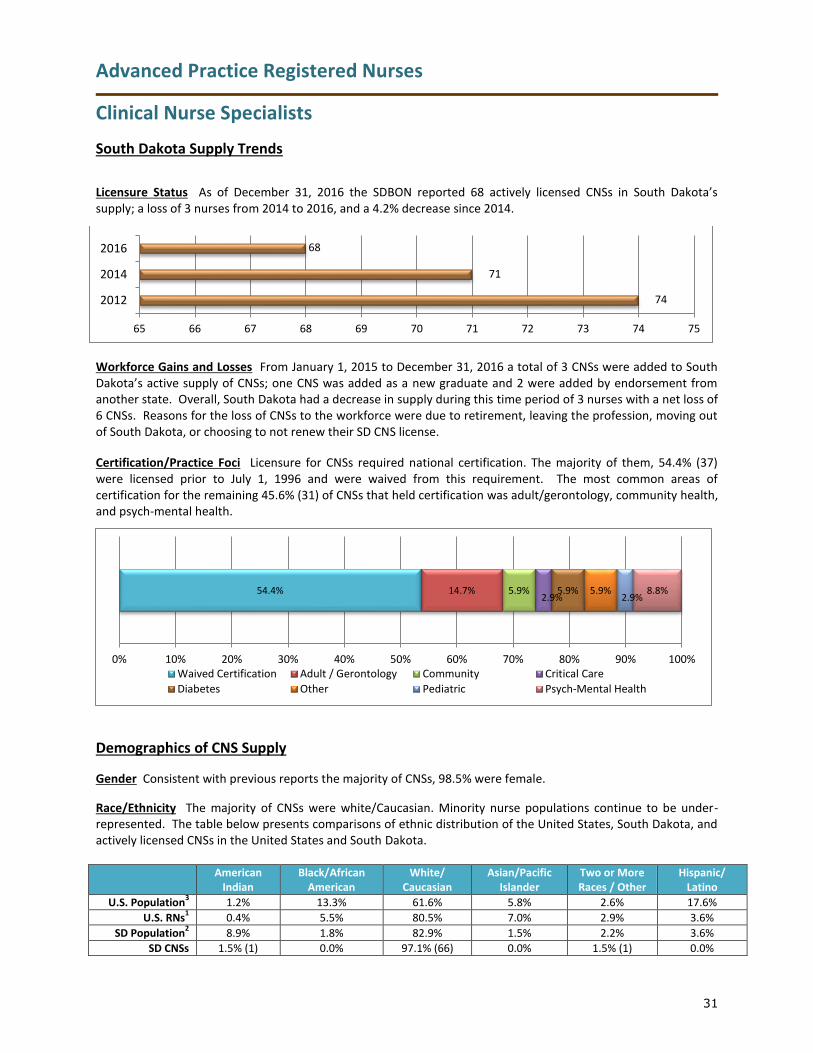
Licensure Status As of December 31, 2016 the SDBON reported 68 actively licensed CNSs in South Dakota’s supply; a loss of 3 nurses from 2014 to 2016, and a 4.2% decrease since 2014.
Workforce Gains and Losses From January 1, 2015 to December 31, 2016 a total of 3 CNSs were added to South Dakota’s active supply of CNSs; one CNS was added as a new graduate and 2 were added by endorsement from another state. Overall, South Dakota had a decrease in supply during this time period of 3 nurses with a net loss of 6 CNSs. Reasons for the loss of CNSs to the workforce were due to retirement, leaving the profession, moving out of South Dakota, or choosing to not renew their SD CNS license.
Certification/Practice Foci Licensure for CNSs required national certification. The majority of them, 54.4% (37) were licensed prior to July 1, 1996 and were waived from this requirement. The most common areas of certification for the remaining 45.6% (31) of CNSs that held certification was adult/gerontology, community health, and psych-mental health.
Demographics of CNS Supply
Gender Consistent with previous reports the majority of CNSs, 98.5% were female.
Race/Ethnicity The majority of CNSs were white/Caucasian. Minority nurse populations continue to be under-represented. The table below presents comparisons of ethnic distribution of the United States, South Dakota, and actively licensed CNSs in the United States and South Dakota.
American Indian
Black/African American
White/ Caucasian
Asian/Pacific Islander
Two or More Races / Other
Hispanic/ Latino
U.S. Population3 1.2% 13.3% 61.6% 5.8% 2.6% 17.6%
U.S. RNs1
0.4% 5.5% 80.5% 7.0% 2.9% 3.6%
SD Population2
8.9% 1.8% 82.9% 1.5% 2.2% 3.6%
SD CNSs 1.5% (1) 0.0% 97.1% (66) 0.0% 1.5% (1) 0.0%
74
71
68
65 66 67 68 69 70 71 72 73 74 75
2012
2014
2016
54.4% 14.7% 5.9% 2.9%
5.9% 5.9% 2.9%
8.8%
0% 10% 20% 30% 40% 50% 60% 70% 80% 90% 100%Waived Certification Adult / Gerontology Community Critical Care
Diabetes Other Pediatric Psych-Mental Health
32
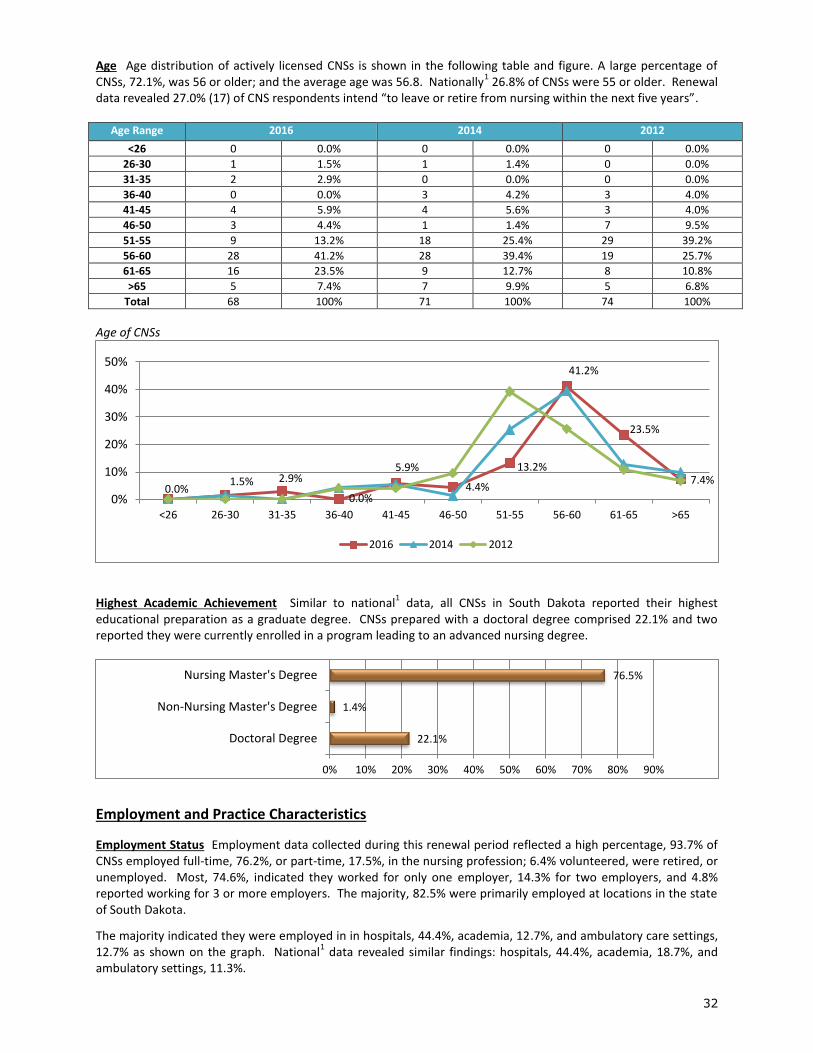
Age Age distribution of actively licensed CNSs is shown in the following table and figure. A large percentage of CNSs, 72.1%, was 56 or older; and the average age was 56.8. Nationally
1 26.8% of CNSs were 55 or older. Renewal
data revealed 27.0% (17) of CNS respondents intend “to leave or retire from nursing within the next five years”.
Age Range 2016 2014 2012
<26 0 0.0% 0 0.0% 0 0.0%
26-30 1 1.5% 1 1.4% 0 0.0%
31-35 2 2.9% 0 0.0% 0 0.0%
36-40 0 0.0% 3 4.2% 3 4.0%
41-45 4 5.9% 4 5.6% 3 4.0%
46-50 3 4.4% 1 1.4% 7 9.5%
51-55 9 13.2% 18 25.4% 29 39.2%
56-60 28 41.2% 28 39.4% 19 25.7%
61-65 16 23.5% 9 12.7% 8 10.8%
>65 5 7.4% 7 9.9% 5 6.8%
Total 68 100% 71 100% 74 100%
Age of CNSs
Highest Academic Achievement Similar to national
1 data, all CNSs in South Dakota reported their highest
educational preparation as a graduate degree. CNSs prepared with a doctoral degree comprised 22.1% and two reported they were currently enrolled in a program leading to an advanced nursing degree.
Employment and Practice Characteristics
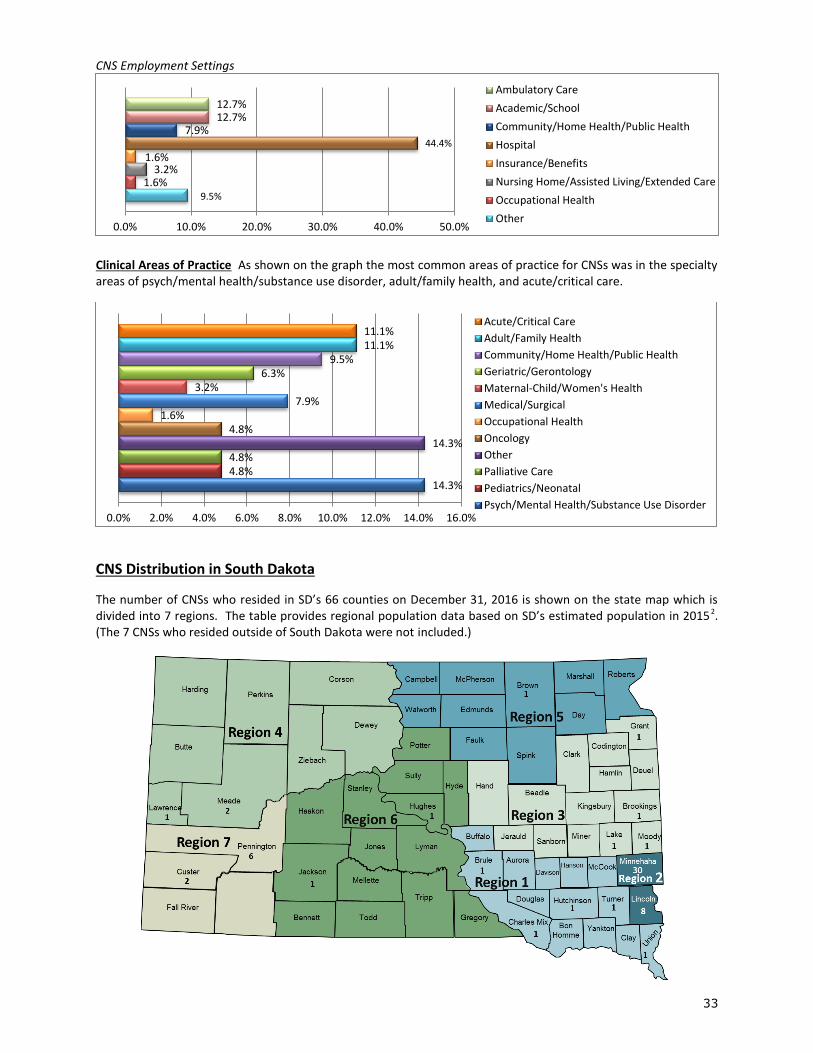
Employment Status Employment data collected during this renewal period reflected a high percentage, 93.7% of CNSs employed full-time, 76.2%, or part-time, 17.5%, in the nursing profession; 6.4% volunteered, were retired, or unemployed. Most, 74.6%, indicated they worked for only one employer, 14.3% for two employers, and 4.8% reported working for 3 or more employers. The majority, 82.5% were primarily employed at locations in the state of South Dakota.
The majority indicated they were employed in in hospitals, 44.4%, academia, 12.7%, and ambulatory care settings, 12.7% as shown on the graph. National
1 data revealed similar findings: hospitals, 44.4%, academia, 18.7%, and
ambulatory settings, 11.3%.
0.0% 1.5% 2.9%
0.0%
5.9%
4.4%
13.2%
41.2%
23.5%
7.4%
0%
10%
20%
30%
40%
50%
<26 26-30 31-35 36-40 41-45 46-50 51-55 56-60 61-65 >65
2016 2014 2012
22.1%
1.4%
76.5%
0% 10% 20% 30% 40% 50% 60% 70% 80% 90%
Doctoral Degree
Non-Nursing Master's Degree
Nursing Master's Degree
33
CNS Employment Settings
Clinical Areas of Practice As shown on the graph the most common areas of practice for CNSs was in the specialty areas of psych/mental health/substance use disorder, adult/family health, and acute/critical care.
CNS Distribution in South Dakota
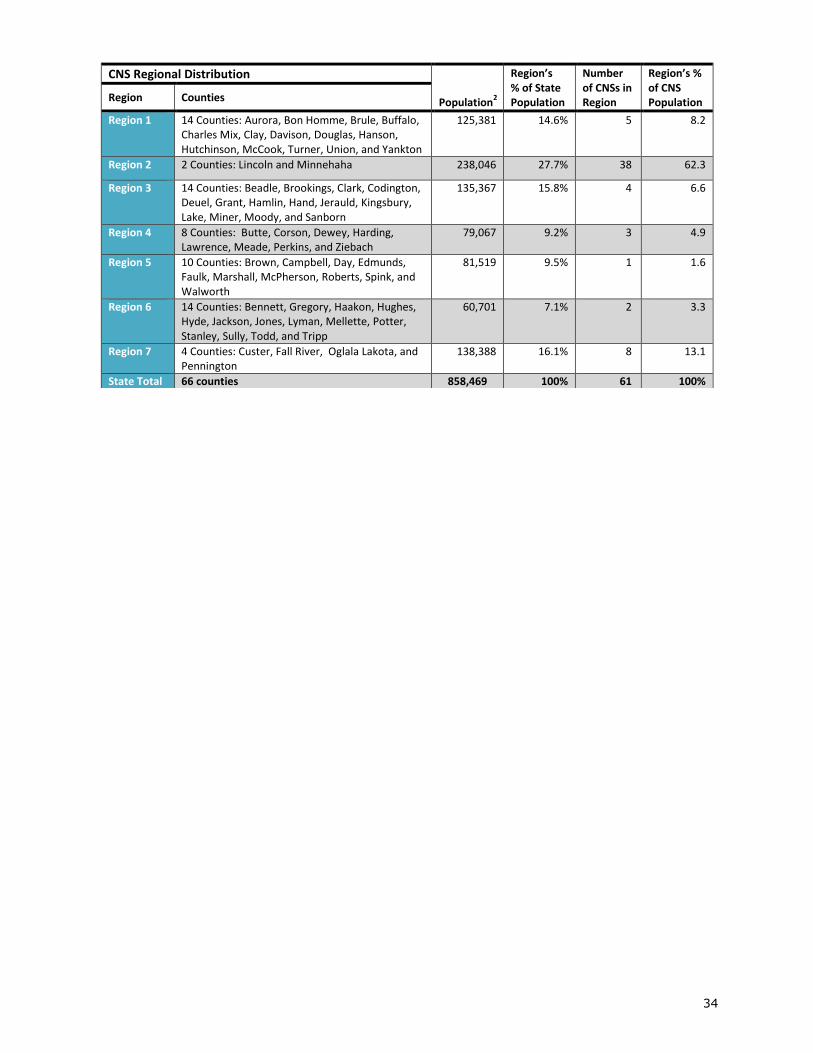
The number of CNSs who resided in SD’s 66 counties on December 31, 2016 is shown on the state map which is divided into 7 regions. The table provides regional population data based on SD’s estimated population in 20152. (The 7 CNSs who resided outside of South Dakota were not included.)
9.5%
1.6% 3.2%
1.6% 44.4%
7.9% 12.7% 12.7%
0.0% 10.0% 20.0% 30.0% 40.0% 50.0%
Ambulatory Care
Academic/School
Community/Home Health/Public Health
Hospital
Insurance/Benefits
Nursing Home/Assisted Living/Extended Care
Occupational Health
Other
14.3% 4.8% 4.8%
14.3% 4.8%
1.6% 7.9%
3.2% 6.3%
9.5% 11.1% 11.1%
0.0% 2.0% 4.0% 6.0% 8.0% 10.0% 12.0% 14.0% 16.0%
Acute/Critical Care
Adult/Family Health
Community/Home Health/Public Health
Geriatric/Gerontology
Maternal-Child/Women's Health
Medical/Surgical
Occupational Health
Oncology
Other
Palliative Care
Pediatrics/Neonatal
Psych/Mental Health/Substance Use Disorder
34
CNS Regional Distribution Population
2
Region’s % of State Population
Number of CNSs in Region
Region’s % of CNS Population Region Counties
Region 1
14 Counties: Aurora, Bon Homme, Brule, Buffalo, Charles Mix, Clay, Davison, Douglas, Hanson, Hutchinson, McCook, Turner, Union, and Yankton
125,381 14.6% 5 8.2
Region 2 2 Counties: Lincoln and Minnehaha 238,046 27.7% 38 62.3
Region 3
14 Counties: Beadle, Brookings, Clark, Codington, Deuel, Grant, Hamlin, Hand, Jerauld, Kingsbury, Lake, Miner, Moody, and Sanborn
135,367 15.8% 4 6.6
Region 4
8 Counties: Butte, Corson, Dewey, Harding, Lawrence, Meade, Perkins, and Ziebach
79,067 9.2% 3 4.9
Region 5
10 Counties: Brown, Campbell, Day, Edmunds, Faulk, Marshall, McPherson, Roberts, Spink, and Walworth
81,519 9.5% 1 1.6
Region 6
14 Counties: Bennett, Gregory, Haakon, Hughes, Hyde, Jackson, Jones, Lyman, Mellette, Potter, Stanley, Sully, Todd, and Tripp
60,701 7.1% 2 3.3
Region 7
4 Counties: Custer, Fall River, Oglala Lakota, and Pennington
138,388 16.1% 8 13.1
State Total 66 counties 858,469 100% 61 100%
35
Employment and Education Data Form 1. What type of nursing degree / credential qualified you for your first U.S. nursing license?
Vocational / Practical Certificate Nursing Diploma – Nursing Associate Degree – Nursing
Baccalaureate Degree – Nursing Master’s Degree – Nursing Doctoral Degree – Nursing
2. What is your highest level of education?
Vocational / Practical Certificate Nursing Diploma – Nursing Associate Degree – Nursing Associate Degree – Non-Nursing Baccalaureate Degree – Nursing Baccalaureate Degree – Non-Nursing
Master’s Degree – Nursing Master’s Degree – Non-Nursing Doctoral Degree – Nursing (PhD) Doctoral Degree – Nursing Practice (DNP) Doctoral Degree – Nursing Other Doctoral Degree
3. Year of initial U.S. Licensure:
4. Country of entry-level education:
5. What is your employment status?
Actively employed in nursing or in a position that requires a nurse license (select one) Full-time Part-time Per diem
Actively employed in a field other than nursing (select one) Full-time Part-time Per diem
Working in nursing only as a volunteer Unemployed (select one)
Seeking work as a nurse Not seeking work as a nurse
Retired
6. In how many positions are you currently employed as a nurse? 1 2 3 or more
7. How many hours do you work during a typical week in all your nursing positions?
<10 hours 11-20 hours 21-30 hours 31-40 hours
41-50 hours 51-60 hours >60 hours
8. Indicate the zip code, city, state and county of your primary employer.
Zip Code:
City:
State:
County:
9. Identify the type of setting that most closely corresponds to your nursing practice position. Academic Setting Ambulatory Care Setting Community Health Correctional Facility Home Health Hospital Insurance Claims / Benefits
Nursing Home/Extended Care/Assisted Living Facility
Occupational Health Policy / Planning Regulatory / Licensing Agency Public Health School Health Services Other
36
10. Identify the position title that most closely corresponds to your nursing practice position. Advanced Practice Nurse Consultant Nurse Executive Nurse Faculty Nurse Manager
Nurse Researcher Staff Nurse Other – Health Related Other – Non Health Related
11. Identify the employment specialty that most closely corresponds to your nursing practice position.
Acute Care/ Critical Care Adult Health / Family Health Anesthesia Community Geriatric / Gerontology Home Health Maternal-Child Health Medical / Surgical Occupational Health Oncology
Palliative Care Pediatrics / Neonatal Psychiatric / Mental Health / Substance Abuse Public Health Rehabilitation School Health Trauma Women’s Health Other
12. What percent of your current position involves direct patient care?
0% 25% 50% 75% 100%
13. If unemployed, please indicate the reasons.
Difficulty in finding a nursing position Disabled Inadequate Salary School Taking care of home and family Other
14. Formal Education
I am not taking courses toward an advanced degree in nursing I am currently taking courses toward an advanced degree in nursing
15. Do you intend to leave / retire from nursing practice in the next 5 years?
Yes No
16. Other states in which you have ever held a license:
Active License: Inactive License:
17. List all states where currently practicing nursing, whether physically or electronically:
37
References 1. Budden, J., Moulton, P., Harper, K., Brunell, M., & Smiley, R. (2016). The 2015 National Nursing Workforce
Survey. Journal of Nursing Regulation, 7 (1), Supplement. 2. U.S. Census Bureau: QuickFacts, State and County. Data derived from Population Estimates, American
Community Survey. https://www.census.gov/quickfacts/table/PST045216/46 (accessed February 27, 2017).
3. U.S. Census Bureau: QuickFacts, United States. Data derived from Population Estimates, American Community Survey. https://www.census.gov/quickfacts/table/PST045216/00 (accessed February 27, 2017).
4. Health Resources and Services Administration, Bureau of Health Professions, National Center for Health Workforce Analysis. The U.S. Nursing Workforce: Trends in Supply and Education, October 2013.
5. Institute of Medicine of the National Academies (2010). The Future of Nursing Leading Change Advancing Health. www.iom.edu/nursing.


