Anais da Academia Brasileira de Ciências (2011) 83(2): 441-456 (Annals of the Brazilian Academy of Sciences) Printed version ISSN 0001-3765 / Online version ISSN 1678-2690 www.scielo.br/aabc Nutrient budgets (C, N and P) and trophic dynamics of a Brazilian tropical estuary: Barra das Jangadas CARLOS E.D. NORIEGA and MOACYR ARAUJO Laboratório de Oceanografia Física Estuarina e Costeira, Departamento de Oceanografia da Universidade Federal de Pernambuco, LOFEC/DOCEAN/UFPE, Avenida Arquitetura s/n, Cidade Universitária, 50740-550 Recife, PE, Brasil Manuscript received on November 3, 2009; accepted for publication on October 27, 2010 ABSTRACT This paper focuses on the nutrient dynamics of a tropical estuary on the northeastern Brazilian coast, studied using the LOICZ biogeochemical budgeting protocol. We describe the methodology and assumptions underlying this model. Input data (monthly for rainfall, evaporation, river discharge, and concentrations of salt, phosphorus and nitrogen) were obtained during field campaigns in the Barra das Jangadas Estuary (BJE) over a 5 years period (1999 to 2003). Mass balance results indicate large inputs of nutrients to the system. The model shows that the seasonal variation of the Net Ecosystem Metabolism (NEM) indicates that the system passes from a stage of organic matter liquid production and mineralization during the dry season (–0.5 mmoles C m −2 d −1 ) to liquid mineralization during the rainy season (–19 mmoles C m −2 d −1 ). We suggest that the system varies slightly between autotrophy and het- erotrophy during the year due to the rainfall regime, human activities in the basin (density population and sugarcane plantations), and associated DIP riverine loads. High per capita loads of N and P indicate a high population density and high runoff. The application of flux balance modeling was useful to understand the nutrient dynamics of this typical small tropical estuary. Key words: Brazil, Barra das Jangadas Estuary, seasonal variations, heterotrophy, autotrophy, carbon dioxide. INTRODUCTION Estuaries are dynamic systems, in which biological populations fluctuate according to natural cycles. Wa- ter quality also varies, particularly as seasonal and an- nual climatic patterns change. In these systems tracking environmental changes can be challenging, and distin- guishing impacts caused by human actions from nat- ural variations can be even more difficult (Marone et al. 2005). Under normal estuarine spatial and temporal constraints, reactive materials, such as nutrients, behave non-conservatively due to modifications by biological recycling and chemical transformations acting indepen- dently of simple physical advection and mixing (Dale and Prego 2005). Correspondence to: Carlos E. D. Noriega E-mail: [email protected]Furthermore, estuaries are areas in which anthro- pogenic effects, such as increased nutrient loads, have their most direct influence, and where there is a danger of adverse impacts. Most of these impacts results from a complex chain of events varying over different scales in space and time, which can be ultimately attributed to the accumulation of anthropogenic nitrogen and phos- phorus in river water on its way to the ocean (Tappin 2002). The magnitude of these fluxes is such that the transfer of organic matter from land to ocean via rivers is a key link in global carbon cycles. Due to the intense anthropogenic disturbance, estuaries are often consid- ered to be net heterotrophic ecosystems and act as a source of CO 2 (Biswas et al. 2004, Mukhopadhyay et al. 2006). The increased nutrient load leads to eutro- An Acad Bras Cienc (2011) 83 (2)
Transcript
“main” — 2011/5/13 — 13:52 — page 441 — #1
Anais da Academia Brasileira de Ciências (2011) 83(2): 441-456(Annals of the Brazilian Academy of Sciences)Printed version ISSN 0001-3765 / Online version ISSN 1678-2690www.scielo.br/aabc
Nutrient budgets (C, N and P) and trophic dynamicsof a Brazilian tropical estuary: Barra das Jangadas
CARLOS E.D. NORIEGA and MOACYR ARAUJO
Laboratório de Oceanografia Física Estuarina e Costeira,Departamento de Oceanografia da Universidade Federal de Pernambuco,
LOFEC/DOCEAN/UFPE, Avenida Arquitetura s/n, Cidade Universitária, 50740-550 Recife, PE, Brasil
Manuscript received on November 3, 2009; accepted for publication on October 27, 2010
ABSTRACT
This paper focuses on the nutrient dynamics of a tropical estuary on the northeastern Brazilian coast, studied using
the LOICZ biogeochemical budgeting protocol. We describe the methodology and assumptions underlying this
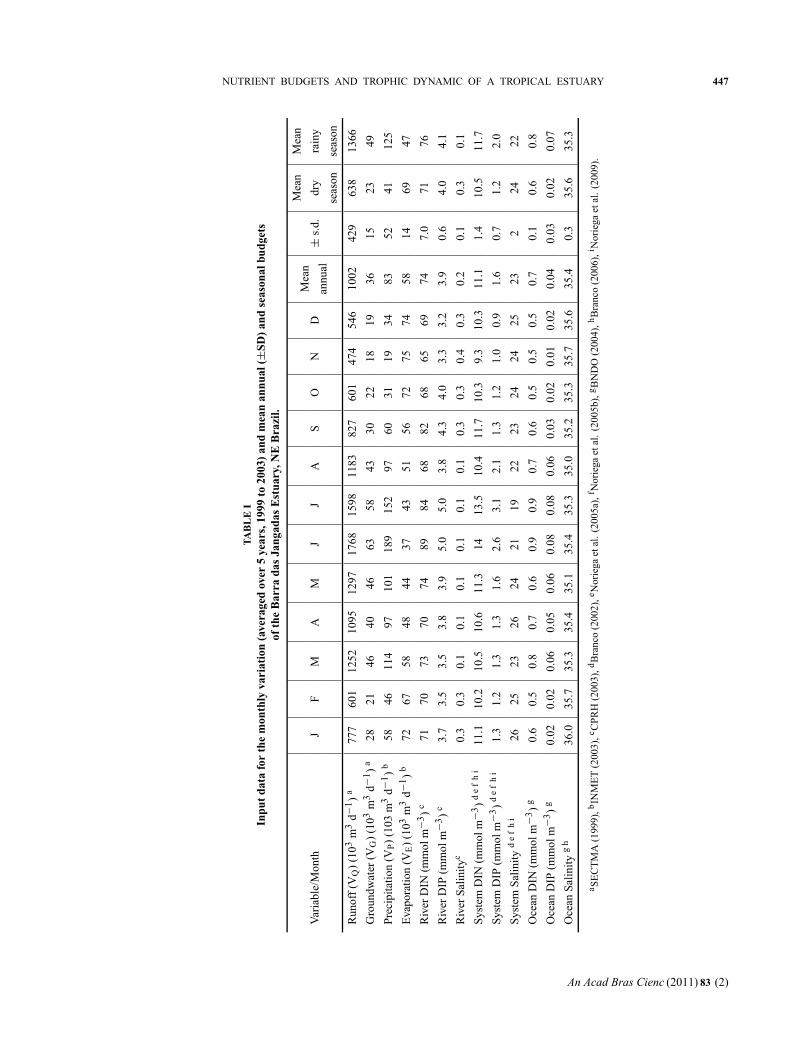
model. Input data (monthly for rainfall, evaporation, river discharge, and concentrations of salt, phosphorus and
nitrogen) were obtained during field campaigns in the Barra das Jangadas Estuary (BJE) over a 5 years period (1999
to 2003). Mass balance results indicate large inputs of nutrients to the system. The model shows that the seasonal
variation of the Net Ecosystem Metabolism (NEM) indicates that the system passes from a stage of organic matter
liquid production and mineralization during the dry season (–0.5 mmoles C m−2 d−1) to liquid mineralization during
the rainy season (–19 mmoles C m−2 d−1). We suggest that the system varies slightly between autotrophy and het-
erotrophy during the year due to the rainfall regime, human activities in the basin (density population and sugarcane
plantations), and associated DIP riverine loads. High per capita loads of N and P indicate a high population density and
high runoff. The application of flux balance modeling was useful to understand the nutrient dynamics of this typical
small tropical estuary.
Key words: Brazil, Barra das Jangadas Estuary, seasonal variations, heterotrophy, autotrophy, carbon dioxide.
INTRODUCTION
Estuaries are dynamic systems, in which biologicalpopulations fluctuate according to natural cycles. Wa-ter quality also varies, particularly as seasonal and an-nual climatic patterns change. In these systems trackingenvironmental changes can be challenging, and distin-guishing impacts caused by human actions from nat-ural variations can be even more difficult (Marone etal. 2005). Under normal estuarine spatial and temporalconstraints, reactive materials, such as nutrients, behavenon-conservatively due to modifications by biologicalrecycling and chemical transformations acting indepen-dently of simple physical advection and mixing (Daleand Prego 2005).
Furthermore, estuaries are areas in which anthro-pogenic effects, such as increased nutrient loads, havetheir most direct influence, and where there is a dangerof adverse impacts. Most of these impacts results froma complex chain of events varying over different scalesin space and time, which can be ultimately attributed tothe accumulation of anthropogenic nitrogen and phos-phorus in river water on its way to the ocean (Tappin2002).
The magnitude of these fluxes is such that thetransfer of organic matter from land to ocean via riversis a key link in global carbon cycles. Due to the intenseanthropogenic disturbance, estuaries are often consid-ered to be net heterotrophic ecosystems and act as asource of CO2 (Biswas et al. 2004, Mukhopadhyay etal. 2006). The increased nutrient load leads to eutro-
An Acad Bras Cienc (2011) 83 (2)
“main” — 2011/5/13 — 13:52 — page 442 — #2
442 CARLOS E.D. NORIEGA and MOACYR ARAUJO
phication, enhances net ecosystem production, andshifts the system towards increased autotrophy (Gat-tuso et al. 1998). On the other hand, respiration of theorganic carbon leads to increased heterotrophy. Addi-tionally, light may become limiting for primary produc-tion in the upper part of estuaries (Irigoien and Castel1997); respiration is then the dominant metabolic pro-cess, and an oxygen-depleted zone may occur, stimulat-ing various anaerobic processes. It is well known thatthe chemical transformation pathways for nitrogen andphosphorus differ markedly from one another (Schle-singer 1997). In addition to being present in inorganicand organic dissolved forms, nitrogen is involved inbiotic reactions and is the primary constituent of theatmosphere.
Besides direct uptake and release with respectto organic matter, the biotic processes of nitrogen fixa-tion and denitrification actively move nitrogen betweenamong the atmosphere (as nitrogen gas (N2) and nitrousoxide (N2O)) and both organic and inorganic forms offixed nitrogen. Both nitrate (NO3) and ammonia (NH3)are highly soluble in water, and dissolved ammoniareadily ionizes to ammonium (NH4). Nitrate is an im-portant byproduct of combustion, while ammonia is ahighly volatile byproduct of animal waste. As a result,atmospheric transport and both wet and dry depositionare important pathways by which these materials aredelivered to the landscape (Meyers et al. 2001). Bycontrast, phosphorus is involved in biotic reactions, pri-marily through the relatively simple (though still highlycomplex) pathways of organic production and oxidation.Phosphorus is also involved in various important min-eral reactions (including both precipitation-dissolutionof various forms of the mineral group apatite and ad-sorption-desorption reactions). In general, phosphorusis very particle-reactive and is taken up or released fromthe particles under changing conditions of pH, redox,and ionic strength. It has no significant gas phase.
The scatter in the loading ratio probably reflects,in large part, different chemical reaction pathways forDIN and DIP. The only real overlap in the reaction path-ways for nitrogen and phosphorus involves productionand oxidation of organic matter.
Because the composition ratio of nitrogen to phos-phorus for most terrestrial organic matter is close to
the DIN:DIP loading ratio we observed (approximately19:1), decomposition of organic matter apparently dom-inates the inorganic nutrient loading, both in absoluterange and loading ratio (Smith et al. 2003).
A close link is generally found between ecosystemmetabolism and terrestrially derived nutrients in tem-perate ecosystems. It remains difficult to assess com-pletely a function of estuarine ecosystem in response tothe input of terrestrial nutrients in tropical area largelybecause of confounding physical and biogeochemicalfactors (Eyre and McKee 2002). Therefore, it is of in-terest to know whether a shallow coastal water body isa carbon source or sink, particularly in tropical areasNutrient budgets can provide valuable information asto whether the system is a net exporter or importer ofnutrients and can therefore determine its trophic status.Smith and Hollibaugh (1997) used the term “trophicstatus” to describe the net balance (net respiration ornet synthesis) of organic carbon in an ecosystem. Theresults of these budgets and the use of stoichiometrictools provide estimates of processes such as net pro-duction/respiration and nitrogen fixation/denitrification(Gordon et al. 1996). To assess carbon sources and sinksthrough process studies is not a simple task (Gordon etal. 1996). However, proposed guidelines for the Land-Ocean Interactions in the Coastal Zone (LOICZ) pro-gramme to assess non-conservative nutrient fluxes andcarbon budgets for well boundary-defined coastal sys-tems. This steady state budgeting method provides analternative method to evaluate the biogeochemical meta-bolism and fate of nutrients and carbon in coastal systemswhen direct measurements of productivity and respira-tion are not available. Net nutrient fluxes in the coastalzone can be also determined from budget calculations,which is essential to evaluate the effects of riverine dis-charges on coastal function and carbon metabolism.
The rivers of the Northeast and East are markedby a pattern of seasonal flow typically unimodal, butdiffer in amplitude. As the climate states, the rivers ofthe Northeast are subjected to marked seasonal variabil-ity, with high intakes of pulses and floods during thewet season flows and low to negligible in the dry season(Knoppers et al. 2009).
In tropical ecosystems, mangrove-fringed estuar-
ies play important roles in global processes, economic
An Acad Bras Cienc (2011) 83 (2)
“main” — 2011/5/13 — 13:52 — page 443 — #3
NUTRIENT BUDGETS AND TROPHIC DYNAMIC OF A TROPICAL ESTUARY 443
issues, political concerns and conservation strategies.
Among numerous other processes, these tropical eco-
systems affect the global carbon cycle (Lal et al. 2000).
Studies in tropical regions are of paramount importance
for understanding the diversity of processes that occur
at annual and seasonal scales and how these affect the
biogeochemical cycles of the elements in these regions.
VQDIPQ), in the estuary indicated that BJE acts as
a source for DIP (import-export = 1220 mol d−1)
(Fig. 4). Throughout the year, phosphorus (P) budgets
in the BJE change sign according to the season. During
the dry season, the balances are negative during four
months (Table II). This implies that the BJE sequesters
the difference between import and export, and acts as a
sink for P during these months. This period of the year
shows the smallest potential of exportation and higher
residence times. The mixing outflow of DIP from this
system is substantially larger than the residual inflow,
and demonstrates that there must be DIP production
(1DIP) of approximately + 57 mol d−1 in the system.
We assume that this represents decomposition of or-
ganic matter. We have observed that there is very high
release of DIP, especially from the sediments associated
with sugar cane wastes, so this and other organic dis-
charges into the system are assumed to support the high
non-conservative flux of DIP.
This period (September-March) is when the sugar-
cane harvest and milling occur. During the rainy season,
the sign is positive. This implies that the BJE acts as a
source for P, mainly in July, which is a characteristically
high rainfall month (Table II).
Seasonal variations of river runoff (VQDIPQ) DIP
were found to be 2396 and 5782 moles d−1 during the
dry and rainy seasons, respectively. SECTMA (1999)
indicated a residual organic pollution load during the
sugar-cane harvest of 5000 and 2000 kg of BOD d−1
for the Jaboatão and Pirapama rivers, respectively,
An Acad Bras Cienc (2011) 83 (2)
“main” — 2011/5/13 — 13:52 — page 447 — #7
NUTRIENT BUDGETS AND TROPHIC DYNAMIC OF A TROPICAL ESTUARY 447
±
±
−
− − −
− −
− − − −
An Acad Bras Cienc (2011) 83 (2)
“main” — 2011/5/13 — 13:52 — page 448 — #8
448 CARLOS E.D. NORIEGA and MOACYR ARAUJO
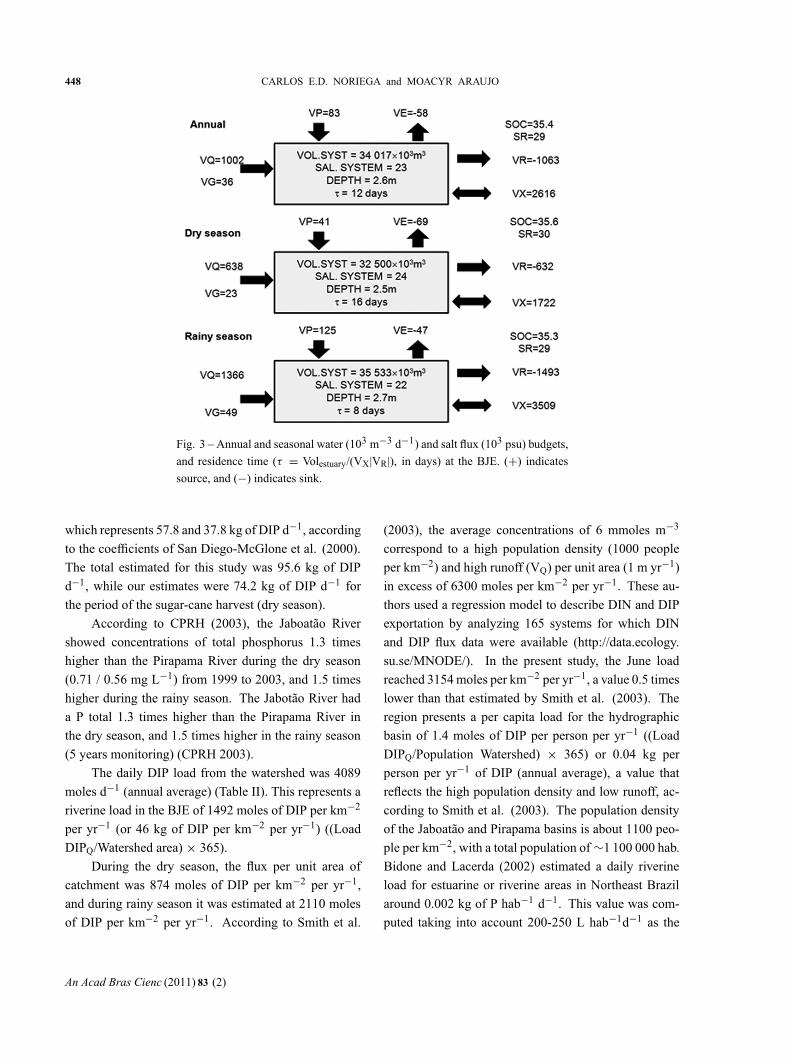
Fig. 3 – Annual and seasonal water (103 m−3 d−1) and salt flux (103 psu) budgets,
and residence time (τ = Volestuary/(VX|VR|), in days) at the BJE. (+) indicates
source, and (−) indicates sink.
which represents 57.8 and 37.8 kg of DIP d−1, according
to the coefficients of San Diego-McGlone et al. (2000).
The total estimated for this study was 95.6 kg of DIP
d−1, while our estimates were 74.2 kg of DIP d−1 for
the period of the sugar-cane harvest (dry season).
According to CPRH (2003), the Jaboatão River
showed concentrations of total phosphorus 1.3 times
higher than the Pirapama River during the dry season
(0.71 / 0.56 mg L−1) from 1999 to 2003, and 1.5 times
higher during the rainy season. The Jabotão River had
a P total 1.3 times higher than the Pirapama River in
the dry season, and 1.5 times higher in the rainy season
(5 years monitoring) (CPRH 2003).
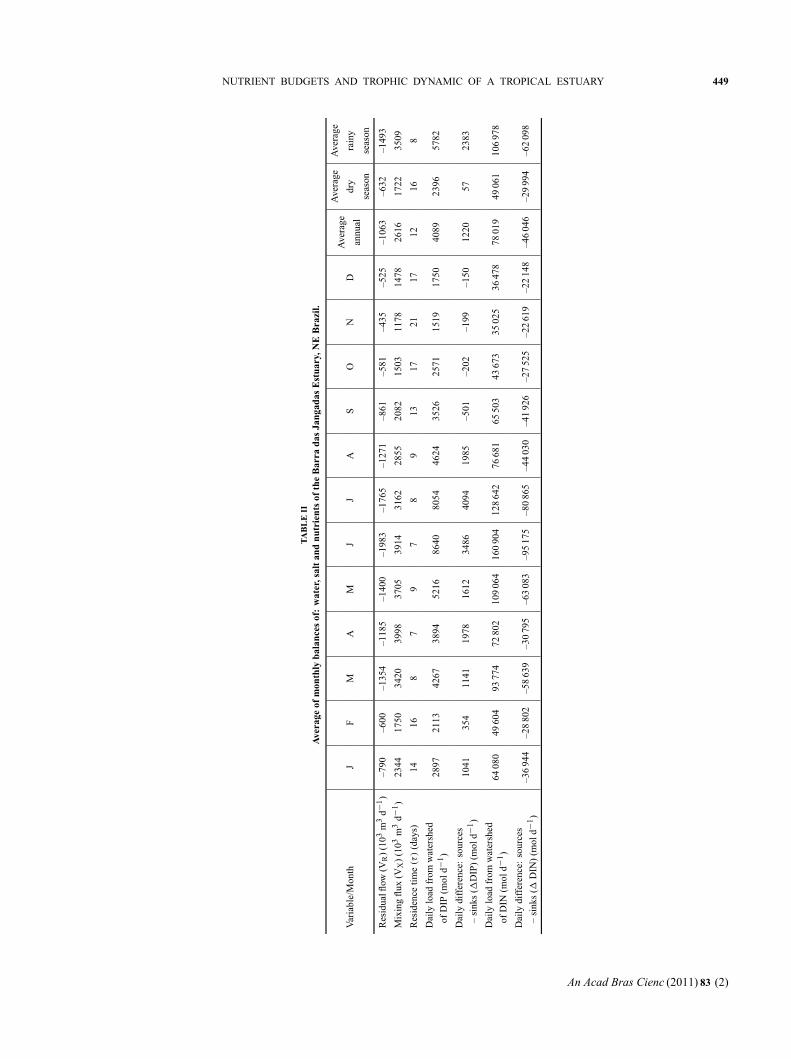
The daily DIP load from the watershed was 4089
moles d−1 (annual average) (Table II). This represents a
riverine load in the BJE of 1492 moles of DIP per km−2
per yr−1 (or 46 kg of DIP per km−2 per yr−1) ((Load
DIPQ/Watershed area) × 365).
During the dry season, the flux per unit area of
catchment was 874 moles of DIP per km−2 per yr−1,
and during rainy season it was estimated at 2110 moles
of DIP per km−2 per yr−1. According to Smith et al.
(2003), the average concentrations of 6 mmoles m−3
correspond to a high population density (1000 people
per km−2) and high runoff (VQ) per unit area (1 m yr−1)
in excess of 6300 moles per km−2 per yr−1. These au-
thors used a regression model to describe DIN and DIP
exportation by analyzing 165 systems for which DIN
and DIP flux data were available (http://data.ecology.
su.se/MNODE/). In the present study, the June load
reached 3154 moles per km−2 per yr−1, a value 0.5 times
lower than that estimated by Smith et al. (2003). The
region presents a per capita load for the hydrographic
basin of 1.4 moles of DIP per person per yr−1 ((Load
DIPQ/Population Watershed) × 365) or 0.04 kg per
person per yr−1 of DIP (annual average), a value that
reflects the high population density and low runoff, ac-
cording to Smith et al. (2003). The population density
of the Jaboatão and Pirapama basins is about 1100 peo-
ple per km−2, with a total population of ∼1 100 000 hab.
Bidone and Lacerda (2002) estimated a daily riverine
load for estuarine or riverine areas in Northeast Brazil
around 0.002 kg of P hab−1 d−1. This value was com-
puted taking into account 200-250 L hab−1d−1 as the
An Acad Bras Cienc (2011) 83 (2)
“main” — 2011/5/13 — 13:52 — page 449 — #9
NUTRIENT BUDGETS AND TROPHIC DYNAMIC OF A TROPICAL ESTUARY 449
−
−
(τ)
−
1−
−
1−
An Acad Bras Cienc (2011) 83 (2)
“main” — 2011/5/13 — 13:52 — page 450 — #10
450 CARLOS E.D. NORIEGA and MOACYR ARAUJO
Fig. 4 – Annual and seasonal phosphorus flux (in moles d−1) budget at the BJE.
(+) indicates source, and (−) indicates sink.
typical water consumption for developing countries.
This is actually overestimated compared to the real wa-
ter consumption of 100-150 L hab−1d−1 in the Brazilian
northeastern coastal area (I.M. Abreu et al., unpublished
data). These figures would yield 0.01 kg of DIP per
person per yr−1, considering the San Diego-McGlone et
al. (2000) transformations from P to DIP, which is 4-fold
smaller than our previously calculated value. During the
dry season, this value was nearer to that estimated by
Bidone and Lacerda (2002) (0.02 kg of DIP per person
per yr−1). Therefore, during the rainy season, it was 6
times higher. Our estimates identify a high organic load
as a result of unplanned activities in the hydrographic
basin, such as disposal of domestic sewage, uncontrolled
land runoff, and industrial and agro-industrial effluents.
The calculated four major components of the mate-
rial balance (VRDINR, VX (DINOC-DINSYS), VGDING,
VQDINQ), in the estuary indicated that BJE acts as a
sink for DIN (import-export = –46 046 mol d−1) (Fig. 5).
The nitrogen budget in the BJE shows a higher in-
flow contribution during the rainy season, due to fresh-
water runoff and reduced residual water flow (Fig. 5).
1DIN is negative in all months, suggesting that inputs
are higher than outputs and indicating a net sink of in-
organic nitrogen in the BJE. Seasonal variations of river
runoff DIN (VQDINQ) were found to be 46 061 and
106 978 moles d−1 during the dry and rainy seasons,
respectively. According to SECTMA (1999), the daily
loads of BOD during the sugar-cane harvest (dry sea-
son) for the Jaboatão and Pirapama rivers are 5000 and
2000 kg of BOD d−1, respectively, which represents 950
and 380 kg of DIN d−1, according to the coefficients of
San Diego-McGlone et al. (2000). The total daily load
estimated for this study was 1092 kg of DIN d−1, while
our estimates were 687 kg of DIN d−1 for the period of
the sugar-cane harvest (dry season).
According to CPRH (2003), the Jaboatão River
shows concentrations of ammonium 4 times higher
than the Pirapama River (3.37/0.82 (dry season); 3.0/
0.70 mg L−1 (rainy season)). The daily DIN load from
the watershed was 78 019 moles d−1 (annual average)
(Table II), which would represent a yield of 28 477
moles of DIN per km−2 per yr−1 (400 kg of DIN per
km−2 per yr−1), a value two times greater than the mean
estimate (Smith et al. 2003).
During the dry season, the flux per unit area of
the catchment was 17 907 moles of DIN per km−2 per
yr−1, while during the rainy season it was estimated as
39 047 moles of DIN per km−2 per yr−1.
The computed per capita load was 26 moles of
DIN per person per yr−1 (0.4 kg of DIN per person
per yr−1), a value 9 times greater than the scenario with
high density and low runoff of Smith et al. (2003). Ac-
cording to Bidone (2000), the nitrogen (N) load for the
An Acad Bras Cienc (2011) 83 (2)
“main” — 2011/5/13 — 13:52 — page 451 — #11
NUTRIENT BUDGETS AND TROPHIC DYNAMIC OF A TROPICAL ESTUARY 451
regional scenario is 0.01 kg of N hab−1d−1, equivalent
to 0.004 kg of DIN hab−1 d−1.
STOICHIOMETRIC CALCULATIONS OF
NET SYSTEM METABOLISM
The evolution of the BJE metabolism shows a tendency
towards heterotrophy (Fig. 6). The negative net ecosys-
tem metabolism ( p-r ) values indicate that the system
is heterotrophic, with a net loss of organic matter from
the BJE of ∼–10 mmoles C m−2 d−1 (annual average).
We believe that these values can vary if we consider
other rates (42:12:1 SanDiego-McGlone et al. (2000)
for the waste load ratio), or with mangroves dominat-
ing the net production (rate of 1000:11:1 Smith and
Camacho (2000)). In either cases, if the DIP uptake
primarily represents net organic metabolism, rather
than sorption or precipitation of inorganic P, this sys-
tem is net heterotrophic. During the dry season (Septem-
ber-February), we observed a slightly heterotrophy of
–0.5 mmoles C m−2 d−1 (seasonal average). The long
residence time retains materials long enough to react
internally during the dry season. In addition, the wa-
ter quality is enhanced by a slightly deeper euphotic
depth (Noriega et al. 2005, Branco 2002), which also
favors the phytoplankton community. In the rainy sea-
son, the biggest nutrient contribution to the rivers occurs
(–19 mmoles C m−2 d−1; seasonal average). Mukhopa-
dhyay et al. (2006) suggest that tropical estuaries with
a shallow photic zone dominated by physical processes
could cause the phytoplankton to not reach their maxi-
mum growth rates, which could contribute to the phyto-
planktonic production of the estuary being limited. The
objective is to modify the riverine flux of nutrients be-
fore it is released to the coastal water. These values
demonstrate that outputs are higher than inputs at the
BJE, with highlights on the mineralization of organic
matter and a net source of CO2 to the atmosphere.
The seasonal differences between heterotrophy
(January to August) and autotrophy (September to
December) indicate an extension of this second condi-
tion (Fig. 6).
Gordon et al. (1996) pointed out that p (primary
production) and r (respiration) are within about 10%
of one another. Assuming that p is known, this im-
plies that the quantity ( p-r ) = ± 0.1 p. The lack of di-
rect measures of primary productivity in the studied area
was approached through the following: (i) mean annual
and seasonal values of regional systems with biologi-
cal characteristics similar to the phytoplanktonic bio-
mass and species taxa (Passavante and Feitosa 2004),
and (ii) studies in the literature about primary produc-
tivity for tropical systems (Berger 1989). The regional
productivity is 128 mmoles C m−2 d−1 (annual mean),
101 mmoles C m−2 d−1 (rainy mean) and 155 mmoles
C m−2 d−1 (dry mean) (Fig. 6). The literature reports
values ranging from 15 to 399 mmoles C m−2 d−1. So,
the estimates from regional averages represent an ap-
propriate value to validate the results from the present
study. The (p-r ) estimate of –10 mmoles C m−2 d−1
(annual mean) represents ∼10% of the primary produc-
tion, which is considered appropriate. In this way, res-
piration would represent –138 mmoles C m−2 d−1, and
p/r = 0.92, which means that the system uses 8%
more organic matter than it produces. During the dry
season, the value of (p-r ) is –0.5 mmoles C m−2 d−1,
considering that phytoplanktonic primary production is
155 mmoles C m−2 d−1, p/r = 0.99. It follows that
r is approximately 155.5 mmoles C m−2 d−1. That
is, the system produces about 0.1 more organic matter
than it uses. On the other hand, during the rainy season,
(p-r ) = –19 mmoles C m−2 d−1 and primary produc-
tion is 101 mmoles C m−2 d−1, and so the value of r is
∼120 mmoles C m−2 d−1, with p/r = 0.84. The sys-
tem consumes about 16% more organic matter than it
produces in this second case.
A simple linear regression was used to relate p-
r values to the residence time (TR) (P< 0.05) (Fig. 7).
Longer residence times indicate that the system remains
closer to 0, with a small trend towards autotrophy. On
the other hand, shorter residence times show oscillations
between heterotrophy and autotrophy (Fig. 7).
Rainfall often favors heterotrophic aquatic meta-
bolism due to the increase in the contribution of ter-
restrial organic lixiviation (Ram et al. 2003). However,
rainfall intensification also increases nitrogen and phos-
phorus loads in estuaries (Schindler 1978), which would
benefit autotrophic metabolism, especially in urban and
agricultural areas. During periods with opposite rainfall
characteristics, metabolism seems to oscillate between
light autotrophy and light heterotrophy.
An Acad Bras Cienc (2011) 83 (2)
“main” — 2011/5/13 — 13:52 — page 452 — #12
452 CARLOS E.D. NORIEGA and MOACYR ARAUJO
Fig. 5 – Annual and seasonal nitrogen flux (in moles d−1) budget at the BJE.
(+) indicates source, and (−) indicates sink.
Fig. 6 – Monthly variation of the Ecosystem Net Metabolism (NEM) at the BJE.
Negative and positive values indicate heterotrophy and autotrophy, respectively.
The nitrogen fixation and denitrification are impor-
tant processes in coastal systems. Again, because the
major source of reacting matter is unclear, two N/P ra-
tios are used. The decomposing material has a mean C/P
of 106/1, and N/P of 16/1, which is near the value of
N/P of 11/1 quoted for mangrove litter (Gordon et al.
1996). Based on this ratio of N/P, we estimated that
1DINobs-1DINesp 1DIP* 11 = –5 mmoles m−2 d−1
(annual average). Smith and Camacho (2000) esti-
mated that the differences between N fixation and deni-
trification are in general close to zero (with a domi-
nance of denitrification), and that values above 5 moles
m−2 yr−1 are rare. Our results in general suggest deni-
trification (Fig. 8).
The nitrogen fixation process is ordinarily slow in
marine systems (< 1 mmoles m−2 d−1), according to
An Acad Bras Cienc (2011) 83 (2)
“main” — 2011/5/13 — 13:52 — page 453 — #13
NUTRIENT BUDGETS AND TROPHIC DYNAMIC OF A TROPICAL ESTUARY 453
Fig. 7 – Budget monthly (p-r ) as a function of the system exchange time (days).
Fig. 8 – Monthly variation of N fixation and denitrification rates in the BJE. Negative
and positive values indicate denitrification and fixation of nitrogen, respectively.
Swaney and Smith (2003), although they suggested that
some coral reef, mangrove and tropical seagrass com-
munities may exhibit rates >20 times this upper limit.
As a general rule, few systems have nitrogen fixation
faster than this rate. The value reported for the BJE in
February was low, submitting to this limit, and indicating
that the adjacent mangrove forest did not accelerate this
fixation in the estuary.
The apparently high denitrification during the rainy
season (–7 mmoles m−2 d−1) indicates high benthic res-
piration (driven by high loads with labile organic mat-
ter such as sewage). Typical rates in benthic systems
An Acad Bras Cienc (2011) 83 (2)
“main” — 2011/5/13 — 13:52 — page 454 — #14
454 CARLOS E.D. NORIEGA and MOACYR ARAUJO
are around 0.5-2 mmoles N m−2 d−1. Systems with
high benthic respiration may have denitrification rates
>10 mmoles m−2 d−1 (Swaney and Smith 2003). Dur-
ing the dry season, denitrification is lower (–2 mmoles
m−2 d−1) than in the rainy period. Other tropical estu-
aries, such as the Piauí River Estuary (Brazil), presented
a denitrification rate of –0.13 mmoles m−2 d−1, while
the Sergipe River Estuary (Brazil) seems to fix nitrogen
at 0.1 mmoles m−2 d−1 (Souza 2000).
CONCLUSIONS
We used a bulk modeling approach to evaluate the nu-trient budgets (C, N and P) and the trophic state of atropical estuarine system (BJE). Results show that vari-ations in the annual cycle of the net ecosystem meta-bolism from 1999-2003 depend on seasonal forces, suchas basin-scale runoff and DIP loads. Results obtainedthrough mass balance indicate large amounts of anthro-pogenic nutrient inputs to the system. These loads act asa source for dissolved inorganic phosphorus during thedry and rainy season. The loads of dissolved inorganicnitrogen act as sinks throughout the year. During thewinter, the BJE basin exceeded the values reported forDIP and DIN (moles km−2 yr−1) in the literature forbasins of up to 1000 km2. These seasonal oscillationsof heterotrophy and autotrophy show a moderate ten-dency to heterotrophy, indicating that the system passesto liquid production stages of organic matter when pro-duction surpasses mineralization (September-December)and liquid mineralization stages (March-August).
The linear regression between p-r and the resid-ence time shows lower entropy in the dry season andautotrophy at lower rates than during the high residencetimes but, this needs to be confirmed in future studies.
Also evident is the importance of denitrification inthe BJE, which establishes that the system is a net deni-trificator at moderate rates, probably in association withthe degradation of labile organic matter originated fromsewage.
Consequently, both heterotrophy and denitrificationare enhanced by the production of carbon and nitrogenduring the rainy season, whereas heterotrophic systemsmainly depend on the inputs or loads of organic carbonof the adjacent systems.
We considered that high-density human occupation
in the basin contributes significantly to N and P emis-sions throughout the year. High per capita loads of Nand P indicate a scenario of high population densityand high runoff. However, it seems important to recog-nize that ignoring the uptake and release of nutrients (Nand P) by abundant mineral particles in the estuary maycause errors in nutrient balances, although the evidencereported here helps us to understand the main processesdriving the metabolism of poorly studied typical smalllow-latitude estuaries.
ACKNOWLEDGMENTS
We thank the Pernambuco State Water ResourcesAgency (SRH) (Secretaria de Recursos Hídricos) andPernambuco State Environmental Agency (CPRH)(Agência Estadual de Meio Ambiente e Recursos Hí-dricos) for their cooperation regarding the field dataused in this work. The authors would like to thank theBrazilian National Council of Scientific and Technolo-gical Development – CNPq (Conselho Nacional deDesenvolvimento Científico e Tecnológico) under thescope of the Project BIO-NE (grant 558143/2009-1).We are also grateful to Dr. Monica Costa for her manu-script review and insightful comments.
RESUMO
Este trabalho se focalizou na dinâmica de nutrientes de um
estuário tropical na costa nordeste brasileira, usando o proto-
colo LOICZ de balanços biogeoquímicos. Nós descrevemos
a metodologia e os pressupostos subjacentes a este modelo.
Os dados de entrada (precipitação e evaporação mensal, vazão
do rio, e as concentrações de sal, fósforo e nitrogênio) foram
obtidos durante as campanhas de campo no estuário de Barra
das Jangadas – Brasil durante um período de 5 anos (1999 a
2003). Os resultados indicam grandes entradas de nutrientes
ao sistema. O modelo mostrou que a variação sazonal do Me-
tabolismo do Ecosistema (NEM) indica que o sistema passa
de uma fase de produção de líquido da matéria orgânica, du-
rante a estação seca (–0,5 mmoles C m−2 d−1) para uma
mineralização líquida durante a estação chuvosa (–19 mmol
m−2 C d−1). Sugerimos que o sistema varia ligeiramente
entre autotrófica e heterotrófica durante o ano, devido ao regime
de chuvas, as atividades antrópicas na bacia (densidade popula-
cional e as plantações de cana de açúcar), e as cargas ribeirinhas
de DIP associadas. A alta carga de N e P per capita, indica uma
alta densidade populacional e um alto runoff. A aplicação da
An Acad Bras Cienc (2011) 83 (2)
“main” — 2011/5/13 — 13:52 — page 455 — #15
NUTRIENT BUDGETS AND TROPHIC DYNAMIC OF A TROPICAL ESTUARY 455
modelagem de balanço de fluxos foi útil para o entendimento
da dinâmica de nutrientes em um pequeno estuário tipicamente
tropical.
Palavras-chave: Brasil, Barra das Jangadas Estuário, varia-
ções sazonais, heterotrofia, autotrofia, dióxido de carbono.
REFERENCES
ARAUJO M, COSTA MF, AURELIANO JT AND SILVA MA.2008. Mathematical modelling of hydrodynamics andwater quality in a tropical reservoir, Northeast Brazil.BJAST 12: 19–30.
ARAUJO M, MEDEIROS C AND RIBEIRO C. 1999. En-ergy balance and time-scales of mixing and stratificationin the Jaboatão estuary, NE-Brazil. Braz J Oceanogr 47:145–154.
BERGER WH (ED). 1989. Global maps of ocean productiv-ity. In: SCHLESINGER WH (Ed), Biogeochemistry ananalysis of global change, New York: Academic Press,New York, USA, p. 301–307.
BIDONE ED. 2000. Análise econômica-ambiental aplicada àcontaminação de águas fluviais de pequenas bacias cos-teiras do Estado do Rio de Janeiro. In: ESTEVES FAAND LACERDA LD (Eds), Ecologia de restingas e lagoascosteiras, Rio de Janeiro, Ed. UFRJ, Rio de Janeiro, Brasil,p. 371–394.
BIDONE ED AND LACERDA LD. 2002. A preliminary ap-proach of the link between socio-economic and naturalindicators into a driver-pressure-impact-response frame-work case study: Guanabara Bay Basin, Rio de Janeiro,Brazil. In: LACERDA LD ET AL. (Eds), South AmericanBasins: LOICZ global change assessment and synthesisof river catchment – coastal sea interaction and humandimensions, Texel, LOICZ Reports and Studies No. 21,Texel, The Netherlands, 212 p.
BISWAS H, MUKHOPADHYAY SK, DE TK, SEN S AND
JANA TK. 2004. Biogenic controls on the air-water car-bon dioxide exchange in the Sundarban mangrove envi-ronment, northeast coast of Bay of Bengal, India. LimnolOceanogr 49(1): 95–101.
BNDO – BANCO NACIONAL DE DADOS OCEANOGRÁFI-COS. 2004. Serviço de banco de dados oceanográficos.<http://www.mar.mil.br/dhn/chm/bndo/>.
BRANCO ES. 2002. Variação Sazonal e Espacial da Biomas-sa Fitoplanctônica Relacionada com Parâmetros Hidro-lógicos no Estuário de Barra das Jangadas (Jaboatão dosGuararapes – Pernambuco – Brasil). Trop Ocean 30:79–96.
BRANCO ES. 2006. Variação sazonal das algas planctônicascorrelacionadas com parâmetros ambientais no estuáriode Barra das Jangadas (Jaboatão dos Guararapes – PE –Brasil). Bol Téc Cient CEPENE 14: 17–23.
CPRH – AGÊNCIA ESTADUAL DE MEIO AMBIENTE E RE-CURSOS HÍDRICOS. 2003. Relatório de monitoramentode bacias hidrográficas do estado de Pernambuco 1999-2003, Recife. <http://www.cprh.pe.gov.br>.
DALE A AND PREGO R. 2005. Net autotrophy and hetero-trophy in the Pontevedra Ria upwelling system (NWIberian margin). Cienc Mar 31: 213–220.
EKAU W AND KNOPPERS B. 1999. An introduction to thepelagic system of the north-east and east Brazilian shelf.Arch Fish Mar Res 47: 113–132.
EYRE BD AND MCKEE LJ. 2002. Carbon, nitrogen andphosphorus budgets for a shallow subtropical coastalembayment (Moreton Bay, Australia). Limnol Oceanogr47: 1043–1055.
GATTUSO JP, FRANKIGNOULLE M AND WOLLAST R.1998. Carbon and carbonate metabolism in coastalaquatic ecosystems. Annual Review of Ecol and Syst29: 405–434.
GORDON JR DC, BOUDREAU PR, MANN KH, ONG J-E,SILVERT WL, SMITH SV, WATTAYAKORN G, WULFF
F AND YANAGI T. 1996. LOICZ Biogeochemical Mod-elling Guidelines. LOICZ Reports and Studies No. 5,96 p.
HESSEN DO, AGREN GI, ADERSON TR, ELSER JJ AND DE
RUITER PC. 2004. Carbon sequestration in ecosystems:the role of stoichiometry. Ecology 85: 1179–1192.
HOLLAND HD. 1978. The chemistry of the atmosphere andoceans. New York, Willey, 351 p.
IBGE – INSTITUTO BRASILEIRO DE GEOGRAFIA E ES-TATÍSTICA. 2000. Censo demográfico.<http://www.ibge.gov.br/cidadessat/default.php>.
INMET – INSTITUTO NACIONAL DE METEOROLOGIA.2003. Relatório mensal de dados meteorológicos 1999-2003. <http://www.inmet.gov.br>.
IRIGOIEN X AND CASTEL JC. 1997. Light limitation anddistribution of Chlorophyll pigments in the highly turbidestuary: the Gironde (SW France). Estuar Coast ShelfSci 44: 507–517.
KNOPPERS BA, FIGUEIREDO AG AND EKAU W. 1999.The coast and shelf of east and northeast Brazil andmaterial transport. Geo-Mar Lett 19: 171–178.
KNOPPERS BA, SOUZA WFL, EKAU W, FIGUEIREDO AGAND SOARES-GOMES A. 2009. A Interface Terra-Mardo Brasil. In: PEREIRA RC AND SOARES-GOMES A
An Acad Bras Cienc (2011) 83 (2)
“main” — 2011/5/13 — 13:52 — page 456 — #16
456 CARLOS E.D. NORIEGA and MOACYR ARAUJO
(Eds), Biologia Marinha. 2a ed., Rio de Janeiro: Inter-ciência, p. 529–553.
LAL R, KIMBLE JM AND STEWART BA. 2000. Global cli-mate change and tropical ecosystems, Boca Raton: CRCPress, 438 p.
MARONE E, MACHADO E, LOPES R AND DA SILVA ET.2005. Land-Ocean fluxes in the Paranaguá Bay estuarinesystem, southern Brazil. Braz J Oceanogr 53(3/4): 169–181.
MEYERS T, SICKLES J, DENNIS R, RUSSELL RK, GAL-LOWAY J AND CHURCH T. 2001. Atmospheric nitro-gen deposition to coastal estuaries and their watersheds.In: VALIGURA RA, ALEXANDER RB, CASTRO MS,MEYERS TP, PAERL HW, STACEY PE AND TURNER
RE (Eds), Nitrogen loading in coastal water bodies: An at-mospheric perspective, Washington: American Geophys-ical Union, p. 401–410.
MUKHOPADHYAY SK, BISWAS H, DE TK AND JANA TK.2006. Fluxes of nutrients from tropical River Hooghlyat the land-ocean boundary of Sundarbans NE Coast ofBay of Bengal, India. J Marine Syst 62: 9–21.
NORIEGA CED, MUNIZ K, ARAUJO MC, TRAVASSOS RKAND NEUMANN-LEITÃO S. 2005a. Fluxos de nutrientesinorgânicos dissolvidos em um estuário tropical – Barradas Jangadas – PE, Brasil. Trop Ocean 33: 129–139.
NORIEGA CED, MUNIZ K, FEITOSA FA, FLORES-MONTES
MJ, GREGO CK, SCHEIDT G AND SILVA HP. 2005b.Distribuição espacial da biomassa fitoplanctônica e suarelação com os sais nutrientes em um estuário tropical(Barra das Jangadas – PE – Brasil). Arq Cien Mar 38:5–21.
NORIEGA CED, MUNIZ K, FLORES-MONTES MJ, MACÊ-DO S, ARAUJO M, FEITOSA FA AND LACERDA S. 2009.Series temporales de variables hidrobiológicas en un es-tuario tropical (Brasil). Rev Biol Mar Oceanog 44(1):93–108.
PASSAVANTE JZ AND FEITOSA FA. 2004. Dinâmica da pro-dutividade fitoplanctônica na zona costeira marinha. In:ESKINAZI-LEÇA E, NEUMANN-LEITAO S AND COSTA
MF (Eds), Oceanografia: Um cenário tropical, Recife:Edições Bagaço, Recife, Brasil, p. 425–440.
RAM PAS, NAIR S AND CHANDRAMOHAN D. 2003. Sea-sonal shift in net ecosystem production in a tropical estu-ary. Limnol Oceanogr 48: 1601–1607.
SAN DIEGO-MCGLONE ML, SMITH SV AND NICOLAS VF.2000. Stoichiometric interpretations of C:N:P ratios inorganic waste materials. Mar Pollut Bull 40: 325–330.
SCHINDLER DW. 1978. Factors regulating phytoplanktonproduction and standing crop in worlds freshwaters. Lim-nol Oceanogr 23: 478–486.
SCHLESINGER WH. 1997. Biogeochemistry: An analysisof global change. 2nd ed. San Diego: Academic Press.430 p.
SECTMA – SECRETARIA DE CIÊNCIA, TECNOLOGIA E
MEIO AMBIENTE. 1999. Plano estadual de recursos hí-dricos, PERHPE. <http://www.inmet.gov.pe.br>.
SMITH SV AND CAMACHO V. 2000. Flujos de CNP en lazona costera. <http://nest.su.se/mnode/Methods/powerpoint/LOICZoverview_sp.ppt>.
SMITH SV AND HOLLIBAUGH JT. 1997. Annual cycle andinterannual variability of net and gross ecosystem meta-bolism in a temperate climate embayment. Ecol Monogr67: 509–533.
SMITH SV, SWANEY DP, BUDDEMEIER RW, SCARSBROOK
MR, EATHERHEAD MA, HUMBORG C, ERIKSSON HAND HANNERZ F. 2005. River nutrient loads and catch-ment size. Biogeochemistry 75: 83–107.
SMITH SV ET AL. 2003. Humans, hydrology, and the dis-tribution of inorganic nutrient loading to the ocean. Bio-Science 53: 235–245.
SOUZA MFL. 2000. Rio Sergipe and Piauí River Estuaries.In: SMITH SV, DUPRA V, MARSHALL CROSSLAND JIAND CROSSLAND CJ (Eds), Estuarine systems of theSouth American region: carbon, nitrogen and phospho-rus fluxes, Texel, LOICZ Reports and Studies 15, Texel,The Netherlands, p. 6–17.
SWANEY DP AND SMITH SV. 2003. Guidelines for con-structing nutrient budgets of coastal systems. In: CROSS-LAND CJ, KREMER HH, LINDEBOOM HJ, MARSHALL-CROSSLAND JI AND LE TISSIER MDA (Eds) Coastalfluxes in the anthropocene, Berlin, Springer, Berlin, Deut-shland, p. 110–111.
TAPPIN AD. 2002. An examination of the fluxes of nitrogenand phosphorus in temperate and tropical estuaries: Cur-rent estimates and uncertainties. Estuar Coast Shelf Sci55: 885–901.
WEBSTER IT, PARSLOW JS AND SMITH SV. 2000. Implica-tions of spatial and temporal for biogeochemical budgetsof estuaries. Estuaries 23: 341–350.
WEPENER V. 2007. Carbon, nitrogen and phosphorus fluxesin four sub-tropical estuaries of northern KwaZulu-Natal:Case studies in the application of a mass balance approach.Water SA 33: 203–214.