67
Nutrient Management Workbook 2009 Jon Rausch, Amanda Meddles & Robert Mullen Ohio State University Extension
| Date post: | 19-Dec-2015 |
| Category: |
Documents |
| View: | 217 times |
| Download: | 3 times |

Nutrient Management Workbook 2009
Jon Rausch, Amanda Meddles
& Robert Mullen
Ohio State University Extension

MSR Agenda Today
9:00 Introduction & WelcomeWorkbook overview
10:30 Break (pick-up pencil + calculator)
Work nutrient management example
Complete field plan for your farm Noon Lunch

Objective
Development a nutrient management plan for each field of the farming operation. Focus on those utilizing animal manure.
Take Home: General understanding of this Nutrient
Management Workbook Steps toward and approved Nutrient
Management Plan

Outline
Identify available soil resources. Identify manure nutrients available. Identify the nutrient needs of growing crop. Identify sources of nutrients available for that crop. Allocate and balance available nutrients by field. Estimate nutrient carry-over, if any, and the value of that
carry-over. Identify spreadable acres available for manure application. Estimate number of acres needed to recycle manure nutrients
generated by your operation. Identify steps toward an approved plan.

Heritage Lane Dairy
2009


Example Farm
Page 1
Throughout the book an example is provided based on a farm that is currently milking 100 dairy cows and has 200 acres. This farm has a rotation of corn, soybeans, wheat, and alfalfa and fertilizes his fields with manure from the dairy operation. This is supplemented with commercial fertilizer when necessary. The field used throughout this book as an example is Brown 1 or B1. It is 30 acres and will be planted in corn. The previous crop was soybeans. Examples based on this scenario can be found in different sections throughout the book in gray boxes like this one.
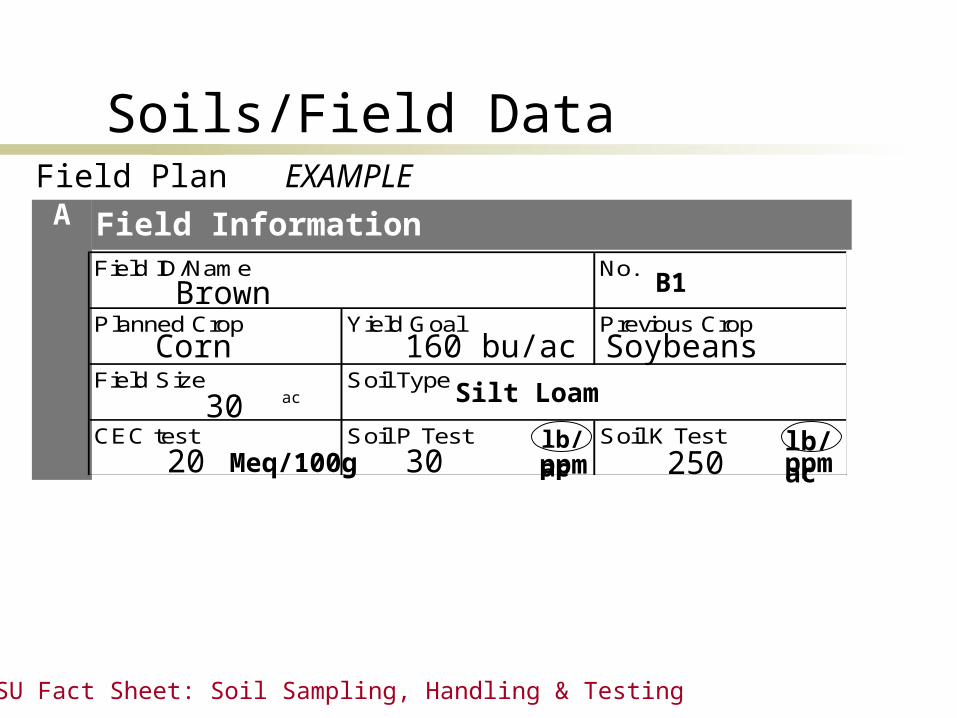
Soils/Field Data
OSU Fact Sheet: Soil Sampling, Handling & Testing
Field Plan EXAMPLE
Field ID/Name No.
Planned Crop Yield Goal Previous Crop
Field Size Soil Type
Soil K TestSoil P TestCEC test
A Field Information
ac
Meq/100g
Brown
160 bu/ac
30
20 30 250ppm
Corn
B1
Silt Loam
Soybeans
lb/ac
lb/acppm

Soil Test-Preferred

Yield response likely
Yield response NOT likely
Increasing

Soil Test Critical Values
K at CECK at CEC
PP 55 1010 2020 3030
CropCrop ppm ppm ((lb/acrelb/acre))
ppm ppm
((lb/acrelb/acre))
CornCorn 15 15 ((3030))
88 88 ((175175))
100 100 ((200200))
125 125 ((250250))
150 150 ((300300))
SoybeanSoybean 15 15 ((3030))
88 88 ((175175))
100 100 ((200200))
125 125 ((250250))
150 150 ((300300))
WheatWheat 25 25 ((5050))
88 88 ((175175))
100 100 ((200200))
125 125 ((250250))
150 150 ((300300))

No Soil Test
Page 2
Assumes maintenance level
Nutrientppm lb/ac
P2O5- Corn and
soybeans
15 30
P2O5- wheat and
alfalfa
25 50
K2O- all crops 125 250

Winter application see page 17
Example Farm

Manure Test-Preferred
14
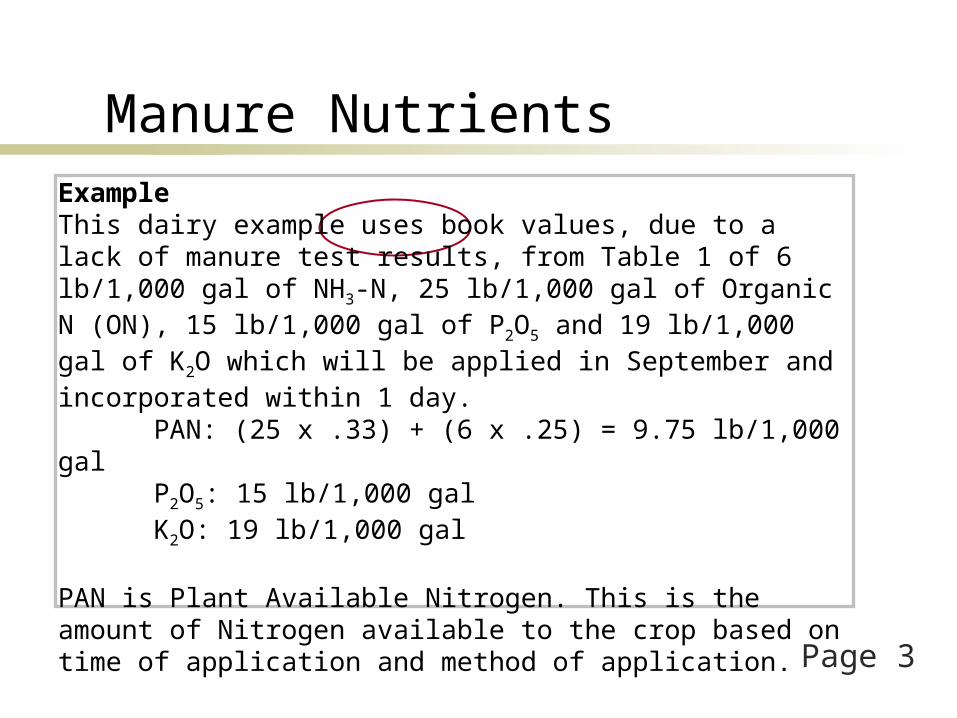
Manure Nutrients
Page 3
ExampleThis dairy example uses book values, due to a lack of manure test results, from Table 1 of 6 lb/1,000 gal of NH3-N, 25 lb/1,000 gal of Organic N (ON), 15 lb/1,000 gal of P2O5 and 19 lb/1,000 gal of K2O which will be applied in September and incorporated within 1 day.
PAN: (25 x .33) + (6 x .25) = 9.75 lb/1,000 galP2O5: 15 lb/1,000 galK2O: 19 lb/1,000 gal
PAN is Plant Available Nitrogen. This is the amount of Nitrogen available to the crop based on time of application and method of application.

Page 3-4

Time of Year
page 5

Calculating PAN- Example Farm
PAN worksheet top of page 3
13.46
7.5725% 33% 5.88
60% diff.
Test 1

Winter (Frozen & Snow Covered) application see page 17
Example Farm

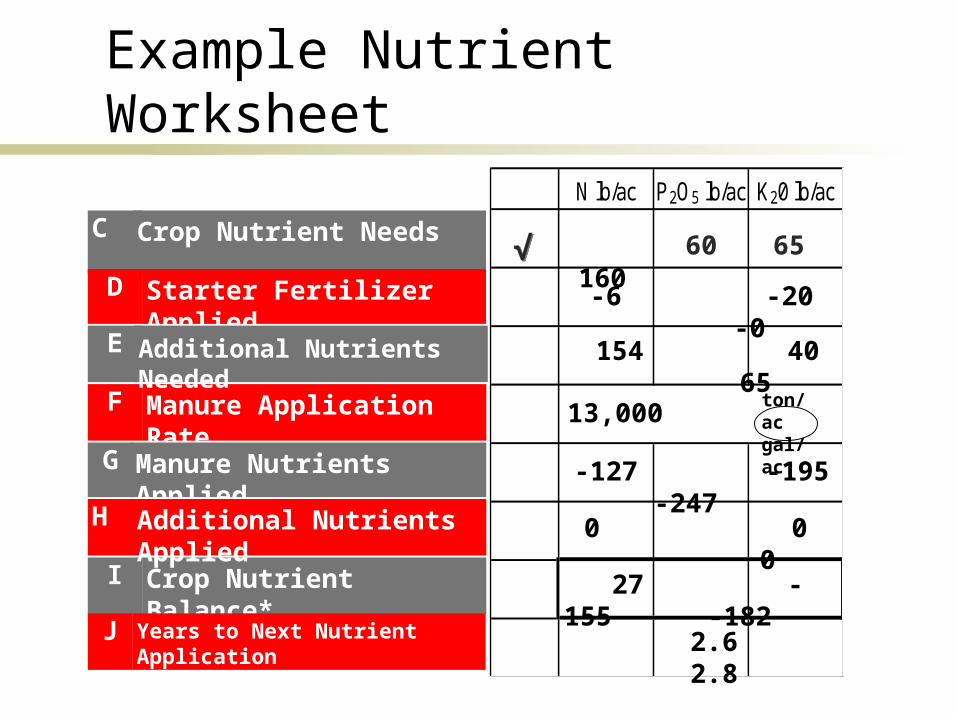
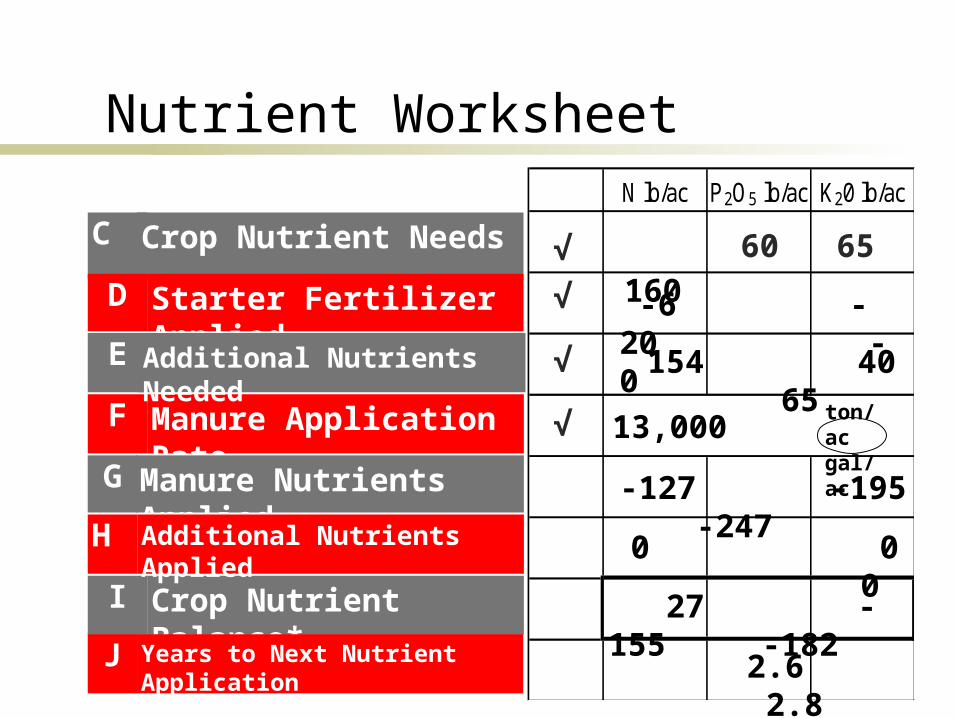
Example Nutrient Worksheet
E
Manure Application RateF
G Manure Nutrients Applied
I Crop Nutrient Balance*
Additional Nutrients AppliedH
C Crop Nutrient Needs
N lb/ac P2O5 lb/ac K20 lb/ac
160
-6 -20 -0
154 40 65
13,000
-127 -195 -247
27 -155 -182
ton/acgal/ac
0 0 0
D Starter Fertilizer Applied
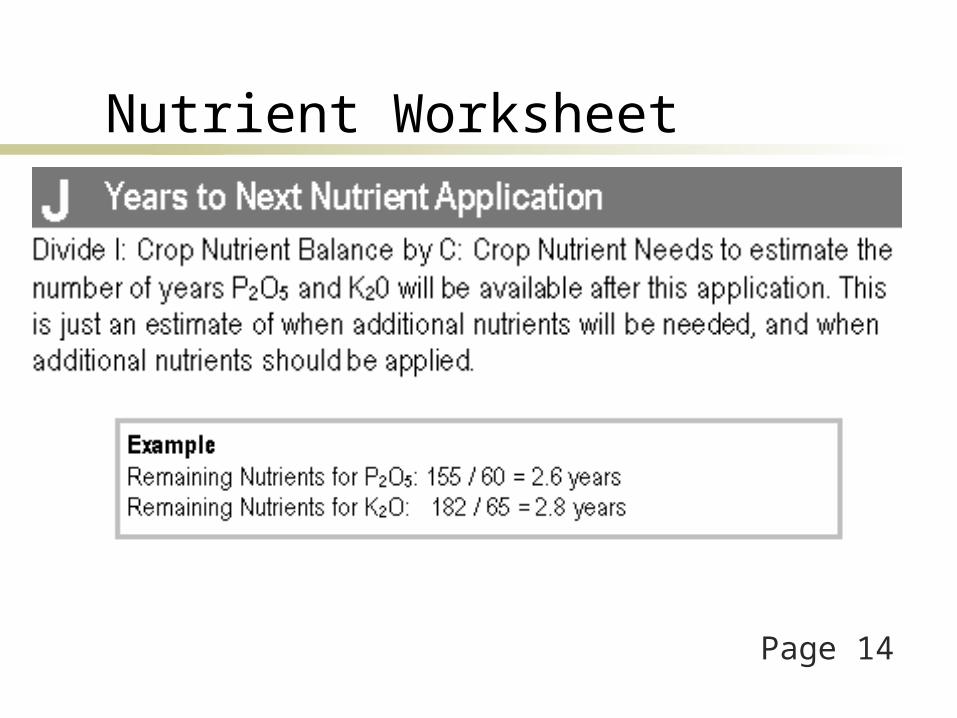
J Years to Next Nutrient Application
60 65
Additional Nutrients Needed
2.6 2.8

Example Farm
Page 5
ExampleA dairy farmer expects 160 bu/ac of grain corn in field B1. The previous crop was soybeans. Nutrient recommendations without soil test values are:
PAN: 160 lb/ac P2O5: 60 lb/ac K2O: 65 lb/ac

Corn Silage use 1T/ac = 6 bu/ac; 160 bu/ac = 26.6 T/ac silage
Page 6

Page 6-8
Yield Potential– bu/ac
Soil Test 100 120 140 160 180
ppm (lb/ac) lb P2O5 per acre
5 (10)1 85 95 100 110 115
10 (20) 60 70 75 85 90
15-30 (30-60)2 35 45 50 60 65
35 (70) 20 20 25 30 35
40 (80) 0 0 0 0 0
P2O5 Recommendation
Page 8-10
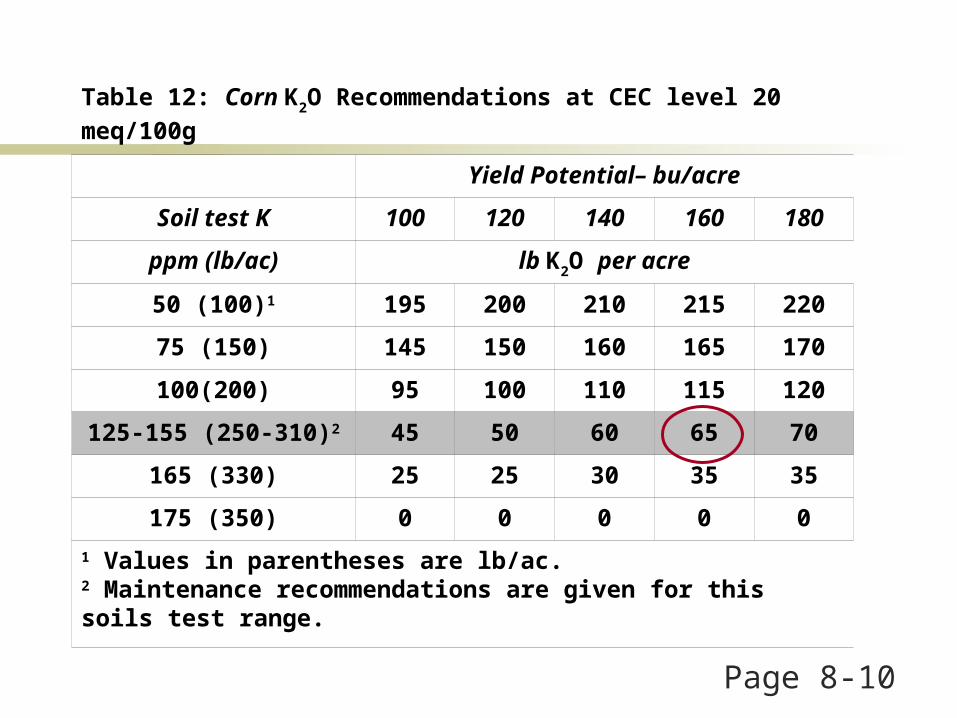
Table 12: Corn K2O Recommendations at CEC level 20 meq/100g
Yield Potential– bu/acre
Soil test K 100 120 140 160 180
ppm (lb/ac) lb K2O per acre
50 (100)1 195 200 210 215 220
75 (150) 145 150 160 165 170
100(200) 95 100 110 115 120
125-155 (250-310)2 45 50 60 65 70
165 (330) 25 25 30 35 35
175 (350) 0 0 0 0 0
1 Values in parentheses are lb/ac.2 Maintenance recommendations are given for this soils test range.
√√
Example Nutrient Worksheet
E
Manure Application RateF
G Manure Nutrients Applied
I Crop Nutrient Balance*
Additional Nutrients AppliedH
C Crop Nutrient Needs
N lb/ac P2O5 lb/ac K20 lb/ac
160
-6 -20 -0
154 40 65
13,000
-127 -195 -247
27 -155 -182
ton/acgal/ac
0 0 0
D Starter Fertilizer Applied
J Years to Next Nutrient Application
60 65
Additional Nutrients Needed
2.6 2.8
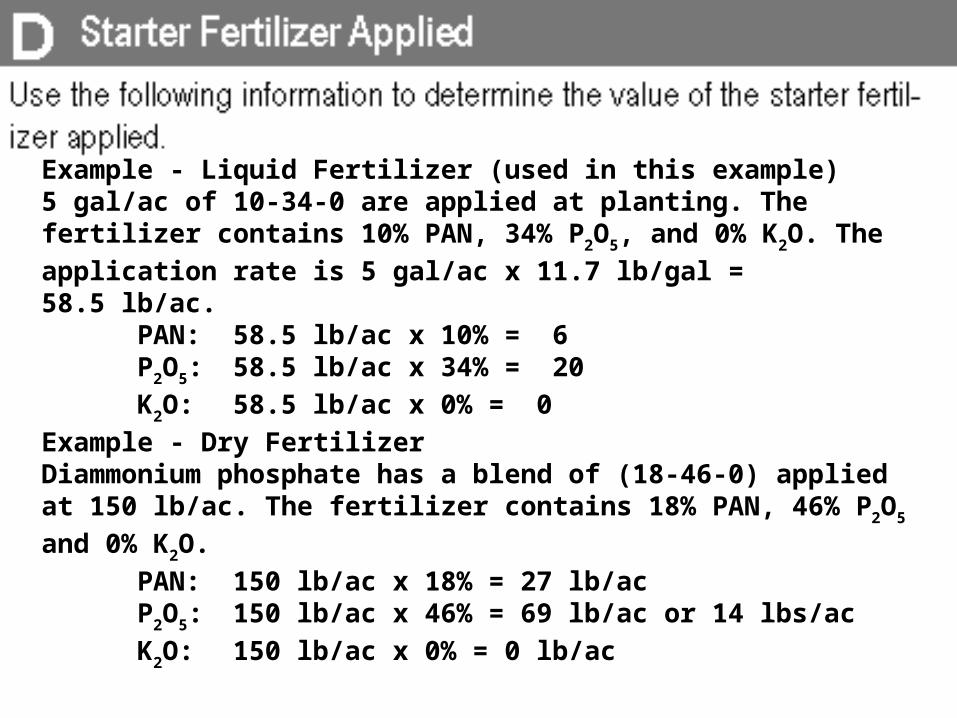
Example - Liquid Fertilizer (used in this example)5 gal/ac of 10-34-0 are applied at planting. The fertilizer contains 10% PAN, 34% P2O5, and 0% K2O. The application rate is 5 gal/ac x 11.7 lb/gal =
58.5 lb/ac.PAN: 58.5 lb/ac x 10% = 6P2O5: 58.5 lb/ac x 34% = 20
K2O: 58.5 lb/ac x 0% = 0
Example - Dry FertilizerDiammonium phosphate has a blend of (18-46-0) applied at 150 lb/ac. The fertilizer contains 18% PAN, 46% P2O5 and 0% K2O.
PAN: 150 lb/ac x 18% = 27 lb/acP2O5: 150 lb/ac x 46% = 69 lb/ac or 14 lbs/ac
K2O: 150 lb/ac x 0% = 0 lb/ac

E
Manure Application RateF
G Manure Nutrients Applied
I Crop Nutrient Balance*
Additional Nutrients AppliedH
C Crop Nutrient Needs
N lb/ac P2O5 lb/ac K20 lb/ac
160
-6 -20 -0
154 40 65
13,000
-127 -195 -247
27 -155 -182
ton/acgal/ac
0 0 0
D Starter Fertilizer Applied
J Years to Next Nutrient Application
60 65
Additional Nutrients Needed
2.6 2.8
√
Nutrient Worksheet

E
Manure Application RateF
G Manure Nutrients Applied
I Crop Nutrient Balance*
Additional Nutrients AppliedH
C Crop Nutrient Needs
N lb/ac P2O5 lb/ac K20 lb/ac
160
-6 -20 -0
154 40 65
13,000
-127 -195 -247
27 -155 -182
ton/acgal/ac
0 0 0
D Starter Fertilizer Applied
J Years to Next Nutrient Application
60 65
Additional Nutrients Needed
2.6 2.8
√
√
Nutrient Worksheet
√

Page 12See also: NRCS-633, Table 4, page 13
ExampleThe dairy farmer decides to base his application rate on the nitrogen need of the corn crop. Field B1 needs 154 lb/ac of PAN (from E: Additional Nutrients Needed) and the manure has a value of 9.75 lb/1000 gal or 0.00975 lb/gal .PAN Application Rate = 154 lb/ac / 0.00975 lb/gal = 15,794 gal/ac If he chose to use P2O5: 40 lb/ac / 0.015 lb/gal = 2,700 gal/ac
If he chose to use K2O: 65 lb/ac / 0.019 lb/gal = 3,421 gal/ac

Determining Application Rate
“P” Soil Test Level Application Criteria
Bray-Kurtz P1 < 80 Lbs/AcLOW POTENTIAL N rate or P2O5.
Bray-Kurtz P180 – 200 Lbs/Ac
MODERATE POTENTALN rate or P2O5 removal for rotation, whichever
is less.
Bray-Kurtz P1 200-300 Lbs/Ac
HIGH POTENTIAL
N rate or P2O5 removal for rotation, whichever is less PLUS additional setback criteria
from drainageway/water source/concentrated flow areas and/or other environmentally sensitive areas.
Bray-Kurtz P1 > 300 Lbs/AcVERY HIGH POTENTIAL No additional P2O5 – Use P2O5 Draw-down
Strategies

Manure Nutrients
Application rate gal/ac
Nutrient/ac 15,800 2,700 3,400 N 154 26 33 P2O5 237 40 51 K2O 300 51 65
E
Manure Application RateF
G Manure Nutrients Applied
I Crop Nutrient Balance*
Additional Nutrients AppliedH
C Crop Nutrient Needs
N lb/ac P2O5 lb/ac K20 lb/ac
160
-6 -20 -0
154 40 65
13,000
-127 -195 -247
27 -155 -182
ton/acgal/ac
0 0 0
D Starter Fertilizer Applied
J Years to Next Nutrient Application
60 65
Additional Nutrients Needed
2.6 2.8
√
√
√
Nutrient Worksheet
√

Manure Nutrients Applied
Page 13
ExampleManure Nutrient Values for field B1 are 11.25 lb/1000 gal of PAN, 15 lb/1000 gal P2O5, and 19 lb/1000 of K2O. Dividing these
by 1000 to achieve lb/gal or a PAN of 0.01125 lb/gal, P2O5 of
0.015 lb/gal, and K2O of 0.019 lb/gal. The application rate
calculated previously is 15,794 gal/ac but 13,000 gal/ac was applied.
PAN: 0.00975 lb/gal x 13,000 gal/ac = 127 lb/ac P2O5: 0.015 lb/gal x 13,000 gal/ac = 195 lb/ac
K2O: 0.019 lb/gal x 13,000 gal/ac = 247 lb/ac

E
Manure Application RateF
G Manure Nutrients Applied
I Crop Nutrient Balance*
Additional Nutrients AppliedH
C Crop Nutrient Needs
N lb/ac P2O5 lb/ac K20 lb/ac
160
-6 -20 -0
154 40 65
13,000
-127 -195 -247
27 -155 -182
ton/acgal/ac
0 0 0
D Starter Fertilizer Applied
J Years to Next Nutrient Application
60 65
Additional Nutrients Needed
2.6 2.8
√
√
√
Nutrient Worksheet
√
√

Additional Nutrients
Page 13
PSNT: Pre Side-dress Nitrogen Test• Applicable for fields with history of manure application• Designed to capture ON cycling• Sample just prior to side-dress N application• Indicator of NO3-N + NH4-N available• 30 ppm sufficient PAN, low probability of yield response with additional N• 0 – 30 ppm, higher probability of yield response with additional N

E
Manure Application RateF
G Manure Nutrients Applied
I Crop Nutrient Balance*
Additional Nutrients AppliedH
C Crop Nutrient Needs
N lb/ac P2O5 lb/ac K20 lb/ac
160
-6 -20 -0
154 40 65
13,000
-127 -195 -247
27 -155 -182
ton/acgal/ac
0 0 0
D Starter Fertilizer Applied
J Years to Next Nutrient Application
60 65
Additional Nutrients Needed
2.6 2.8
√
√
√
Nutrient Worksheet
√
√
√
√
Nutrient Worksheet
Page 14

Nutrient Carry-over
Apply based on N needs of crop when applicable and P for rotation.
2.6 year carry-over means the need for more P is not likely for 2-3 years, but dependant upon crop rotation and soil test level.

E
Manure Application RateF
G Manure Nutrients Applied
I Crop Nutrient Balance*
Additional Nutrients AppliedH
C Crop Nutrient Needs
N lb/ac P2O5 lb/ac K20 lb/ac
160
-6 -20 -0
154 40 65
13,000
-127 -195 -247
27 -155 -182
ton/acgal/ac
0 0 0
D Starter Fertilizer Applied
J Years to Next Nutrient Application
60 65
Additional Nutrients Needed
2.6 2.8
√
√
√
Nutrient Worksheet
√
√
√
√
√

Nutrient Worksheet
K Spreadable Acreage (field sketch on back)
L Value of Excess Nutrients Applied
28.9 ac.
$11,833.11
M Manure Storage Management
Volume Applied = Volume Remaining = 375,700 gal 597,390 gal

Backside of worksheet

Common Set-backs
Page 15

Nutrient Worksheet
√
K Spreadable Acreage (field sketch on back)
L Value of Excess Nutrients Applied
28.9 ac.
$11,833.11
M Manure Storage Management
Volume Applied = Volume Remaining = 375,700 gal 597,390 gal

Page 18
Fertilizer value used June ‘09:Urea = $420/ton = $0.46/lb NDAP $500/ton = $0.37/lb P2O5Potash $770/ton = $0.65/lb K2O
$1,657$3,419
$5,076

Nutrient Worksheet
√
√ $5,076
K Spreadable Acreage (field sketch on back)
L Value of Excess Nutrients Applied
28.9 ac.
$11,833.11
M Manure Storage Management
Volume Applied = Volume Remaining = 375,700 gal 597,390 gal

Page 19

Page 20

Manure Production
Dry CowsDry Cows
Heifers
973, 090
13.6 20 365 99,280 gal
7.8 80 365 227,760 gal
Does not include bedding or other additions to storage


Total Nutrients Available
973,090 gallons available
= $21,782 (PAN, P2O5, K2O) Total PAN = 973.09 * 9.75 = 9,488 lb
9,488 / 160 = 60 ac 9,488 * $0.46/lb = $4,365
Total P2O5 = 973.09 * 15 = 14,596 lb 14,596 / 60 = 243 ac 14,596 * $0.37/lb =$5,400
Total K2O = 973.09 * 19 = 18,489 lb 18,489/ 65 = 285 ac 18,489 *$0.65 = $12,018

Manure Application Records
Field record book Emergency contact information Spill response information Equipment information Detailed ‘day-of-application’ information Winter application guidelines

Break
Pick up pencil + calculator

Corn Silage Example
Change planned crop to Corn Silage (26 T/ac) following Grain Corn (160 bu/ac)
Application (April-June) with direct inject/incorporate.

Corn Silage use 1T/ac = 6 bu/ac; 160 bu/ac = 26.6 T/ac silage
Page 6

Corn Silage (26 T/ac)
Yield Potential– tons/acre
Soil Test 20 22 24 26 28
ppm (lb/ac) lb P2O5 per acre
5 (10)1 115 125 130 135 140
10 (20) 90 100 105 110 115
15-30 (30-60)2 65 75 80 85 90
35 (70) 35 40 40 45 45
40 (80) 0 0 0 0 0
Page 8

Corn Silage (26 T/ac)Table 16: Corn Silage K2O Recommendations at CEC level 20
meq/100g
Yield Potential– tons/acre
Soil test K 20 22 24 26 28
ppm (lb/ac) lb K2O per acre
50 (100)1 300 300 300 300 300
75 (150) 280 295 300 300 300
100(200) 230 245 260 280 295
125 (250)2 180 195 210 230 245
145 (290) 110 120 125 135 145
165 (330) 35 40 40 45 50
175 (350) 0 0 0 0 01 Values in parentheses are lb/ac.2 Maintenance recommendations are given for this soils test range. Page 10

Time of Year
page 5

Calculating PAN- Example Farm
PAN worksheet top of page 3
6 2575% 33% 12.75
April/June

Heritage Lane Dairy
Dairy
19
12.75
15

N lb/ac P2O5 lb/ac K20 lb/ac
190 85 230
-6 -20 0
184 65 230
13,000
-166 -195 -247
18 -130 -17
0 0 0
Heritage Lane Dairy
1.5 0
E
Manure Application RateF
G Manure Nutrients Applied
I Crop Nutrient Balance*
Additional Nutrients AppliedH
C Crop Nutrient Needs
ton/acgal/ac
D Starter Fertilizer Applied
J Years to Next Nutrient Application
Additional Nutrients Needed

Manure Value Change What is the per acre change in manure
nutrient value when the application period changes from Sept-Oct to April-June?
Only PAN changed. 9.75 lb/1,000 gal (Sept-Oct) 12.8 lb/1,000 gal (April-June)
12.8 – 9.75 = 3.05 lb/1,000 gal Price of N = $0.65/unit of N
3.05 units * $0.65 = $1.98/1,000 gal $18.83 - $25.77 / acre (9.5 – 13k gal/ac)

Summary
Balanced nutrient inputs to match crop nutrient needs + soil resources(?) Soil test is necessary for full utilization of nutrient
inputs. Application of nutrients beyond crop needs
and soil carrying capacity increases risk of nutrient moving off-site. Economic loss ($$$) When, where, how and how much are important
questions to ask.

Summary
Nutrient sampling/testing is necessary to “fine-tune” a nutrient management program. Testing provides you a tool to make an
“educated guess.” Nutrient management workbook used as a
tool to: Verify current nutrient management practices. Identify more efficiently uses of on-farm
nutrients. others
Questions
Amanda Meddles, [email protected], 614-292-6625
Jon Rausch,
[email protected], 614-292-4504
www.oema.osu.edu


![Meet mullen[1]](https://static.documents.pub/doc/80x56/54519d3aaf795911068b5332/meet-mullen1.jpg)


