Nutrient spiraling in streams and river networks Scott H. Ensign 1 and Martin W. Doyle 2 Received 24 October 2005; revised 22 June 2006; accepted 25 July 2006; published 17 November 2006. [1] Over the past 3 decades, nutrient spiraling has become a unifying paradigm for stream biogeochemical research. This paper presents (1) a quantitative synthesis of the nutrient spiraling literature and (2) application of these data to elucidate trends in nutrient spiraling within stream networks. Results are based on 404 individual experiments on ammonium (NH 4 ), nitrate (NO 3 ), and phosphate (PO 4 ) from 52 published studies. Sixty-nine percent of the experiments were performed in first- and second-order streams, and 31% were performed in third- to fifth-order streams. Uptake lengths, S w , of NH 4 (median = 86 m) and PO 4 (median = 96 m) were significantly different (a = 0.05) than NO 3 (median = 236 m). Areal uptake rates of NH 4 (median = 28 mgm 2 min 1 ) were significantly different than NO 3 and PO 4 (median = 15 and 14 mgm 2 min 1 , respectively). There were significant differences among NH 4 , NO 3 , and PO 4 uptake velocity (median = 5, 1, and 2 mm min 1 , respectively). Correlation analysis results were equivocal on the effect of transient storage on nutrient spiraling. Application of these data to a stream network model showed that recycling (defined here as stream length S w ) of NH 4 and NO 3 generally increased with stream order, while PO 4 recycling remained constant along a first- to fifth-order stream gradient. Within this hypothetical stream network, cumulative NH 4 uptake decreased slightly with stream order, while cumulative NO 3 and PO 4 uptake increased with stream order. These data suggest the importance of larger rivers to nutrient spiraling and the need to consider how stream networks affect nutrient flux between terrestrial and marine ecosystems. Citation: Ensign, S. H., and M. W. Doyle (2006), Nutrient spiraling in streams and river networks, J. Geophys. Res., 111, G04009, doi:10.1029/2005JG000114. 1. Introduction [2] Studies of nitrogen (N) and phosphorus (P) cycling are a cornerstone of ecosystem biogeochemistry because all biota depend on these elements for critical cellular processes. Productivity of aquatic ecosystems is often influenced by the concentration, molecular form, and stoichiometry of N and P. In excess, however, N and P can enhance rates of photosynthetic and heterotrophic productivity and result in fundamental changes to aquatic food webs. Eutrophication, the process of accelerated organic carbon production in aquatic systems, negatively affects rivers, lakes, and estuaries worldwide, and now accounts for the foremost aquatic ecosystem management problem in the U.S. [Bricker et al., 1999]. Fundamental to the management of eutrophication is an understanding of how lakes, estuaries, and the coastal ocean are coupled with nutrient export from their watersheds [Howarth et al., 2002]. Not only do streams and rivers provide this hydrologic coupling, they also play a central role in modulating the concentrations and forms of nutrients exported downstream. [3] The importance of in-stream uptake to watershed- scale nutrient loads has been demonstrated by studies in which nutrient export in streamflow has been found to be less than terrestrial inputs to the stream [e.g., Behrendt and Opitz, 2000; Stow et al., 2001; Mulholland, 2004; Williams et al., 2004]. While some in-stream uptake processes are permanent (e.g., denitrification and burial) others are temporary (e.g., biotic sequestration) and result in remineralization and subsequent downstream transport. Knowledge of the processes contributing to in-stream nutrient uptake is largely attributable to the concept of nutrient spiraling, a conceptual and empirical model of nutrient cycling in fluvial ecosystems. The current study is intended to provide a review and quantitative summary of data from studies of nutrient spiraling, with emphasis on the spatial variability within stream networks. In equal parts, this study is a response to (1) the lack of a quantitative summary and synthesis of nutrient spiraling data in the literature and (2) the call for increased attention to the ecological connectivity within stream networks. We begin this paper with a review of the JOURNAL OF GEOPHYSICAL RESEARCH, VOL. 111, G04009, doi:10.1029/2005JG000114, 2006 Click Here for Full Articl e 1 Curriculum in Ecology, University of North Carolina at Chapel Hill, Morehead City, North Carolina, USA. 2 Department of Geography, University of North Carolina at Chapel Hill, Chapel Hill, North Carolina, USA. Copyright 2006 by the American Geophysical Union. 0148-0227/06/2005JG000114$09.00 G04009 1 of 13
Transcript
Nutrient spiraling in streams and river networks
Scott H. Ensign1 and Martin W. Doyle2
Received 24 October 2005; revised 22 June 2006; accepted 25 July 2006; published 17 November 2006.
[1] Over the past 3 decades, nutrient spiraling has become a unifying paradigm forstream biogeochemical research. This paper presents (1) a quantitative synthesis of thenutrient spiraling literature and (2) application of these data to elucidate trends innutrient spiraling within stream networks. Results are based on 404 individualexperiments on ammonium (NH4), nitrate (NO3), and phosphate (PO4) from 52 publishedstudies. Sixty-nine percent of the experiments were performed in first- and second-orderstreams, and 31%were performed in third- to fifth-order streams. Uptake lengths, Sw, of NH4
(median = 86 m) and PO4 (median = 96 m) were significantly different (a = 0.05) thanNO3 (median = 236 m). Areal uptake rates of NH4 (median = 28 mg m�2 min�1) weresignificantly different than NO3 and PO4 (median = 15 and 14 mg m�2 min�1,respectively). There were significant differences among NH4, NO3, and PO4 uptakevelocity (median = 5, 1, and 2 mm min�1, respectively). Correlation analysis resultswere equivocal on the effect of transient storage on nutrient spiraling. Application ofthese data to a stream network model showed that recycling (defined here as streamlength � Sw) of NH4 and NO3 generally increased with stream order, while PO4
recycling remained constant along a first- to fifth-order stream gradient. Within thishypothetical stream network, cumulative NH4 uptake decreased slightly with streamorder, while cumulative NO3 and PO4 uptake increased with stream order. Thesedata suggest the importance of larger rivers to nutrient spiraling and the need toconsider how stream networks affect nutrient flux between terrestrial and marineecosystems.
Citation: Ensign, S. H., and M. W. Doyle (2006), Nutrient spiraling in streams and river networks, J. Geophys. Res., 111, G04009,
doi:10.1029/2005JG000114.
1. Introduction
[2] Studies of nitrogen (N) and phosphorus (P) cyclingare a cornerstone of ecosystem biogeochemistry becauseall biota depend on these elements for critical cellularprocesses. Productivity of aquatic ecosystems is ofteninfluenced by the concentration, molecular form, andstoichiometry of N and P. In excess, however, N and Pcan enhance rates of photosynthetic and heterotrophicproductivity and result in fundamental changes to aquaticfood webs. Eutrophication, the process of acceleratedorganic carbon production in aquatic systems, negativelyaffects rivers, lakes, and estuaries worldwide, and nowaccounts for the foremost aquatic ecosystem managementproblem in the U.S. [Bricker et al., 1999]. Fundamentalto the management of eutrophication is an understandingof how lakes, estuaries, and the coastal ocean are coupled
with nutrient export from their watersheds [Howarth etal., 2002]. Not only do streams and rivers provide thishydrologic coupling, they also play a central role inmodulating the concentrations and forms of nutrientsexported downstream.[3] The importance of in-stream uptake to watershed-
scale nutrient loads has been demonstrated by studies inwhich nutrient export in streamflow has been found to beless than terrestrial inputs to the stream [e.g., Behrendtand Opitz, 2000; Stow et al., 2001; Mulholland, 2004;Williams et al., 2004]. While some in-stream uptakeprocesses are permanent (e.g., denitrification and burial)others are temporary (e.g., biotic sequestration) and resultin remineralization and subsequent downstream transport.Knowledge of the processes contributing to in-streamnutrient uptake is largely attributable to the concept ofnutrient spiraling, a conceptual and empirical model ofnutrient cycling in fluvial ecosystems. The current studyis intended to provide a review and quantitative summaryof data from studies of nutrient spiraling, with emphasison the spatial variability within stream networks. In equalparts, this study is a response to (1) the lack of aquantitative summary and synthesis of nutrient spiralingdata in the literature and (2) the call for increasedattention to the ecological connectivity within streamnetworks. We begin this paper with a review of the
JOURNAL OF GEOPHYSICAL RESEARCH, VOL. 111, G04009, doi:10.1029/2005JG000114, 2006ClickHere
for
FullArticle
1Curriculum in Ecology, University of North Carolina at Chapel Hill,Morehead City, North Carolina, USA.
2Department of Geography, University of North Carolina at ChapelHill, Chapel Hill, North Carolina, USA.
Copyright 2006 by the American Geophysical Union.0148-0227/06/2005JG000114$09.00
development and applications of the nutrient spiralingmodel.
1.1. Nutrient Spiraling Model
[4] Unlike other ecosystems, the spatial and temporaldimensions of nutrient cycling in streams and rivers areintimately coupled due to the continual movement of water-borne constituents downstream. This unique aspect offluvial environments (relative to other ecosystems) washighlighted by Webster [1975] wherein he coined the termnutrient ‘‘spiraling’’ to describe the cycling of nutrients asthey are assimilated from the water column into benthicbiomass, temporarily retained, and mineralized back intothe water column. Though this concept was mentionedbriefly by Wallace et al. [1977] and Fisher [1977], Websterand Patten [1979] were the first to apply the nutrientspiraling concept to compare nutrient recycling in differentstreams. Without explicitly referring to nutrient ‘‘spiraling,’’Meyer and Likens [1979] brought increased attention to therole of in-stream processes in modifying P inputs toHubbard Brook, New Hampshire.[5] In 1981, the nutrient spiraling concept was formalized
by Newbold and colleagues who presented a mathematicalframework to support a more robust conceptual model thanhad previously been presented [Newbold et al., 1981]. Theauthors introduced spiraling length (S) as the distancerequired for a nutrient atom to complete 1 cycle from itsdissolved inorganic form in the water column (this distancebeing Sw), through a particulate phase (Sp), and finallythrough a consumer phase (Sc) to be returned to the watercolumn in a dissolved inorganic form. In this model,spiraling length is an integrated measure of water flowvelocity and the influence of biochemical demand of thebenthos (though subsequent studies have included chemicalsorption by stream bed sediments as an uptake pathway).Further, the authors demonstrated how these spatial metrics(S, Sw, Sp, Sc) could be converted into flux measurements byincorporating data on the flux of dissolved and particulatefractions in the stream. This and subsequent publications[Elwood et al., 1982] paved the way for a burgeoning fieldin stream ecology in which nutrient spiraling could bequantitatively compared between different streams.[6] The first whole-ecosystem study of P spiraling was
conducted in Walker Branch, Tennessee [Newbold et al.,1983] using 32P as an isotope tracer. This was followed by aseasonal investigation of nutrient spiraling in the samestream [Mulholland et al., 1985]. However, because of thedifficulties entailed by using radioactive P in surface waters,the only other whole ecosystem P spiraling study performedto date was also conducted in Walker Branch [Mulholland etal., 1990]. The dominant source of information regardingwhole-stream N-cycling came from the Lotic IntersiteNitrogen eXperiment (LINX). Beginning in the late1990s, the LINX project used 11 streams spanning a broadrange of ecosystem types across North America toinvestigate stream ecosystem processes of N retention andfood web transformation. Utilizing similar methods acrossall sites and experiments, the investigators quantified theuptake and trophic transfer of N between multiple streamcompartments. The LINX project advanced understandingof the many in-stream processes affecting nitrogen uptake(summarized by Webster et al. [2003]), and the contribution
of trophic transfer and turnover to nutrient processing in awide variety of streams. At the time of the present research,a LINX II study is underway to examine NO3 uptake in adiverse array of stream ecosystems.[7] In contrast to these whole-ecosystem studies of
nutrient spiraling using isotope tracers, the majority ofnutrient spiraling studies have been conducted using moresimplistic techniques. Bulk addition of inorganic N and Pto a stream allows measurement of nutrient uptake along astream reach. This technique has been applied since theearly 1970s prior to the genesis of the nutrient spiralingmodel [McColl, 1974], but gained widespread notorietyafter a review of the theory and empirical procedures waspublished [Stream Solute Workshop, 1990]. The StreamSolute Workshop publication reviewed the conceptual andempirical underpinnings of nutrient spiraling, anddiscussed the relative merits of using different metrics tocompare nutrient uptake in streams, as well as thelimitations and assumptions necessary when nutrientadditions are used.[8] There are three fundamental limitations to the nutrient
addition approach. First, only one portion (Sw) of the totalspiraling length (S) is measured using nutrient additions,providing no information on specific mechanisms of uptakeor transfer between stream biota. Nutrient additions alterbiochemical nutrient uptake, subsequently affectingmeasurements of Sw [Mulholland et al., 1990, 2002] andareal uptake (U) [Dodds et al., 2002]. Second is variabilityin time: Despite wide recognition that spiraling variessubstantially with discharge, the approach currently usedlimits results to a snapshot view of stream biogeochemistry,and results are only representative of a particular time and aparticular discharge. Only recently have developments beenmade in how to account for hydrologic variability intospiraling studies [Doyle, 2005]. Finally is variability inspace: many studies have been conducted across a rangeof sites, but few if any have systematically examinedspiraling through a channel corridor, or more representativeof watersheds, through a channel network. It is this last areain which we focus later in this paper.
1.2. Geomorphic Factors Affecting NutrientSpiraling in Streams
[9] Despite these drawbacks, quantifying nutrientspiraling, specifically through the nutrient addition tech-nique, is an important component of studying streambiogeochemistry. This focus on measuring Sw stems fromearly observation that Sw is the dominant component of thetotal spiraling length, S [Newbold et al., 1981]. Thenumerous factors influencing nutrient uptake can bedivided into two categories: biochemical (bacteria, fungi,algae, and macrophytes) and geomorphic (physicalproperties of the stream channel). As discussed by Valettet al. [1996], geomorphic stream features dictate theresidence time of water moving through a stream reachwhile the biochemical features control nutrient uptake.Channel geomorphology, and subsequently residencetime, has an indirect effect on nutrient uptake from thewater column by dictating the exposure of water to thebiochemically-reactive substrates. This indirect effect ofgeomorphology on biochemical uptake of nutrients from
G04009 ENSIGN AND DOYLE: NUTRIENT SPIRALING REVIEW
2 of 13
G04009
the water column is a function of channel size andtransient storage.[10] Channel size (a function of depth and width) affects
the ratio of benthic surface area to channel volume: Aschannel size increases, the surface area to volume ratiodecreases. Thus a lower proportion of the solute load in alarge river has contact with the benthos per length ofchannel than a small river. Additionally, stream velocityincreases with river size, reducing the residence timewithin a channel reach. These geomorphic relationshipshave been used extensively to model nutrient uptake inriver networks [Wollheim et al., 2006]. From a spatialperspective, the retentive capacity of a stream networkdepends on its proximity to larger rivers. Allochthonousnutrients will be attenuated more completely during trans-port through a stream network the farther they must travelbefore being exported from the watershed [Alexander etal., 2000]. These and many other studies emphasizing therole of headwater streams in nutrient processing arefounded on this simple geomorphic relationship: Smallrivers allow a larger proportion of water they transport tointeract with benthic substrates than do larger rivers.[11] Transient storage is a second geomorphic variable
that affects the exposure of stream water to biochemicallyreactive substrates. This generic term describes the tem-porary retention of water-borne solutes within localizedregions of slow-flowing water. Transient storage can becaused by hyporheic flow [Stanford and Ward, 1988],macrophyte vegetation and water column turbulence[Ensign and Doyle, 2005], and side pools adjacent to themain stream channel [Hall et al., 1998; Gucker and
Boechat, 2004]. These processes delay downstream trans-port of water, increase residence time within the streamreach, and expose a larger portion of the stream water tobiochemically reactive zones [Dahm et al., 1998]. Whiletransient storage has been widely regarded as an importantvariable influencing nutrient uptake in streams, genericmeasurements of transient storage which do not identifythe specific mechanisms involved (e.g., hyporheic ex-change) do not support this conclusion [Hall et al.,1998; Webster et al., 2003] (except see Ensign and Doyle[2005]).[12] Studies focused on geomorphic variability have
often used Sw as the metric of nutrient spiraling. However,due to the influence of advection, Sw has been shown to bea poor metric for comparing the absolute demand of astream’s benthos for a nutrient. More effective comparisonsof biochemical nutrient demand between streams can beaccomplished by using U or uptake velocity (Vf). Thesemetrics of nutrient spiraling are easily calculated with datafrom nutrient addition or isotope tracer experiments byincorporating nutrient concentration and depth of the stream(Table 1). Since nutrient uptake from the water column (U)is a function of nutrient concentration, Vf is the preferredmetric of benthic nutrient uptake because it is independentof concentration and hydrologic characteristics of thestream.[13] Of particular relevance to the current study are
examinations of how benthic nutrient demand changesalong gradients of channel size, as this will give anindication of how spiraling may vary systematicallythrough a channel network. An investigation of 6 Alaskan
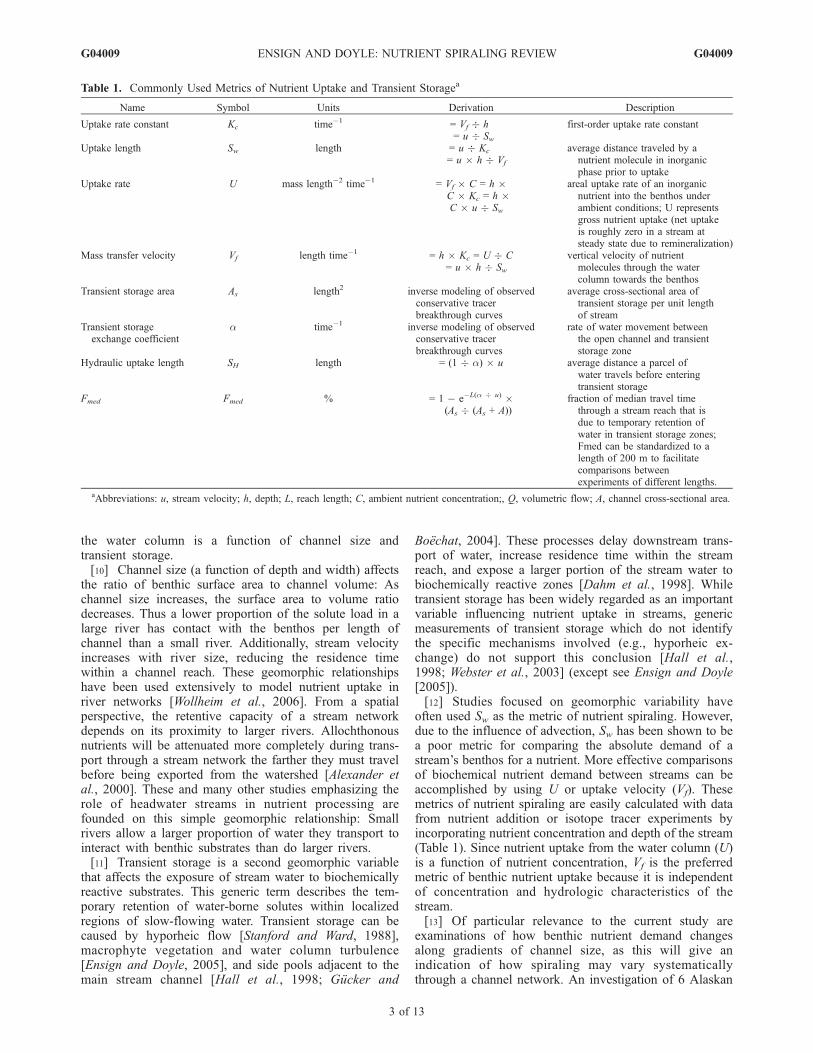
Table 1. Commonly Used Metrics of Nutrient Uptake and Transient Storagea
Name Symbol Units Derivation Description
Uptake rate constant Kc time�1 = Vf � h= u � Sw
first-order uptake rate constant
Uptake length Sw length = u � Kc
= u � h � Vf
average distance traveled by anutrient molecule in inorganicphase prior to uptake
Uptake rate U mass length�2 time�1 = Vf � C = h �C � Kc = h �C � u � Sw
areal uptake rate of an inorganicnutrient into the benthos underambient conditions; U representsgross nutrient uptake (net uptakeis roughly zero in a stream atsteady state due to remineralization)
Mass transfer velocity Vf length time�1 = h � Kc = U � C= u � h � Sw
vertical velocity of nutrientmolecules through the watercolumn towards the benthos
Transient storage area As length2 inverse modeling of observedconservative tracerbreakthrough curves
average cross-sectional area oftransient storage per unit lengthof stream
Transient storageexchange coefficient
a time�1 inverse modeling of observedconservative tracerbreakthrough curves
rate of water movement betweenthe open channel and transientstorage zone
Hydraulic uptake length SH length = (1 � a) � u average distance a parcel ofwater travels before enteringtransient storage
Fmed Fmed % = 1 � e�L(a � u) �(As � (As + A))
fraction of median travel timethrough a stream reach that isdue to temporary retention ofwater in transient storage zones;Fmed can be standardized to alength of 200 m to facilitatecomparisons betweenexperiments of different lengths.
aAbbreviations: u, stream velocity; h, depth; L, reach length; C, ambient nutrient concentration;, Q, volumetric flow; A, channel cross-sectional area.
G04009 ENSIGN AND DOYLE: NUTRIENT SPIRALING REVIEW
3 of 13
G04009
streams with discharge varying 4 orders of magnitude didnot find a systematic change in Vf with stream size[Wollheim et al., 2001]. Few other investigations havecompared U or Vf across a range of stream sizes, and littleis known about how or when Vf varies along a streamnetwork. This lack of information has made stream net-work modeling of nutrient uptake challenging. Uptakevelocity has not often been used directly to parameterizebiological nutrient uptake in models (except see Ensign etal. [2006]). Instead, uptake rate constants (time�1) arefrequently used, resulting in the unintentional variation ofVf with stream depth [Wollheim et al., 2006].
1.3. Goals and Structure of Paper
[14] In summary, substantial advancements in streamecology have been made via nutrient spiraling researchover the past 3 decades. However, many fundamentalquestions remain, such as how nutrient processing changesthroughout stream networks and the relative effects ofgeomorphology and stream biota along longitudinalgradients. The current study presents a quantitative synthe-sis and summary of nutrient spiraling data from the litera-ture. Following discussion of our results, we utilize thenutrient spiraling summary data developed here to examinespatial trends in nutrient spiraling occurring within a streamnetwork. In this discussion we integrate fundamental scal-ing relationships for river networks with data from thecurrent study to derive simple models of nutrient spiralingand uptake within stream networks.
2. Methods
[15] Literature searches were performed to find peer-reviewed articles on nutrient spiraling in streams publishedprior to March 2006. To be included in this study, the paperhad to report Sw, U, or Vf, or allow calculation of one ormore of these values from the data provided. Equations inTable 1 were used to calculate additional nutrient spiralingmetrics if one or more was omitted in the original publica-tion. A database was developed for cataloging data reportedin the literature. The database consists of 38 fields of data
with one record created for each individual experiment in astream. In instances where a range of values were reportedfor a given parameter during an experiment (e.g., streamdepth, temperature, slope), the average of the values wasused to represent the predominant conditions along thestream reach. Data from both isotope tracer studies, nutrientaddition studies, and studies following assimilation ofbackground nutrient concentrations (mass balance) wereanalyzed. Flume studies, manipulative experiments, andrivers with extremely high nutrient concentrations wereexcluded. Data were exported from the database to SPSSfor statistical analysis.[16] Stream parameters that could be used to represent the
relative size of a stream (e.g., cross-sectional channel area,velocity, discharge) are all quantitatively related to thenutrient spiraling metrics (Table 1). Therefore Strahler streamorder was used to represent the general change in channelmorphology with increasing channel size [Strahler, 1952].[17] The difference between isotope tracer and nutrient
addition data were examined for each stream order using aMann-Whitney U test (nonparametric statistics were usedbecause the data were non-normally distributed and hadlarge differences in sample sizes among groups). Differ-ences in spiraling metrics among stream orders were exam-ined using a Kruskal-Wallis test. Differences betweenspiraling metrics of each nutrient were examined using aMann-Whitney U test. A critical value of a = 0.05 waschosen for this and all subsequent statistical tests. Nonpara-metric correlation analysis (Spearman Rank test) was per-formed between each nutrient spiraling metric and 5different hydrologic (transient storage) parameters: As,As:A, SH, Fmed
200 , and channel bed slope (Table 1). Empirically,Fmed200 is a measure of the fraction of the median travel time
through a stream reach that is attributable to transient storage[Runkel, 2002].
3. Results
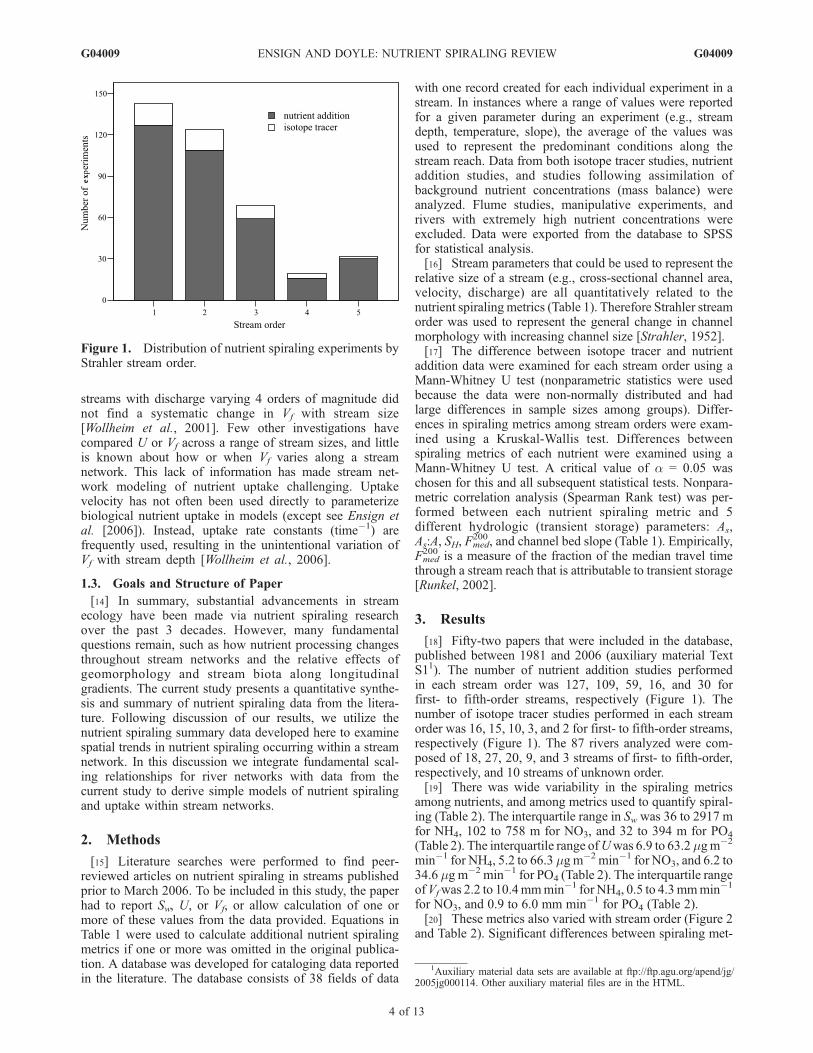
[18] Fifty-two papers that were included in the database,published between 1981 and 2006 (auxiliary material TextS11). The number of nutrient addition studies performedin each stream order was 127, 109, 59, 16, and 30 forfirst- to fifth-order streams, respectively (Figure 1). Thenumber of isotope tracer studies performed in each streamorder was 16, 15, 10, 3, and 2 for first- to fifth-order streams,respectively (Figure 1). The 87 rivers analyzed were com-posed of 18, 27, 20, 9, and 3 streams of first- to fifth-order,respectively, and 10 streams of unknown order.[19] There was wide variability in the spiraling metrics
among nutrients, and among metrics used to quantify spiral-ing (Table 2). The interquartile range in Swwas 36 to 2917 mfor NH4, 102 to 758 m for NO3, and 32 to 394 m for PO4
(Table 2). The interquartile range ofUwas 6.9 to 63.2mgm�2
min�1 for NH4, 5.2 to 66.3 mgm�2 min�1 for NO3, and 6.2 to
34.6 mg m�2 min�1 for PO4 (Table 2). The interquartile rangeofVfwas 2.2 to 10.4mmmin�1 for NH4, 0.5 to 4.3mmmin�1
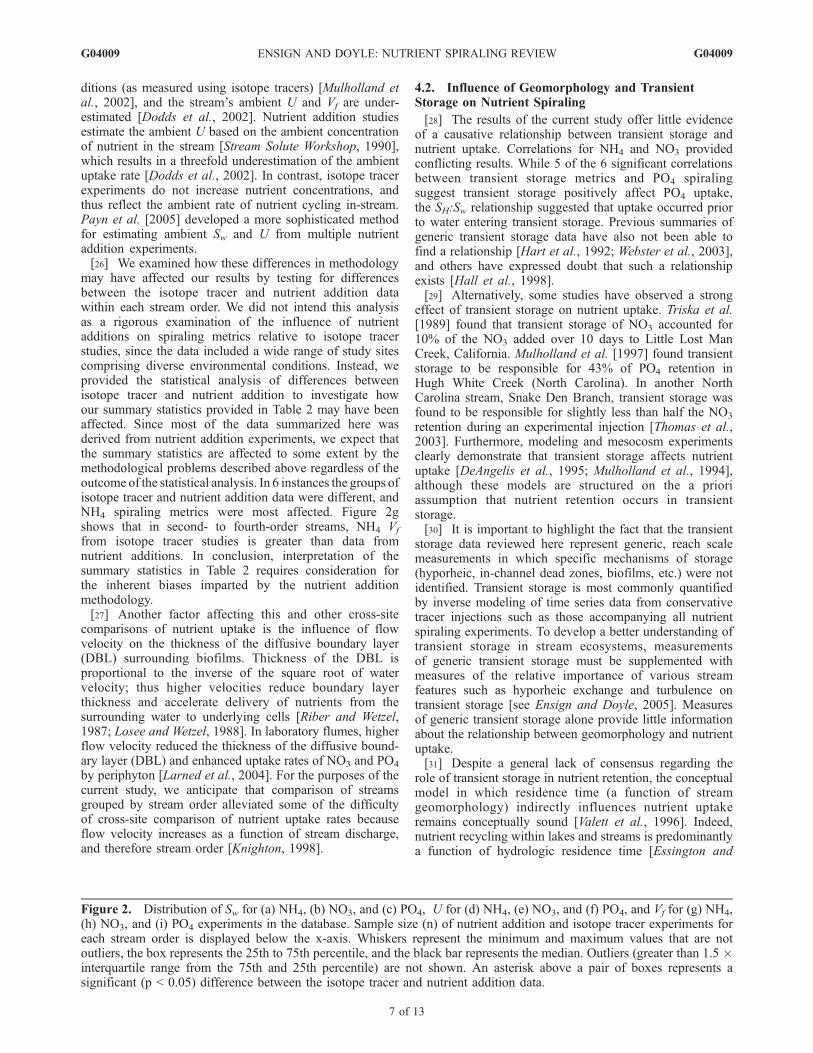
for NO3, and 0.9 to 6.0 mm min�1 for PO4 (Table 2).[20] These metrics also varied with stream order (Figure 2
and Table 2). Significant differences between spiraling met-
Figure 1. Distribution of nutrient spiraling experiments byStrahler stream order.
1Auxiliary material data sets are available at ftp://ftp.agu.org/apend/jg/2005jg000114. Other auxiliary material files are in the HTML.
G04009 ENSIGN AND DOYLE: NUTRIENT SPIRALING REVIEW
4 of 13
G04009
rics of the 5 stream orders were found for NH4 Sw (c2 = 12.6,
p = 0.014), NO3 U (c2 = 10.7, p = 0.03), PO4 Sw (c2 = 98.5,p < 0.001), PO4 U (c2 = 18.5, p = 0.001), and PO4 Vf (c
2 =63.2, p < 0.001). There were significant differences betweennutrient addition and isotope tracer data for NH4 Sw in 3rdorder streams (p < 0.001), NH4 U in second-order streams(p = 0.028), NH4 Vf in 2nd-4th order streams (p = 0.008, p =0.001, p = 0.013, respectively), and PO4 Vf in 1st orderstreams (p = 0.004) (Figure 2).[21] Significant differences were apparent between Sw of
NH4 and NO3 (p < 0.001) and NO3 and PO4 (p < 0.001)(sample sizes for all streams in the study are given in Table 2).Areal uptake ofNH4 andNO3were significantly different (p =0.028) and NH4 U was significantly different than PO4
U (p = 0.001). Significant differences were found betweenVf
of NH4 and NO3 (p < 0.001), NH4 and PO4 (p < 0.001), andNO3 and PO4 (p = 0.027).[22] Significant correlations were found in 14 of the 36
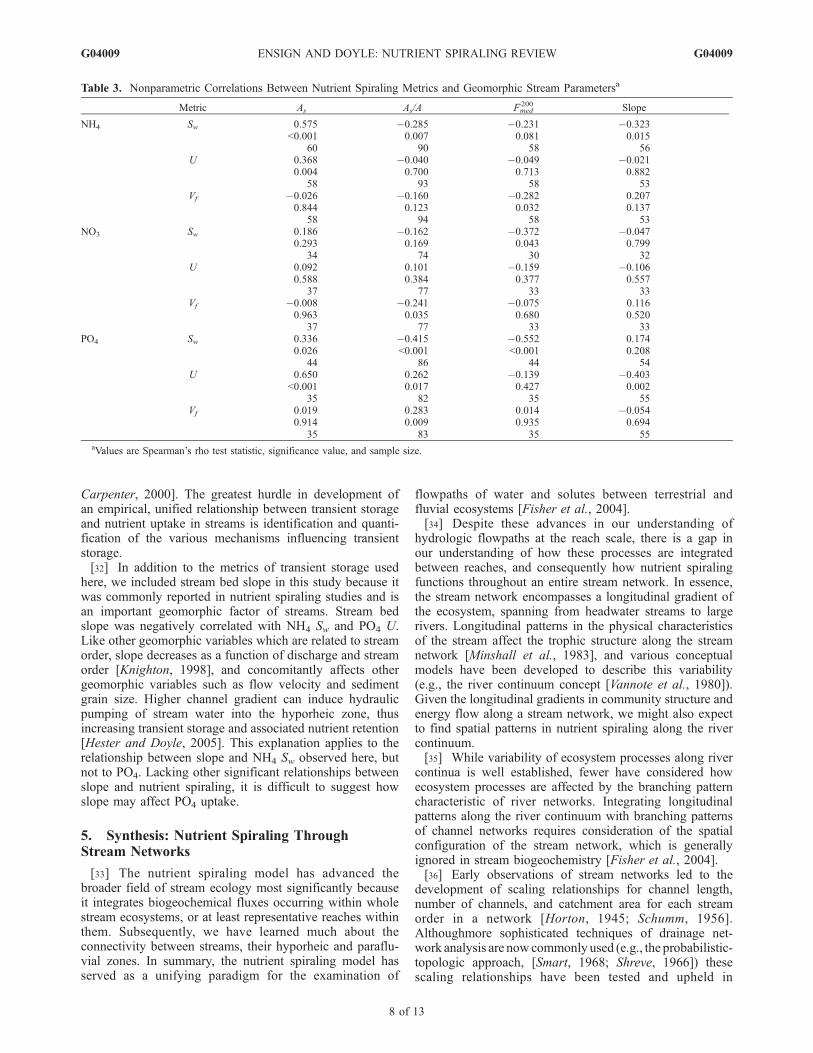
correlations performed between spiraling metrics, transientstorage, and slope (Table 3). Transient storage area (As) waspositively correlated with Sw and U for NH4 and PO4.However, it was difficult to assess the meaning of thesecorrelations since Aswas closely related to stream size; a moreinformative transient storage metric is As/A. Negative correla-tions with As/Awere apparent for NH4 Sw, PO4 Sw, and NO3 Vf.Phosphate U and Vf were positively correlated with As/A. Themost robust metric of transient storage, Fmed
200 , was negativelycorrelated withNH4Vf, NO3 Sw, and PO4 Sw. Uptake length forNH4 in high gradient streams was shorter than for low gradientstreams, suggesting a larger demand for NH4 in streamsdraining steep terrain relative to their lower gradient counter-parts (Table 3). In contrast, PO4 U was lower in high gradientstreams than in low gradient streams (Table 3).[23] A positive relationship would be expected between the
spiraling metrics U and Vf and transient storage metrics iftransient storage exerted influence on nutrient uptake. A
negative relationship between Sw and these metrics wouldfurther indicate a coupling of nutrient spiraling to transientstorage. Given the four significant correlations between NH4
spiraling and transient storage, there was equal evidence forand against the hypothesis that increased transient storagepositively influences NH4 uptake. The trend of correlations forNO3 and transient storage were equally ambiguous. However,5 correlations between PO4 spiraling and transient storagesupported the idea that nutrient uptake occurs as a function ofincreased transient storage.[24] In a final attempt to reconcile these ambiguous
results concerning the relationship between transient storageand nutrient uptake, we analyzed the hydraulic uptakelength (SH). The transient storage metric SH describes thelength of channel required for stream water to enter transientstorage zones, and examination of the ratio SH:Sw canindicate whether nutrient uptake occurs at the same spatialscale as water uptake into transient storage. Avalue of SH:Swgreater than 1 indicates that nutrient removal occurs insurficial biofilms prior to water entering transient storage[Webster et al., 2003]. The SH:Sw ratio for NH4 in this studyaveraged 9.5 with a median of 2.9, NO3 averaged 1.5 withmedian of 0.6, and PO4 averaged 4.2 with a median of 2.9.These data indicate that NH4 and PO4 spiraling occurred at ashorter spatial scale than the water entering transient storagezones, and suggests transient storage is a less importantfactor in nutrient uptake. Nitrate Sw is closer to the spatialscale of transient storage exchange, suggesting NO3 uptakemay be more closely coupled with transient storage zones.
4. Discussion
4.1. Effects of Study Methods on the Summary Results
[25] The artifacts imparted to nutrient spiralingexperiments by the use of nutrient addition are wellknown: uptake length increases relative to ambient con-
Table 2. Mean, Median, Interquartile Range, and Number of Studies Reporting Each Nutrient Spiraling Metric by Stream Ordera
Stream Order
NH4 NO3 PO4
Sw, m U, mg m�2 min�1 Vf, mm min�1Sw, m U, mg m�2 min�1 Vf, mm min�1
aSummary statistics for all streams include 10 rivers (17 experiments) in which stream order was unknown.
G04009 ENSIGN AND DOYLE: NUTRIENT SPIRALING REVIEW
5 of 13
G04009
Figure
2
G04009 ENSIGN AND DOYLE: NUTRIENT SPIRALING REVIEW
6 of 13
G04009
ditions (as measured using isotope tracers) [Mulholland etal., 2002], and the stream’s ambient U and Vf are under-estimated [Dodds et al., 2002]. Nutrient addition studiesestimate the ambient U based on the ambient concentrationof nutrient in the stream [Stream Solute Workshop, 1990],which results in a threefold underestimation of the ambientuptake rate [Dodds et al., 2002]. In contrast, isotope tracerexperiments do not increase nutrient concentrations, andthus reflect the ambient rate of nutrient cycling in-stream.Payn et al. [2005] developed a more sophisticated methodfor estimating ambient Sw and U from multiple nutrientaddition experiments.[26] We examined how these differences in methodology
may have affected our results by testing for differencesbetween the isotope tracer and nutrient addition datawithin each stream order. We did not intend this analysisas a rigorous examination of the influence of nutrientadditions on spiraling metrics relative to isotope tracerstudies, since the data included a wide range of study sitescomprising diverse environmental conditions. Instead, weprovided the statistical analysis of differences betweenisotope tracer and nutrient addition to investigate howour summary statistics provided in Table 2 may have beenaffected. Since most of the data summarized here wasderived from nutrient addition experiments, we expect thatthe summary statistics are affected to some extent by themethodological problems described above regardless of theoutcome of the statistical analysis. In 6 instances the groups ofisotope tracer and nutrient addition data were different, andNH4 spiraling metrics were most affected. Figure 2gshows that in second- to fourth-order streams, NH4 Vf
from isotope tracer studies is greater than data fromnutrient additions. In conclusion, interpretation of thesummary statistics in Table 2 requires consideration forthe inherent biases imparted by the nutrient additionmethodology.[27] Another factor affecting this and other cross-site
comparisons of nutrient uptake is the influence of flowvelocity on the thickness of the diffusive boundary layer(DBL) surrounding biofilms. Thickness of the DBL isproportional to the inverse of the square root of watervelocity; thus higher velocities reduce boundary layerthickness and accelerate delivery of nutrients from thesurrounding water to underlying cells [Riber and Wetzel,1987; Losee and Wetzel, 1988]. In laboratory flumes, higherflow velocity reduced the thickness of the diffusive bound-ary layer (DBL) and enhanced uptake rates of NO3 and PO4
by periphyton [Larned et al., 2004]. For the purposes of thecurrent study, we anticipate that comparison of streamsgrouped by stream order alleviated some of the difficultyof cross-site comparison of nutrient uptake rates becauseflow velocity increases as a function of stream discharge,and therefore stream order [Knighton, 1998].
4.2. Influence of Geomorphology and TransientStorage on Nutrient Spiraling
[28] The results of the current study offer little evidenceof a causative relationship between transient storage andnutrient uptake. Correlations for NH4 and NO3 providedconflicting results. While 5 of the 6 significant correlationsbetween transient storage metrics and PO4 spiralingsuggest transient storage positively affect PO4 uptake,the SH:Sw relationship suggested that uptake occurred priorto water entering transient storage. Previous summaries ofgeneric transient storage data have also not been able tofind a relationship [Hart et al., 1992; Webster et al., 2003],and others have expressed doubt that such a relationshipexists [Hall et al., 1998].[29] Alternatively, some studies have observed a strong
effect of transient storage on nutrient uptake. Triska et al.[1989] found that transient storage of NO3 accounted for10% of the NO3 added over 10 days to Little Lost ManCreek, California. Mulholland et al. [1997] found transientstorage to be responsible for 43% of PO4 retention inHugh White Creek (North Carolina). In another NorthCarolina stream, Snake Den Branch, transient storage wasfound to be responsible for slightly less than half the NO3
retention during an experimental injection [Thomas et al.,2003]. Furthermore, modeling and mesocosm experimentsclearly demonstrate that transient storage affects nutrientuptake [DeAngelis et al., 1995; Mulholland et al., 1994],although these models are structured on the a prioriassumption that nutrient retention occurs in transientstorage.[30] It is important to highlight the fact that the transient
storage data reviewed here represent generic, reach scalemeasurements in which specific mechanisms of storage(hyporheic, in-channel dead zones, biofilms, etc.) were notidentified. Transient storage is most commonly quantifiedby inverse modeling of time series data from conservativetracer injections such as those accompanying all nutrientspiraling experiments. To develop a better understanding oftransient storage in stream ecosystems, measurementsof generic transient storage must be supplemented withmeasures of the relative importance of various streamfeatures such as hyporheic exchange and turbulence ontransient storage [see Ensign and Doyle, 2005]. Measuresof generic transient storage alone provide little informationabout the relationship between geomorphology and nutrientuptake.[31] Despite a general lack of consensus regarding the
role of transient storage in nutrient retention, the conceptualmodel in which residence time (a function of streamgeomorphology) indirectly influences nutrient uptakeremains conceptually sound [Valett et al., 1996]. Indeed,nutrient recycling within lakes and streams is predominantlya function of hydrologic residence time [Essington and
Figure 2. Distribution of Sw for (a) NH4, (b) NO3, and (c) PO4, U for (d) NH4, (e) NO3, and (f) PO4, and Vf for (g) NH4,(h) NO3, and (i) PO4 experiments in the database. Sample size (n) of nutrient addition and isotope tracer experiments foreach stream order is displayed below the x-axis. Whiskers represent the minimum and maximum values that are notoutliers, the box represents the 25th to 75th percentile, and the black bar represents the median. Outliers (greater than 1.5 �interquartile range from the 75th and 25th percentile) are not shown. An asterisk above a pair of boxes represents asignificant (p < 0.05) difference between the isotope tracer and nutrient addition data.
G04009 ENSIGN AND DOYLE: NUTRIENT SPIRALING REVIEW
7 of 13
G04009
Carpenter, 2000]. The greatest hurdle in development ofan empirical, unified relationship between transient storageand nutrient uptake in streams is identification and quanti-fication of the various mechanisms influencing transientstorage.[32] In addition to the metrics of transient storage used
here, we included stream bed slope in this study because itwas commonly reported in nutrient spiraling studies and isan important geomorphic factor of streams. Stream bedslope was negatively correlated with NH4 Sw and PO4 U.Like other geomorphic variables which are related to streamorder, slope decreases as a function of discharge and streamorder [Knighton, 1998], and concomitantly affects othergeomorphic variables such as flow velocity and sedimentgrain size. Higher channel gradient can induce hydraulicpumping of stream water into the hyporheic zone, thusincreasing transient storage and associated nutrient retention[Hester and Doyle, 2005]. This explanation applies to therelationship between slope and NH4 Sw observed here, butnot to PO4. Lacking other significant relationships betweenslope and nutrient spiraling, it is difficult to suggest howslope may affect PO4 uptake.
[33] The nutrient spiraling model has advanced thebroader field of stream ecology most significantly becauseit integrates biogeochemical fluxes occurring within wholestream ecosystems, or at least representative reaches withinthem. Subsequently, we have learned much about theconnectivity between streams, their hyporheic and paraflu-vial zones. In summary, the nutrient spiraling model hasserved as a unifying paradigm for the examination of
flowpaths of water and solutes between terrestrial andfluvial ecosystems [Fisher et al., 2004].[34] Despite these advances in our understanding of
hydrologic flowpaths at the reach scale, there is a gap inour understanding of how these processes are integratedbetween reaches, and consequently how nutrient spiralingfunctions throughout an entire stream network. In essence,the stream network encompasses a longitudinal gradient ofthe ecosystem, spanning from headwater streams to largerivers. Longitudinal patterns in the physical characteristicsof the stream affect the trophic structure along the streamnetwork [Minshall et al., 1983], and various conceptualmodels have been developed to describe this variability(e.g., the river continuum concept [Vannote et al., 1980]).Given the longitudinal gradients in community structure andenergy flow along a stream network, we might also expectto find spatial patterns in nutrient spiraling along the rivercontinuum.[35] While variability of ecosystem processes along river
continua is well established, fewer have considered howecosystem processes are affected by the branching patterncharacteristic of river networks. Integrating longitudinalpatterns along the river continuum with branching patternsof channel networks requires consideration of the spatialconfiguration of the stream network, which is generallyignored in stream biogeochemistry [Fisher et al., 2004].[36] Early observations of stream networks led to the
development of scaling relationships for channel length,number of channels, and catchment area for each streamorder in a network [Horton, 1945; Schumm, 1956].Althoughmore sophisticated techniques of drainage net-work analysis are nowcommonly used (e.g., the probabilistic-topologic approach, [Smart, 1968; Shreve, 1966]) thesescaling relationships have been tested and upheld in
Table 3. Nonparametric Correlations Between Nutrient Spiraling Metrics and Geomorphic Stream Parametersa
35 83 35 55aValues are Spearman’s rho test statistic, significance value, and sample size.
G04009 ENSIGN AND DOYLE: NUTRIENT SPIRALING REVIEW
8 of 13
G04009
diverse landscapes. The average length of streams of eachorder (Li) can be estimated as
Li ¼ RL � Li�1; ð1Þ
where RL is the stream length ratio observed throughout thewatershed [Horton, 1945]. Next, the number of streams ofeach order (Ni) in a stream network can be estimated as
Ni ¼ RB � Ni�1; ð2Þ
where RB is the average bifurcation ratio of the streamnetwork [Horton, 1945]. Finally, the drainage area (Di) ofeach stream order can be calculated as
Di ¼ RA � Di�1: ð3Þ
These equations, referred to as the laws of drainagenetwork composition, have values of RL, RB, and RA thatconsistently range from 1.5–3, 3–5, and 3–6, respectively[Knighton, 1998]. These laws of stream length and numbercan be integrated with the summary data from the current
study to estimate the recycling and uptake of N and Pwithin a stream network.
5.1. Recycling of Nutrients Through a Stream Network
[37] The number of times an atom of N or P is spiraledbetween the water column and benthos along a stream is afunction of the stream’s length and the nutrient atom’sspiraling length. Spiraling length is composed mainly ofthe Sw [Newbold et al., 1981], and Sw will be used here asan approximation of the total spiraling length. The numberof spirals (r) occurring along a stream of a particularorder, i, is calculated as
r ¼ Li
Sw; ð4Þ
where Li is the length of channel for the stream order i (ris identical to the recycling ratio calculated for lakes andstreams by Essington and Carpenter [2000]).[38] Here we consider nutrient spiraling within a
hypothetical drainage basin with a first-order stream lengthof 1.61 km (the average length of first-order streams in theUnited States as summarized by Leopold et al. [1964]). Inthis example, the r of first-order streams is thus equal to:1.61 � Sw of first-order streams. Using the median Sw forsecond-order streams and combining equations (1) and (4),the r of second-order streams is equal to
r ¼ RL � 1:61
Sw: ð5Þ
Calculation of r for a higher order stream simply requiressubstitution of the length of the next lowest stream order for1.61 in equation (5).[39] Themedian of the Sw values for each nutrient (Table 2)
were used in conjunction with equation 5 to calculate rwithina theoretical stream network (Figure 3). Three valueswere used for RL spanning the range of values commonlyfound in watersheds [Knighton, 1998]. Choice of adifferent first-order stream length than the one here(1.61 km) would subsequently affect r values for theother stream orders, though the relative pattern wouldremain the same between stream orders. Therefore weemphasize the patterns in r between stream orders andnutrients, not the absolute value of r because it may varydramatically between diverse watersheds.[40] The r values in Figure 3 demonstrate how many
times an atom of N or P is recycled during transportthrough each stream order along a single river continuum(i.e., not considering networking). For all nutrients, streamswith a gradual increase in channel length throughout thewatershed (represented by RL = 1.5) show less recyclingthan along a river continuum with rapidly increasingchannel length (represented by RL = 3.0). In general,Figure 3 suggests that NH4 recycling peaked in streamorders 3 and 4. Nitrate recycling increased with streamorder, but was nearly always less than NH4 r. In general,recycling of N intensified as channel size increased, withbiological sequestration offsetting the effect of increaseddischarge and subsequent downstream transport. Phos-phate recycling peaked in second-order streams, and rin third- and fourth-order streams was roughly equivalentto r in first-order streams. Recycling of PO4 occurred less
Figure 3. Number of (a) NH4, (b) NO3, and (c) PO4
spirals undergone within stream orders 1�5 determinedusing equation (4) and summary values of Sw.
G04009 ENSIGN AND DOYLE: NUTRIENT SPIRALING REVIEW
9 of 13
G04009
rapidly in higher order streams (third to fifth), indicatinga more direct coupling between PO4 loading to headwaterstreams and their downstream ecosystems.[41] Calculation of the recycling ratio, r, enhanced our
understanding of spatial trends in Sw throughout a rivercontinuum, and indicated differences in N and P spiraling.While there is a clear increase in Sw with stream order dueto increased advection, this did not necessarily mean thathigher order streams were less capable of retaining nutrientsin the larger context of a stream network. The recyclinganalyzed here involves remineralization of organic N and Pback into the water column in a dissolved inorganic form.Biotic sequestration and the associated turnover time delaysthe downstream transport of nutrients, thus slowing themovement of N and P between terrestrial and aquatic,estuarine, or marine ecosystems downstream.
5.2. Nutrient Uptake in Stream Networks
[42] The analysis of recycling ratio, r, considered streamsas they have traditionally been treated: as a single-threadriver continuum [e.g., Vannote et al., 1980]. In reality,streams are branching networks, and so we next present adifferent perspective on stream network-scale nutrient spi-raling based on U, with explicit consideration of variabilityin networking patterns.[43] The nutrient spiraling metric U summarized from the
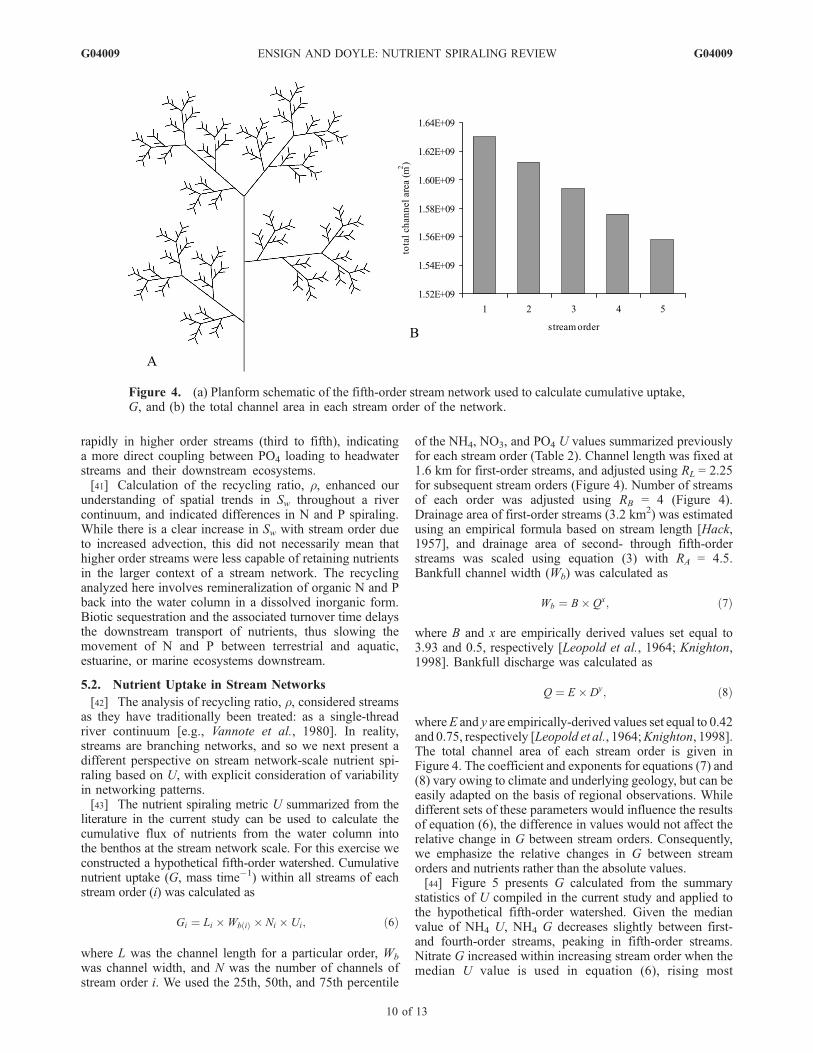
literature in the current study can be used to calculate thecumulative flux of nutrients from the water column intothe benthos at the stream network scale. For this exercise weconstructed a hypothetical fifth-order watershed. Cumulativenutrient uptake (G, mass time�1) within all streams of eachstream order (i) was calculated as
Gi ¼ Li �Wb ið Þ � Ni � Ui; ð6Þ
where L was the channel length for a particular order, Wb
was channel width, and N was the number of channels ofstream order i. We used the 25th, 50th, and 75th percentile
of the NH4, NO3, and PO4 U values summarized previouslyfor each stream order (Table 2). Channel length was fixed at1.6 km for first-order streams, and adjusted using RL = 2.25for subsequent stream orders (Figure 4). Number of streamsof each order was adjusted using RB = 4 (Figure 4).Drainage area of first-order streams (3.2 km2) was estimatedusing an empirical formula based on stream length [Hack,1957], and drainage area of second- through fifth-orderstreams was scaled using equation (3) with RA = 4.5.Bankfull channel width (Wb) was calculated as
Wb ¼ B� Qx; ð7Þ
where B and x are empirically derived values set equal to3.93 and 0.5, respectively [Leopold et al., 1964; Knighton,1998]. Bankfull discharge was calculated as
Q ¼ E � Dy; ð8Þ
whereE and y are empirically-derived values set equal to 0.42and 0.75, respectively [Leopold et al., 1964;Knighton, 1998].The total channel area of each stream order is given inFigure 4. The coefficient and exponents for equations (7) and(8) vary owing to climate and underlying geology, but can beeasily adapted on the basis of regional observations. Whiledifferent sets of these parameters would influence the resultsof equation (6), the difference in values would not affect therelative change in G between stream orders. Consequently,we emphasize the relative changes in G between streamorders and nutrients rather than the absolute values.[44] Figure 5 presents G calculated from the summary
statistics of U compiled in the current study and applied tothe hypothetical fifth-order watershed. Given the medianvalue of NH4 U, NH4 G decreases slightly between first-and fourth-order streams, peaking in fifth-order streams.Nitrate G increased within increasing stream order when themedian U value is used in equation (6), rising most
Figure 4. (a) Planform schematic of the fifth-order stream network used to calculate cumulative uptake,G, and (b) the total channel area in each stream order of the network.
G04009 ENSIGN AND DOYLE: NUTRIENT SPIRALING REVIEW
10 of 13
G04009
dramatically between second- and fourth-order streams (wedisregard the data for fifth-order streams because it is basedon a single data point). Phosphate G increases substantiallybetween first- and second-order streams, and then risesgradually through fifth order. Higher-order streams are thusequally as important in PO4 uptake as are headwaterstreams. The NO3 and PO4 data suggest that larger,higher-order rivers are of more significance to watershed-scale nutrient uptake than headwater streams.[45] The trends in r and G represent slightly different
perspectives on the longitudinal trends in nutrient spiralingthrough a stream network. The r values highlight theinteraction between nutrient spiraling and ever-increasingchannel lengths through a stream network. Increased chan-nel length compensates for higher flow velocity and depthalong the longitudinal river continuum, thereby allowingmore recycling of inorganic N (at least up through fourth-
order streams). The G values indicate that the relative massof nutrients processed at each stream order along thedownstream gradient decreases slightly (NH4) or mayincrease (NO3 and PO4).[46] Our results are similar to those of Wollheim et al.
[2006], who found that the proportion of nutrient removalin each stream order increased when uptake remainedconstant along the stream network. Their model was basedon Vf whereas ours was based on U and predicted mass ofremoval instead of the fraction of nutrient removed.However, this pattern is sensitive to variation in channelwidth scaling, and highlights the need for further investi-gation of how stream network characteristics influencenutrient spiraling. The simple scaling methods we usedfor stream length, number of streams, catchment area, andresulting width of the stream are a simplistic approach tomodeling stream networks. Further research is needed toinvestigate how different styles of drainage networks, suchas dendritic and pinnate, would affect the mass flux ofnutrients to the stream ecosystems. The laws of drainagenetworks used here perform well for dendritic watersheds,as these watersheds display the most self-similar patternsover a broad scale and number of stream orders. Othertypes of watersheds, such as those with pinnate drainages,may not be as consistent. This work would provideimportant information on spatial patterns in nutrientspiraling across broad physiographic areas, but will behindered by the paucity of nutrient spiraling data in largerrivers (fourth order and greater).
6. Conclusions
[47] Much attention has been given to the importance ofheadwater streams in nutrient spiraling research [Alexanderet al., 2000; Peterson et al., 2001], and indeed much of ourknowledge of stream ecosystems is biased toward first- andsecond-order streams (Figure 1). However, the networkscaling data shown here suggests an equally important rolefor larger rivers downstream in nutrient spiraling. Severalpatterns in nutrient spiraling were evident from the broadarray of streams synthesized in this study. Phosphorus (asPO4) recycling and uptake was relatively constant as it wastransported downstream within a stream network, indicatingthat headwater streams are not necessarily the most impor-tant regions of PO4 spiraling. Nitrogen (as NO3) wasrecycled more intensively as it was transported to higherorder streams where mass flux was greater. Likewise,NH4-N is recycled more in mid-order streams while main-taining a nearly constant rate of uptake across stream orders.Altogether these data suggest that larger streams appear toplay an equally important role in buffering downstreamecosystems (lakes, estuaries, and oceans) from nutrientpollution as do headwater streams when considered withinthe context of the stream network.[48] Application of nutrient spiraling theory and data to
watershed-scale processes requires more research in larger(>third order) rivers. It is critical that future research addressthe ecological connectivity of these small streams with theirlower end-members (rivers, lakes, and estuaries). The net-work-scale analysis provided here is intended to stimulateconsideration for how to integrate the nutrient spiralingmodel with other longitudinally-based models of fluvial
Figure 5. Cumulative uptake flux (G) of (a) NH4, (b) NO3,and (c) PO4 in first- to fifth-order streams of a hypotheticalwatersheds calculated using equation (6) and the 25th, 50th,and 75th percentile values of U from the database. Only 1value was available for NO3 U in fifth-order streams andtherefore Figure 5b is not scaled to include this data point.
G04009 ENSIGN AND DOYLE: NUTRIENT SPIRALING REVIEW
11 of 13
G04009
systems. Knowledge of how nutrients spiral within streamnetworks, not just a stream, will be especially valuable toaquatic research in downstream environments where pre-diction of nutrient delivery is so obscured by in-streamprocesses.
[49] Acknowledgments. Funding for this work was provided byUSEPA Science to Achieve Results (STAR) Nutrient Science for ImprovedWatershed Management grant R83-0652. We thank two anonymousreviewers for their insightful comments and suggestions during the devel-opment of this manuscript. Special thanks are owed to the followingindividuals for their contributions and assistance answering our questionsregarding their research: M. Bernot, N. Grimm, B. E. Haggard, R. Hall,D. Niyogi, K. S. Simon, D. C. Reutter, R. Runkel, H. M. Valett, andR. Wilcock. Rebecca Manners developed nutrient scaling characteristics ina previous version of this manuscript.
ReferencesAlexander, R., R. Smith, and G. Schwarz (2000), Effect of stream channelsize on the delivery of nitrogen to the Gulf of Mexico, Nature, 403, 758–761.
Behrendt, H., and D. Opitz (2000), Retention of nutrients in river systems:Dependence on specific runoff and hydraulic load, Hydrobiologia, 410,111–122.
Bricker, S. B., C. G. Clement, D. E. Pirhalla, S. P. Orlando, and D. R. G.Farrow (1999), National estuarine eutrophication assessment: Effects ofnutrient enrichment in the nation’s estuaries, report, 71 pp., NOAA,Silver Spring, Md.
Dahm, C. N., N. B. Grimm, P. Marmonier, H. M. Valett, and M. Vervier(1998), Nutrient dynamics at the interface between surface waters andgroundwaters, Freshwater Biol., 40, 427–451.
DeAngelis, D., M. Loreau, D. Neergaard, P. Mulholland, and E. Marzolf(1995), Modelling nutrient-periphyton dynamics in streams: the impor-tance of transient storage zones, Ecol. Modell., 80, 149–160.
Dodds, W. K., et al. (2002), N uptake as a function of concentration instreams, J. N. Am. Benthol. Soc., 21, 206–220.
Doyle, M. (2005), Incorporating hydrologic variability into nutrient spiral-ing, J. Geophys. Res., 110, G01003, doi:10.1029/2005JG000015.
Elwood, J. W., J. D. Newbold, R. V. O’Neill, and W. Van Winkle (1982),Resource spiralling: An operational paradigm for analyzing lotic ecosys-tems, in Dynamics of Lotic Ecosystems, edited by T. D. Fontaine andS. M. Bartell, pp. 3–27, Ann Arbor Sci., Ann Arbor, Mich.
Ensign, S. H., and M. W. Doyle (2005), In-channel transient storage andassociated nutrient retention: Evidence from experimental manipulations,Limnol. Oceanogr., 50, 1740–1751.
Ensign, S. H., S. K. McMillan, S. P. Thompson, and M. F. Piehler (2006),Nitrogen and phosphorus attenuation within the stream network of acoastal, agricultural watershed, J. Environ. Qual., 35, 1237–1247.
Essington, T., and S. Carpenter (2000), Nutrient cycling in lakes andstreams: Insights from a comparative analysis, Ecosystems, 3, 131–143.
Fisher, S. (1977), Organic matter processing by a stream-segment ecosys-tem: Fort River, Massachusetts, USA, Int. Rev. Gesamten Hydrobiol., 62,701–727.
Fisher, S., R. Sponseller, and J. Heffernan (2004), Horizons in streambiogeochemistry: Flowpaths to progress, Ecology, 85, 2369–2379.
Gucker, B., and I. G. Boechat (2004), Stream morphology controlsammonium retention in tropical headwaters, Ecology, 85, 2818–2827.
Hack, J. T. (1957), Studies of longitudinal stream profiles in Virginia andMaryland, U.S. Geol. Surv. Prof. Pap., 294B, 94 pp.
Hall, R. O., B. J. Peterson, and J. L. Meyer (1998), Testing a nitrogen-cycling model of a forest stream by using a nitrogen-15 tracer addition,Ecosystems, 1, 283–298.
Hart, B. T., P. Freeman, and I. D. McKelvie (1992), Whole-stream phos-phorus release studies: Variation in uptake length with initial phosphorusconcentration, Hydrobiologia, 235/236, 573–584.
Hester, E. T., and M. W. Doyle (2005), Modeling the effects of in-channelgeomorphic forms on hyporheic interaction, paper presented at AnnualMeeting, Geol. Soc. of Am., Salt Lake City, Utah.
Horton, R. E. (1945), Erosional development of streams and their drainagebasins: Hydrophysical approach to quantitative methodology, Geol. Soc.Am. Bull., 56, 275–370.
Howarth, R., R. Marino, and D. Scavia (2002), Nutrient pollution incoastal waters: Priority topics for an integrated national research pro-gram for the United States, report, U.S. Dep. of Commerce, NOAA,Silver Spring, Md.
Knighton, D. (1998), Fluvial Forms and Processes, Oxford Univ. Press,New York.
Larned, S., V. Nikora, and B. Biggs (2004), Mass-transfer-limited nitrogenand phosphorus uptake by stream periphyton: A conceptual model andexperimental evidence, Limnol. Oceanogr., 49, 1992–2000.
Leopold, L. B., M. G. Gordon, and J. P. Miller (1964), Fluvial Processes inGeomorphology, Dover, Mineola, N. Y.
Losee, R. R., and R. G. Wetzel (1988), Water movement within submersedlittoral vegetation, Verh. Int. Ver. Theor. Angew. Limnol., 23, 62–66.
McColl, R. (1974), Self-purification of small freshwater streams: Phos-phate, nitrate, and ammonia removal, N. Z. J. Mar. Freshwater Res., 8,375–388.
Meyer, J., and G. Likens (1979), Transport and transformation of phos-phorus in a forest stream ecosystem, Ecology, 60, 1255–1269.
Minshall, G., R. Petersen, K. Cummins, T. Bott, J. Sedell, C. Cushing, andR. Vannote (1983), Interbiome comparison of stream ecosystem dy-namics, Ecol. Monogr., 53, 1–24.
Mulholland, P. J. (2004), The importance of in-stream uptake for reg-ulating stream concentrations and outputs of N and P from a forestedwatershed: Evidence from long-term chemistry records for WalkerBranch Watershed, Biogeochemistry, 70, 403–426.
Mulholland, P. J., J. D. Newbold, J. W. Elwood, and L. A. Ferren (1985),Phosphorus spiralling in a woodland stream: seasonal variations, Ecology,66, 1012–1023.
Mulholland, P. J., A. D. Steinman, and J. W. Elwood (1990), Measurementof phosphorus uptake length in streams: Comparison of radiotracer andstable PO4 releases, Can. J. Fish. Aquat. Sci., 47, 2351–2357.
Mulholland, P., A. Steinman, E. Marzolf, D. Hart, and D. DeAngelis(1994), Effect of periphyton biomass on hydraulic characteristics andnutrient cycling in streams, Oecologia, 98, 40–47.
Mulholland, P. J., E. R.Marzolf, J. R.Webster, D. R.Hart, and S. P. Hendricks(1997), Evidence that hyporheic zones increase heterotrophic metabolismand phosphorus uptake in forest streams, Limnol. Oceanogr., 42, 443–451.
Mulholland, P., et al. (2002), Can uptake length in streams bedetermined by nutrient addition experiments? Results from an inter-biome comparison study, J. N. Am. Benthol. Soc., 21, 544–560.
Newbold, J.D., J.W.Elwood,R.V.O’Neill, andW.V.Winkle (1981),Measur-ing nutrient spiralling in streams,Can. J. Fish. Aquat. Sci., 38, 860–863.
Newbold, J. D., J. W. Elwood, R. V. O’Neill, and A. L. Sheldon (1983),Phosphorus dynamics in a woodland stream ecosystem: A study ofnutrient spiralling, Ecology, 64, 1249–1265.
Payn, R., J. Webster, P. Mulholland, H. Valett, and W. Dodds (2005),Estimation of stream nutrient uptake from nutrient addition experiments,Limnol. Oceanogr., 3, 174–182.
Peterson, B., et al. (2001), Control of nitrogen export from watersheds byheadwater streams, Science, 292, 86–90.
Riber, H. H., and R. G. Wetzel (1987), Boundary-layer and internal diffusioneffects on phosphorus fluxes in lake periphyton, Limnol. Oceanogr., 32,1181–1194.
Runkel, R. (2002), A new metric for determining the importance oftransient storage, J. N. Am. Benthol. Soc., 21, 529–543.
Schumm, S. A. (1956), The evolution of drainage systems and slopesin badlands at Perth Amboy, New Jersey, Bull. Geol. Soc. Am., 67, 597–646.
Shreve, R. L. (1966), Statistical law of stream numbers, J. Geol., 74, 17–37.Smart, J. S. (1968), Statistical properties of stream lengths, Water Resour.Res., 4, 1001–1014.
Stanford, J. A., and J. V. Ward (1988), Hyporheic habitat of riverecosystems, Nature, 335, 64–66.
Stow, C., M. Borsuk, and D. Stanley (2001), Long-term changes inwatershed nutrient inputs and riverine exports in the Neuse River, NorthCarolina, Water Res., 35, 1489–1499.
Strahler, A. N. (1952), Hypsometric (area-altitude) analysis of erosionaltopography, Bull. Geol. Soc. Am., 63, 1117–1142.
Stream Solute Workshop (1990), Concepts and methods for assessingsolute dynamics in stream ecosystems, J. N. Am. Benthol. Soc., 9,95–119.
Thomas, S. A., H. M. Valett, J. R. Webster, and P. J. Mulholland (2003), Aregression approach to estimating reactive solute uptake in advective andtransient storage zones of stream ecosystems, Adv. Water Resour., 26,965–976.
Triska, R., V. Kennedy, R. Avanzino, G. Zellweger, and K. Bencala (1989),Retention and transport of nutrients in a third-order stream: Hyporheicprocesses, Ecology, 70, 1877–1892.
Valett, H. M., J. A. Morrice, C. N. Dahm, and M. E. Campana (1996),Parent lithology, surface-groundwater exchange, and nitrate retention inheadwater streams, Limnol. Oceanogr., 41, 333–345.
Vannote, R. L., G. W. Minshall, K. W. Cummins, J. R. Sedell, and C. E.Cushing (1980), The river continuum concept, Can. J. Fish. Aquat. Sci.,37, 130–137.
Wallace, J., J. Webster, and W. Woodall (1977), The role of filter feeders instream ecosystems, Arch. Hydrobiol., 79, 506–532.
G04009 ENSIGN AND DOYLE: NUTRIENT SPIRALING REVIEW
12 of 13
G04009
Webster, J. (1975), Analysis of potassium and calcium dynamics in streamecosystems on three Southern Appalachian watersheds of contrastingvegetation, Ph.D. dissertation, Univ. of Ga. at Athens, Athens.
Webster, J., and B. Patten (1979), Effects of watershed perturbation onstream potassium and calcium dynamics, Ecol. Monogr., 49, 51–72.
Webster, J. R., et al. (2003), Factors affecting ammonium uptake instreams—An interbiome perspective, Freshwater Biol., 48, 1329–1352.
Williams, M., C. Hopkinson, E. Rastetter, and J. Vallino (2004), Nbudgets and aquatic uptake in the Ipswich River basin, northeasternMassachusetts, Water Resour. Res., 40, W11201, doi:10.1029/2004WR003172.
Wollheim, W. M., B. J. Peterson, L. A. Deegan, J. E. Hobbie, B. Hooker,W. B. Bowden,K. J. Edwardson, D. B.Arscott, A. E. Hershey, and J. Finlay
(2001), Influence of stream size on ammonium and suspended particulatenitrogen processing, Limnol. Oceanogr., 46, 1–13.
Wollheim, W. M., C. J. Vorosmarty, B. J. Peterson, S. P. Seitzinger, andC. S. Hopkinson (2006), Relationship between river size and nutrientremoval, Geophys. Res. Lett., 33, L06410, doi:10.1029/2006GL025845.
�����������������������M. W. Doyle, Department of Geography, University of North Carolina at
Chapel Hill, Chapel Hill, NC 27599, USA.S. H. Ensign, Curriculum in Ecology, University of North Carolina at
Chapel Hill, 3431 Arendell Street, Morehead City, NC 28557, USA.([email protected])
G04009 ENSIGN AND DOYLE: NUTRIENT SPIRALING REVIEW