Nutrition and Physical Activity in Native Hawaiians and Pacific Islanders A community and evidence-based perspective Archana J. McEligot CSUF Juliet McMullin UCR Ka’ala Pang Kawai Pang PIHP-Hawaii Charlene Kazner Ainahau O Kaleponi Hawaiian Civic Club
Transcript
Nutrition and Physical Activity in Native Hawaiians and Pacific
IslandersA community and evidence-based perspective
Archana J. McEligot CSUF
Juliet McMullin UCR
Ka’ala Pang
Kawai Pang PIHP-Hawaii
Charlene Kazner Ainahau O Kaleponi
Hawaiian Civic Club
Objectives1. Identify the community’s nutrition and PA
challenges 2. Understand the health disparities for Pacific
Islanders related to nutrition3. Familiarize the audience to Pacific Islander dietary intakes and needs4. Discuss the social determinants/cultural context
for diet and PA in Pacific Islanders5. Characterize dietary interventions in Pacific
Islander populations
Our Values
PiliAlohaMālama kekahi I kekahiMaihilahilaNa’auaoAno ano hua
Healthy Pacific Islanders
Health problems aren’t necessarily “who” NHPI are, traditionally their diet, lifestyle and health conditions were excellent
Discussion of weight, diet and exercise Weight as very unhealthy vs question of size Being able to do what you want to do.
“I see some very big Hawaiians, but they’re still doing the things they want to do”
“It’s the way you carry yourself” the emotion of being Hawaiian
Hula Warm-up
Pressing ProblemsObjective 2: Health Disparities related to nutrition and PA in NHPI
“Some of the problems are well known and we know
what we should do…”
Diseases Diabetes, heart disease, cancer
Practices Diet and exercise
Nutritious vs non-nutritious Fast vs home cooked Hawaiian vs American
What Are Our Health Disparities? - Population According to the 2000 U.S. Census, there are 874,000 reported
Native Hawaiian and Other Pacific Islanders, which account for 0.3% of the entire U.S. population 1.
Native Hawaiians and Pacific Islanders, as a group, experienced 2.4% growth between 2007 and 2008, third overall among race groups; Asians and Hispanics were second and first respectively2.
Native Hawaiians are the largest Pacific Islander group in the U.S. followed by Samoan, and Guamanian or Chamoru. These three groups account for 74% of the total respondents who reported belonging to a single Pacific Islander group1.
1: Grieco, E. M. (n.d.). The Native Hawaiian and Other Pacific Islander Population: 2000 (p. 1, Issue brief No. C2KBR/01-14). doi:http://www.census.gov/prod/2001pubs/c2kbr01-14.pdf2: Paisano, Edna L. We the American: Pacific Islanders. Rep. Washington, DC: U.S. Government Printing Office, 1993. W. U.S. Department of Commerce Bureau of the Census, Sept. 1993. (p.3) <http://www.census.gov/apsd/wepeople/we-4.pdf>.From: White House Initiative on Asian Americans and Pacific Islanders Fact Sheet
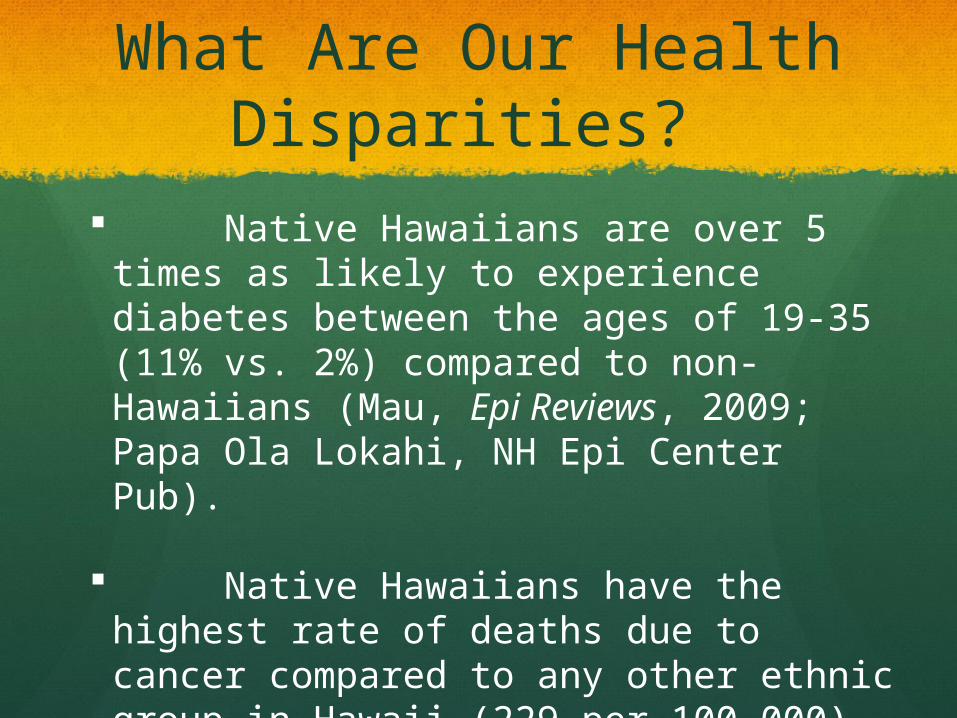
Native Hawaiians are over 5 times as likely to experience diabetes between the ages of 19‐35 (11% vs. 2%) compared to non‐Hawaiians (Mau, Epi Reviews, 2009; Papa Ola Lokahi, NH Epi Center Pub).
Native Hawaiians have the highest rate of deaths due to cancer compared to any other ethnic group in Hawaii (229 per 100,000) and the 2nd highest rate in the country. (Chu KC, Cancer 2005).
What Are Our Health Disparities?
Pacific Islanders reported higher adjusted rates of hypertension (1.50; 1.06, 2.13), diabetes (1.82; 1.25, 2.63), asthma (2.32; 1.65, 3.25), and arthritis (1.68; 1.20, 2.35). Pacific Islanders also more frequently reported having fair or poor health (1.46; 1.05, 2.04). Most differences in self-reported health status and chronic
disease outcomes were mediated by higher rates of overweight and obesity, but not higher rates of smoking, among Pacific Islanders (Bitton, J Gen Intern Med. 2010).
According to the CDC, Native Hawaiians and other Pacific Islanders have the second highest rate of diagnoses of HIV infection and the second shortest AIDS survival rate of all Americans (Stafford, AJPH, 2010).
Health in Children Among children, California schools use Healthy Fitness Zones
(HFZ) to evaluate whether a student meets the HFZ goal of physical activity and body composition.
NHPIs reported the highest proportion of 5th graders whose Body Mass Index (BMI) are not in the HFZ, with Samoans (53.9%) and Other Pacific Islanders (41.5%) having the highest rates across all racial/ethnic groups.
Guamanian (34.7%), Native Hawaiian (34.6%), and Tahitian (34.4%) Californians also reported higher rates of 5th graders whose BMI are not in the HFZ compared to the state average (32%).
More Samoan, Guamanian, Native Hawaiian, and Tahitian children have a body mass index (BMI) not within the Healthy Fitness Zone compared to the state average.
Source: Ethnic Health Assessment for Asian Americans, Native Hawaiians, and Pacific Islanders in California, August 2010
Demographics of DABS
Mal
e
Fem
ale
Curre
ntly S
mok
e
Does Not
Cur
rent
y Sm
oke
High
Scho
ol G
radu
ate/
Equi
vale
nt
Som
e Col
lege
Colle
ge G
radu
ate
Adva
nced
Deg
ree
0
20
40
60
80
100
Mean Age = 60
%
McEligot, McMullin, Pang, HMJ, 2010
What Are Our Health Disparities?
Yes 51%No
49%
Chronic Condition
McEligot, McMullin, Pang, HMJ, 2010
Yes 74.19
No 25.81
Cardiometabolic Disease
McEligot, McMullin, Pang, HMJ, 2010
Body Mass Index
8%
33%
58%
NormalOverweightObese
McEligot, McMullin, Pang, HMJ, 2010
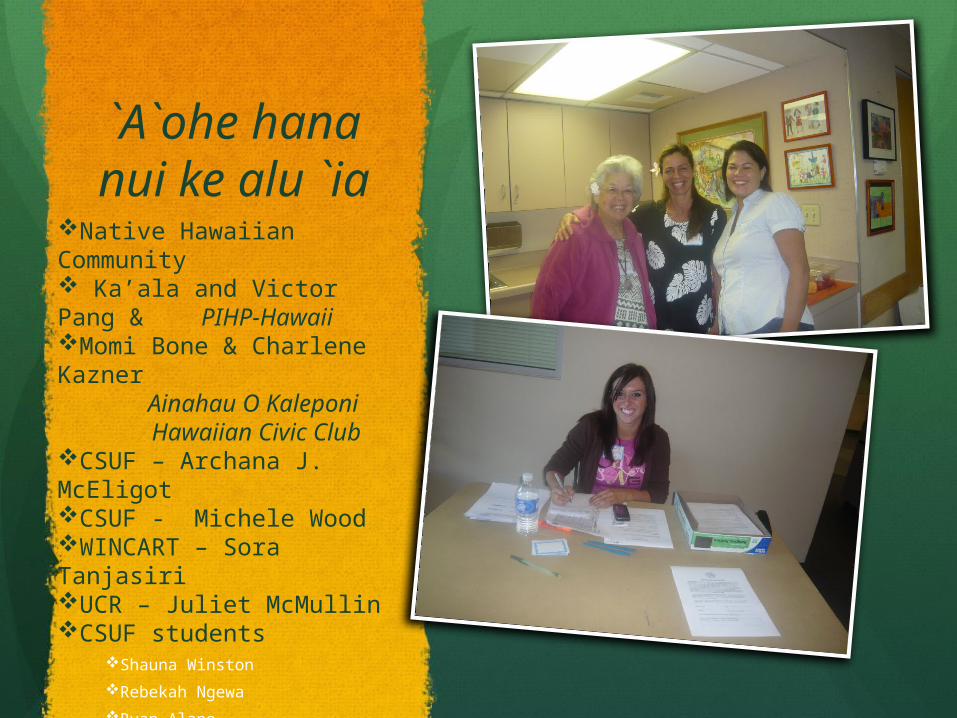
`A`ohe hana nui ke alu `ia
(No work is too large when done by all)Objective 3. Familiarize the audience to Pacific Islander dietary intakes and needsObjective 4: Discuss the social determinants/cultural context for diet and PA for NHPI
What Are We Eating? Major studies on Diet and Nutrition for
NHPI
Wai’anae Diet Program, incorporated traditional Hawaiian values with a Traditional Hawaiian Diet (THD) of kalo (taro), poi (mashed taro), ‘uala (sweet potato), fish and chicken (1 - 3).
The PILI ‘Ohana project, a CBPR partnership, conducted in Hawai`i encourages culturally-sensitive healthful lifestyle behavior change through various nutrition and physical activity strategies (4), and results have shown reduction in weight and dietary fat intakes.
The Multi-ethnic cohort study, cross-sectional study between Hawaii and California assessing dietary intakes among five ethnic groups
1. Fujita R, Braun KL, Hughes CK. The traditional Hawaiian diet: a review of the literature. Pac Health Dialog. 2004;11:250-9. 2. Shintani T, Beckham S, O'Connor HK, Hughes C, Sato A. The Waianae Diet Program: a culturally sensitive, community-based obesity and clinical intervention program for the Native Hawaiian population. Hawaii Med J. 1994;53:136-41. 3. Shintani T, Beckham S, O'Connor HK, Hughes C, Sato A. The Waianae Diet Program: a culturally sensitive, community-based obesity and clinical intervention program for the Native Hawaiian population. Hawaii Med J. 1994; 53:136-41. 4. Nacapoy AH, Kaholokula JK, West MR, Dillard AY, Leake A, Kekauoha BP, Palakiko DM, Siu A, Mosier SW, Marjorie KM; PILI 'Ohana Project. Partnerships to address obesity disparities in Hawai'i: the PILI 'Ohana Project. Hawaii Med J. 2008 Sep;67(9):237-41.
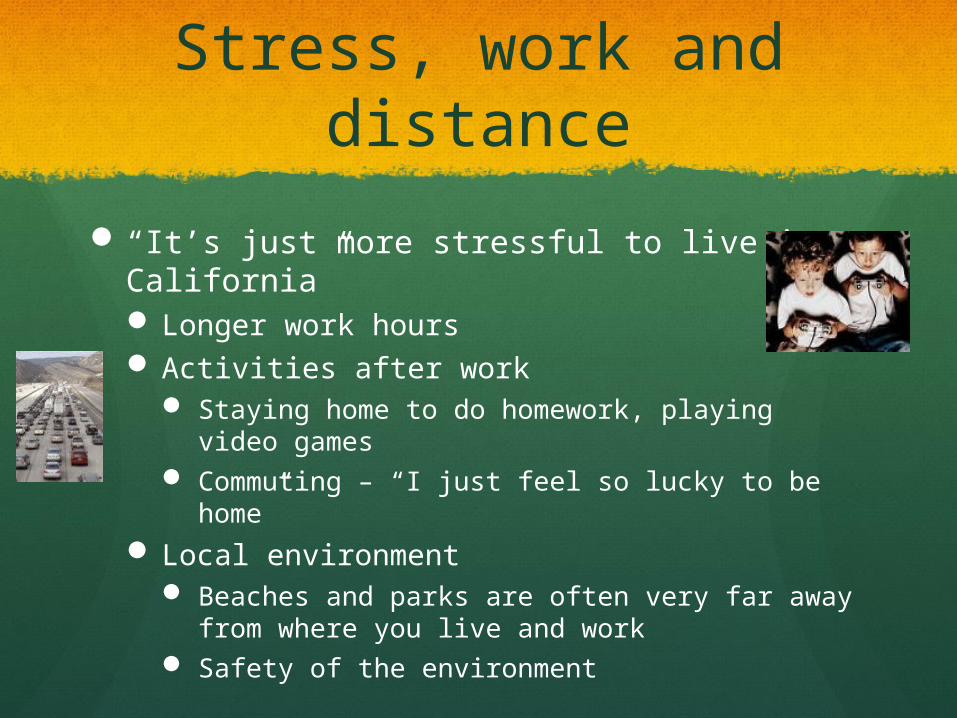
Access Environment and healthy spaces where you can get Hawaiian foods
“I lived here 10 years before I finally was able to hook up with the community. Now I am learning where I can get Hawaiian foods.”
How to share foods Too much food for the kupuna or singles Community Gardens
Famili Pe Taha – Steven Fifita
Objective 5: Characterize dietary interventions in NHPI
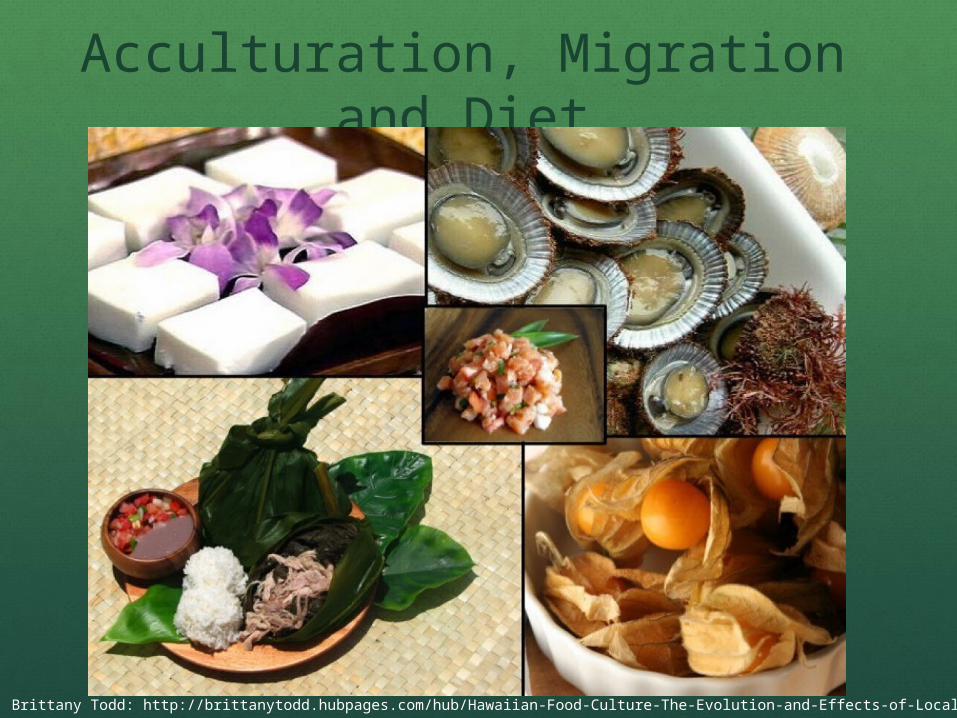
populations – Traditional Hawaiian Diet (THD)Traditional Foods:
• kalo (taro)• weet potato• poi (mashed taro)• fish• chicken• (both fish and chicken were occasionally eaten).
Preparation and cooking methods. Traditional Hawaiian diets were extremely low in fat primarily due to the simplicity of the cooking methods, as well as consumption of a high fiber, complex-carbohydrate diet. Cooking methods emphasized for the present study include:• Baking• Steaming• Broiling• Boiling
Objective 5: Characterize dietary interventions in NHPI
populations – PILI ‘Ohana
The PILI ‘Ohana program includes eight sessions focusing on lifestyle change, including:
1) Overview of the PILI Lifestyle Intervention 2) Getting started on eating less fat 3) Being more active 4) Healthy eating and monitoring 5) Keeping to reduced calories 6) Taking charge of your diet/environment 7) Communicating with health care providers8) A wrap up session
Mau MK, Keawe'aimoku Kaholokula J, West MR, Leake A, Efird JT, Rose C, Palakiko DM, Yoshimura S, Kekauoha PB, Gomes H.Prog Community Health Partnersh. 2010 Spring;4(1):7-16.
`A`ohe hana nui ke alu `ia
Native Hawaiian Community Ka’ala and Victor Pang &
PIHP-HawaiiMomi Bone & Charlene Kazner Ainahau O Kaleponi Hawaiian Civic Club
CSUF – Archana J. McEligotCSUF - Michele WoodWINCART – Sora TanjasiriUCR – Juliet McMullinCSUF students