FINAL REPORT MCC Indonesia Nutrition Project Impact Evaluation Design September 12, 2014 Updated April 17, 2019 Amanda Beatty Evan Borkum Anu Rangarajan Anna Gage Clair Null Sukhmani Sethi Submitted to: Millennium Challenge Corporation Room 3035F, Bowen Bldg. 875 15th St., NW Washington, DC 20005-2221 Project Officer: Shreena Patel Submitted by: Mathematica Policy Research P.O. Box 2393 Princeton, NJ 08543-2393 Project Director: Anu Rangarajan Reference Number: 40275.110
Transcript
F I N A L R E P O R T
MCC Indonesia Nutrition Project Impact Evaluation Design
September 12, 2014 Updated April 17, 2019
Amanda Beatty
Evan Borkum
Anu Rangarajan
Anna Gage
Clair Null
Sukhmani Sethi
Submitted to: Millennium Challenge Corporation
Room 3035F, Bowen Bldg.
875 15th St., NW
Washington, DC 20005-2221
Project Officer: Shreena Patel
Submitted by: Mathematica Policy Research
P.O. Box 2393
Princeton, NJ 08543-2393
Project Director: Anu Rangarajan
Reference Number: 40275.110
This page left blank for double sided copying.
MCC INDONESIA NUTRITION PROJECT IMPACT EVALUATION DESIGN REPORT MATHEMATICA POLICY RESEARCH
iii
ACKNOWLEDGMENTS
This report was made possible through the contributions of many individuals.
We appreciate the guidance and support of our partners at MCC and MCA-I, including project officer, Shreena Patel, for providing insight on the project interventions, questions on the literature, feedback on the preliminary design, and overall direction of this evaluation. We thank MCA-I staff for their input and guidance on the evaluation design, and for their leadership in managing the survey work. Specifically, we thank Pak Kharisma Nugroho (M&E Director), Pak Sugih Hartono (M&E Specialist), Pak Minarto (Nutrition Director), Pak Iing Mursalin (Nutrition Project Specialist), Ibu Rosnani Pangaribuan (Nutrition Specialist), Pak Ridwansyah (Chief Economist), and Pak J.W. Saputro (CEO). We also thank MCC Indonesia team members Nilufar Ahmad, Kartik Akileswaran, Martha Bowen, Michelle Inkley, Andy Pradjaputra, Peter Rosner, Jennifer Sturdy, and Troy Wray.
We greatly appreciate the support of and input from various members of government agencies such as Ministry of Home Affairs (Kemendagri), the Ministry of National Development Planning (Bappenas), the Coordinating Ministry for Economy and Social Welfare (Menkokesra), and the Ministry of Health (Kemenkes). We especially thank Pak Rudy Prawiradinata (Director of Poverty Alleviation, Bappenas), Ibu Woro Srihastuti Sulistyaningrum or Ibu Lisa (Deputy Director of Poverty Alleviation, Bappenas), and Pak Doddy Izwardy (Nutrition Director at Ministry of Health).
We also appreciate the feedback and support from members of the PNPM-Support Facility (PSF) Ibu Gerda Gulo, Pak Djoko Hartono, Mbak Yulia Herawati, Pak Sadwanto, Audrey Sacks and Rob Wrobel; and Rebekah Pinto (World Bank water and sanitation, and health consultant).
We thank Jere Behrman for his suggestions on how to improve the design, and for serving as the overall quality assurance reviewer. We also thank nutritionists Anuraj Shankar and Airin Roshita for their expert guidance, and feedback on the report. Anuraj Shankar wrote the fidelity strengthening intervention section of this report.
Finally, we are grateful for the support of Mike Donaldson, and John Kennedy for editing the report, and Emily Wharton and Jennifer Baskwell for formatting the report.
This page left blank for double sided copying.
v
CONTENTS
ACKNOWLEDGMENTS ............................................................................................................................... III
GLOSSARY ................................................................................................................................................. XI
I. OVERVIEW OF THE NUTRITION PROJECT AND RELEVANT LITERATURE ....................................... 1
A. Background ................................................................................................................................ 1
B. Report objectives ....................................................................................................................... 2
C. Nutrition Project background ..................................................................................................... 3
D. Summary of existing evidence................................................................................................... 8
E. Gaps in the literature ............................................................................................................... 17
II. NUTRITION PROJECT INDICATORS AND OUTCOMES ..................................................................... 21
A. Key indicators, including outputs and outcomes ..................................................................... 21
B. Economic rate of return and beneficiary analysis .................................................................... 29
III. EVALUATION DESIGN .......................................................................................................................... 33
A. Research questions and overview of the evaluation ............................................................... 33
B. Methodology: random assignment .......................................................................................... 34
1. Selection of kecamatan for random assignment ............................................................... 35
2. Random assignment of kecamatan .................................................................................. 36
3. Qualitative implementation analysis and special studies .................................................. 37
C. Study sample ........................................................................................................................... 38
1. Identification of the study sample ...................................................................................... 38
2. Cross-sectional versus panel sample ............................................................................... 39
II.3 The Nutrition Project has multiple benefit streams ........................................................................ 30
III.1 We recommend retaining the existing sample sizes of 95 treatment and 95 control kecamatan to detect impacts on stunting (children 0–35 months) ................................................ 42
III.2 We recommend an endline sample size of 32 households with children 0–35 months per kecamatan to detect plausible impacts on key outcomes .............................................................. 44
III.3 We recommend an endline sample size of 16 households with pregnant women in the second or third trimester per kecamatan to detect plausible impacts on key outcomes ............... 45
III.4 We recommend a baseline sample size of 16 households with children 0–35 months per kecamatan to identify baseline treatment-control differences and estimate baseline means............................................................................................................................................. 46
III.5 We recommend a baseline sample size of eight households with pregnant women in the second or third trimester per kecamatan to identify baseline treatment-control differences and estimate baseline means ........................................................................................................ 47
IV.1 Household surveys focus on background information about the household, with modules for pregnant women and caregivers of children 0-35 months....................................................... 58
IV.2 Puskesmas and desa-level interviews will focus on capacity, knowledge, and outreach activities ......................................................................................................................................... 59
IV.3 Examples of possible studies include implementation progress, household dynamics, schooling, and the fidelity strengthening intervention .................................................................... 61
This page left blank for double sided copying.
ix
FIGURES
I.1 Nutrition Project activities will be implemented through 2018 .......................................................... 3
II.1 Nutrition project activities are intended to reduce stunting, wasting, and underweight and ultimately reduce poverty through economic growth ..................................................................... 22
III.1 Random assignment resulted in 95 treatment and 95 control kecamatan .................................... 35
III.2 The impact evaluation will take place in three provinces ............................................................... 37
IV.1 Baseline data collection will take place in 2014, and there are two options for the timing of subsequent quantitative data collection rounds ............................................................................. 53
V.1 Tentative implementation and evaluation time line ........................................................................ 66
This page left blank for double sided copying.
xi
GLOSSARY
Badan Pusat Statistik (BPS) Census Bureau
Bappenas National Development Planning Agency
Bidan Midwife/midwives
BMI Body Mass Index
Buku kesehatan ibu dan anak (buku KIA) Mother and child health book
CDD Community-Driven Development
CI Confidence interval
CLTS Community-Led Total Sanitation (known as Sanitasi Total Berbasis Masyarakat or STBM in Indonesian)
Kementerian Dalam Negri (Depdagri) Ministry of Home Affairs
Desa Village
DHS Demographic and Health Survey
Dinas Kesehatan District health office
Ditjen Pemberdayan Masyarakat dan Desa (PMD) Directorate General of Rural Community Empowerment at the Ministry of Home Affairs
Dukun beranak Traditional birth attendants
Dusun Hamlet or sub-village (smallest administrative level)
EBF Exclusive breastfeeding
ERR Economic rate of return
FSI Fidelity strengthening intervention
GoI Government of Indonesia
ICC Inter-cluster correlation
IFA Iron folic acid
IFLS Indonesian Family Life Survey
IRB Institutional review board
ITT Intent-to-treat
Jaminan Kesehatan Nasional National health insurance
Kabupaten District
Kader Desa Village volunteers
Kader Posyandu Integrated health service post volunteers
Kartu menuju sehat (KMS) Healthy child growth chart
Kecamatan Subdistrict
Kelas balita Classes about infants (held as part of PNPM-Generasi)
Kelas ibu hamil Maternal health classes (held as part of PNPM-Generasi)
Kementerian Kesehatan (Kemenkes) Ministry of Health
Kepala desa Village head
GLOSSARY MATHEMATICA POLICY RESEARCH
xii
LBW Low birth weight
M&E Monitoring and evaluation
MCA-I Millennium Challenge Account- Indonesia
MCC Millennium Challenge Corporation
MDD Minimum detectable differences
MDI Minimum detectable impact
Kementerian Koordinator Bidang Kesejahateraan Rakyat (Menkokesra)
Coordinating Ministry for Economy and Social Welfare
MIYCF Mother, infant, and young child feeding
MNP Micronutrient powder
MUAC Middle-upper arm circumference
NGO Non-governmental organization
NMR Neonatal mortality rate
ODF Open defecation free
Pondok bersalin desa (Polindes) Village birthing post or clinic
Pondok kesehatan desa (Ponkesdes) Village health post
Potensi desa (Podes) Village potential statistics (dataset)
Pos kesehatan desa (Poskesdes) Village health post
Pos pelayanan terpadu (Posyandu) Monthly integrated maternal and child health service post
Program Nasional Pemberdayaan Masyarakat —Generasi Sehat dan Cerdas (PNPM-Generasi)
National Community Empowerment Program: A Healthy and Smart Generation
PSF PNPM-Generasi support facility
Provinsi Province
Pusat kesehatan masyarakat (Puskesmas) Subdistrict health center
Puskesmas pembantu (Pustu) Auxiliary community health center
RCT Randomized control trial
Riset facilitas kesehatan (Rifaskes) Health Facilities Research (survey)
Riset kesehatan dasar (Riskesdas) National Basic Health Research (survey)
Susenas National Socioeconomic Survey
ToR Terms of reference
ToT Treatment on the treated
TSSM Total sanitation and sanitation marketing
TWG Technical working group
U5MR Under five mortality rate
UNICEF United Nations Children’s Fund
WHO World Health Organization
MCC INDONESIA NUTRITION PROJECT IMPACT EVALUATION DESIGN REPORT MATHEMATICA POLICY RESEARCH
1
I. OVERVIEW OF THE NUTRITION PROJECT AND RELEVANT LITERATURE
A. Background
Child stunting, or low height-for-age, is a major global health concern affecting an estimated 171 million children under age 5 worldwide.1 Stunting in early childhood is associated with impaired cognitive ability, and higher morbidity and mortality. This results in lasting impacts on a child’s ability to perform well in school and fight disease, and lifelong effects of lower wages and lost productivity (De Onis, Bloessner, et al. 2011; Glewwe and King 2001; Maccini and Yang 2009; Victora, Adair, et al. 2008; Ruel and Alderman 2013; Hoddinott, Alderman et al. 2013a; Hoddinott, Behrman et al. 2013b; Alderman, Hoddinott et al. 2006). Women who are stunted at birth are at higher risk for having children with low birth weight, a condition further associated with stunting and its adverse effects (Victora, Adair et al. 2008). Stunting reflects the cumulative effects of the mother’s health during pregnancy, and mother and child health after birth. It is caused by a range of factors, often in combination, including poor maternal nutrition; inadequate early childhood nutrition, including complementary feeding and breastfeeding practices; severe and repeated infections such as those causing diarrhea; and environmental factors (Stewart, Iannotti, et al. 2013).
In Indonesia, the world’s fourth most populous country with over 240 million people, an estimated 36 percent of children under 5 years of age suffered from stunting in 2010, despite decades of reductions in poverty, child mortality, and the percentage of underweight children (Departemen Kesehatan RI 2010).2 Pregnant women and children in Indonesia continue to confront multiple factors believed to lead to stunting, including long-term inadequate food intake, child diarrhea, and frequent infections (Stewart, Iannotti, et al. 2013). According to the Indonesia Demographic and Health Survey (DHS), in 2012 only 37 percent of children 6–23 months old were fed according to WHO recommendations for best feeding practices for infants and young children (DHS 2013). Nineteen percent of children under age 2 had diarrhea in the two weeks preceding the survey. Indonesia has made strong progress in other child undernutrition indicators, including surpassing its goal of reducing the number of underweight (low weight-for-age) children under 5 years of age to below 18 percent (UNICEF 2012). However, greater progress is required in maternal and child health and nutrition to further reduce stunting, which has dropped only 11 percentage points since 1995 (MICS 1995; Departemen Kesehatan RI 2010).
1 Stunting is defined by the World Health Organization (WHO) as having a height-for-age or length-for-age
more than two standard deviations below the median of a healthy reference population. In addition to stunting, the other standard indicators of undernutrition are underweight and wasting. These are defined as having a weight-for-age and weight-for-height, respectively, more than two standard deviations below the median of a healthy reference population. Because the term malnutrition includes the overweight (high weight-for-height) indicator, we use the term undernutrition in this report to refer to the outcome of insufficient food intake and repeated infectious diseases as manifested by stunting, underweight, and wasting (WHO 2010).
2 The 2010 national stunting rate from the National Basic Health Research study (Riskesdas) is 35.6 percent. In the three provinces that the evaluation described in this report will focus on, as detailed in Section I.C, the stunting rate is 39.7 percent in West Kalimantan, 39.6 percent in Central Kalimantan and 38.9 percent in South Sulawesi (Departemen Kesehatan RI 2010).
MCC INDONESIA NUTRITION PROJECT IMPACT EVALUATION DESIGN REPORT MATHEMATICA POLICY RESEARCH
2
To address these challenges related to undernutrition, the Millennium Challenge Corporation (MCC) has partnered with the government of Indonesia (GoI) and other key stakeholders to fund and implement the Community-Based Health and Nutrition to Reduce Stunting Project, also known as the Nutrition Project. This five-year, US$131.5 million project includes demand and supply-side activities that target many of the causes of stunting. The Nutrition Project focuses specifically on the health and nutrition of pregnant women, and infants and children under 5 years, with an emphasis on children under 2 years3—by which age the effects of early stunting are much more challenging to repair and could have a lifelong impact on an individual’s cognitive development and productivity (Deolalikar 1988; Bhutta, Ahmed, et al 2008; Hoddinott, Behrman, et al. 2013b; Victora, Adair, et al. 2008; Martorell, Khan, et al. 1994).4 The Nutrition Project will be implemented in 11 Indonesian provinces, whose population totals over 110 million, with the ultimate goal of reducing poverty through cost savings, increased productivity, and higher lifetime earnings.
The Nutrition Project is one of three projects in a US$600 million Compact that MCC signed with the GoI, which entered into force in April 2013 and will continue until April 2018. The other two projects in the Compact are Green Prosperity, focused on reducing greenhouse gas emissions and promoting sustainable economic growth, and Procurement Modernization, focused on increasing the efficiency of the GoI’s procurements. The Compact will be implemented by Millennium Challenge Account–Indonesia (MCA-I), an entity established by the GoI using MCC funds with the sole purpose of managing the Compact, in partnership with a host of other government, donor, nongovernmental organization (NGO), and private sector actors.
B. Report objectives
MCC has contracted with Mathematica Policy Research to conduct a rigorous evaluation of the Nutrition Project to understand the project’s effects on stunting and related key maternal and child health outcomes. The objective of this report is to provide a framework for the evaluation design for MCC, MCA-I, and other partners. The report is organized into five chapters. The remainder of Chapter I details the Nutrition Project’s activities, provides a review of the existing literature on the impact of various activities that MCC is supporting through the Nutrition Project on maternal and child health outcomes, especially stunting, and summarizes the current gaps in this literature. Chapter II outlines the key indicators these activities are expected to affect and provides an overview of the project’s Economic Rate of Return (ERR) model and beneficiary analysis. The evaluation design is detailed in Chapter III, including the planned research questions, methodology, study sample, and analysis. Chapter IV discusses the data sources required for the evaluation, including the surveys required for primary data collection. Finally, Chapter V covers a number of administrative issues related to the evaluation, including the Institutional Review Board (IRB) requirements, data file preparation, dissemination plan, evaluation team, and time line. Annex A gives an overview of the IRB. Annex B is a new
3 As discussed below, one component of the Nutrition Project—PNPM Generasi— also includes an education
focus. Therefore, some project funding may also be spent on efforts to increase primary and secondary enrollment and attainment.
4 However, several recent studies have suggested that children may recover from stunting to some degree in later childhood and adolescence (see, for example, Crookston et al. 2010 and 2013, Schott et al., and Adair 1999).
MCC INDONESIA NUTRITION PROJECT IMPACT EVALUATION DESIGN REPORT MATHEMATICA POLICY RESEARCH
3
addition as of April 2019 and updates the design changes that have taken place since this report was written in September 2014.
C. Nutrition Project background
The Nutrition Project includes several supply- and demand-side activities, which can be divided into three major components: (1) the community project activity, which provides block grants and facilitation to villages for activities related to health and schooling; (2) a set of supply-side activities primarily targeting health providers; and (3) a national communications campaign to promote increased awareness about stunting. Project activities are anticipated to be implemented over four years, from 2014–2018, as shown in Figure I.1, although implementation of some activities may not begin until 2015, and thus some activities may be implemented for just three years.5 Component 1 is shown in dark blue, component 2 is light blue, and component 3 is medium blue. Some of the dates below are estimates because some activities are still being designed, for example the service provider incentives activity and private sector response activity. An updated implementation timeline for the Project is in Annex B.
Figure I.1. Nutrition Project activities will be implemented through 2018
Project implementation 2014 2015 2016 2017 2018
Quarter 1 2 3 4 1 2 3 4 1 2 3 4 1 2 3 4 1 2
Generasi facilitator training
Generasi block grants dispersed
Mother, infant, and young child feeding (MIYCF) training
Growth monitoring training
Anthropometric kits distributed
Micronutrient distribution
Sanitation training
Service provider incentives
Private sector response activity
Communication campaign
Component 1 Component 2 Component 3
These activities will be implemented in the context of a decentralized health system. As a background to this context, Table I.1 outlines the structures of the Indonesian administrative and health systems that are relevant to the Nutrition Project and that we refer to throughout the rest of the report. As described below, most project activities will involve health facilities and workers
5 As noted above, the Compact entered into force in April 2013. Although the Compact is for five years, no
activities were started until 2014, hence the four or three-year implementation time line for most activities. This timeline is tentative and may need to be adjusted based on changes in project implementation.
MCC INDONESIA NUTRITION PROJECT IMPACT EVALUATION DESIGN REPORT MATHEMATICA POLICY RESEARCH
4
at the subdistrict (kecamatan) and/or village (desa) levels. The main providers related to the project who have the most contact with beneficiaries are midwives (bidan), monthly integrated maternal and child health service post (posyandu) volunteers (kader), and Generasi kader, who mainly work at the subvillage (dusun) and desa levels.6
Table I.1. The rural Indonesian health system includes providers at multiple levels
Administrative level Health facilities relevant to the Nutrition Project
Key health workers relevant to the Nutrition Project
Province (provinsi) NA NA
District (kabupaten) District health office (Dinas Kesehatan)
Dinas Kesehatan staff, for example those involved in training
Subdistrict (kecamatan) Health center (puskesmas) Midwife (bidan) coordinator, nutritionist, sanitarian, health outreach workers
Village (desa) Auxiliary community health center (pustu)
Village health post (poskesdes or ponkesdes)
Village birthing post/clinic (polindes)
Bidan, village nurses
Hamlet or subvillage (dusun) Monthly integrated maternal and child health service post (posyandu)
Bidan, posyandu volunteers (kader posyandu), traditional birth attendants (dukun beranak)
NA = not applicable.
The first component of the Nutrition Project, the community project activity, is an updated version of the Program Nasional Pemberdayaan Masyarakat—Generasi Sehat dan Cerdas, the National Community Empowerment Program: A Healthy and Smart Generation (PNPM-Generasi, or Generasi for short), an ongoing project that has been implemented by the GoI since 2007. Implementation is led by the Ministry of Home Affairs (Depdagri), with support from the National Planning Agency (Bappenas), the Coordinating Ministry for Economy and Social Welfare (Menkokesra), and the PNPM Support Facility (PSF).7 Generasi began in five provinces in 2007, an additional province was added in 2010, and two provinces were added in 2012. Using a community-driven development (CDD) model, Generasi provides facilitation and annual
6 The posyandu is one of the central mechanisms for reaching caregivers of young children. The posyandu is
staffed by village kader and supervised by the village bidan and puskesmas (subistrict health center) staff. Ideally, each dusun has a posyandu. However, in Central and West Kalimantan, monitoring data from MCA-I show there are about eight dusun per desa, but only about two posyandu per desa on average—suggesting that many posyandu serve multiple dusun. The posyandu takes place monthly; its main activities are weight measurement and vaccinations, and sometimes nutritional counseling and micronutrient distribution. Twice a year the posyandu also distributes vitamin A, and should conduct length measurement. For more about the posyandu, see Mize (2012).
7 The implementing entity for Generasi under the Ministry of Home Affairs is PMD, which stands for Ditjen Pemberdayaan Masyarakat dan Desa or the Directorate General of Village Community Empowerment, the division responsible for implementing all PNPM programs. (See http://www.kemendagri.go.id/.)
MCC INDONESIA NUTRITION PROJECT IMPACT EVALUATION DESIGN REPORT MATHEMATICA POLICY RESEARCH
5
block grants to desa to be used for activities that could lead to improvements in 12 health and schooling indicators established by Generasi (see Box I.1).8 In the first year of the project, kecamatan allocate the grants among desa based on the number of target beneficiaries per desa, focusing on pregnant women, and infants and children under 5, especially children under 2. In subsequent years, the size of the grants distributed is partially based on village progress on the indicators, and desa compete for a pool of additional funding that is 20 percent of the total amount allocated to the kecamatan.
As part of the Nutrition Project, MCC is supporting the introduction of PNPM-Generasi in three provinces that have not yet benefited from the program: West Kalimantan (Kalimantan Barat), Central Kalimantan (Kalimantan Tengah), and South Sumatra (Sumatera Selatan). MCC funding will support Generasi in these provinces for four years, starting in 2014. Also new in 2014, in collaboration with MCC, other donors and several ministries have revised the Generasi indicators to place a larger emphasis on health and nutrition. Specifically, they increased the number of target postnatal care visits from two to three, added new indicators on maternal health classes (kelas ibu hamil) and classes for caregivers of infants (kelas balita), and removed two of the schooling indicators (see Box I.1 for a list of the 2014 Generasi indicators). These indicators will be used in all 11 Generasi provinces starting in 2014. With MCC’s support, Generasi will also include a new requirement that project facilitators, who support desa members in implementing the project, are required to have experience with health programs and will receive additional training on mechanisms for improving maternal and child health. This training includes information on micronutrients, prenatal health, exclusive breastfeeding (EBF), complementary feeding, immunizations, malaria prevention, and diarrhea prevention and control, among other topics. These topics were chosen because they complement the Generasi indicators and are hypothesized to help improve maternal and child health, especially stunting. In 2014, the expected average block grant amount per desa will be approximately US$10,374, though this will vary based on the number of desa in a kecamatan.
8 According to Olken et al. (2012), examples of Generasi expenditures on were “hiring extra midwives for the
village, subsidizing the costs of prenatal and postnatal care, providing supplementary feeding, hiring extra teachers, opening a branch school in the village (kelas jauh or satellite classrooms, or sekolah terbuka or formal part-time junior secondary schooling), providing scholarships or school supplies, providing transportation funds for health care or school attendance, improving health or school buildings, or even rehabilitating a road to improve access to health and education facilities during the rainy season.”
MCC INDONESIA NUTRITION PROJECT IMPACT EVALUATION DESIGN REPORT MATHEMATICA POLICY RESEARCH
6
Box I.1. Generasi indicators are focused on improving maternal and child health, and schooling outcomes
The second component of the project is a set of supply-side activities that includes training for health service providers, the provision of length-taking equipment, micronutrient distribution, training and socialization on sanitation, and a private sector response activity, as described below. Most of these activities are expected to begin in 2014, with the expectation that they will affect beneficiaries at the desa level by late 2014 or early 2015. MCC will support the implementation of these activities across the 11 provinces (499 sub-districts) where Generasi is also being implemented, such that each participating kecamatan receives a package of demand and supply-side interventions.
Training on mother, infant, and young child feeding (MIYCF). The content for these trainings was developed by the United Nations Children’s Fund (UNICEF) and will be provided to health staff at national, provincial, district, kecamatan, and desa levels through a cascade model. At the lower levels of the cascade, district health staff will train one nutritionist and one bidan coordinator per puskesmas, who will in turn train one bidan, one kader posyandu, and one desa-level volunteer (kader desa) per desa. (Kader desa are usually those kader affiliated with Generasi.) In total, approximately 1,220 puskesmas staff and 15,600 bidan and kader posyandu per desa will be trained. The training is focused on nutrition during pregnancy, EBF, complementary feeding practices, use of micronutrients and supplements, and improved complementary feeding practices.
Provision of anthropometric kits. Training on growth monitoring for bidan and nutritionists at the puskesmas will be combined with the provision of anthropometric kits, which include length- and height-taking equipment, scales, and measuring tapes to measure middle-upper arm circumference (MUAC) for pregnant women. (As described in Chapter II,
1. Four prenatal care visits for pregnant women
2. Taking iron tablets during pregnancy
3. Delivery assisted by a trained professional
4. Three postnatal care visits
5. Complete childhood immunizations
6. Ensuring monthly weight increases for infants
7. Monthly weighing for children under 3 and biannually for children under 5
8. Vitamin A twice a year for children under 5
9. Participation of pregnant women and male partner in nutrition counseling offered through kelas ibu hamil
10. Participation of parents (and/or caregivers) in nutrition counseling offered through kelas balita
11. All primary and junior secondary aged children that have not enrolled in school or have dropped out, including children with disabilities, enroll
12. All children that graduate from primary school, including children with disabilities, enroll in junior secondary school
MCC INDONESIA NUTRITION PROJECT IMPACT EVALUATION DESIGN REPORT MATHEMATICA POLICY RESEARCH
7
MUAC is an indicator of maternal undernutrition). Length of children 0 to 35 months will be measured twice a year so that providers can better diagnose undernutrition, including stunting. Weighing is part of the standard posyandu visit and is tracked monthly up to age 5.
Distribution of micronutrients. Micronutrients will be distributed to pregnant mothers (iron folic acid supplements) and children aged 6 to 23 months (Taburia sachets) through the posyandu. (Taburia is the brand name for micronutrient sachets that come in powder form most commonly available in Indonesia, and that will be supported by the Project.)
Support implementation of the CLTS model. Training on promoting sanitation behavior change and triggering based on the community-led total sanitation (CLTS) model will be provided to sanitarians, kader desa, and potentially kader posyandu. In the CLTS model, a facilitator raises the community’s awareness on the extent of fecal contamination resulting from open defecation and mobilizes, or “triggers” the community to take action and modify their sanitation behavior. Triggering relies on creating a collective sense of disgust and shame to motivate community-wide behavior change to eliminate open defecation. MCC funding will also support the community action planning and follow-up activities that are part of the CLTS model. MCA-I may also offer results-based financing to complement this activity, such as offering incentives to desa, desa leaders and/or sanitarians to achieve open-defecation-free status in a desa. This activity is currently under review and potential redesign.
Health service provider incentives. The original concept of this activity was that district health officials, puskesmas staff, bidan, and/or kader posyandu would receive incentives for meeting a set of indicators related to providing adequate stunting prevention services. The concept is still an option, but this activity is also currently under review and potential redesign. An outstanding question is whether the activity will take place in just one kabupaten, as a pilot project, or be more widely implemented.
A private sector response activity. This activity will be implemented for three years beginning in 2015 and will aim to encourage the private sector to participate in programs focusing on improving child health. This activity is currently under review and potential redesign.
The third major component of the project is a national communications campaign to promote increased awareness about stunting. At the time of writing this report, the service provider had just been hired for the communications campaign. The precise messages and strategies of the campaign will be developed throughout 2014. However, the general expectation is that the main themes of the campaign will include best practices for breastfeeding, complementary feeding, micronutrient supplementation, and sanitation. The messages will also build on formative research on the role of all household members, including mothers and fathers, in improving child health and nutrition. Pregnant mothers are a primary target audience for the campaign, but messages will also be crafted for the larger community. MCA-I and MCC are also considering supporting more localized message delivery through NGOs, religious groups, or community organizations to help reinforce messages.
The Nutrition Project activities are being implemented in 11 of Indonesia’s 34 provinces: West Java (Jawa Barat), East Java (Jawa Timur), East Nusa Tenggara (Nusa Tenggara Timur), West Nusa Tenggara (Nusa Tenggara Barat), West Sulawesi (Sulawesi Barat), North Sulawesi
MCC INDONESIA NUTRITION PROJECT IMPACT EVALUATION DESIGN REPORT MATHEMATICA POLICY RESEARCH
8
(Sulawesi Utara), Gorontalo, Maluku, West Kalimantan (Kalimantan Barat), Central Kalimantan (Kalimantan Tengah), and South Sumatra (Sumatera Selatan). These provinces were chosen because they have among the highest levels of undernutrition, and high infant and under 5 mortality. The Generasi component of the project is ongoing in eight of the provinces with other funding sources, and MCC funding will support the supply-side activities in these provinces. In the remaining three provinces that had not previously received Generasi—West Kalimantan, Central Kalimantan and South Sumatra—MCC funding will support Generasi as well as the supply-side activities, which means that the project will be implemented uniformly in all 11 provinces. Across the 11 provinces, 499 kecamatan are scheduled to receive funding, benefiting an estimated 5,337 desa. Approximately 2.9 million children would benefit from the project, according to estimates in the MCA-I Monitoring and Evaluation (M&E) plan.9
D. Summary of existing evidence
In this section, we review the available evidence on each of the Nutrition Project activities: Generasi, MIYCF training (and components of the training, which include maternal nutrition, breastfeeding, and complementary feeding), micronutrient provision, water and sanitation training, health provider incentives, and the communications campaign. For each activity, we discuss evidence from the literature about how the activity could affect the outputs and outcomes in MCC and MCA-I’s project logic (discussed in Chapter II) and M&E plan, and describe the evidence on the effectiveness of the activity.
Generasi and other CDD projects with a nutrition focus. One reason Generasi was incorporated into the Nutrition Project was that a rigorous impact evaluation of the 2007–2008 implementation of Generasi in five provinces and 264 kecamatan showed promise (Olken, Onishi, et al. 2012).10, 11 The evaluation found significant increases in project-related indicators on health service use, such as frequency of weight checks for children at the posyandu and the number of iron sachets distributed to pregnant women. There was also a statistically significant decrease of 2.2 percentage points in the percentage of children 0–3 years who were underweight, but no significant impacts on stunting.12 The project also had an impact on indicators beyond
9 The M&E plan can be found at http://www.mcc.gov/documents/data/ME_Plan_-_IDN_-_V1_-_Aug13.pdf
10 The study randomized 264 kecamatan into three groups: incentivized Generasi (in which the size of the block grant in the subsequent year depended on performance in the initial year), non-incentivized Generasi (in which the size of the block grant was a fixed amount), and a non-Generasi (pure) control in five provinces. The provinces are East Java, West Java, North Sulawesi, Gorontalo, and Nusa Tenggara Timur. In the discussion above, we focus on the impacts of Generasi overall (average treatment effects across treatment arms), because the main focus of this discussion is the impact of Generasi compared to a pure control group.
11 The impact results discussed were presented in an academic paper (Olken, Onishi, et al. 2013) and a World Bank report (Olken, Onishi, et al 2012). We consistently cite the 2012 report as it is the most comprehensive summary of findings.
12 In Olken, Onishi, et al. 2012 and 2013, weight-for-age is referred to as “malnutrition” rather than “underweight.” Impacts on the percentage of underweight children were for the 30-month follow-up; there were no significant effects on this indicator at the 18-month follow-up or on average across the two survey rounds.
MCC INDONESIA NUTRITION PROJECT IMPACT EVALUATION DESIGN REPORT MATHEMATICA POLICY RESEARCH
9
those targeted through the program, such as facility-based deliveries, share of services delivered through the posyandu, and parental knowledge about parenting practices.13
There was some variation in impacts on undernutrition across provinces. In Nusa Tenggara Timur, the province with the highest baseline rates of poor nutrition outcomes prior to the intervention, underweight rates declined by 9 percentage points, and stunting decreased by 7 percentage points. The authors posit that the weight checks may have led to improvements in underweight and stunting because the weight checks take place at the posyandu, and many of the posyandu staff are also acting as village kader involved with managing Generasi. There were no significant changes on other nutrition outcomes in any other provinces except for West and East Java, where stunting increased by 5 percentage points on average (statistically significant at the 5 percent level), an effect for which the authors have no explanation. The project also had no impacts on diarrhea incidence or mortality, two outcome indicators in the Nutrition Project.
One cornerstone of Generasi, the Nutrition Project, and rural child health service delivery in Indonesia more generally, is the posyandu. A review of the literature on the posyandu system found that 69 percent of posyandu across the country were functioning at a low level, the kader posyandu dropout rate was high, and the kader lacked the skills and knowledge to adequately give nutrition counseling (Mize 2012). A qualitative study on how to improve nutrition outcomes through Generasi also found varied capacity, knowledge, and availability of kader, but the authors also showed that Generasi helped revitalize the posyandu by providing incentives to kader and increasing the number of kader per posyandu (Grayman, Anggraini, et al. 2014). The project increased posyandu participation by caregivers and children through the indicator related to monthly weighing and by providing food supplements.14 This suggests that the posyandu has a lot of potential to improve child health outcomes, but the question remains as to how the Nutrition Project can further strengthen it through Generasi and the supply-side activities.
To our knowledge there have been no CDD projects that target maternal and child health outcomes to the extent that Generasi does, but several infrastructure-oriented CDD projects have aspired to affect child nutrition, among many other things, in Andhra Pradesh (India), Bolivia, Nepal, Nicaragua, Peru, Senegal and Zambia (Wong 2012). The only other CDD project aside from Generasi that had effects on child undernutrition was the Programme National d’Infrastructures Rurales in Senegal (Arcand and Bassole 2011), which improved the nutritional status of children (as measured by underweight and stunting) through improved access to clean water and health facilities.
MIYCF training. As part of the Nutrition Project, health service providers at the puskesmas and desa levels will be given training on best MIYCF practices. The intent of these trainings is to improve providers’ knowledge so that they can better counsel mothers and caregivers through regular puskesmas and posyandu visits, kelas ibu hamil and kelas balita, and other outreach activities. Recent studies in Bangladesh and India found that these types of trainings significantly increased health providers’ knowledge of best feeding practices, although these studies did not
13 The project incentivized deliveries by trained health professionals, but not location of delivery. In some
cases, the posyandu expanded the type of services offered.
14 Food supplements are Generasi’s largest health-related expenditure, although, the “supplements” purchased are generally simple, packaged foods such as biscuits that may not satisfy maternal or child nutritional requirements.
MCC INDONESIA NUTRITION PROJECT IMPACT EVALUATION DESIGN REPORT MATHEMATICA POLICY RESEARCH
10
measure impacts on patient practices or ultimate health outcomes (Saha, Rawat, et al. 2013; Taksande, Tiwari, et al. 2009). Below we discuss the literature related to the specific topics covered in the trainings: maternal nutrition, breastfeeding, and complementary feeding.
Maternal nutrition. Maternal undernutrition affects fetal growth, increases the risk of stunting in the first two years of life, and is associated with chronic diseases during adulthood (Victora, Adair, et al. 2008; Black, Allen, et al. 2008). The existing literature also emphasizes the association between low pre-pregnancy body mass index (BMI) and low birth weight, because underweight women are at risk for insufficient weight gain during pregnancy. Low birth weight is detrimental to growth later in childhood, as infants who are small for their gestational age are more likely to be stunted at age 10 and have lower levels of schooling and lower productivity as adults (Knops, Sneeuw, et al. 2005; Alderman and Behrman 2006). A study examining weight gain patterns in pregnant women in Central Java in Indonesia found that 17 percent of women began pregnancy underweight (BMI less than 18.5) and that 79 percent of all women showed inadequate weight gain when compared to the international recommendations for weight gain based on pre-pregnancy BMI (Winkvist, Stenlund, et al. 2002).15
An important factor contributing to maternal undernutrition, and to undernutrition more generally, is the prevalence of non-diverse diets that are insufficiently rich in protein and other nutrients (Black, Allen, et al. 2008). A study in Ghana found that mothers with low dietary diversity had a 2.3 times increased risk of having low birth weight (LBW) babies (Saaka 2012). Several studies have found that food supplementation or enhancement programs during pregnancy have increased birth weights in developing countries (Ceesay, Prentice, et al. 1997; Rasmussen and Habicht 2010; Mora, de Paredes, et al. 1979). For example, Ceesay (1997) found that a daily supplement of high-energy groundnut biscuits for 20 weeks leading up to delivery for pregnant women in Ghana increased birth weight by 136g and reduced infant mortality in the first week of life. The Nutrition Project will primarily affect pregnant women’s diets through the MIYCF training, which instructs service providers on improved nutrition counseling for pregnant and breastfeeding women, emphasizing adequate and nutrient rich diets and micronutrient provision.
Breastfeeding. WHO and UNICEF recommend breastfeeding as the best way to provide infants with nutrients needed to develop, and to reduce the risk of mortality from infectious diseases. They recommend breastfeeding within one hour of birth, without any supplements or water for the first 6 months (EBF), and the gradual introduction of safe complementary foods from 6 months to 2 years of age (WHO 2014; UNICEF 2014. In a review of literature on the optimal duration of breastfeeding, Kramer and Kakuma (2002) concluded that one of the greatest benefits of EBF through 6 months is a reduction in gastrointestinal diseases, such as diarrhea, from the intake of contaminated liquids or foods. Breastfeeding is very common in Indonesia, as 96 percent of children under age 2 are breastfed at some time (DHS 2013). However, most infants are not breastfed in accordance with the WHO and
15 The United States National Institutes of Health has set guidelines for weight gain and rate of weight gain
during pregnancy. Women with low pre-pregnancy BMI should gain 13–18 kgs during their pregnancy, whereas women with average pre-pregnancy BMI should gain 11–16 kgs. See http://www.ncbi.nlm.nih.gov/pmc/articles/ PMC2847829/table/T1/.
MCC INDONESIA NUTRITION PROJECT IMPACT EVALUATION DESIGN REPORT MATHEMATICA POLICY RESEARCH
11
UNICEF guidelines. Only 49 percent of infants were breastfed within an hour of birth, and the median duration of EBF is only 0.7 months (DHS 2013).16
Many studies have found that breastfeeding promotion interventions, through community-based peer counselors and incentive-based and partner-supported education programs have increased the prevalence of EBF in developing countries (Haider, Ashworth, et al. 2000; Kramer, Chalmers, et al. 2001; Davies-Adetugbo 1996). However, there is less evidence that these increases translate into measurable improvements in child health. Bhandari, Bahl, et al. (2003) evaluated a breastfeeding counseling intervention in India and found a 31 percentage point increase in EBF prevalence, a decrease in the seven-day diarrhea prevalence, but no difference in wasting or stunting.
Complementary feeding. Nutritional counseling for parents as part of the counseling sessions offered through Generasi (kelas balita) and through infant checkups with puskesmas staff, kader posyandu, or bidan is included in the Nutrition Project, with the intention of promoting awareness about the benefits of appropriate complementary feeding. The WHO and UNICEF recommend initiating semisolid food at 6 months and continuing breastfeeding until at least age 2, because after 6 months, a child’s energy and nutrient requirements cannot be met by breast milk alone (WHO 2014; UNICEF 2013; Horta, Bahl, et al. 2007). The prevalence of undernutrition increases in children aged 6–18 months, after which there is little additional change, indicating that this is a particularly vulnerable period for nutritional status (Michaelsen 2000; Victora, Adair, et al. 2010). A review of the literature found that appropriate complementary feeding is more strongly associated with reduced childhood stunting and has larger effects on it compared to appropriate breastfeeding (Black, Victora, et al. 2013).
In Indonesia, 90 percent of children aged 6–8 months are fed solid or semisolid food, however, the low prevalence of EBF suggests that initiation of complementary feeding is taking place earlier than recommended. In addition, only 37 percent of children 6–23 months old were fed appropriately based on WHO recommendations for best feeding practices for infants and young children, indicating that these children need more and better quality food (DHS 2013).17
Although Generasi funds may be used to purchase food supplements for households, the main project activity that will affect complementary feeding practices is the MIYCF training (and subsequent delivery of MIYCF training messages by puskesmas staff, bidan, kader posyandu, and kader desa). A meta-analysis of complementary feeding education programs for families found that such programs increased height-for-age z-scores in food secure areas (areas in which “all people at all times have access to sufficient, safe, nutritious food to maintain a healthy and active life,” [WHO 2014b]). In food insecure populations, the meta-
16 DHS (2013) defines EBF as no liquids or solids other than breast milk. The median duration of predominant
breastfeeding (either EBF or received breast milk and plain water, and/or non-milk liquids only) is 1.8 months, while the median duration for any breastfeeding is 21.4 months.
17 For children 6–23 months who are continuing to breastfeed, the minimum practices are defined as a minimum of two feedings of solid or semisolid foods per day for infants 6–8 months and three feedings for children 9–23 months, and consumption of solid or semisolid foods from a minimum of three food groups per day (DHS 2013).
MCC INDONESIA NUTRITION PROJECT IMPACT EVALUATION DESIGN REPORT MATHEMATICA POLICY RESEARCH
12
analysis found increases in height-for-age only when the education was paired with food supplement provisions (Bhutta, Ahmed et al. 2008). Ruel, Habicht, et al. (1992) and Penny, Creed-Kanashiro et al. (2005) have further shown in studies from Peru and Lesotho that nutrition education initiatives alone are not enough to reduce stunting for poorer households without access to a minimum level of resources. We will learn more about the extent to which households in the evaluation provinces face food insecurity through the baseline survey.
In Indonesia, Block (2004) conducted a study of how mothers’ knowledge about nutrition—which the MIYCF training seeks to improve—is related to spending on food. He found that these women allocated the same amount of their household budget to food regardless of their knowledge of nutrition; however, mothers with greater knowledge of nutrition allocated substantially larger portions of those budgets to micronutrient rich foods and less on staples such as rice. Though schooling levels partially explained these differences, the study found that additional sources of nutrition education such as the posyandu were also important to building the mother’s nutritional knowledge.
Micronutrient provision. Under the Nutrition Project, bidan and posyandu and puskesmas staff will distribute micronutrient sachets for children age 6–23 months. Many micronutrients, including iron, vitamin A, and zinc are required for adequate child health and growth (Black, Allen, et al. 2008). Globally, 45 percent of children aged 0–5 years are anemic, and 60 percent of anemia cases are due to iron deficiency (Thompson and Amoroso 2011; Black, Allen, et al. 2008). 18 Iron-deficient anemia impairs physical and cognitive development in children and increases the risk of morbidity (WHO 2014). Vitamin A deficiency is associated with night blindness in children, and in 2011, approximately 157,000 child deaths were attributable to vitamin A deficiency (Black, Victora, et al. 2013). As discussed below, zinc is key to preventing and treating diarrhea, and about 17 percent of the world population has inadequate zinc intake (Black, Allen, et al. 2008). Meta-analyses of studies separately dispersing iron, vitamin A, and zinc have respectively found reduced rates of anemia, reduced childhood mortality, and/or reduced prevalence of diarrhea (Bhutta, Ahmed, et al. 2008). A growing literature documents how nutrition influences cognitive development, especially in the early years of life (Nyaradi, Jianghong, et al. 2013), but because micronutrients can interact with one another in both synergistic and antagonistic ways, evidence on the effects of single nutrient interventions on cognitive development do not necessarily apply for multiple micronutrient supplementation. Several recent meta-analyses have found the literature on multiple micronutrient supplementation in young children to be quite sparse, with no clear conclusions for effects on cognitive development (Eilander, Gera, et al. 2010; Christian and Tielsch 2012; Ramakrishnan, Goldenberg, and Allen 2011). This reflects a lack of evidence, rather than a strong case that multiple micronutrient supplementation does not affect cognitive development, and indeed, at least one trial has found impacts of combined iron and zinc supplementation on aspects of cognitive development among infants (Black, Baqui, et al. 2004).
18 Anemia is a condition in which one has insufficient red blood cells or the cells have insufficient oxygen-
carrying capacity to meet physiologic needs. Although iron deficiency is the most common cause of anemia worldwide, other conditions such deficiencies in folate, vitamin B12, and vitamin; chronic inflammation; parasitic infections; and inherited disorders can also cause anemia (see http://www.who.int/topics/anaemia/en/)
MCC INDONESIA NUTRITION PROJECT IMPACT EVALUATION DESIGN REPORT MATHEMATICA POLICY RESEARCH
13
In the absence of nutrient-rich foods, one option for reducing micronutrient deficiencies is fortified micronutrient powders (MNP) comprising 15–16 micronutrients—mainly vitamin C, iron, zinc, vitamin B3 and vitamin E—that can be added to food served to children over 6 months old. Because a lack of dietary diversity is the root cause of most micronutrient deficiencies, these deficiencies rarely occur in isolation (de Pee, Irizarry, et al. 2013). Therefore, MNP sachets—which include a variety of micronutrients—are thought to be most effective in addressing multiple deficiencies. A meta-analysis of 17 studies on the effectiveness of MNP showed improvements in hemoglobin concentration and a 57 percent reduction in iron-deficient anemia, and a 21 percent reduction in retinol deficiency, yet no significant impact on linear growth (Salam, MacPhail et al. 2013). This lack of impact on linear growth could be due to the fact that only a few of the 17 included studies considered linear growth as an outcome and/or that many studies only measured outcomes over a one-year time horizon, potentially insufficient to affect stunting. The authors also suggest that MNP are potentially a necessary but insufficient factor in improving child growth—that complementary feeding and overall improved food habits might also be needed. A study that administered MNP to children in refugee camps found a positive impact of MNP on stunting in a context where food rations were already being distributed, with a 5 percentage point and a 16 percentage point decrease in stunting in Kenya and Nepal, respectively (Rah, de Pee, et al. 2012). However, the authors note the study lacked a proper comparison group, so other time-varying factors such as food consumption and implementation of other interventions may have influenced these results. Regardless, the authors suggest that MNP do have the potential to reduce stunting, at least in certain contexts.
Although there are few studies on side effects of micronutrients, some have shown potentially negative effects on diarrhea episodes, likely attributable to the inclusion of iron in the mix of micronutrients. For example, Soofi, Cousens et al. (2013) conducted a large-scale trial of micronutrients (containing iron) with and without zinc in Pakistan. In both treatments, relative to a control group they found significant improvements in iron-deficient anemia and height, but also an increase of 0.08 episodes of diarrhea per child year, the equivalent of one additional episode of bloody diarrhea for every 12-13 children treated. Similarly, in a meta analysis of 28 iron supplementation trials, Gera and Sachdev (2002) showed a increase of 0.05 episodes of diarrhea per child year. The magnitude of these negative effects were relatively small (Gera and Sachdev call them “not programmatically relevant”). Nevertheless, this evidence suggests that the negative diarrhea effects of micronutrients containing iron could potentially occur in other settings and thus a program may merit piloting and testing to screen for these effects in a particular population. Iron supplementation in malaria endemic areas has been shown to increase mortality and hospitalization (Sazawal et al. 2006). A more recent study from a malaria endemic setting showed that provision of a micronutrient powder containing iron did not lead to an increased incidence of malaria relative to a micronutrient power without iron when all children were also provided insecticide-treated bed nets, although the children who were receiving the powder containing iron were more likely to be hospitalized (Zlotkin , Newton et al. 2013). The WHO recommends the intermittent use of multiple micronutrient powders (once per day for two months followed by three to four months of no supplementation) for children 6 to 23 months of age as a public health intervention to improve iron status and reduce the risk of anemia when the prevalence is 20% or higher, so long as provision of iron supplements is implemented in conjunction with measures to prevent, diagnose, and treat malaria in endemic areas (WHO 2011).
MCC INDONESIA NUTRITION PROJECT IMPACT EVALUATION DESIGN REPORT MATHEMATICA POLICY RESEARCH
14
As discussed below, frequent and severe diarrhea is one factor that contributes to stunting (Guerrant, Moore, et al. 1999). One key micronutrient relevant to the Nutrition Project is zinc, which has been proven to relieve the severity and duration of persistent cases of diarrhea among children (Khan and Sellen 2011). For example, zinc supplementation reduced diarrhea-related child mortality by 49 percent in Bangladesh (Baqui, Black, et al. 2002) and by 23 percent in a review of multiple programs in several countries (Walker and Black 2010). A review of MNP programs concluded that when MNP does affect stunting, it is primarily due to the zinc content (de Pee, Bloem, et al. 2013), although there is no evidence to suggest that zinc reduces diarrhea when taken in combination with other micronutrients, particularly iron. Moreover, although zinc is one of the micronutrients in Taburia sachets available to children under the Nutrition Project, its quantity is likely insufficient to effectively treat diarrhea.19 Although Taburia might be insufficient to treat diarrhea, zinc and oral rehydration salts are available from the puskesmas to treat diarrhea, and it is possible that the provision of these remedies could be expanded through the MIYCF training.
The literature also discusses lessons learned from MNP programs and how to most effectively distribute MNP and ensure regular consumption. Because MNP are used preventatively and require regular use over a long period of time to be effective, continued adherence is a key challenge to MNP provision. That is, children must actually consume the multiple micronutrients they have received. It is therefore recommended that MNP provision programs have a behavior change communication strategy in place to help promote the use of the sachets in a way that can be easily understood. Providing multiple micronutrients is a complicated process as it involves buy-in from various stakeholders including the Ministry of Health, drug supply companies, pharmacologists and supply chain specialists, technical guidelines for packaging and marketing the MNP, and regular monitoring to oversee its adherence (Rah, de Pee, et al. 2012). Recommendations from MNP programs in Mongolia and Kyrgyzstan include ensuring partnerships among key stakeholders, integrating MNP provision with existing child health initiatives, and developing a simple monitoring system (Vanchinkhuu, Norov, et al. 2013; Lundeen, Imanalieva, et al. 2013).
In addition to Taburia for children, the Nutrition Project will provide micronutrients to pregnant mothers in the form of iron folic acid (IFA) to reduce maternal anemia. Pregnant women stand at risk of anemia due to the increase in bodily demand for iron during pregnancy (Black, Allen, et al. 2008). Anemia during pregnancy is associated with 40 percent of all perinatal deaths (defined as stillbirths and deaths in the first week of life), and infants born to such mothers have one-half of the normal iron reserves, which can lead to iron-deficient anemia in the child (WHO 2011). There is also substantial evidence correlating maternal iron deficiency during pregnancy with low birth weight, partially due to the increased likelihood of preterm birth (Allen 2000; Black, Allen, et al. 2008; Rasmussen 2001); as discussed earlier, low birth weight is a major risk factor for stunting (Knops, Sneeuw, et al. 2005). A meta-analysis of studies examining the preventative effect of iron supplementation during pregnancy found that iron supplements reduced the incidence of LBW babies by 20 percent (Imdad and Bhutta 2012). IFA supplementation has also been found to have other positive maternal and child health outcomes,
19 To treat acute childhood diarrhea, the WHO and UNICEF recommend 20 mg of zinc supplementation daily
for 10–14 days, or 10 mg daily for children under 6 months (Khan and Sellen 2011). Taburia sachets contain 5 mg of zinc.
MCC INDONESIA NUTRITION PROJECT IMPACT EVALUATION DESIGN REPORT MATHEMATICA POLICY RESEARCH
15
including reduced maternal mortality, reduced neonatal mortality, improved maternal mental health, and reduced maternal fatigue (Black, Victora, et al. 2013; Stoltzfus, Mullany et al. 2004; Imdad and Bhutta 2012; Beard, Hendricks, et al. 2005).
Although the Nutrition Project is only providing IFA for pregnant women, there is a body of literature on the benefits of micronutrients beyond IFA for these women. Many women experience multiple micronutrient deficiencies—such as vitamin A, zinc, iodine, calcium, and vitamin D—that may not be treated sufficiently with IFA alone, but that can be treated with multiple-micronutrients powders (Black, Victora, et al. 2013). Several studies have compared multiple-micronutrient supplements (MMS) to IFA supplementation. For example a meta-analysis of 21 trials showed that MMS significantly decreased low birth weight and small-for-gestational-age babies (weight below the 10th percentile for the gestational age), whereas IFA only affected anemia and iron-deficient anemia (Haider and Bhutta 2012). In Bangladesh, the multiple micronutrients significantly reduced preterm births relative to IFA (West, Shamim et al. 2013), and in Indonesia, Shankar, Jahari, et al. (2008) showed that 90-day infant mortality was reduced by 18 percent more with MMS than with IFA alone, suggesting that providing MMS may be important to improving maternal health. Maternal MMS, as compared to IFA, also enhanced maternal cognitive performance during and after delivery, and improved preschool cognitive performance at 3.5 years of age (Prado, Alcock, et al. 2012; Prado, Ullman, et al. 2012).
Water and sanitation. Diarrhea among children is a significant contributor to undernutrition, not only because children who suffer from diarrhea generally eat less, but also because diarrhea diminishes nutrient absorption in the body (Guerrant, Moore, et al. 1999). A multi- developing country meta-analysis demonstrates that greater diarrhea prevalence below the age of 24 months was associated with higher rates of stunting at age 24 months (Checkley, Buckley, et al. 2008). In the Nutrition Project study provinces, about 12 percent of children under age 5 in South Sumatra, 19 percent in Central Kalimantan, and 24 percent in West Kalimantan had diarrhea in the two weeks prior to being surveyed (DHS 2013).
Recently, nutritionists have hypothesized that poor sanitation might also cause an inflammatory disorder of the intestines called environmental enteropathy, thereby indirectly contributing to the burden of stunting by compromising children’s ability to absorb nutrients (Humphrey 2009; McKay, Gaudier, et al. 2010). A cross-sectional study of Bangladeshi children growing up in households with and without access to clean water and sanitary and hand-washing infrastructure is consistent with this hypothesis (Lin, Arnold et al. 2013). Several studies have found that at least a third of the stunting differences between India and sub-Saharan Africa can be attributed to open defecation (Spears 2013; Jayachandran and Pande 2013). The Nutrition Project therefore focuses directly on this domain in training the puskesmas sanitarians and village kader and providing funding to communities to improve sanitation and hygiene practices, targeted at the CLTS model, which primarily focuses on stopping open defecation.
A randomized evaluation of the Total Sanitation and Sanitation Marketing program, which combined the CLTS model with social marketing of sanitation in East Java in Indonesia, demonstrated a 30 percent decrease in the seven-day prevalence of diarrhea, with effects most pronounced among children between ages 2 and 5. The prevalence of open defecation decreased by 17 percent, with the largest decreases occurring in communities that had no sanitation
MCC INDONESIA NUTRITION PROJECT IMPACT EVALUATION DESIGN REPORT MATHEMATICA POLICY RESEARCH
16
infrastructure at the baseline (Cameron, Shah, et al. 2013). Although the program enhanced awareness about general sanitation and hygiene among beneficiaries, a separate implementation study of the same program noted several continuing knowledge gaps, notably that 45 percent of the respondents were unaware of problems associated with defecating in a river (Amin, Rangarajan, et al. 2011). This study also found that some communities were more successful than others in reducing open defecation, with the less successful characterized by limited resources, lower levels of commitment, and closer proximity to a river. Both studies found that open defecation free (ODF) communities had significantly higher access to latrines and that cost was the biggest obstacle to building latrines. Findings from a similar large-scale Total Sanitation Program in India concluded that providing local community leaders a monetary incentive to ensure that their community became ODF improved sanitation, resulting in decreased infant mortality among children less than 1 year old, and increased the height of children under 5 by 0.2 standard deviations (Spears 2012).
Health provider incentives. The Nutrition Project includes a health provider incentive activity that is still being designed; here we discuss several examples of incentive-based interventions that have successfully improved child health outcomes. These interventions are designed on the premise that even when health providers have adequate training, health service quality can suffer due to low provider effort, which is often characterized by frequent absenteeism and a gap between what providers know in principle and what they do in practice (Chaudhury and Hammer 2003; Das and Hammer 2004). As a result, pay-for-performance incentives for health service providers in low- and middle-income countries are one increasingly popular way to improve provider quality and combat low provider effort (Miller and Babiarz 2013).
Although most programs are structured to tie monetary incentives for facility-based health workers to a set of prescribed health services or inputs such as number of provider visits or immunizations rather than outcomes such as incidence of disease or stunting prevalence, several studies have found positive impacts on child nutrition outcomes. For example, one study in Rwanda examined an incentive program that rewarded providers for providing a number of services, including prenatal care visits, immunizations for pregnant women and children, and HIV testing (Gertler, Vermeersch, et al. 2012). Though health outcomes were not directly tied to the incentive, the evaluation found infant weight-for-age rose by 0.53 standard deviations and child (ages 2–4) height-for-age rose by 0.25 standard deviations (Gertler, Vermeersch, et al. 2012). Similarly, Peabody, Shimkhada, et al. (2013) evaluated a pay-for-performance scheme for community district hospitals in the Philippines that gave bonuses to physicians if they correctly answered questions after reading clinical vignettes. They found the scheme was associated with a 9 percent reduction in wasting in children under age 5. Although these studies are promising, provider incentive programs have occasionally produced unintended consequences—for example, the diversion of provider effort from non-incentivized activities, or the neglect of the sickest or most remote populations that have significant costs associated with treatment (Miller and Babiarz 2013).
Communication campaign. The Nutrition Project will include a communication campaign across the 11 Project provinces to reinforce the best practices detailed under the supply-side activities section, with the intention of spurring behavior change. In a review of nutrition communication campaigns in developing and developed countries, Snyder (2007) found that the
MCC INDONESIA NUTRITION PROJECT IMPACT EVALUATION DESIGN REPORT MATHEMATICA POLICY RESEARCH
17
most successful campaigns in prompting behavior change have focused on fruit and vegetable consumption, fat intake, and breastfeeding. A review of five international breastfeeding communications campaigns found an average 18 percentage point increase in breastfeeding (Snyder 2007). There is also evidence that nutrition campaigns can be successful in the Indonesian context. A social marketing campaign in Central Java promoting eggs and dark green leafy vegetables to combat vitamin A deficiency resulted in an 11 percent increase in vitamin A intake for mothers and a 23 percent for children 12–36 months old (de Pee, Bloem, et al. 1998).
Communication campaigns focusing on sanitation best practices have had more mixed success, largely dependent on implementation of the campaign. A study of the sanitation marketing component of the Total Sanitation and Sanitation Marketing (TSSM) program in Indonesia, which included both sanitation marketing and CLTS, found it had limited success due to implementation challenges, including a delayed rollout, poor targeting, insufficient budgets, and weak dissemination networks (Amin, Rangarajan, et al. 2011). Studies on hand washing and hygiene campaigns in India, Ghana, and Thailand have found an increased knowledge from these campaigns, but saw mixed results on translating that knowledge into behavior (Biran, Schmidt, et al. 2009; Scott, Schmidt, et al. 2008; Pinfold 1999).
E. Gaps in the literature
In this section we discuss some outstanding questions and gaps in the literature by activity, mirroring the structure used above on the literature related to various activities that MCC is supporting through the Nutrition Project.
Generasi/CDD. Within the CDD literature, the main gap is evidence on CDD projects’ effects on nutrition. The general CDD literature is vast—see Wong (2012) and Mansuri and Rao (2013) for reviews—and Indonesia’s long history of CDD architecture also provides a rich picture of CDD successes and challenges across the country (Olken, Onishi et al. 2012; Voss 2008; Barron, Humphreys et al. 2009; Pradhan, Rao et al. 2010 ; McLaughlin, Satu et al. 2007). However, the main focus of CDD projects has been funding small infrastructure with the goal of longer-run poverty alleviation rather than explicitly improving nutrition outcomes, with the exception of those projects discussed above, most notably Generasi.
Thus, a gap in the literature is whether and how CDD projects can be an effective mechanism for reducing child undernutrition. For Generasi specifically, which had a nutrition objective but limited impacts on stunting and other nutrition-related outcomes, an unresolved question is how the project can be enhanced to better focus efforts on reducing stunting, the topic of the Grayman, Anggraini et al. (2014) qualitative report. We hope this gap can be filled through this evaluation and others, such as research work by PSF, as Generasi’s implementation expands and Generasi is supported by other nutrition-focused activities such as those under the Nutrition Project.
MIYCF training. There are four main gaps in the literature relevant to MIYCF training activity: (1) whether it is effective at changing health worker knowledge; (2) whether health workers can easily apply that knowledge; (3) whether that application leads to improved outcomes; and (4) what are effective tools and processes for scalability.
MCC INDONESIA NUTRITION PROJECT IMPACT EVALUATION DESIGN REPORT MATHEMATICA POLICY RESEARCH
18
These gaps are directly relevant to the potential effectiveness of the MIYCF trainings under the Nutrition Project. First, MCA-I and MCC have adopted a cascade model in which five different groups of health practitioners—from the Ministry of Health (Kemenkes) officials to the kader posyandu, kader desa, and bidan—are supposed to pass knowledge to the next level. There is limited information from the literature on whether this is the best information delivery mechanism, and this structure raises the concern that the training content could be diluted through various levels. Second, the MIYCF training component assumes that a key barrier to achieving improved maternal and child health is service provider knowledge. But even if knowledge improves, there could be barriers to service providers applying knowledge, such as availability of transportation, low salary, high patient loads, and/or poor facilities. These factors raise concerns around whether training provision alone is adequate to lead to behavior change on the part of the service providers, or whether providers need further incentives or support. Third, another question in the literature is the extent to which improvements in service provider knowledge lead to improved maternal and child health outcomes. Even if service providers apply their own knowledge and change behavior, there are many other factors that could limit improved outcomes, such as pregnant women and caregivers’ limited receptivity to new information or services, service access, affordability, and so on. Finally, even if outcomes are found to improve, the question remains of how to maintain these improvements.
Micronutrients. The literature on micronutrients has gaps that are common to both pregnant women and children, and gaps that differ between the two populations. Ensuring compliance – meaning that the intended beneficiaries take the proper dose of MNP and with appropriate frequency is a challenge common to both populations (Rah, de Pee et al. 2012, De-Regil, Suchdev et al. 2013, Zlotkin, Schauer et al. 2005), and we have learned anecdotally that Taburia take-up and compliance are problems in Indonesia.20 For pregnant women, a 2009 study in Lombok, Indonesia, looked at the efficacy of compliance with MMS for pregnant women, and found an 85 percent compliance rate due to frequent follow-ups by community facilitators, usually twice a month, and encouragement of women by facilitators to participate in posyandu activities (Shankar, Jahari et al. 2008). Thus one major gap—assuming that effective MMS programs require frequent contact and coaching—is identifying the most effective implementation mechanism for such programs. However, to our knowledge there have been no studies looking solely at the most effective ways to ensure MNP use with children. More information is needed on how to improve regular compliance in both populations.
The second gap relates to efficacy. For children, there is strong evidence, as described above, that MNP can affect iron-deficiency anemia. However, further research is needed about the benefits of micronutrients on longer-term outcomes related to child undernutrition.
Growth monitoring. There is little dispute about the benefits of growth measurement in identifying undernutrition, but the issue is how this translates into treatment. If children are weighed and measured regularly at the posyandu or puskesmas (as is policy but not uniformly practiced in Indonesia) and deemed underweight or insufficiently tall/long, the challenge becomes ensuring that the child receives appropriate follow-up and treatment, because the child will likely need nutritional counseling, supplements, and frequent checkups. George, Latham, et al. (1993) evaluated a health and nutrition education intervention in India in which half of the
20 This topic arose during the evaluation team’s site visit to a posyandu in Palembang in January 2014.
MCC INDONESIA NUTRITION PROJECT IMPACT EVALUATION DESIGN REPORT MATHEMATICA POLICY RESEARCH
19
recipients received nutrition education with growth charts, and found no difference in the nutrition outcomes between those who received the charts and those that did not. This suggests that although parents might have known there was a problem, they perhaps needed health workers’ support to address it. Treatment also depends a great deal on the motivation of health workers and what types of follow-up they do; however, the best way to encourage appropriate follow-up is still an unanswered question (see the health provider incentives discussion below).
Sanitation and hygiene. As mentioned above, CLTS has been rigorously tested in East Java Indonesia, and has been promoted widely by the GoI (Cameron, Shah, et al. 2013). However, there are three gaps related to this study and approach. First, the East Java evaluation compared CLTS against a pure control group rather than an alternative program, so an outstanding gap is whether CLTS is the most effective method for ensuring that communities are ODF. Second, there is a question about context: whether CLTS could be effective in Sumatra or Kalimantan, areas poorer and geographically quite different than East Java. Given that compliance rates varied wildly lot across CLTS sites even within one province, we know that the program worked substantially better in some areas compared to others, which begs the question of why the results differed. Third, irrespective of the approach to promoting sanitation, a key limitation in achieving open defecation targets was the affordability of private latrines. Thus an unanswered question is: what is the most effective way of increasing affordability and access, especially in the absence of funding for private latrines?
Health provider incentives. Although there have been several studies on provider incentives in health and other fields, these have largely focused on health workers achieving outputs, such as clinical visits or attendance, rather than health outcomes, such as stunting or morbidity. The assumption is that the outputs lead to improved outcomes, but this is naturally not always the case. Therefore, an outstanding question in the literature is how to improve program design so as to better focus resources on achieving improved health outcomes.
This page left blank for double sided copying.
MCC INDONESIA NUTRITION PROJECT IMPACT EVALUATION DESIGN REPORT MATHEMATICA POLICY RESEARCH
21
II. NUTRITION PROJECT INDICATORS AND OUTCOMES
The Nutrition Project’s demand and supply-side activities described in Chapter I are designed to improve a range of health and nutrition outcomes for mothers and children. In this chapter, we describe the key short- and medium-term indicators we propose to use to measure the project’s impacts, and give an overview of the Economic Rate of Return (ERR) model used to estimate the project’s costs and benefits. Note that there have been significant updates to indicators since the report was written in 2014. See Annex B for updates.
A. Key indicators, including outputs and outcomes
MCC and MCA-I developed the project logic displayed in Figure II.1, which shows the hypothesized relationship between the Project’s activities, outcomes, and the ultimate goal of reduced poverty through economic growth. MCC anticipates that the Project activities will lead to service providers’ improved ability to prevent, diagnose, and treat undernutrition; improved feeding and sanitation practices in households; and greater community and government awareness around nutrition. These short-term outcomes, along with the direct provision of micronutrient supplements, will lead to improved nutrition among pregnant women and children, reducing the prevalence of stunting, wasting, and underweight.
As described in Chapter III, the impact evaluation of the nutrition project will seek to provide rigorous evidence on the impacts of the project on both short- and medium-term outcomes (with long-run outcomes being for example labor force participation and earnings). Indicators discussed below are derived from the project logic, and measurable steps between various outputs and outcomes in the project logic.
In Table II.1, we list illustrative, key short-term indicators that we hope to capture in the evaluation, specific to each of the project’s activities.21 Additional indicators are included in the questionnaires, though not included in this report. Data on these indicators will provide evidence on how each of the project’s activities is implemented. We understand that many of the short-term indicators related to Generasi will be collected more frequently through project monitoring in project areas, but we also intend to collect them through the surveys designed for the impact evaluation to enable us to demonstrate progress in project areas compared to non-project areas.
21 We do not address the service provider incentives activity, because the current plan is that this will be piloted
in just one district, nor do we address the private sector activity, because this will be rolled out in year three of the Compact and is still under design. We recognize that these implementation plans may change after this report is written. If that is the case, we will adjust the evaluation design to accommodate these revised activities. In addition, we do not explicitly describe indicators for the communications activity, because it incorporates many of the indicators for other activities, such as household and health service provider knowledge of feeding practices, household knowledge of sanitation practices, and household feeding and sanitation practices.
MCC INDONESIA NUTRITION PROJECT IMPACT EVALUATION DESIGN REPORT MATHEMATICA POLICY RESEARCH
22
Figure II.1. Nutrition project activities are intended to reduce stunting, wasting, and underweight and ultimately reduce poverty through economic growth
Source: MCC
Although the project’s intended beneficiaries include all pregnant women and children up to age 5, we mainly focus on measurement of key indicators for pregnant women in their second and third trimesters and children under age 3. As we describe in detail in Chapter III, this sample is appropriate because most of the project activities focus on pregnant women and children up to age 2, and extending the child sample to age 3 enables us to measure impacts for a cohort of children with full exposure (1,000 days) to project activities. As discussed further in Chapter IV, the survey firm will collect data on these indicators using separate survey modules: one for pregnant women, and another administered to the primary caregiver(s) of children 0–35 months. These two modules will be accompanied by a household module administered to all households. In addition to the household survey, community level surveys at the puskesmas and desa levels will capture for example desa and puskesmas capacity and health care use and access. We will disaggregate all indicators by relevant subgroup, such as gender, where appropriate.
MCC INDONESIA NUTRITION PROJECT IMPACT EVALUATION DESIGN REPORT MATHEMATICA POLICY RESEARCH
Generasi Percentage of households participating in various volunteer, social, or civic groups (measure of community engagement)
Percentage of households participating in Generasi activities (project areas only)
Percentage of pregnant women who have completed four prenatal care visits (analyze average number of visits and distribution of visits)
Percentage of pregnant women who received the appropriate number 450 mg of iron folic acid supplements
Percentage of women whose delivery was assisted by trained professional
Percentage of women who have attended three postnatal care visits (analyze average number of visits and distribution of visits)
Percentage of children who are fully vaccinateda
Percentage of children receiving one or more vitamin A supplements in the past six monthsb
Percentage of eligible individuals who attended kelas balita and kelas ibu hamil
All households (both households with pregnant women and caregivers of children 0–35 months)
All households
Mothers of children 0–35 months
Pregnant women, in 2nd and 3rd trimesters
Mothers of children 0–35 months
Mothers of children 6 weeks–35 months
Children 12–35 months
Children 12–35 months
All households
MIYCF training Puskesmas and desa staff knowledge of health and nutrition lessons covered in the training
Service utilization by pregnant women and caregivers (by provider type, frequency and cost)
Household knowledge of feeding best practices, including EBF, complementary feeding and supplementation use
Mother and child feeding practices
Percentage of children 0–5 months who are EBFc
Percentage of children who were EBF for 6 monthsd
Percentage of children who visited posyandu in the last 3 months
Precentage of children who visited puskesmas in last 6 months
Puskesmas capacity and facility inventory
Puskesmas staff, kader posyandu, bidan, kader desa
All households
All households
Pregnant women and caregivers of children 0–35 months
Mothers of children 0–5 months
Mothers of children 6–23 months
Children 0–35 months
Children 0–35 months
Puskesmas
Growth monitoring training and anthropometric kits
Rates of length taking (use data from buku KIA/KMS and ask caregiver if buku KIA/KMS not available)e
Rates of weight taking (use data from buku KIA/KMS and ask mother if not available)e
Identified cases of severe wasting that are being treated compared to population in the kecamatan
Children 0–35 months
Children 0–35 months
Puskesmas
MCC INDONESIA NUTRITION PROJECT IMPACT EVALUATION DESIGN REPORT MATHEMATICA POLICY RESEARCH
Table II.1 (continued)
24
Activity Indicator Sample
Micronutrient distribution
Percentage of children taking appropriate dose of micronutrient supplements
Use of supplements (type, frequency, etc.)
Children 6–35 months
Caregivers of children 6–35 months
Sanitation training
Sanitarian and kader desa knowledge of sanitation and hygiene practices
Sanitation triggering events
Household knowledge of sanitation and hygiene best practices
Household sanitation and hygiene practices
Location and source of drinking water
Environmental variables (presence and condition of sanitation and hygiene infrastructure, etc.)
Sanitarians, kader desa
Sanitarians, kader desa
Household
Household
Household
Household
Crosscutting Participation in National Health Insurance (Jaminan Kesehatan Nasional) or other health insurance plans
Household decision-making dynamics around food and health care
Household
Household
aVaccination is meant to be completed by age 9 months, but we will focus on children 12 months and older to allow for possible delays in vaccination. bChildren receive vitamin A up until age 5 years, but the sample only covers children until age 3 years. cThis measure of EBF follows the protocol recommended by the WHO, namely asking caregivers of children under six months what the child was fed in the last 24 hours and defining EBF children as those who were not fed water or other liquids or solids. This provides a measure of young children who are currently EBF. dThis alternative measure of EBF involves asking caregivers of children over six months a few questions about whether or not the child was fed anything other than breast milk during the first six months. This provides a measure of whether the recommended duration of EBF (six months) was followed. We recommend focusing on a sample of children aged 6–23 months only for this measure, because we are concerned about mothers’ recall accuracy with older children. eBuku KIA/KMS (buku kesehatan ibu dan anak/kartu menuju sehat) are books used for maternal and young child health checkups to track pregnancy progress and child growth (weight and height).
In addition to these short-term indicators, we recommend collecting data on medium-term maternal and child health outcomes. Table II.2 describes primary medium-term outcome indicators, the prevalence of these indicators from the 2007 Indonesian Family Life Survey (IFLS) and the 2010 Riskesdas, and recommended sample populations for each indicator.22 Below, we define each indicator, discuss some considerations for measurement, and provide the reasons for our recommendations related to the sample population for the indicator. We focus primarily on indicators that are key benchmarks of project progress and that are important in MCC’s ERR calculations. These indicators and those relevant for the ERR analysis have been updated since the report was written. See Annex B for the updated version of Table II.2.
22 IFLS data is are available from the RAND Corporation at:
http://www.rand.org/labor/FLS/IFLS/access2.html. It is possible that prevalence rates in the three impact evaluation provinces are different from these national prevalence rates because of location and the time that has passed since these surveys were conducted. We will report updated baseline rates based on the 2014 baseline data (described in Chapter IV).
MCC INDONESIA NUTRITION PROJECT IMPACT EVALUATION DESIGN REPORT MATHEMATICA POLICY RESEARCH
Infant/toddler anemia (hemoglobin concentration of less than 11 g/dL for children over 6 months for IFLS; age 1-4 years for Riskesdas)
38 28 N/A Children 6–35 months
Children with diarrhea in the last four weeks
17 N/A N/A Children 0–35 months
Children with diarrhea in the last two weeks (under 5)
N/A N/A 14 [18] Children 0–35 months
Children with diarrhea in the last week
N/A N/A N/A Children 0–35 months
Percentage of children who are low birth weight (<2.5 kg)
7 11 [15] 7 [7] Children 0–35 months
Low maternal BMI (<18.5 kg/m2), chronically energy deficient
12 N/A N/A Pregnant women in 2nd and 3rd trimesters
Maternal anemia (hemoglobin concentration of less than 11 g/dL)
46 N/A N/A Pregnant women in 2nd and 3rd trimester and mothers of children 0-5 months
Notes: N/A = not available. Prevalence from IFLS is for the 0-35 month age group. Prevalence from Riskesdas is for children under 5. Riskesdas numbers for the three evaluation provinces are a simple unweighted average across these provinces. Riskesdas data are available by age group and thus we could construct comparable prevalence for the 0-35 group, but not by province.
Stunting, wasting, underweight. As mentioned in Chapter I, the three standard indicators of undernutrition in children are whether the child is stunted (low height-for-age), wasted (low weight-for-height), or underweight (low weight-for-age). All of these indicators are measured by using a child’s height and/or weight and comparing to a healthy reference population; children who fall more than two standard deviations below the reference median for a given indicator are considered undernourished by that indicator. We considered whether it was possible to measure these indicators (that is, take height/length and weight measurements) for children 0–5 months old, or whether we should restrict the sample to children 6–35 months old. The literature shows measurement is possible and reliable for 0–5 month olds, so we recommend using this full cohort.
Infant/toddler anemia. We recommend measuring child anemia as an intermediate outcome according to the project logic because it is expected to be affected by several of the
MCC INDONESIA NUTRITION PROJECT IMPACT EVALUATION DESIGN REPORT MATHEMATICA POLICY RESEARCH
26
project activities, including provision of micronutrients to children, the MIYCF training (through providers’ promotion of IFA and Taburia), and Generasi (which encourages providers to promote IFA and can supply food supplements), and because of the effects that iron-deficient anemia can have on physical and cognitive development in children, as discussed above in the literature review. The incremental cost of the test is quite low, since we also propose to measure maternal anemia as explained below, and thus MCA-I or the survey firm conducting the survey will already have purchased the equipment for this test and trained staff on the protocol. Finally, the GoI is committed to anemia control (Interagency Anemia Steering Group 2003) and results from this study will contribute to the broader effort to monitor progress toward anemia reductions. Anemia is generally defined as a hemoglobin concentration of less than 11 g/dL for children over 6 months. Measurement would require a capillary blood spot sample obtained using a pin prick instrument such as Hemocue. This method is the most advantageous for this evaluation because it is minimally invasive and can be easily conducted in a nonclinical setting (McDade, Williams, et al. 2007). Because this indicator is not defined for children under 6 months and because there is some danger, though minimal, for pin prick with newborns (as well as a risk that a coincidental adverse health event be erroneously attributed to the pin prick), we recommend focusing on children 6–35 months.
Diarrhea. Diarrhea is defined as three or more loose or watery stools in a 24 hour period, or any stool with blood (Baqui, Black, et al. 1991). We will measure diarrheal prevalence (percent of study children whose caregivers report that they experienced diarrhea) over three time frames: one week, two weeks, and four weeks. Measuring diarrhea is most accurate for recent episodes of diarrhea, but the low prevalence of this measure in the past week (we expect about 4 to 5 percent) suggests we would require a very large sample size to detect significant changes in this indicator.23 We therefore recommend capturing episodes of diarrhea in the past four weeks as a key indicator, but also asking about the prevalence in the past week and two weeks, which would likely be more accurate and would be useful for descriptive analyses (Arnold, Galliani, et al. 2013; Schmidt, Arnold, et al. 2011). Two week recall is used in many Demographic and Health Surveys, and is included in MCC’s Monitoring and Evaluation plan; one-month recall will allow comparability with IFLS. In addition to prevalence, we will also collect data on the duration of the most recent episode, the incidence (number of distinct cases) of diarrhea in the past month, and severity of diarrhea, which is indicated by blood and mucus in the stool.
Low birth weight. Low birth weight is defined as a birth weight of under 2.5 kg. We recommend obtaining birth weight retrospectively from buku KIA/KMS as it is likely to be the most reliable source of information, and through self-reports if the health card/book is not
23 The impacts we will be able to detect for a given sample size are not proportional to the prevalence rate. For
example, with a sample size that is sufficient to detect an impact of 24 percent on diarrhea in the previous 4 weeks (4 percentage points off a baseline mean of 17 percent), we will only be able to detect an impact of approximately 50 percent (2 percentage points off a baseline mean of 4 percent) on diarrhea in the previous 1 week. Therefore, a larger sample size would be required to detect the same percent change in diarrhea using the 1 week measure compared to the 4 week measure.
MCC INDONESIA NUTRITION PROJECT IMPACT EVALUATION DESIGN REPORT MATHEMATICA POLICY RESEARCH
27
available.24 We will be able to calculate both an indicator of the fraction of children who are low birth weight and average birth weight for all the children in our sample. We will also capture gestational age from the buku KIA/KMS as this indicator naturally relates to birth weight.
Maternal BMI. BMI is measured by dividing weight (in kg) by height squared (in m2); a BMI of less than 18.5 is considered low and defines the condition known as chronic energy deficiency (CED) (James, Ferro-Luzzi, et al. 1988). One challenge with the BMI indicator is that BMI standards for pregnancy do not exist because of variation in the weight of the child and maternal weight gain during pregnancy. One way to deal with this is to look at pre-pregnancy weight and classify women gaining less than 10 kg as at risk. We propose to collect pre-pregnancy or first trimester weight from the buku KIA, weighing pregnant women and estimating the weight gain during pregnancy.25 Additionally, a strongly recommended, complementary measure to BMI is MUAC. Women with a MUAC below 23 cm are at risk of having low-birth-weight babies (Ververs, Antierens, et al. 2013). MUAC is a stable measure as increases of MUAC during pregnancy are generally less than 0.05 cm, and hence the same cutoff value can be used to define undernutrition in women who are already pregnant. Thus we recommend measuring MUAC, along with maternal height and weight, and attempting to collect pre-pregnancy weight through the buku KIA/KMS or self-report. Both the maternal BMI and MUAC indicators will be considered to be maternal health outcomes.
Maternal anemia. Anemia in pregnant women is defined as a hemoglobin concentration of less than 11 g/dL. However, a low hemoglobin level does not always equate to iron deficiency, which is being directly targeted by the project through the provision of IFA supplements. A ferritin test is a more reliable measure of iron deficiency, but it requires a blood sample and refrigeration, which would be difficult to carry out in this remote setting. We therefore recommend relying on measurement of anemia, using a dried blood spot sample obtained through a pin prick instrument such as Hemocue. If MCC/MCA-I is providing iron and folic acid supplements from the beginning of the first trimester, a reduction in anemia could be measured in the second and third trimesters. In the second trimester, effects of supplementation are likely to be more pronounced, whereas in the third trimester, nutritional demands are greatest, so there is a higher chance of hemoglobin dilution and thus potentially lower observed effects. We recommend measuring maternal anemia for mothers in their second or third trimesters, which will enable us to conduct an overall analysis and subgroup analysis by trimester.
Income and assets. A key outcome of importance to MCC is income, and the MCC project logic anticipates a long-term trajectory from improvements in maternal and child health to changes in income. However, major changes in income as a result of these activities are unlikely to materialize over the life of the Compact. Nevertheless, MCC may want to analyze project impacts by income subgroup, for which we would have to measure income. There are several
24 In the analysis we will also examine whether using the combined reports yields similar results to using the
health card/book only, as the latter may be a more reliable source of information. However, we will have to be careful in interpreting the card-only results, because the intervention could affect the types of women who have one (for example, it could increase the probability that women from less advantaged households obtain one).
25 Weight gain benchmarking will only be relevant for women in their third trimester, once most of the weight gain during pregnancy has manifested.
MCC INDONESIA NUTRITION PROJECT IMPACT EVALUATION DESIGN REPORT MATHEMATICA POLICY RESEARCH
28
options often used in the literature to capture income or socioeconomic status. For example, in Indonesia, some income proxies include (1) the full Susenas26 consumption module (60+ minutes), (2) an abbreviated Susenas consumption module (~30 minutes), or (3) an asset index (could range from 5–15 minutes). Given the priority on trying to capture mother and child health and nutrition indicators, and the fact that impacts on income are not likely to materialize over the course of the Compact, we recommend minimizing investments in this area. Considering tradeoffs in terms of survey time and household burden, we therefore recommend collecting information to create an asset index.
Indicators we recommend not focusing on in the surveys. Some outcomes of interest included in the project logic—including human capital accumulation, mortality, school readiness, percentage of villages that are ODF, and school and work days missed due to illness—were considered but were ruled out in our survey and indicator planning efforts. Through discussions with MCC and MCA-I, we determined that these indicators were a lower priority in terms of measuring impacts over the time frame of the evaluation and that the additional cost of measuring them would not be justified. Data on some of these indicators (for example, mortality) will also be collected administratively.
We recommend against relying on the household survey for measures of ODF, because this type of indicator cannot be collected on a sample basis like the other indicators that we will collect in the household survey can—a full desa census is required to ensure that there is no open defecation. Instead, we could possibly calculate ODF measures if ODF status was collected as part of the desa listing for each survey round, because this will involve a census of all households in the village. However, our understanding is that the sanitation triggering will take place in a limited number of desa per kecamatan, which may not overlap with the limited number of desa in our survey sample. Therefore, our ability to analyze ODF in desa that actually received triggering would still be limited.27 We would like to work with MCC and MCA-I to determine how they might be able to collect ODF information administratively once the design of the activity is finalized. One other option is to not focus on whether a community is free of open defecation, but rather report the prevalence of open defecation in the sample, which can be done through a standard household survey. However, this figure would not be representative of households generally—just households with pregnant women and children 0-35 months.
26 Susenas is an Indonesian national socioeconomic survey fielded every other year covering over 200,000
households and administered by the census bureau or Badan Pusat Statistik (BPS).
27 We understand the design for the sanitation activity is under review, and we will revisit this issue once it is finalized.
MCC INDONESIA NUTRITION PROJECT IMPACT EVALUATION DESIGN REPORT MATHEMATICA POLICY RESEARCH
29
We are including proxies for environmental enteropathy rather than attempting to collect biological specimens because the utility of biological markers is still under debate and all of the currently-available options are very expensive and logistically taxing. Testing other environmental samples (for example drinking water supply or hand rinses) for contamination is not feasible and would not add much to the evaluation given the planned rollout of the CLTS activities in only a subset of dusun.
We also decided to not include schooling indicators because our proposed sample (described in Chapter III) includes children up to age 35 months, who are too young to be attending school. To get some sense of impacts on schooling indicators, we could use data from administrative sources, where available. For example, data on enrollment will likely be available from administrative sources. However, if MCC is still interested in indicators that are not available through administrative sources, a cost-saving strategy would be to collect such information for an additional age cohort at midline or endline only, and not at baseline (the random assignment design that we discuss in Chapter III does not strictly require baseline data on a given outcome for an impact analysis). For example, we could collect information on school readiness from an additional pre-school cohort at midline or endline. We also plan to explore the schooling effects of Generasi through qualitative work and/or special studies commissioned by MCA-I. More details on survey plans and time lines can be found in Chapters IV and V.
B. Economic rate of return and beneficiary analysis
The ERR model and beneficiary analysis were conducted by a team from Monash University in Melbourne, Australia led by Lisa Cameron, and the World Bank Indonesia (Cameron, Lorgelly, et al. 2013). In this section we summarize the Cameron et al. model. MCC uses ERR analyses to inform its decisions about where its investments have the largest potential benefits to the population in the partner country. The ERR is a comparison of the combined benefits associated with each of the project activities described above and the project’s costs.28 Mathematica will update the ERR model and analysis as part of our endline report. Details on plans for this work are in Annex B.
The benefits from each activity are computed for cohorts of children exposed to the activities over the full four-year period (2014–2018) of implementation assuming no delays, with most of the activities expected to affect children in a window spanning the in-utero period up to age 23 months.29 The ERR model assumes that two cohorts of children will have full exposure over the full window and four cohorts will have partial exposure either in the early or late part of the window. In addition, children aged 2–5 years will benefit from some activities, specifically from the activities aimed at reducing diarrhea. Children of junior secondary school age (grades 7-9) will also benefit, specifically from Generasi funds, which communities could choose
28 The ERR is expressed in percentage terms, and is technically defined as the interest rate at which discounted
net benefits are equal to the discounted net costs. The higher the ERR, the larger the increase in benefits per dollar spent.
29 As noted earlier, some of the project activities have been delayed and will only be implemented for a three-year period, starting in 2015. The current ERR model assumes four full years of implementation and therefore may overstate the benefits of the project to some extent.
MCC INDONESIA NUTRITION PROJECT IMPACT EVALUATION DESIGN REPORT MATHEMATICA POLICY RESEARCH
30
to spend on schooling. The types of benefits accruing from each activity and the affected cohorts are summarized in Table II.3.
Table II.3. The Nutrition Project has multiple benefit streams
Activity Benefit streams
Generasi Earnings gainsa: reduced undernutrition Earnings gainsa: increased schooling (13-year-olds) One-time infrastructure benefit from block grant construction projects: wages to construction workers (through Generasi)
MIYCF training Earnings gainsb: reduced neonatal mortality rate (NMR)
Micronutrient distribution and anthropometric kits
Earnings gainsb: reduced NMR from diarrhea Earnings gainsb: reduced under-5 mortality rate (U5MR) from diarrhea Earnings gainsa: reduced LBW Lifetime cost savings: reduced chronic diseases from LBW Cost savings: reduced diarrhea morbidity (0-5 year olds)
Sanitation training Earnings gainsb: reduced U5MR from diarrhea Cost savings: diarrhea morbidity (0–5 year olds)
Communications campaign Assumed to be a fraction (12.4 percent) of the effect of micronutrient and sanitation components
Note: The private sector response activity is not included in the current ERR model. aEarnings gains from increased productivity. bEarnings gains from those who would have otherwise died (including increased productivity).
Taken as a whole, the Nutrition Project has an expected ERR of 16 percent and an expected benefit-to-cost ratio of 1.90. However, the contribution of different benefit streams to the final ERR varies. The benefit streams that make the largest contributions are the productivity gains from reduced LBW and stunting, earnings generated by those who would have died due to diarrhea, and cost savings in the form of decreased health care costs from reduced diarrhea morbidity. The importance of reduced diarrhea-related morbidity and mortality implies that the intervention-level ERRs are highest for the sanitation and the micronutrient interventions, which are driving these reductions in the ERR model. These ERRs are 262 percent and 79 percent, respectively.
The beneficiary analysis complements the ERR and looks at the distribution of benefits among different groups of beneficiaries. The existing analysis looked at the benefits by income category and by gender. It projected that the project will benefit the extremely poor and poor (defined by a daily per capita income of less than $US1.25 and $US2, respectively) by $US0.83 and $US1.64 respectively for every dollar that MCC spends.
The ERR parameters that the impact evaluation might be able to update are restricted to stunting and malnutrition, those related to diarrhea incidence and prevalence, as well as the cost of diarrhea treatment. However, some updates of other parameters might also be possible using other data sources. For example, we understand that mortality data are available in the Riskesdas survey, while enrollment data may be available through Generasi or other administrative sources.
MCC INDONESIA NUTRITION PROJECT IMPACT EVALUATION DESIGN REPORT MATHEMATICA POLICY RESEARCH
31
Because the impact evaluation will provide updated estimates of a limited number of parameters in the ERR model, it will have a limited contribution to MCC’s updating of the existing ERR model and associated beneficiary analysis. For example, the impact evaluation will not be able to inform updates of the following parameters:
Mortality, due to sample size requirements.
School enrollment, due to the need to add a sample that includes an older cohort of youth.
Earnings, since we do not expect changes in earnings to materialize over the life of the Compact or the evaluation,
Health care costs related to chronic disease, since the project is not directly targeting chronic disease and the impacts on chronic disease will unlikely materialize over the life of the Compact or evaluation.
LBW, since we will have very limited statistical power to detect changes in this low-prevalence measure (as described in Chapter III).
Nevertheless, the evaluation will provide evidence on whether some of the assumptions driving the ERR are reasonable in a broad sense. For example, despite our limited ability update LBW parameters, we will be able to provide evidence on changes in the related measure of mean birth weight (as described in Chapter III). In addition, by estimating heterogeneity in impacts based on our available measures of household poverty, we will be able to provide some evidence on the distribution of benefits (in terms of impacts on relevant health-related indicators) to complement the beneficiary analysis (which is in dollar terms).
This page left blank for double sided copying.
MCC INDONESIA NUTRITION PROJECT IMPACT EVALUATION DESIGN REPORT MATHEMATICA POLICY RESEARCH
33
III. EVALUATION DESIGN
In this chapter, we describe the design that we will use to evaluate the impact of the Nutrition Project. We begin by discussing the key research questions that we intend to address and describe the mixed-methods evaluation methodology we will use to address them—namely, a quantitative impact analysis based on a random assignment design, and qualitative implementation analysis. The remainder of this section discusses the details of the evaluation approach, including the study sample, analytical approach, and time frame of the evaluation. We conclude by discussing some of the key limitations and challenges that we expect to face. Note that there have been significant updates to the research questions, sample, timeframe for exposure to the program, and evaluation timeline since the report was written in 2014. See Annex B for updates.
A. Research questions and overview of the evaluation
The evaluation of the Nutrition Project will address three key research questions, and related subquestions, which focus on both impacts and implementation:
Impacts
1. What is the impact of the Nutrition Project’s package of supply and demand-side activities on key outcomes, including:
a. Maternal health outcomes (for example, BMI and anemia)
b. Child health outcomes (for example, stunting, wasting, underweight, birth weight, diarrhea, and anemia)
c. Behavioral practices (for example, sanitation, breastfeeding, complementary feeding, food diversity, overall maternal and child nutrition, iron/folic acid consumption)
d. Receipt of health services (for example, nutritional counseling, growth monitoring, prenatal and postnatal care access and utilization, vaccination, vitamin supplementation, nutritional and growth counseling)
2. What is the impact of the Nutrition Project on key subgroups, such as those defined by socioeconomic status, mothers’ level of schooling, children’s gender, geographic location (peripheral versus more connected areas), and service availability?
Implementation
3. How were various components of the Nutrition Project implemented?
a. How did actual implementation compare to planned implementation, and what were the reasons for any deviations from plans?
b. What were the main challenges to implementation, and how were these addressed?
c. Which demand-side and supply-side elements were the key drivers of impacts?
The first research question, the focus of the evaluation, seeks to understand the extent to which the Nutrition Project succeeded in improving some of the key intermediate outcomes in
MCC INDONESIA NUTRITION PROJECT IMPACT EVALUATION DESIGN REPORT MATHEMATICA POLICY RESEARCH
34
the logic model (discussed in Chapter II) that are ultimately expected to lead to an increase in income and reduction in poverty. Although it is not possible to directly measure long-term impacts on income and poverty in the time frame of the evaluation, estimating impacts on health-related outcomes that are linked to them in the logic model but are more proximal to the activities will enable us to assess whether these long-term impacts are plausible. The second question will explore the variation in impacts on health-related outcomes across different types of beneficiaries and by cohort, which will provide important information on how the benefits of the project are distributed across populations at different levels of needs and vulnerability. Finally, the third question will describe the implementation of the Nutrition Project, which will include documenting the extent to which various components of the project were implemented compared to implementation plans and the reason for any deviations, and identifying key facilitators of and barriers to successful implementation. We will also seek, to the extent possible, to provide evidence on which specific project activities in the package were most likely to have led to the measured impacts (analyzed as part of the first two research questions), and how they did so. An updated list of research questions is in Annex B.
To answer these questions, we will implement a mixed-methods evaluation, with the quantitative component using a random assignment design that we describe in detail in the next subsection. This design will enable us to rigorously answer the first two research questions related to project impacts by analyzing quantitative data from household surveys in project areas and non-project areas. We hope that baseline quantitative data collection will take place in late 2014, with an endline in late 2017 or late 2018, depending on the progress of implementation (the timing of our data collection activities is discussed in more detail in Chapter IV). See Annex B for an updated data collection timeline for baseline, interim, and endline.
We will complement this quantitative analysis with qualitative analyses, mainly related to implementation, in order to answer the third research question The implementation analysis, which we propose for late 2015 or early 2016, will triangulate qualitative data from several sources (described in greater detail in Chapter IV). Specifically, to the extent possible, we will take advantage of project monitoring data, primary qualitative data, as well as existing data sets at the desa level (Podes or village census) and at the kecamatan level (the national census). The implementation analysis will help us interpret and frame the impact results analyzed as part of the first two research questions, inform project improvement, and enable us to descriptively (but not rigorously) explore which specific project activities were likely to be the key drivers of project impacts. Details about what data were collected for the interim study are in Annex B.
B. Methodology: random assignment
As mentioned above, the impact evaluation methodology for the Nutrition Project is random assignment. MCC committed to using random assignment in 2012 and randomly assigned eligible kecamatan (subdistricts) into two groups: those who will receive the project (the treatment group) and those who will not (the control group) during the evaluation period. Because of random assignment, the treatment and control groups should be similar, on average, in all respects, except that the treatment group will receive the project. Therefore, the control group can be used to estimate the counterfactual: the average outcomes of the treatment group in the absence of the project. Any differences in outcomes that arise between the treatment and
MCC INDONESIA NUTRITION PROJECT IMPACT EVALUATION DESIGN REPORT MATHEMATICA POLICY RESEARCH
35
control group after random assignment can thus be attributed to the impact of the package of activities implemented under the project.30
1. Selection of kecamatan for random assignment
The pool of kecamatan that were randomly assigned to the treatment and control groups were identified using three steps. First, the project Technical Working Group (TWG) formed by MCC to support the evaluation identified 3 eligible provinces for the study— Central Kalimantan, West Kalimantan, and South Sumatra. These provinces were identified because they were among the 10 provinces with the highest stunting prevalence, had not already received the Generasi activity, and had a sufficient number of potentially eligible kecamatan for the study. Second, MCC identified 22 districts in these 3 provinces that were considered to be high-need based on criteria recommended by the TWG. Specifically, they selected districts had the highest stunting rates, lowest rates of health access and use (based on a composite index of schooling and health indicators), and lowest rates of “supply readiness” (based on a composite index of the number of health and education facilities, number of health and education providers, quality of health and education infrastructure, and community characteristics). These 22 districts included a total of 283 kecamatan. Third, MCC identified the 234 kecamatan in these districts that were participating in (or expected to participate in) the GoI’s PNPM Rural program.31 These 234 kecamatan were used in the random assignment procedure, as described below and shown in Figure III.1.
Figure III.1. Random assignment resulted in 95 treatment and 95 control kecamatan
30 It is possible that some specific project activities will affect both the treatment and control groups.
Specifically, aspects of the communication campaign could be national in scope (for example, a national media campaign around stunting). Provided that exposure to these common activities is similar in the treatment and control groups, the estimated impacts can be interpreted as the impact of the project activities that are only implemented in the treatment group.
31 PNPM-Rural is a national program that aims to empower rural communities to improve local socioeconomic and governance conditions. The project has four components: (1) grants to subdistricts for the construction of economic and social infrastructure requested by communities (for example, roads); (2) technical assistance to strengthen the capacity of district and subdistrict government institutions and communities in development planning and investment; (3) technical assistance for project implementation at the national, provincial, district, and subdistrict levels; (4) project management support to strengthen the executing agency and support the management of the activities generated by the project (see http://www.worldbank.org/projects/P122810/pnpm-rural-iv?lang=en).
MCC INDONESIA NUTRITION PROJECT IMPACT EVALUATION DESIGN REPORT MATHEMATICA POLICY RESEARCH
36
2. Random assignment of kecamatan
Based on preliminary statistical power calculations, MCC determined that a sample size of 90 treatment and 90 control kecamatan would be sufficient for the impact evaluation. However, MCC decided to select 95 treatment and 95 control kecamatan to allow for the possibility of replacements, and Mathematica suggested utilizing all selected kecamatan to increase statistical power (replacements were not necessary). Because there was sufficient budget to implement the project in 130 treatment kecamatan, MCC decided to randomly assign 225 kecamatan (out of the 234 eligible) to a treatment group of 130 and a control group of 95, and to select a representative sample of 95 of the treatment kecamatan for inclusion in the evaluation. This procedure was implemented in early 2013, as follows:
Select 225 out of 234 eligible kecamatan for random assignment. The required 225 eligible kecamatan for random assignment were randomly selected from the 234 eligible kecamatan, using implicit stratification to ensure balance across districts.32
Randomly assign 225 kecamatan into groups of 95 control and 130 treatment. The randomization was conducted using a similar implicit stratification procedure to ensure that the treatment and control groups were balanced across districts.33
Select 95 out of 130 treatment kecamatan for the study sample. As mentioned above, the preliminary statistical power calculations (which we subsequently confirmed, as described in Section III.D.3) suggested that only 95 treatment kecamatan were required for the impact evaluation. Therefore, 95 out of the 130 treatment kecamatan were randomly selected for inclusion in the study, using a similar implicit stratification procedure.
In sum, the random assignment procedure involved three stages and resulted in a sample of 95 treatment and 95 control kecamatan for the study. A map of the treatment and control kecamatan in the three evaluation provinces is in Figure III.2. An implicit stratification procedure ensured that this sample was balanced across the districts in the study. However, our analysis of the Stata code that was used to implement the implicit stratification at each stage suggested that, although the random selection was valid, it resulted in varying probabilities of selection across kecamatan.34 In the analysis, we will adjust for the combined probability of selection across all three stages using kecamatan-level weights, so that the impact estimates are valid and can be generalized to the full set of 234 eligible kecamatan. This weighting adjustment
32 This effectively involved ordering the kecamatan by district, selecting a random start point, and cycling
through the list of kecamatan with an appropriate “jump” so that the appropriate number of kecamatan were selected. This implicit stratification procedure ensures that the sample is equally spread by the ordering variable/s, which in this case is the district.
33 MCA-I is currently in the process of using existing data sources, the Potensi Desa (Podes) survey and the 2010 census, to verify that the random assignment procedure resulted in balanced treatment and control groups. Available indicators that could be related to ultimate outcomes are for example the number of health service providers and facilities, school enrollment, and other demographic characteristics.
34 Specifically, the random start point for the implicit stratification procedure was not selected from a uniform distribution, so that certain kecamatan were more likely to be selected as the start point than others. This had a knock-on effect on the rest of the selection, so that certain combinations of kecamatan were more likely to be selected than others.
MCC INDONESIA NUTRITION PROJECT IMPACT EVALUATION DESIGN REPORT MATHEMATICA POLICY RESEARCH
37
will have some cost in terms of reduced statistical power, but is necessary to adjust correctly for the random assignment procedure that was implemented.
Figure III.2. The impact evaluation will take place in three provinces
Source: MCA-I
Note: Purple indicates treatment kecamatan, red indicates control kecamatan. Yellow lines indicate district (kabupaten) borders.
3. Qualitative implementation analysis and special studies
We will conduct a qualitative and descriptive implementation analysis to describe and evaluate project implementation, and to better understand project impacts. As described in Chapter IV, we currently plan to work with MCA-I and MCC to design a qualitative implementation study early in the implementation phase of the project (in late 2015 or early 2016) to inform project implementation progress. Depending on findings from the quantitative surveys and implementation progress, as well as interest from MCA-I and MCC, we may propose an additional implementation study later in the project’s lifespan.
The implementation study will likely be conducted in a subset of communities in the quantitative sample, such that one would select kecamatan or desa intentionally with a consideration for diversity in characteristics such as geography, poverty, and health care service access. It will rely on several data sources:
Monitoring data from MCA-I. Monitoring data collected by MCA-I will provide a sense of the reach and intensity of implementation based on key indicators. This will be useful both for the early implementation study itself, and subsequently to provide additional context for the impact findings from the qualitative surveys. For example, desa-level
MCC INDONESIA NUTRITION PROJECT IMPACT EVALUATION DESIGN REPORT MATHEMATICA POLICY RESEARCH
38
performance on Generasi indicators provided yearly will be very useful in describing desa and kecamatan context and the targets they are achieving.
Primary qualitative data. The implementation study will draw on data from a variety of sources. These data will include key informant interviews with bidan and kader posyandu, community officials and puskesmas staff, and focus groups with pregnant women and caregivers. Although the topics for the study are still to be developed, illustrative examples include whether bidan, kader posyandu, kader desa, and sanitarians are applying what they learned in training; why or why not pregnant women and caregivers are attending kelas ibu hamil and kelas balita; whether micronutrients or anthropometric kits are being delivered; why households are or are not utilizing Taburia with appropriate dose and frequency; whether triggering events are taking place; and why triggering events are taking place in some areas and not others. A data collection team would also hold focus groups with pregnant women and caregivers of 0–35 month olds to discuss what they learned from service providers and in the kelas balita or kelas ibu hamil provided through Generasi.
Other existing data sources. Existing data sets that could provide additional descriptive context for the implementation analysis include those at the desa level—for example, the Potensi Desa (Podes) survey—and at the kecamatan level (for example, the national census).
The analysis of the implementation study data will be guided by the logic model and will be largely descriptive, with the goal of highlighting implementation successes and challenges. It will include a descriptive synthesis of monitoring data and potentially relevant existing data sources to provide additional descriptive context for the analysis, as well as analysis of primary qualitative data. We will triangulate the qualitative data from various sources by systematically categorizing and sorting these data appropriately to identify key themes and patterns in the responses that will inform the key research questions.
In addition to the implementation process study, in Chapter IV we describe several other possible special studies, including the following:
A household dynamics study around topics such as breastfeeding, complementary feeding, and overall intrahousehold resource allocation, with particular emphasis on gender dynamics
A schooling study that examines the schooling effects of Generasi, which are not addressed in the main evaluation (because the data collection for the main evaluation focuses on outcomes for pregnant women and young children below school age).
A fidelity strengthening intervention (FSI) in 1–2 kabupaten used to strengthen existing implementation and data structures so that the project can create more frequent feedback loops and continuously improve implementation
C. Study sample
1. Identification of the study sample
Although the Nutrition Project is expected to have long-term impacts on the health and income of beneficiaries, the majority of the activities are intended to directly support children for a period of 1,000 days, starting at conception through age 2. Therefore, we propose to focus the study for the impact analysis on two samples—pregnant women and young children. The sample
MCC INDONESIA NUTRITION PROJECT IMPACT EVALUATION DESIGN REPORT MATHEMATICA POLICY RESEARCH
39
of pregnant women will consist of those in the second or third trimester of pregnancy. We decided to exclude women in the first trimester because awareness of a pregnancy at that stage can be poor and because impacts on outcomes such as BMI or anemia are unlikely to manifest until the second or third trimester, even if women receive project services such as nutrition counseling or supplementation from the beginning of pregnancy. The endline sample no longer includes pregnant women. See updates in Annex B.
We originally intended the sample of young children to include children between age 0 and 23 months, in keeping with the main focus of the project on children under 2 years. However, this sample would include few children with a full 1,000 days of exposure to the project (because very few children would be close to age 2). Therefore, to ensure that we can conduct at least some (subgroup) analyses on children with full exposure to the Nutrition Project, we intend to focus the study on children up to age 35 months. This age group is also sufficient to capture impacts on stunting, the key medium-term outcome of the project, which would be largely manifested by age 3 years. This sample will also enable us to measure impacts on most of the other key outcomes that are expected to be affected in the time frame of the project (Table II.3 in Chapter II), although samples for some measures may be smaller because they only apply to a limited age range (for example child anemia is relevant for the 6–35 month age range).
The Nutrition Project could also have impacts on children in a slightly older cohort (those between 3 and 5 years old), both directly (for example, from improved sanitation) and/or because they were exposed to the project activities when they were younger (for example, their stunting rates could have been affected by improved nutrition at earlier ages). Surveying a sample of children up to 5 years of age would also have the advantage of allowing for international comparisons or benchmarking for stunting, a key outcome for the study, because many national and international studies look at stunting through age 5.
However, in consultation with MCC and MCA-I, we determined that the benefits of adding an older cohort child sample do not justify the costs. If children aged 3–5 years were affected by the project, then these effects should largely be detected with the 0–35 month sample, because the mechanisms through which they are affected are similar but the 0–35 month old children are more directly affected by the project. This is particularly true for stunting, the key outcome of the project, because most of the effects of stunting are thought to manifest by age 3 years (Bhutta, Ahmed, et al. 2008; Victora, Adair, et al. 2008; Victora, de Onis, et al. 2010). In addition, we understand that the national Riskesdas surveys report stunting results for different age groups, so the impact evaluation results with the proposed sample could at least be benchmarked against this prominent national data source. Therefore, we believe that including pregnant women and children aged 0–35 months in the sample is the most efficient approach for the evaluation.
2. Cross-sectional versus panel sample
Given that the key project outcomes are focused on populations at a particular stage in life (pregnancy in the second and third trimester or ages 0–35 months), we propose to use a repeated cross-sectional sample rather than a panel sample. A repeated cross sectional sample involves drawing a sample of pregnant women and children 0-35 months old at baseline, and a new sample of individuals in these groups at endline. In contrast, a panel sample involves drawing a sample of pregnant women and children 0-35 months old at baseline and surveying the same individuals at endline.
MCC INDONESIA NUTRITION PROJECT IMPACT EVALUATION DESIGN REPORT MATHEMATICA POLICY RESEARCH
40
A repeated cross-sectional sample has three main advantages over a panel sample for the evaluation. First, the age- specific or life-stage-specific nature of the key outcomes implies that the baseline cohort of children 0–35 months old at baseline will largely age out of the 0-35 month age group by endline. For example, a child who is 6 months old at baseline will be at least 41 months old at endline (depending on the timing of the endline), and will not contribute to the estimates of key indicators for the 0-35 month group. If the evaluation seeks to report on changes in a stunting rate over time (which would be comparable to estimates from other evaluations and data sources), we need to sample children in the same age range at baseline and endline. Second, exposure to the project interventions in a panel sample would be limited (except for those in-utero at baseline), likely diluting project impacts. For example, a child 6 months olds at baseline would have missed out on exposure in-utero and for the first 6 months, so impacts on stunting for these children might be reduced. In contrast, a sample of 0-35 month olds at endline would have had full exposure from the in-utero period to their current age (and 24-35 month olds would have had exposure to the full 1,000 days of treatment). The limited project exposure with a panel sample would also severely limit our ability to measure impacts on intermediate outcomes such as infant feeding practices, because many children in the baseline sample would have been too old to have experienced impacts on these indicators. These indicators are important to help us understand the mechanisms of impacts on stunting and other key outcomes.
Third, given the uncertainty around timing of the delivery of activities, the repeated cross-section allows more flexibility to optimize the timing of the endline data collection with respect to the target children’s exposure. With a panel, one would want to survey children after they had reached a certain age, for example age 2, to measure exposure to the 1,000 days of the program. But if 1,000 days of treatment doesn’t start until after the baseline, one might be required to survey too soon with a panel, to capture the sample at the optimal age. A cross-section allows MCC the flexibility of conducting follow-up surveys once it feels that the target population had had full exposure to the range of activities MCC is supporting.
In contrast, the main advantages of a panel sample are that it typically provides some gains in statistical power by enabling us to control for individual baseline characteristics, allows us to conduct subgroup analyses by baseline characteristics that might be affected by the activities (such as health practices or income), and enables us to observe changes for the same individuals over time so that we can relate their behaviors at different stages to their final outcomes. A panel sample would also enable us to measure impacts on some longer term outcomes, such as school readiness (albeit for children with only partial exposure to the interventions).
We also considered the option of incorporating a panel sample by surveying the baseline sample at endline and adding a new cross-sectional endline sample to measure the key outcomes for the main population of interest. However, this increase in sample size would significantly increase the costs of data collection, while the benefits would be limited given that the panel sample would not contribute to the main outcome estimates (because it would include older children). Therefore, after discussions with MCC and MCA-I, we agreed it would be most efficient to include a cross-sectional sample only.
However, as we discuss in Chapter IV, if MCC is interested in measuring additional outcomes for older children at endline (for example, school readiness for those exposed to the project when they were younger), MCC might want to consider drawing this sample from the
MCC INDONESIA NUTRITION PROJECT IMPACT EVALUATION DESIGN REPORT MATHEMATICA POLICY RESEARCH
41
baseline sample rather than drawing a new cross section.35 To keep this option open, the survey firm will gather detailed contact information from the baseline sample.
3. Sample size
Given that we do not propose to follow the sample individuals over time, the endline and baseline samples will be different and will serve largely different purposes. The baseline sample will be used to: (1) assess whether the random assignment was successful in creating equivalent treatment and control groups; (2) control for any baseline differences that arise by chance, by including baseline kecamatan-level means as control variables in the endline analysis; and (3) provide estimates of baseline means in the surveyed areas, which may be informative for the programmatic purposes and/or other stakeholder purposes. The endline sample will be used primarily to determine impacts in the random assignment design, by comparing means between the treatment and control groups.
The different nature and purposes of the endline and baseline samples suggest that the sample sizes could also differ. In particular, we require greater precision—and hence larger sample sizes—at endline, to enable us to precisely estimate ultimate project impacts and conduct impact analyses by subgroup, As a result, and as discussed with MCC and MCA-I, we propose a smaller sample size for baseline compared to endline. As shown below, a smaller baseline sample size will be sufficient to meet its purposes and will free up data collection resources for an early implementation study (discussed above and in Chapter IV). Below, we discuss the proposed sample sizes for the endline and baseline, respectively. We begin with the endline sample sizes, which are critical to evaluation because they ultimately drive our ability to detect project impacts and answer the key research questions; these endline sample sizes then serve as a benchmark against which the appropriate baseline sample sizes can be determined.
Endline sample sizes36
To determine the appropriate endline sample sizes, we calculated minimum detectable impacts (MDIs) at endline for some key indicators and for the two sample populations of interest. MDIs are the smallest project impacts that we are able to statistically detect—for example, if the MDI for a certain outcome is 5 percentage points, we will only be able to detect an impact if it is at least 5 percentage points. Larger sample sizes generally mean smaller MDIs—that is, increased ability to detect small impacts. Our goal in determining the endline sample size was to ensure a sufficient sample size to detect changes in key outcomes that would
35 It is valid to include additional samples or outcomes at endline that were not included at baseline, because
the random assignment makes the assumption of baseline equivalence plausible.
36 As discussed in Chapter IV, we propose the option of conducting a midline survey as well as an endline. If a midline survey is conducted, the sample size would be the same as the endline survey if MCC and MCA-I wanted to detect changes in key outcomes. If the midline survey is only to measure outputs, we can revisit this sample size.
MCC INDONESIA NUTRITION PROJECT IMPACT EVALUATION DESIGN REPORT MATHEMATICA POLICY RESEARCH
42
be policy relevant, while also considering the higher costs of a larger sample. To do so, we systematically varied the sample size (both the number of kecamatan and number of households per kecamatan) and computed MDIs for the key outcomes of interest.37
In Table III.1, we present several scenarios for the number of treatment and control kecamatan, focusing on MDIs for stunting (the pattern of MDIs for other indicators is similar). Because MCC will be funding the Nutrition Project in 130 out of 225 eligible kecamatan identified in the three targeted provinces, the number of kecamatan sampled for the study could be up to 130 for the treatment group and up to 95 for the control group. Based on the MDIs in Table III.1, we recommend proceeding with the sample sizes of 95 treatment and 95 control kecamatan initially selected by MCC. Sample sizes with fewer kecamatan result in an increase in MDIs above the size of the effects that are anticipated from the project, whereas increasing the samples size to the full 130 treatment kecamatan only improves MDIs by approximately 0.5 percentage points (or a 7 percent improvement) and does not seem to justify the increase in resources that this would require.38
In Tables III.2 and III.3, we examine the effect on MDIs of varying the number of households per kecamatan (assuming 95 treatment and 95 control kecamatan), for the endline samples of children and pregnant women, respectively, focusing on four key outcomes. We show different sample size requirements separately for different indicators because there is variation in baseline prevalence and/or intercluster correlation coefficients (ICCs) across indicators. The tables also demonstrate MDIs for an illustrative subgroup consisting of one-half of the full sample (for example, defined by gender of the child). We present number of household scenarios that are divisible by four because below we recommend sampling four desa per kecamatan and sampling an equal number of children and pregnant women per desa.
Table III.1. We recommend retaining the existing sample sizes of 95 treatment and 95 control kecamatan to detect impacts on stunting (children 0–35 months)
. . MDIs for stunting (percentage points) Treatment kecamatan
Notes: MDI calculations are for a two-tailed test with 80 percent power at a 95 percent significance level. Baseline prevalence for stunting is 31.0 percent and the intercluster correlation coefficient (ICC) is 0.05, based on IFLS 2007. Calculations also assume an R2 of 0.05 and a response rate of 95 percent.
37 In addition to the sample size, the MDIs depend critically on our assumptions about key parameters (such as
the intercluster correlation coefficient (ICC) and the regression R2), the power with which we would like to detect effects (typically 80 percent), and the variance of the outcome (which, for binary outcomes, is a function of the baseline level of the outcome). To the extent possible, we calculated the MDIs using parameter estimates obtained from IFLS 2007, for which we had the micro-data necessary to calculate means and kecamatan-level ICCs for the relevant age group.
38 Power increases are limited in this case because it is only possible to increase the number of treatment kecamatan, as the number of control kecamatan is fixed.
MCC INDONESIA NUTRITION PROJECT IMPACT EVALUATION DESIGN REPORT MATHEMATICA POLICY RESEARCH
43
Based on this analysis, we recommend sampling 32 households per kecamatan for the endline child sample, which would allow MCC to detect a 5.2 percentage point change in stunting (17 percent of the expected baseline mean).39 As part of its first ERR calculation, which were conducted prior to some changes in project plans, MCC anticipated a 30 percent change in stunting; therefore, the sample size we propose should allow MCC to detect meaningful, policy-relevant changes (Cameron, Lorgelly, et al. 2013). Moreover, a systematic review of maternal and child food supplementation programs worldwide found an average impact equivalent to a 16 percentage point change in stunting (Bhutta, Ahmed, et al. 2008), and this sample size is well below that threshold. Annex B includes details about how many children we sample in the 0-35 month age group for the endline surveys.
There may be some concern that the baseline means—which are critical in determining statistical power for binary outcomes—from the IFLS, which represent Indonesia as a whole, are higher in the study provinces. In fact, as mentioned above, the stunting rate from Riskesdas 2010 is 39.7 percent in West Kalimantan, 39.6 percent in Central Kalimantan and 38.9 percent in South Sulawesi (Departemen Kesehatan RI 2010). To obtain an upper bound on the MDI of stunting—the most conservative MDI estimate—one can assume a baseline prevalence of 50 percent (which will result in the highest possible variance and hence highest MDI). This yields an MDI of 5.7 percentage points. We intend to recalculate the MDIs in the baseline report, using updated parameters from the baseline data for the study sample.
Despite the large changes in stunting found in many related interventions in the literature (and projected in the ERR calculations), there may still be some concerns about whether impacts of the magnitude we are able to detect are reasonable to expect in this specific context. However, there are diminishing gains in precision as sample size within kecamatan increases. Increasing the sample size any further would substantially increase data collection costs and have a very small benefit in terms of a reduced MDI. For example, even if we sampled 100 households per kecamatan—which would be very costly—the MDI for stunting would only decrease to 4.5 percentage points. Therefore, in case impacts on stunting are smaller than those we are able to detect, we intend to measure impacts on a range of shorter-term, more proximal outcomes (such as household practices known to be related to stunting), which should show large impacts if the project is successful (as mentioned in Chapter II). Thus, we will still be able to assess whether there have been significant changes in key pathways that affect stunting and could therefore potentially lead to larger changes in stunting in the longer term.
39 Due to lower baseline prevalence in wasting and underweight status, we will only be able to detect relatively
larger changes in these indicators (in percentage terms) compared to those we can detect for stunting.
MCC INDONESIA NUTRITION PROJECT IMPACT EVALUATION DESIGN REPORT MATHEMATICA POLICY RESEARCH
44
Table III.2. We recommend an endline sample size of 32 households with children 0–35 months per kecamatan to detect plausible impacts on key outcomes
Notes: MDIs are for a two-tailed test with 80 percent power at a 95 percent significance level, and are based on 95 treatment and 95 control kecamatan. Baseline prevalence (shown in parentheses) and ICCs (0.05; 0.11; 0.03; and 0.002) are from IFLS 2007. Calculations also assume an R2 of 0.05 and a response rate of 95 percent. Sample for anemia is five-sixths of the total because it excludes children 0–5 months.
For the other key outcomes shown in Table III.2, we estimate being able to detect a 2 percentage point change in the percentage of children with low birth weight, a 7 percentage point change in child anemia, and a 4 percentage point change in the incidence of diarrhea in the last month. With children receiving appropriate nutrition, it is reasonable to expect changes in anemia and diarrhea of this magnitude over two years or more (Zlotkin, Schauer, et al. 2005; Cairncross, Hunt, et al. 2010). For the case of low birth weight, this MDI is somewhat higher than what MCC anticipated in its ERR calculations from October 2013, which expect an 11 percent change in low birth weight infants due to micronutrient supplementation, whereas the sample above will only allow MCC to detect a 26 percent change (1.9 percentage points from an expected base of 7.2 percentage points). To detect an 11 percent change, the sample size would need to be increased to over 100 children per kecamatan (not shown). However, although we may not be able to detect impacts on low birth weight of the anticipated magnitude with our proposed sample sizes, we would be able to detect a 0.1 kg change in average birth weight, or 3 percent of the expected baseline mean (also not shown), enabling us to provide some evidence for this outcome.
Table III.3 shows MDIs for two key outcomes (low BMI and anemia) for pregnant women in their second and third trimesters. We recommend a sample of 16 households per kecamatan for this population, which strikes an appropriate balance between precision and cost (given that we are already recommending sampling 32 households per kecamatan for the child sample). This sample size will enable us to detect an impact of 3.5 percentage points (30 percent of the expected baseline mean) for low BMI, and 5.7 percentage points for anemia (12 percent of the expected baseline mean).
MCC INDONESIA NUTRITION PROJECT IMPACT EVALUATION DESIGN REPORT MATHEMATICA POLICY RESEARCH
45
Table III.3. We recommend an endline sample size of 16 households with pregnant women in the second or third trimester per kecamatan to detect plausible impacts on key outcomes
. . MDIs (Percentage points)
Average N per kecamatan Total N
Low BMI (11.6 percent)
Anemia in second and third trimester (46.0 percent)
Full sample . . .
8 1520 4.9 7.5 16 3040 3.7 5.6 24 4560 3.2 4.8
50 percent subgroup . . .
4 760 6.7 10.3 8 1520 4.9 7.5 12 2280 5.6 8.6
Notes: MDIs are for a two-tailed test with 80 percent power at a 95 percent significance level, and are based on 95 treatment and 95 control kecamatan. Baseline prevalence (shown in parentheses) and ICCs (0.02 and 0.016) are from IFLS 2007. Calculations also assume an R2 of 0.05 and a response rate of 95 percent.
In sum, the proposed sample sizes involve 6,080 young children in the 0–35 month age range (32 per kecamatan) and 3,040 pregnant women (16 per kecamatan), resulting in a total sample size of 9,120 households (48 per kecamatan). These sample sizes will enable us to detect impacts of the expected magnitude for most of the outcomes of interest. They will also enable us to detect impacts for key subgroups; for example, we will be able to detect impacts on stunting of 6.1 percentage points for female children, which we expect to comprise approximately half of the total sample of children.
In addition to determining the appropriate number of households to survey per kecamatan, it is important to consider how those households should be clustered. Given the size of a kecamatan, it would be impractical to conduct a listing of all households and randomly select from the list. We recommend concentrating the sample at least at the desa level, similar to other research efforts in Indonesia. Our calculations suggest that more desa will improve the MDI, and thus we suggest spreading the 48 households across a minimum of four desa per kecamatan.40
40 We recommend the following sampling strategy. In each kecamatan, randomly select four desa. In each desa,
randomly select one dusun in which to conduct a household listing to identify children 0–35 months of age and pregnant women in their second or third trimester of pregnancy. In each of the four dusun, randomly select 8 caregivers of children 0–35 months, and four pregnant women in their second or third trimester. This amounts to 32 caregivers of children 0–35 months, and 16 pregnant women in their second or third trimester across four desa in the kecamatan. If for some reason there are insufficient pregnant women or caregivers in the selected desa or dusun, the survey firm will be required to conduct another listing in another randomly selected dusun within the four sample desa.
MCC INDONESIA NUTRITION PROJECT IMPACT EVALUATION DESIGN REPORT MATHEMATICA POLICY RESEARCH
46
Baseline sample sizes
To determine the appropriate baseline sample size, we focused on the minimum detectable differences (MDDs) for baseline treatment-control differences and the confidence intervals (CIs) of the estimated baseline means. In terms of baseline equivalence, we do not expect large differences at baseline given random assignment. However, we still want to be able to assess the baseline balance and identify any large differences that may have arisen by chance. (We will control for any baseline differences in the endline analysis regardless, but identifying any large baseline differences is considered a standard check as part of a randomized control trial (RCT) design.) In terms of confidence intervals, we wanted to ensure that the reported baseline means would be sufficiently precise to be informative for programmatic purposes and for other stakeholders (we will report these means as a 95 percent CI—for example, we might say that the baseline stunting rate is 30 percent, with a CI between 25 and 35 percent). Having more precise baseline means also suggests that the kecamatan-level means used as baseline controls will be more precise, improving our ability to control adequately for baseline differences that arise by chance.
We therefore conducted MDD and CI calculations for several possible baseline samples (Tables III.4 and III.5). Based on these calculations, we recommend that a baseline sample of 16 children 0–35 months old and 8 pregnant women in the second and third trimester (a total of 24 households) in each of the 190 sample kecamatan will provide reasonable CIs and MDDs for baseline differences for key outcomes. For example, for stunting, the main outcome of interest, we will be able to identify any baseline differences larger than 6.3 percentage points, and our
Table III.4. We recommend a baseline sample size of 16 households with children 0–35 months per kecamatan to identify baseline treatment-control differences and estimate baseline means
. .
Stunting (31.0 percent)
Anemia (38.3 percent)
Diarrhea in past month
(17.2 percent)
Low birth weight
(7.2 percent)
Average N per kecamatan
Total N
MDD (pp)
CI Margin
(pp) MDD (pp)
CI Margin
(pp) MDD (pp)
CI Margin
(pp) MDD (pp)
CI Margin
(pp)
8 1520 7.9 5.5 9.9 6.9 6.1 4.3 3.8 2.7
16 3040 6.3 4.4 8.4 5.9 4.7 3.3 2.7 1.9
24 4560 5.7 4.0 7.8 5.5 4.1 2.9 2.2 1.6
Notes: MDDs are for a two-tailed test with 80 percent power at a 95 percent significance level. Baseline prevalence (shown in parentheses) and ICCs (0.05; 0.11; 0.03; and 0.002) are from IFLS 2007. Sample for anemia is five-sixths of the total because it excludes children 0-5 months. Confidence interval upper bound is given by the mean plus the confidence margin; confidence interval lower bound is given by the mean minus the confidence margin. Calculations assume a response rate of 95 percent.
pp = percentage points.
MCC INDONESIA NUTRITION PROJECT IMPACT EVALUATION DESIGN REPORT MATHEMATICA POLICY RESEARCH
47
Table III.5. We recommend a baseline sample size of eight households with pregnant women in the second or third trimester per kecamatan to identify baseline treatment-control differences and estimate baseline means
. .
Low BMI (11.6 percent)
Anemia in second and third trimester (46.0 percent)
Average N per kecamatan Total N MDD (pp) CI Margin (pp) MDD (pp) CI Margin (pp)
4 760 6.9 4.8 10.6 7.4
8 1520 5.0 3.5 7.7 5.4
12 2280 4.2 3.0 6.5 4.5
Notes: MDDs are for a two-tailed test with 80 percent power at a 95 percent significance level. Baseline prevalence (shown in parentheses) and ICCs (0.02 and 0.016) are from IFLS 2007. Confidence interval upper bound is given by the mean plus the confidence margin; confidence interval lower bound is given by the mean minus the confidence margin. Calculations assume a response rate of 95 percent.
pp = percentage points.
expected 95 percent CI margin for the mean is 4.4 percentage points, implying a CI of between 26.6 percentage points and 35.4 percentage points. With this level of precision for the baseline mean, we will also be able to control effectively for any large differences at baseline that may arise due to chance. This suggests an overall sample size of 1,520 pregnant women and 3,040 young children in the 0–35 month age range (4,560 households in total).
D. Analysis approach
Given the use of random assignment, the basic method to estimate impacts is to compare the mean outcomes of the treatment and control groups at endline. However, we intend to use regression models to estimate impacts because they provide greater analytic flexibility. The regression adjustment will enable us to account for design characteristics such as the implicit stratification by district, account for differences between the treatment and control groups that arise by chance, and improve statistical precision through the inclusion of additional control variables.41
We will therefore estimate impacts of the Nutrition Project on key outcomes using the following ordinary least squares model:
(1) ,
where ijY is the outcome for beneficiary i in kecamatan j at endline; jT is a binary variable that is
equal to 1 for those in treatment kecamatan and 0 for those in control kecamatan; ijX is a set
41 We will report both unadjusted estimates and estimates that are regression adjusted by including relevant
control variables. If the random assignment is successful in creating equivalent treatment and control groups, the two sets of estimates should be similar, but the adjusted estimates should be more precise.
ij j ij oj j d ijY T X Y Z
MCC INDONESIA NUTRITION PROJECT IMPACT EVALUATION DESIGN REPORT MATHEMATICA POLICY RESEARCH
48
of individual-level control variables that are time-invariant or unaffected by the project (such as child gender, maternal schooling attainment, maternal age at first birth, maternal height, and household socioeconomic status); 0jY is the baseline mean of the outcome in kecamatan j; jZ is
a set of additional kecamatan- or desa-level control variables (such as measure of available health infrastructure, or remoteness); d is a set of binary district indicators; and ij is a random
error term.42 The estimate of the parameter, , is the regression-adjusted estimate of the average impact of the package of activities implemented under the Nutrition Project. The impacts for a particular subgroup of interest can be estimated simply by restricting the sample used to estimates equation (1) accordingly, or by including appropriate interaction terms in this regression.
Because the sample of interest consists of pregnant women and children aged 0–35 months, the individuals whom we will measure for the key outcomes will be different at baseline and endline. Therefore, individual-level baseline measures of the outcome are not defined for the endline sample. Instead, we adjust for the baseline mean of the outcome at the kecamatan level—the level of random assignment—by including the term 0 jY in equation (1). Conceptually, this is
similar to a kecamatan-level difference-in-differences approach that compares the change in outcomes in the treatment kecamatan between baseline and endline to the same change in control kecamatan. However, including the baseline kecamatan-level mean as a control variable in a regression framework instead of computing the difference-in-differences is a more flexible approach that allows the relationship between the endline and baseline means to be determined empirically. As mentioned above, this approach will enable us to adjust for any baseline differences between the treatment and control groups that arose by chance, and will improve the precision of the estimates.
Our estimates also have to account for the fact that outcomes among individuals in the same kecamatan—which is the level of random assignment—are likely to be correlated, because they experience many of the same conditions (most importantly, having access to the same puskesmas, a nexus of the project). We will account for this correlation statistically by clustering the regression error terms at the village level to adjust the standard errors. In addition, as mentioned earlier, we will also include kecamatan-level weights to adjust for the different sampling and random assignment probabilities across kecamatan. These kecamatan-level weights will be combined with the sampling weights that we will compute for households within a kecamatan.
E. Time frame of exposure
It is important to ensure that the planned timing of the endline survey that we will use to estimate project impacts allows for sufficient exposure to the project activities for impacts to manifest. As discussed in more detail in Chapter IV, we propose two options for the timing of
42 In the case of binary outcomes such as a stunting indicator, equation (1) is termed a linear probability model.
Although probit or logit models are often used for binary outcomes, we prefer the linear probability model because it is easier to interpret and relies on weaker parametric assumptions. In practice, the probit or logit and linear probability models generally yield similar results for the types of marginal effects that we are estimating here (Angrist and Pischke 2008; Wooldridge 2010). Nevertheless, we will explore the robustness of our results to estimates that use these nonlinear models.
MCC INDONESIA NUTRITION PROJECT IMPACT EVALUATION DESIGN REPORT MATHEMATICA POLICY RESEARCH
49
the endline based on the current implementation schedule, which we recognize is in flux and that the endline timing would need to be adjusted to accommodate: late 2017, or late 2018. Although some of the project activities—in particular, Generasi—will begin implementation in 2014, the rollout of many of the supply-side activities will be more gradual and may not start until later in 2014 or early 2015. However, even allowing for these delays in implementation, both of the proposed endlines will allow for sufficient exposure to the project for any impacts to manifest for the target populations.
Specifically, pregnant women surveyed at endline will have been exposed to a package of activities that would have been in place in their communities for more than two years (2017 endline) or more than three years (2018 endline). Similarly, most children aged 0–35 months at endline would have had full exposure to the activities in utero and after birth. With a late 2018 endline, all children in this age cohort would have had full exposure (the oldest would have entered their second trimester in mid-2015, after full implementation began); with a late 2017 endline, most children in the cohort would have had full exposure, except for the oldest (those aged between 24 and 29 months would have not been exposed in utero, whereas those aged between 30 and 35 months would not have been exposed until they were 6 months old). Therefore, if the project does impact key outcomes, the timing of endline surveys will enable us to measure them. A late 2018 endline—which we recommend in Chapter IV—would maximize exposure for the full sample. Due to changes in implementation, children of different age groups were exposed to the programs at different times than anticipated when the design report was written. We discuss these changes in Annex B.
F. Limitations and challenges
Although the design offers the best possible opportunity to provide rigorous evidence to inform the key research questions we described at the start of this chapter, it has some limitations and may face certain challenges. Here, we discuss these potential limitations and challenges, and our plans to address them:
Noncompliance with randomly assigned status. Ideally, all of the kecamatan originally assigned to the treatment group will receive the full set of Nutrition Project activities, and none of the kecamatan assigned to the control group will receive them. However, in practice, some deviations from this ideal situation (noncompliance with treatment status) might occur.43 For example, some of the treatment kecamatan might not receive the project because they lack the required health systems personnel or infrastructure to implement major project components, or there may be strong political pressure to include specific control kecamatan in the project. The random assignment design relies on balance between the treatment and control groups that is achieved by random assignment; nonrandom deviations from randomly assigned status have the potential to disrupt this balance and threaten the validity of the design.
43 To simplify the discussion of noncompliance, we assume that the entire package of interventions is
implemented together. It is also possible that there will be noncompliance with specific interventions. However, we view this as an issue with intensity of implementation, which we discuss as a separate issue below.
MCC INDONESIA NUTRITION PROJECT IMPACT EVALUATION DESIGN REPORT MATHEMATICA POLICY RESEARCH
50
Our primary approach to dealing with noncompliance will be to use the randomly assigned treatment status in the analysis. These estimates are typically called “intent-to-treat” (ITT) estimates—they are unbiased because they rely on the randomly assigned status, and are interpreted as the impact of the offer to participate in the project. If the degree of noncompliance is limited, the ITT estimates will be very similar to the impact on those who actually received the project—the treatment-on-treated (ToT) estimates.44 If the degree of noncompliance is substantial (which we do not expect to be the case), we can still compute ToT estimates by adjusting the ITT estimates based on the difference in compliance rates between the treatment and control groups (Bloom 1984), albeit at a cost of lower statistical precision.
To minimize the extent of noncompliance, we have—and will continue—to work closely with key stakeholders through MCA-I, such as PSF, the Ministry of Home Affairs, the Ministry of Health, Bappenas, and other national and local government stakeholders, to ensure continued buy-in for and adherence to the evaluation design. MCA-I traveled to all study provinces in December 2013 and January 2014 to check on randomization compliance and to ensure that treatment kecamatan were still interested in participating in the project. As of the time of writing this report, the sample selected in early 2013 is still intact. We will also work closely with MCA-I to obtain regular, up-to-date information on implementation so that we can identify potential noncompliance problems as they arise and work collaboratively to devise possible solutions. Our full implementation analysis will document where the project (and specific project activities) were implemented, and it will be another source of identification of noncompliance that will enable us to make the necessary adjustments in our analysis.
Conducting the baseline survey after Generasi has started. The baseline survey will likely take place towards the end of 2014 due to start-up delays in the evaluation contract, the time required to procure the services of a local survey firm, and an inability to conduct survey activities around the extensive Indonesian election period in mid-2014. Socialization for PNPM-Generasi has already started, and the first tranche of block grants will be distributed in the fourth quarter of 2014. Although the MIYCF and growth monitoring training may also be complete by September 2014, we expect this to have minimal impact on beneficiaries before the survey. To the extent that outcomes, such as prenatal care visits, or awareness about nutrition, breastfeeding, or sanitation, in the treatment group begin to respond to these activities, this poses two related analytical challenges. First, we might not observe baseline equivalence if the outcomes in the treatment group have started to improve. Second, including the baseline outcome as a control in the impact analysis could dampen the estimated impacts, because some of the impact will be erroneously attributed to existing baseline differences. We will take these possibilities into account when assessing and interpreting baseline equivalence, by focusing on outcomes that are unlikely to have responded to early activities. In addition, in the impact analysis, we will check the robustness of our results to omitting the baseline controls.
Possible limited intensity of some project activities. The impact evaluation is designed to estimate the impact of the Nutrition Project activities on the average beneficiary in the
44 For both the ITT and ToT analyses, it will be important to collect data in all 190 sample kecamatan that were
originally randomly assigned, regardless of their compliance status. That is, even if a kecamatan were to drop out of the project, it would still be important to survey that kecamatan.
MCC INDONESIA NUTRITION PROJECT IMPACT EVALUATION DESIGN REPORT MATHEMATICA POLICY RESEARCH
51
treatment kecamatan. Therefore, if some activities only reach a limited number of beneficiaries or if the intensity of implementation is not sufficiently strong, exposure by the average beneficiary in our sample may be limited—resulting in small estimated impacts. We have several concerns related to implementation intensity and duration.
First, we want to learn more about the intensity and reach of some of the supply-side activities, such as MIYCF and sanitation training, and micronutrient distribution, as noted in the Mathematica trip report from January 2014. For example, it is conceivable that there could be problems in effectively transmitting information to lower levels of health providers through the cascade model of training, so that exposure by beneficiaries to well-trained health workers in some areas is limited; similarly, some puskesmas might not have a nutritionist in position to be trained, or the training might not be able to accommodate all nutritionists if there is more than one puskesmas in a kecamatan. Sanitation triggering might only occur in a limited number of desa or dusun, so that exposure to the sanitation activity (and hence impacts on outcomes most closely related to this project, such as diarrhea incidence) might be limited. Our understanding of current implementation plans is that CLTS work supported by MCC will take place in a limited number of desa per kecamatan, and a limited number of dusun within each desa. This means that randomly sampling a set of desa and dusun within each treatment kecamatan might not yield a sample where CLTS is taking place widely. There could also be problems with ensuring an adequate supply of micronutrients in some areas.
Second, due to implementation delays in project rollout, we are concerned about being able to evaluate all activities at full implementation for the duration over which they are hypothesized to generate impacts. For example, the Compact entered into force in April 2013. Full implementation of the supply-side activities will not reach the kecamatan or desa levels until late 2014 or early 2015. This could mean that the Compact allows for only a two- or three-year implementation period to affect outcomes at the desa level.
Third, in addition to the delayed time line for the supply-side activities, not all activities will be implemented at the same time in the same areas. This might not be related to take-up, but rather implementation feasibility. For example, the micronutrients will be distributed to different locations at different times. This may be sensible from an implementation perspective, but it is a challenge for the evaluation because it suggests that intensity of exposure could vary in a nonrandom way.
To address these challenges, we will work closely with MCC and MCA-I as the project activities are developed further to better understand the extent to which they are likely to be sufficiently intense to observe impacts of the magnitude we are able to detect (and for which outcomes). We will also carefully design data collection instruments to capture reasonable impacts that the project can affect over the time horizon being measured. As part of the implementation analysis, we will rely on information from MCA-I about what activities were implemented where and when, and through fieldwork will carefully document the implementation of the various activities to inform our analysis of the impact estimates.
Because the variation in intensity will likely be nonrandom, we will not be able to rigorously analyze differential impacts by intensity—it would be difficult to identify an appropriate control group for a set of treatment kecamatan with a given treatment intensity. However, we will still be able to conduct exploratory analyses to provide some suggestive evidence of
MCC INDONESIA NUTRITION PROJECT IMPACT EVALUATION DESIGN REPORT MATHEMATICA POLICY RESEARCH
52
differential impacts, such as comparing a set of treatment kecamatan with a given treatment intensity to a group of control kecamatan with similar baseline characteristics.
Limited ability to isolate impacts of specific activities. Because MCC, MCA-I and partners are simultaneously implementing a package of activities, we will not be able to directly disentangle the impacts of these specific activities. To provide some suggestive evidence on which activities may have played a greater role in contributing to any impacts, we intend to rely primarily on qualitative implementation analysis and monitoring data from MCA-I as discussed above in Section B.3 of this chapter. This will help us understand how and to what extent the various activities were implemented in practice, how they interacted with each other, and which activities worked better than others and may have been responsible for driving impacts.
Possibly limited external validity. With appropriate weighting, the impact evaluation results will apply to the 234 eligible kecamatan in the 22 eligible districts identified by MCC in three provinces. These kecamatan are not necessarily representative of the typical kecamatan in Indonesia, the selected provinces, or even the selected districts (recall that only kecamatan involved in PNPM-Rural in selected districts were eligible for the project).Therefore, the results from the evaluation will have limited external validity—one might obtain different impacts if the activities were implemented in other kecamatan in Indonesia or even in these same provinces. For the same reason, we will not be able to directly compare the impacts of the Nutrition Project to those of other projects, like Generasi, which were implemented in different areas. To the extent possible, we can assess the likelihood of external validity by comparing the characteristics of the households and communities in the sample to those of other areas in Indonesia using existing data.
Introduction of other similar programs in control areas. The impact estimates can be interpreted as the impact of the Nutrition Project relative to the activities implemented in the control group. Any other interventions implemented equally in both the treatment and control groups do not threaten the internal validity of the evaluation; however, non-project interventions that are implemented differentially across the two groups are potentially problematic. For example, if the GoI accelerates sanitation programming in control areas because it knows that MCA-I is concentrating on treatment areas and the sanitation activities have a big impact on key outcomes, the estimate impact of the project—which relies on treatment and control programs—will be small. Similarly, some interventions that are currently in place in both treatment and control (for example, Ministry of Health training in nutrition and sanitation activities) might be curtailed in the treatment areas, because these kecamatan are seen to be receiving a new project. To limit the extent of this problem, it will be important for MCC, MCA-I, and Mathematica to work closely with key stakeholders such as the GoI and other donors to obtain their buy-in for the evaluation so that the evaluation design is respected, and to be aware of any planned changes in their programs. It is also critical to ensure that survey instruments discussed in Chapter IV capture the activities of all programs taking place in both treatment and control areas.
MCC INDONESIA NUTRITION PROJECT IMPACT EVALUATION DESIGN REPORT MATHEMATICA POLICY RESEARCH
53
IV. DATA SOURCES
The Nutrition Project impact evaluation will draw on a number of qualitative and quantitative data sources to measure project impacts and understand the reasons for those impacts. The principal data source for the impact analysis is the quantitative data that will be collected from households by a survey firm hired by MCA-I. These data will be supplemented with qualitative data, such as data from the implementation process study, special studies on issues of particular interest to MCC and MCA-I, and secondary sources such as administrative data. This chapter describes our data collection plans, proposes a method to measure implementation fidelity, discusses the various data sources we intend to draw on in the analysis, and describes our plans for ensuring data quality. Updated details about the data collection timing are in Annex B. That annex also includes sample sizes by respondent type for each round of data collection (baseline, interim, endline).
A. Data collection plans
This section provides an overview of the evaluation’s data collection efforts, shown in the time line in Figure IV.1. The surveys required for the impact analysis, the baseline and endline, are shown in dark blue. The implementation study and other special studies shown in light blue are proposed to potentially help understand some of the other questions of interest for MCC and MCA-I, should MCC or MCA-I choose to support these studies (these are not currently included in the evaluation budget). The proposed timing of these surveys is based on our current understanding of project implementation, and may shift depending on implementation progress. A full time line of the project implementation and evaluation is included in Chapter V.
Figure IV.1. Baseline data collection will take place in 2014, and there are two options for the timing of subsequent quantitative data collection rounds
Survey 2014 2015 2016 2017 2018 201
9
Quarter 3 4 1 2 3 4 1 2 3 4 1 2 3 4 1 2 3 4 1 2
Baseline
Implementation process study
Household dynamics study
Schooling study
Fidelity strengthening intervention
Option 1: Midline and endline
Option 2: Endline only
Quantitative baseline. This survey will collect information from households on pregnant women in their second or third trimester, and children 0–35 months. This survey will enable us
MCC INDONESIA NUTRITION PROJECT IMPACT EVALUATION DESIGN REPORT MATHEMATICA POLICY RESEARCH
54
to assess baseline equivalence between the treatment and control groups, and to control for any baseline differences in the ultimate impact analysis. The baseline will also include surveys with the sample desa and puskesmas staff, to gather information on their capacity, knowledge, and outreach activities, as described below. It is important that this survey take place as soon as possible so that it can accurately measure the key indicators before most of the project’s activities are implemented. The baseline is currently planned for late 2014.
Quantitative midline and endline. We propose a quantitative follow-up survey (midline) in late 2017 to assess the project’s impacts. The advantages of a survey in late 2017 (compared to an earlier date) are: (1) Generasi will have gone through four funding and implementation cycles, so one could see the longer-term effects of Generasi than had been shown in the 2011 impact evaluation (which just looked at two-year impacts);45 (2) some beneficiaries will be exposed to the full 1000 days of the project if desa-level work (other than Generasi) begins in 2015; (3) if interventions are implemented as expected with fidelity, research shows it is feasible to see stunting impacts within a two year timeframe (Bhutta, Ahmed et al. 2008); and (4) this will enable us to report impact findings within the Compact period.
If funding is available to support a midline (option 1), our current understanding of project implementation suggests that a late-2017 midline (proposed above) would be optimal to allow for project impacts to manifest. However, if we learn from the implementation study (discussed in the next paragraph) that implementation is progressing more rapidly than expected, we would recommend an earlier midline, say in 2016. In this case, an earlier midline would be valuable because projects can have nonlinear effects on beneficiaries—impacts might not materialize until initial minimum thresholds of exposure that are required, or projects could have diminishing marginal effects. This means that if project implementation is well underway, even in some areas, a long duration between the baseline and endline is likely to be costly in terms of understanding the true program effects and their dynamics over time, particularly in a steady state in which the program has been operating for a while (see, for example, King and Behrman 2009). For this reason it will be very important for implementers to track the date that each activity starts in each kecamatan (or even village), and to conduct a midline with an appropriate timing that is sufficiently delayed for impacts to materialize but not too delayed in case impacts fade over time.
If there is sufficient funding to support an additional follow up survey, we propose a post-Compact endline survey in late 2018 (option 1 in the chart above). This would make the 2017 survey a midline, which would demonstrate interim impacts or impacts on proximal indicators, whereas the endline survey would be used to analyze medium-term impacts. If there is insufficient funding to support two follow-up surveys, the 2017 survey will serve as the endline (option 2).46
45 We understand that PSF is currently planning a long-term follow-up in 2014, which would look at impacts
seven years after baseline.
46 It is possible to extend the endline until after 2019, say in 2020, if there is interest with MCA-I and MCC. However, it would be important to consider the status of the controls, especially if there are expansion plans for Generasi.
MCC INDONESIA NUTRITION PROJECT IMPACT EVALUATION DESIGN REPORT MATHEMATICA POLICY RESEARCH
55
Implementation study. We propose to conduct an implementation study in late 2015 or early 2016, relatively early in the implementation phase. This timing is intended to address the concerns (discussed in the Mathematica assessment report submitted in January 2014) that some stakeholders and evaluation team members expressed about implementation capacity, especially around the MIYCF training, water and sanitation training, micronutrient distribution, and implementation of kelas balita and kelas ibu hamil. For example, there was concern around whether the training or micronutrients would reach desa-level service providers like kader posyandu and bidan by 2014 and, even if desa-level service providers were trained, whether they would be applying what they learned in the field and/or promoting micronutrients. Conducting an implementation study at an early stage in implementation would generate systematic process information about implementation progress, such applications of the MIYCF training, whether communities have received micronutrients, and whether sanitation triggering events are occurring. These data would inform project implementation and later survey rounds. This study would take place after MCA-I confirms that the supply-side activities had begun at the desa level and that implementers had had ample opportunities to implement the project. While the focus of the study would be implementation in treatment areas, we recommend conducting the study in at least a few control areas so that we can learn about other relevant programming underway in these areas.
Household dynamics study. Although many of the interventions under this project are being targeted at mothers, some demand-side or behavior change components may more broadly reach other household decision makers such as husbands or grandparents who could play an influential role in child care and feeding practices. It is also possible that, as the program evolves, behavior change elements may be more directly targeted at some of these individuals, and it would be useful to learn about households’ decision-making process related to maternal and child care. Because MCC is particularly interested in how all household members could promote or hinder maternal and child nutrition, a qualitative study could examine some of the household dynamics questions that might not be feasibly measured as part of a quantitative survey. For example, it could include focus groups with fathers, heads of households or grandparents regarding their perceptions of and knowledge about breastfeeding, appropriate weight gain during pregnancy, intrahousehold resource allocation, and barriers to improved nutrition. It could also try to better understand barriers to improved nutrition, health care utilization and access, and sanitation and breastfeeding practices by women. It might be most cost-effective to undertake this study at the same time as the implementation study.
Schooling study. Another potential study could focus on schooling indicators, which will not be captured in the baseline or endline surveys. Several stakeholders, especially Bappenas, have raised concerns that the impact evaluation does not look at the enrollment and attainment effects from the Generasi component of the project. Such effects are important to measure because Generasi’s previous evaluation found no effects on either indicator, possibly due to survey timing and the nationwide trend of increased enrollment (Olken, Onishi, et al. 2012). However, these indicators will not be measured in the household survey because the sample population is too young and the sample size required to measure enrollment changes would be prohibitively large. Thus, we recommend working with MCA-I and MCC to develop a special study that would focus on a subsample of districts and use a combination of administrative data from Generasi and/or schools, and desa-level interviews with schools and community members to understand how Generasi affects schooling outcomes (enrollment and attainment but not
MCC INDONESIA NUTRITION PROJECT IMPACT EVALUATION DESIGN REPORT MATHEMATICA POLICY RESEARCH
56
learning). We propose conducting this study by the end of 2016, which would allow for nearly three cycles of Generasi to have taken place. If MCA-I, MCC and other stakeholders feel that 2016 is too soon, the survey could be conducted toward the end of the fourth round of Generasi funding in late 2017.
Fidelity strengthening intervention. Quality of implementation and fidelity are increasingly recognized as challenges to achieving program goals. This is particularly important for interventions requiring continuous beneficiary care and monitoring, such as the nutrition activities to be assessed as part of this impact evaluation. The Nutrition Project activities will be spread across 22 evaluation districts, 130 kecamatan, and multiple desa within each kecamatan such that fidelity of implementation is likely to be heterogeneous, and potentially low in some areas. As a result, despite the substantial investment in resources for program implementation and monitoring, limited impacts may be observed. We propose a fidelity strengthening intervention (FSI) to sustainably enhance fidelity and improve the project.
The FSI will enhance the capacity of existing frontline staff at the district level to rapidly improve implementation by using routine local health information from registries at the posyandu, puskesmas, and other points-of-care delivery. Staff will receive training and certification in data-driven management skills, enabling them to target action to enhance program implementation based on local needs. Specifically, the FSI will train frontline managers such as district health office (Dinas Kesehatan) staff, and puskesmas staff to sample and analyze registry data (e.g., at the puskesmas and posyandu) to identify gaps in coverage and care, and their underlying causes. This will include using tools for objective performance review, rapid audit, rapid data tabulation and lot quality assurance, management accountability, and transparency. Results from monthly analyses will be discussed with staff to identify actions that will again be reviewed in the iterative monthly process. Managers will apply their acquired coaching and staff mentoring skills to foster achievable and effective action plans. The ongoing feedback and more intense use of monitoring data are expected to improve impact, and the strategy will also help explain impact evaluation findings regarding underlying causes.
The FSI is based on successful quality improvement processes previously observed in health programs and organizations, including Total Quality Management, Continuous Quality Improvement, Business Process Reengineering, and Six Sigma. All share a common characteristic of the rapid use of local information as a foundation for improving impact (Powell, Davies, et al. 2003). Indeed, large-scale review and use of health-related data can improve system-level performance (Fleurant, Kell, et al. 2011).
We propose to have the FSI focus on 1–2 kabupaten in the evaluation sample, with the kabupaten chosen based on interest and willingness to implement. Implementation would require that the Ministry of Health, MCA-I, and an implementation research group hired by MCA-I work very closely together to ensure optimal implementation fidelity and continuous feedback loops to improve project implementation. All parties would use existing staff and data systems, and strengthen existing structures. Data collection would be the responsibility of the Ministry of Health (at the kabupaten, kecamatan, and desa levels), with support from an implementation research group hired and managed by MCA-I. The data would mostly be practical, output-level data used for service delivery, such as the number of follow-up visits conducted by bidan or kader posyandu, number of women exclusively breastfeeding, number of micronutrients
MCC INDONESIA NUTRITION PROJECT IMPACT EVALUATION DESIGN REPORT MATHEMATICA POLICY RESEARCH
57
distributed, changes in service coverage, quality of data supplied, and speed of decision making and improvements based on feedback. Naturally, these data will be collected as part of MCA-I’s Monitoring and Evaluation system, but these data would be specific to the kabupaten and collected with the sole purpose of implementation improvement and project management. The parties responsible for data collection, with support from MCA, MCC, and Mathematica, would work with district and puskesmas staff to analyze the data and disseminate the findings to again improve implementation. We propose that FSI be designed and deployed in late 2015 to permit identification of bottlenecks in coverage and impact, and the related processes.
The FSI is different from the implementation process study in that the FSI is an intervention in itself (district-, puskesmas-, and village-level staff would be trained and supported) with the objective of improving implementation quality, and the FSI applies to a limited number of districts and kecamatan. The implementation process study is more of a stock-taking of the implementation of the project in its existing form, with diversity in the location of the kecamatan studied and the objective of sharing broader lessons to help the project improve implementation. Naturally, both have the objective of implementation strengthening, but they go about it in different ways. This approach provides the opportunity to observe optimal program impact under conditions likely to be achievable within resources and personnel currently on the ground, and within the context of government services in the future.
B. Data needs
Above, we outlined the timing and the purpose of various proposed surveys. This section describes the different types of data or rather survey content that we propose MCC and MCA-I collect through primary source surveys and through secondary sources.
1. Primary quantitative sources
As described in Chapter III, we recommend that household survey be conducted with 4,560 households for the baseline and 9,120 households for the endline across 22 kabupaten in three provinces. The survey will include three modules: a household module that will be administered to all households, a pregnant women module only administered to pregnant women, and a caregiver module only administered to the primary caregiver(s) of children 0–35 months.47 An overview of some of the variables or indicators included in each module and the approximate length of the surveys are outlined in Table IV.1 below. This list is illustrative and will be further refined as we work with MCC and MCA-I to draft the questionnaires, considering priorities for measuring impact and cost/survey length.
47 Given average birth intervals in Indonesia, we expect that each household in the sample will have either a
pregnant woman OR a child 0–35 months. (According to the DHS 2013, the median number of months preceding the last birth across Indonesia is 60.2 months. In the study provinces, it is 60.6 in West Kalimantan, 63.2 in Central Kalimantan, and 62.7 in South Sumatra.) In the cases in which both sample populations are present, the survey firm will randomly select which sample category the household becomes part of. No household will be administered both modules.
MCC INDONESIA NUTRITION PROJECT IMPACT EVALUATION DESIGN REPORT MATHEMATICA POLICY RESEARCH
Table IV. 2 (continued)
58
Table IV.1. Household surveys focus on background information about the household, with modules for pregnant women and caregivers of children 0-35 months
HOUSEHOLD All respondents 80 minutes
Background information Household roster, location, age, schooling, employment of household members
Religion and ethnicity of household head
Literacy of household head
Income and assets Roof, wall material (proxy for income)
Asset inventory
Food security
Disturbances to household
Receipt of social benefits targeted at poor
Health insurance knowledge and participation
Health Water sources
Sanitation and hygiene practices, including hand washing
Knowledge of sanitation and hygiene best practices
Participation in triggering and/or CLTS-related events
Home environment and safety
Access to and use of health services (distance, time, travel cost)
Community engagement
Participation in community groups/activities
Contributions to public and private goods
Participation in social networks
Generasi (treatment group only)
Participation in Generasi planning and social mapping
Contributions to Generasi in terms of time, labor, and in-kind donations
PREGNANT WOMEN Second and third trimesters of pregnancy 30 minutes
Background Number of pregnancies
Birth history
Health Prenatal care: number of visits, information received, with whom
Where plan to deliver and with whom
Micronutrient and supplement use
Food recall of past week
Plans for delivery, breastfeeding and complementary feeding
Illness history
Household decision making
Household decision-making process around budgeting and food
Knowledge Breastfeeding and complementary feeding best practices
How to mitigate and treat stunting and diarrhea
Use of Taburia
Anthropometrics Height
Current and pre-pregnancy weight
MUAC
Hemoglobin level
MCC INDONESIA NUTRITION PROJECT IMPACT EVALUATION DESIGN REPORT MATHEMATICA POLICY RESEARCH
Table IV. 2 (continued)
59
CAREGIVER Children age 0–35 months 1 hour
Health services Number of pre and post natal visits and with whom
Location of delivery and by whom
Nutritional counseling received and frequency
Growth monitoring (number of length- and weight-taking visits)
Number of checkups child has had since birth
Nutrition Breastfeeding and complementary feeding history
Food recall in past week
Micronutrient and supplement use including vitamin A and iodized salt
Anthropometrics (of child)
Height or length
Weight
Birth weight (try to take from buku KIA/KMS)
Hemoglobin level
Household decision making
Household decision-making process around budgeting and food
Knowledge Breastfeeding and complementary feeding best practices
How to mitigate and treat stunting and diarrhea
Use of Taburia
Other Vaccination history
Diarrhea in last week and last four weeks
Other illness including worms
Caregiving practices
In addition to the conducting the household survey, MCC and MCA-I seek to capture desa and puskesmas capacity and health care use and access through community-level surveys. Such information would be used to provide context on implementation progress, to explain the magnitude of impacts, and to describe the array of projects under way in these areas with similar maternal and child health goals. Table IV.2 provides an illustrative overview of some of these indicators. Details about respondents for each survey (baseline, interim, endline) and sample sizes are in Annex B.
Table IV.2. Puskesmas and desa-level interviews will focus on capacity, knowledge, and outreach activities
PUSKESMAS Respondents will be head of puskesmas, nutritionist, sanitarian, and/or bidan coordinator
2.5 hours
Capacity Facility/equipment inventory (includes supplies, especially Taburia) Staff training and experience Staffing and number of pregnant women and children they see in a month Kecamatan access (remoteness, number of villages served by the kecamatan and
distance/cost to those villages) Service gaps (what the puskesmas is lacking in terms of staffing, equipment, and training) Percentage of identified cases of stunting, wasting, and underweight that are being treated
Knowledge Breastfeeding and complementary feeding best practices Sanitation and hygiene best practice How to mitigate and treat stunting and diarrhea
Other Outreach practices Roles and responsibilities of the bidan coordinator, nutritionist and sanitarian
MCC INDONESIA NUTRITION PROJECT IMPACT EVALUATION DESIGN REPORT MATHEMATICA POLICY RESEARCH
60
DESA STAFF Respondents will be kepala desa, kader desa, bidan, and/or kader posyandua
4 hours
Capacity Facilities/equipment inventory
Training and experience of kader posyandu and bidan
Number of pregnant women and children they see in a month
Access to puskesmas and other health services (distance, time, travel cost)
Service gaps (what the desa is lacking in terms of infrastructure, personnel, resources)
Relationship with the puskesmas (frequency of interaction, content of interaction)
Knowledge Breastfeeding and complementary feeding best practices
Sanitation and hygiene best practice
How to mitigate and treat stunting and diarrhea
Other What the respondents do in terms of outreach (how many times they visit households, who they speak to/target)
What practices they are promoting with mothers and children
Other maternal and child health programs in the desa
Interactions with and engagement of male caregivers
Frequency and attendance of kelas ibu hamil and kelas balita
Bidan-specific Whether they see private clients
Charge for services
Kader posyandu– specific
Frequency of posyandu meetings
Attendance levels at posyandu
aSome questions may be asked of just one respondent (for example, travel time to puskesmas), and others may be asked of all respondents individually (for example, what are the greatest health challenges in your village).
Depending on interest from MCC and MCA-I, the endline survey could also include other metrics that are excluded from the baseline survey due to sample size limitations, such as school readiness or a fathers’ module. A school readiness module would require an older sample of children in preschool or grade one that could be added to the endline. A fathers’ module would require a longer survey and more survey time. As described in Chapter II, there are some indicators, such as mortality, that we do not recommend collecting data on due to sample size limitations.
2. Primary sources for the implementation process study and special studies
We plan to work with MCC and MCA-I to collect data on various aspects of the Nutrition Project activities to enable us to answer specific research questions and to add depth of understanding to our quantitative analyses. The implementation process study, the household dynamics study, the schooling study, and the FSI, described above and in Table IV.2, are examples of studies that we recommend MCC and MCA-I commission. However, these are not exhaustive, and we will work with MCC and MCA-I to determine the most-appropriate studies based on the learning needs of the Compact and the organizations. For example, if the baseline analysis suggests some areas of inquiry suitable to in-depth qualitative exploration, MCC and MCA-I may also want to consider expanding the 2015/2016 implementation process study to include such questions. Similarly, as the intervention unfolds, a second round of qualitative study may be important to understand changes in implementation over time.
MCC INDONESIA NUTRITION PROJECT IMPACT EVALUATION DESIGN REPORT MATHEMATICA POLICY RESEARCH
61
Table IV.3. Examples of possible studies include implementation progress, household dynamics, schooling, and the fidelity strengthening intervention
Study Respondents and form
of data collection Content
Implementation progress
Interviews with bidan and kader posyandu, community officials, puskesmas staff, pregnant women, and caregivers. Mix of focus groups and key informant interviews.
MIYCF training experience and on-the-ground applications; timing and coverage of micronutrient distribution; number of sanitation triggering or socialization events; growth monitoring and sanitation training attendance by the community; attendance of kelas ibu hamil and kelas balita by the community; feedback on usefulness of kelas ibu hamil and kelas balita.
Household dynamics study
Separate focus groups with men, women, and grandparents
Perceptions of EBF, what food is nutritious, complementary feeding, barriers to behavior change, barriers to health care access, household decision-making process; gender roles in managing finances and purchasing decision making.
Schooling study Interviews with district officials, headmasters, community leaders, teachers, students, and Generasi facilitators
Teacher training and background; school facilities; enrollment and attendance rates; learning levels; barriers to enrollment; barriers to attendance; barriers to learning; gender disparities in the school.
Fidelity strengthening intervention
Main focus will be on health service providers and managers, so “respondents” would be district health officials, puskesmas staff, bidan, kader posyandu.
Strengthen existing monitoring and data collection systems to provide feedback to providers on responsibilities and performance. Design feedback loops such that providers can frequently improve implementation based on data.
3. Secondary sources
We will also draw on secondary data where possible to further complement primary sources and reduce survey costs. These sources will include the following:
Project documents such as training manuals, training tools, and operational plans
Monitoring data from MCA-I, including Generasi monitoring data that are submitted yearly
Administrative data on outcomes of interest to MCC such as mortality from Riskesdas (if available at the kecamatan level), and school enrollment, attainment and attendance from district administrative reports
Other data sources such as the Potensi Desa (Podes) 2011 survey, Demographic Health Survey (DHS) Indonesia 2013, and IFLS 2014 to provide context about national, province, kecamatan, and desa characteristics
C. Ensuring data quality
Mathematica, in partnership with MCA-I and MCC, is committed to ensuring that the data collected for the impact evaluation meet the highest data quality standards so that the results used for advising policy are precise and reliable. There are several steps that we collectively will undertake to ensure that data quality is maintained, including the following:
MCC INDONESIA NUTRITION PROJECT IMPACT EVALUATION DESIGN REPORT MATHEMATICA POLICY RESEARCH
62
Survey firm selection. We worked with MCC and MCA-I to draft terms of reference (ToR) for hiring a survey firm, and we will support MCA-I in selecting a survey firm with experience and commitment to data quality.
Questionnaire development based on existing surveys in Indonesia. We propose to draw on existing surveys (such as those used for the 2011 Generasi evaluation, DHS, IFLS, the PKH-Pestasi study supported by the National Team for Accelerating Poverty Reduction and other organizations, and Riskesdas) so that the Nutrition Project surveys can use questions that have already been tested in the survey locations, and so that some results are comparable across surveys. Surveys will measure not just outcomes, but proximal indicators that may show leading effects.
Piloting. We will work with the survey firm so that they conduct extensive questionnaire piloting to ensure that the questionnaires accurately represent, for example, the health status of children and pregnant women in Kalimantan and South Sumatra. We recommend that piloting occur in at least 48 households across two kecamatan and include mini-training, listing, fieldwork, and data entry. All key staff from the survey firm will be required to participate in the pilot.
Survey training. We will support the survey firm to ensure that the survey training is comprehensive and includes survey procedures; role playing and simulation; the household-, puskesmas- and desa-level questionnaires; practice with the data entry program; and field practice.
Data collection protocols. We will provide guidance to MCC and MCA-I so that the survey firm follows strict data collection protocols articulated in a well-written manual, especially data cleaning protocols. Manuals will include explanations of all survey questions, data collection protocols and procedures (for example, consent, guidelines around protection of human subjects, how to approach a household, building rapport, follow-up procedures if households require revisiting), and clear guidance on the use of anthropometric testing equipment, particularly hemoglobin-testing devices.
Back-checking. The survey firm ToR requires that survey firm supervisors back-check 10 percent of interviews to verify the information collected by the interviewers. Mathematica and MCA-I staff and/or several consultants who are involved for the duration of the fieldwork will also conduct back-checking and observe interviewing.
MCC INDONESIA NUTRITION PROJECT IMPACT EVALUATION DESIGN REPORT MATHEMATICA POLICY RESEARCH
63
V. ADMINISTRATION
Given the complexity of this multicomponent project and evaluation, careful management of the evaluation and time line is essential. In this section, we discuss several administrative issues relevant to the conduct of the evaluation and present a time line for evaluation activities.
A. Summary of IRB requirements and clearances
Mathematica is committed to protecting the rights and welfare of human subjects by obtaining approval from an Institutional Review Board (IRB) for relevant research activities. To ensure that the study meets local research standards for ethical clearance, we would like to pursue IRB approval from the Ethics Committee of Faculty of Medicine at the University of Indonesia. (More details about the process can be found in Annex A.) We have proposed this IRB because it is one of the leading institutes of health research in the country, and because our colleague Dr. Airin Roshita has a relationship with this faculty and will coordinate the submission with the board. We expect this process to take three months or less. If for any reason it becomes impossible to submit for clearance with the University of Indonesia, we would pursue IRB approval with Health Media Lab, which has been used before by our Mathematica colleagues on MCC projects.
The local survey firm hired by MCA-I will be responsible for obtaining relevant permits or clearances from the relevant national and/or local government offices before starting the field work. In addition, data collection must adhere to IRB guidelines and requirements, and thus the survey firm will have an opportunity to review the IRB application and protocol before it is sent for review (especially provide input on items such as the informed consent process) to the Faculty of Medicine. If the IRB recommends any changes, the survey firm, MCA-I, and Mathematica will work together to accommodate the changes, and all parties will agree on the final protocol.
B. Data file preparation
Mathematica will deliver a package of quantitative data to MCC for both the baseline and endline surveys (and the midline survey if it takes place). Each package will consist of three separate, well-documented, Stata data sets: a raw data file, a clean file suitable for internal use with complete, non-anonymized data, and a clean file suitable for public use with anonymized data. In addition, each package will include standardized metadata in the MCC Evaluation Metadata Template, enumerator and trainer manuals and questionnaires as specified in the MCC Data Anonymization Guidelines. All materials will be provided in English. MCC will make the data available for public use as per its policy (see http://data.mcc.gov/evaluations/index.php/catalog).
We will ensure that the public-use data sets maintain the privacy of survey respondents. To minimize the risk of disclosing sensitive information or the identity of survey respondents, the public data files will be anonymized by omitting some variables and replacing others with recoded or grouped data. These measures are designed to retain the usefulness of the data while preserving the privacy of survey respondents.
MCC INDONESIA NUTRITION PROJECT IMPACT EVALUATION DESIGN REPORT MATHEMATICA POLICY RESEARCH
64
C. Dissemination plan
To ensure that the results and lessons from the evaluation reach a wide audience, we will work with MCC and MCA-I to increase the visibility of the evaluation and findings. This effort will particularly be targeted to key stakeholders and policymakers, including PSF, the Ministry of Home Affairs, Bappenas, and others. The baseline and endline reports will present quantitative findings in formats that are clear and accessible to nontechnical audiences. We will work with MCA-I and MCC to disseminate the findings through a variety of forums, including in-country workshops and events, MCC meetings at MCC offices, and other development conferences. We will also write short issue briefs that can be translated into Indonesian depending on the audience, and prepare journal articles regarding impact findings. We expect that the first dissemination event would be after the baseline analysis, in mid to late 2015.
D. Evaluation team: roles and responsibilities
Our team will do its best to meet MCC and MCA-I’s evaluation needs. Dr. Anu Rangarajan leads the team as the program manager and oversees the design and implementation of the evaluation, working closely with and providing input to team members as necessary. Ms. Amanda Beatty and Dr. Clair Null, the deputy program managers, assume primary responsibility for coordinating deliverables and for ensuring the on-time completion of tasks within budget and with high quality. (Dr. Null is taking over for Ms. Beatty during 2014-15.) Dr. Evan Borkum directs the development of the evaluation design and works as the team’s lead economist. Ms. Anna Gage manages the project internally for Mathematica and supports research tasks. Dr. Airin Roshita, a nutrition expert at the University of Indonesia, is a local consultant and works closely with us, MCA-I and GoI stakeholders to ensure that the activities are implemented as planned. Ms. Sukhmani Sethi worked closely with our team to develop the survey firm ToR, write the design report, and will support training and oversight of the data collection. Dr. Anuraj Shankar is a senior analyst and nutrition specialist, and provides guidance on technical design aspects of the project. Dr. Elizabeth Frankenburg will assist in reviewing the survey to ensure quality, and Dr. Jere Behrman will review other key deliverables for quality, especially related to technical aspects of the evaluation design.
E. Implementation and evaluation time line and reporting schedule
An updated implementation timeline for the Project is in Annex B.
Figure V.1 displays the time line for the Nutrition Project implementation and evaluation. Planned activities are indicated in dark blue, and proposed or uncertain activities are indicated in light blue. As noted earlier, there are multiple components in this intervention, with different elements getting rolled out at different times. Training of Generasi facilitators began in early 2014, and social mapping, the facilitators’ first contact with communities, will begin in April 2014. The first tranche of Generasi funding will be received in the summer of 2014. MIYCF training of the trainers began in early 2014. However, due to the cascade model of training, it will take approximately one year to train the desa-level staff. The micronutrients and anthropometric kits will be delivered in late 2014.
MCC INDONESIA NUTRITION PROJECT IMPACT EVALUATION DESIGN REPORT MATHEMATICA POLICY RESEARCH
65
We anticipate the baseline survey will be conducted in the last quarter of 2014, after some of the Generasi training and socialization has occurred, and potentially after the Generasi grants are distributed. The delay in the baseline until after implementation begins poses a challenge to the evaluation, as discussed in Chapter III. However, we anticipate that the baseline will take place before many of the supply-side activities begin. The baseline data file and report will follow in mid-2015 for dissemination in late-2015. The implementation study and special studies would occur during the interim period from mid-2015 through the end of 2016. If the endline is conducted at the end of 2017, four rounds of Generasi grants will have been disbursed and the supply-side activities will have been implemented for three years. These results will be summarized and disseminated in mid-2018. If MCC and MCA-I decide to commission two rounds of follow-up data collection, a midline (in end of 2017/early 2018) and a post-Compact endline (in end of 2018/early 2019) will instead be conducted, and we will produce an interim report in mid-2018 and a final report in mid-2019.
66
Figure V.1. Tentative implementation and evaluation time line
MCC INDONESIA NUTRITION PROJECT IMPACT EVALUATION DESIGN REPORT MATHEMATICA POLICY RESEARCH
67
REFERENCES
Alderman, Harold and Jere R. Behrman. "Reducing the Incidence of Low Birth Weight in Low-Income Countries Has Substantial Economic Benefits." The World Bank Research Observer, vol. 21, no. 1, 2006, pp. 25-48.
Alderman, Harold, John Hoddinott, and Bill Kinsey. 2006. "Long term consequences of early childhood malnutrition." Oxford Economic Papers 58 (3): 450-474. https://academic.oup.com/oep/article-abstract/58/3/450/2279092.
Allen, L. H. “Anemia and Iron Deficiency: Effects on Pregnancy Outcome.” The American Journal of Clinical Nutrition, vol. 71, no. 5 Suppl, 2000, pp. 1280S–1284S.
Amin, Samia, Anu Rangarajan, and Evan Borkum. “Improving Sanitation at Scale: Lessons from TSSM Implementation in East Java, Indonesia.” Princeton, NJ: Mathematica Policy Research, June 2011.
Angrist, Joshua D., and Jörn-Steffen Pischke. Mostly Harmless Econometrics: An Empiricist’s Companion. Princeton, NJ: Princeton University Press, 2008.
Arcand, Jean-Louis, and Léandre Bassole. “Does Community Driven Development Work? Evidence from Senegal.” Halshs-00564574, version 1, 2011, Available at [http://hal.archives-ouvertes.fr/halshs-00564574/].
Arnold, B., S. Galliani, P. Ram, A. Hubbard, B. Briceño, P. Gertler, and J. Colford. “Optimal Recall Period for Caregiver-Reported Illness in Risk Factor and Intervention Studies: A Multicountry Study.” American Journal of Epidemiology, vol. 177, no. 4, 2013, pp. 361-370.
Baqui, A. H., R. E. Black, S. El Arifeen, M. Yunus, J. Chakraborty, S. Ahmed, and J. P. Vaughan. “Effect of Zinc Supplementation Started During Diarrhoea on Morbidity and Mortality in Bangladeshi Children: Community Randomised Trial.” BMJ (Clinical Research Ed.), vol. 325, no. 7372, 2002, pp. 1059.
Baqui, A. H., R. E. Black, M. D. Yunus, A. R. A. Hoque, H. R. Chowdhury, and R. B. Sack. “Methodological Issues in Diarrhoeal Diseases Epidemiology: Definition of Diarrheal Episodes.” International Journal of Epidemiology, vol. 20, no. 4, 1991, pp. 1057-1063.
Barron, Patrick, Macartan Humphreys, Laura Paler, and Jeremy Weinstein. “Community-Based Reintegration in Aceh: Assessing the Impacts of BRA-KDP.” Indonesian Social Development Paper No. 12. Washington, DC: World Bank, 2009. Available at [http://documents.worldbank.org/curated/en/2009/12/12022653/community-based-reintegration-aceh-assessing-impacts-bra-kdp].
Beard, J. L., M. K. Hendricks, E. M. Perez, L. E. Murray-Kolb, A. Berg, L. Vernon-Feagans, et al. “Maternal Iron Deficiency Anemia Affects Postpartum Emotions and Cognition.” The Journal of Nutrition, vol. 135, no. 2, 2005, pp. 267–272.
MCC INDONESIA NUTRITION PROJECT IMPACT EVALUATION DESIGN REPORT MATHEMATICA POLICY RESEARCH
68
Beatty, Amanda, Evan Borkum, Jeremy Brecher-Haimson, Erin Crossett, Nick Ingwersen, William Leith, Clair Null, and Swetha Sridharan. “MCC Indonesia Nutrition Project Impact Evaluation Interim Report.” Cambridge, MA: Mathematica Policy Research, August 2018.
Bhandari, Nita, Rajiv Bahl, Sarmila Mazumdar, Jose Martines, Robert E. Black, and Maharaj K. Bhan. “Effect of Community-Based Promotion of Exclusive Breastfeeding on Diarrhoeal Illness and Growth: A Cluster Randomised Controlled Trial.” The Lancet, vol. 361, no. 9367, 2003, pp. 1418–1423.
Bhutta, Zulfiqar A., Tahmeed Ahmed, Robert E. Black, Simon Cousens, Kathryn Dewey, Elsa Giugliani, Batool A. Haider, et al. “What Works? Interventions for Maternal and Child Undernutrition and Survival.” The Lancet, vol. 371, no. 9610, 2008, pp. 417–440.
Biran, Adam, Wolf‐Peter Schmidt, Richard Wright, Therese Jones, M. Seshadri, Pradeep Isaac, N. A. Nathan, Peter Hall, Joeleen McKenna, and Stewart Granger. “The Effect of a Soap Promotion and Hygiene Education Campaign on Handwashing Behaviour in Rural India: A Cluster Randomised Trial.” Tropical Medicine & International Health, vol. 14, no. 10, 2009, pp. 1303–1314.
Black, M., A. Baqui, K. Zaman, L. Ake Persson, S. El Arifeen, K. Le, S. McNary, M. Parveen, J. Hamadani, R. Black. “Iron and Zinc Supplementation Promote Motor Development and Exploratory Behavior Among Bangladeshi Infants.” American Journal of Clinical Nutrition, vol. 80, no. 4, 2004, pp. 903-910.
Black, Robert E., Lindsay H. Allen, Zulfiqar A. Bhutta, Laura E. Caulfield, Mercedes de Onis, Majid Ezzati, Colin Mathers, and Juan Rivera. “Maternal and Child Undernutrition: Global and Regional Exposures and Health Consequences.” The Lancet, vol. 371, no. 9608, 2008, pp. 243–260.
Black, Robert E., Cesar G. Victora, Susan P. Walker, Zulfiqar A. Bhutta, Parul Christian, Mercedes de Onis, Majid Ezzati, et al. “Maternal and Child Undernutrition and Overweight in Low-Income and Middle-Income Countries.” The Lancet, vol. 382, no. 9890, 2013, pp. 427–451.
Bloom, Howard S. “Accounting for No-Shows in Experimental Evaluation Designs.” Evaluation Review, vol. 8, no. 2, 1984, pp. 225–246.
Cairncross, S., C. Hunt, S. Boisson, K. Bostoen, V. Curtis, I. C. Fung, and W. P. Schmidt. “Water, Sanitation and Hygiene for the Prevention of Diarrhoea.” International Journal of Epidemiology, vol. 39 Suppl 1, 2010, pp. i193–i205.
Cameron, Lisa, Manisha Shah, and Susan Olivia. “Impact Evaluation of a Large-Scale Rural Sanitation Project in Indonesia.” Report No. 6360. The World Bank Sustainable Development Network Water and Sanitation Program, 2013.
Cameron, Lisa, Paula Lorgelly, Kompal Sinha, Rebekah Pinto, and Lubina Qureshy. “Cost Benefit Analysis of a Proposed Stunting Intervention in Indonesia.” Prepared by the World Bank and Monash University, 2013.
MCC INDONESIA NUTRITION PROJECT IMPACT EVALUATION DESIGN REPORT MATHEMATICA POLICY RESEARCH
69
Ceesay, S. M., A. M. Prentice, T. J. Cole, F. Foord, L. T. Weaver, E. M. Poskitt, and R. G. Whitehead. “Effects on Birth Weight and Perinatal Mortality of Maternal Dietary Supplements in Rural Gambia: 5 Year Randomised Controlled Trial.” BMJ (Clinical Research Ed.), vol. 315, no. 7111, 1997, pp. 786–790.
Chaudhury, Nazmul, and Jeffrey S. Hammer. “Ghost Doctors—Absenteeism in Bangladeshi Health Facilities,” Policy Research Working Paper Series 3065. Washington DC: World Bank, 2003.
Checkley, W., G. Buckley, R. H. Gilman, A. M. Assis, R. L. Guerrant, S. S. Morris, K. Molbak, et al. “Multi-Country Analysis of the Effects of Diarrhoea on Childhood Stunting.” International Journal of Epidemiology, vol. 37, no. 4, 2008, pp. 816–830.
Christian, Parul and James Tielsch. “Evidence for Multiple Micronutrient Effects Based on Randomized Controlled Trials and Meta-Analyses in Developing Countries.” The Journal of Nutrition, vol. 142, no. 1, 2012, pp. 1735-1775.
Crookston, B. T., M. E. Penny, S. C. Alder, T. T. Dickerson, R. M. Merrill, J. B. Stanford, C. A. Porucznik, and K. A. Dearden. “Children Who Recover from Early Stunting and Children Who Are Not Stunted Demonstrate Similar Levels of Cognition.” The Journal of Nutrition, vol. 140, no. 11, 2010, pp. 1996–2001.
Crookston, B. T., W. Schott, S. Cueto, K. A. Dearden, P. Engle, A. Georgiadis, E. A. Lundeen, M. E. Penny, A. D. Stein, and J. R. Behrman. “Postinfancy Growth, Schooling, and Cognitive Achievement: Young Lives.” The American Journal of Clinical Nutrition, vol. 98, no. 6, 2013, pp. 1555–1563.
Das, Jishnu, and Jeffrey Hammer. “Strained Mercy: Quality of Medical Care in Delhi.” Economic and Political Weekly, vol 34, no. 9, 2004, pp. 951–961.
Davies Adetugbo, Anita A. “Promotion of Breast Feeding in the Community: Impact of Health Education Programme in Rural Communities in Nigeria.” Journal of Diarrhoeal Diseases Research, vol. 14, no. 1, 1996.
De Onis, Mercedes, Monika Blössner, and Elaine Borghi. “Prevalence and Trends of Stunting Among Pre-School Children, 1990–2020.” Public Health Nutrition, vol. 15, no. 1, 2012, pp. 142–148.
de Pee, Saskia, Martin W. Bloem, R. Satoto Yip, Asmira Sukaton, Roy Tjiong, R. Shrimpton, and B. Muhilal Kodyat. “Impact of a Social Marketing Campaign Promoting Dark-Green Leafy Vegetables and Eggs in Central Java, Indonesia.” International Journal for Vitamin and Nutrition Research, vol. 68, no. 6, 1998, pp. 389–398.
de Pee, Saskia, Laura Irizarry, Klaus Kraemer, and Maria E. D. Jefferds. “Micronutrient Powder Interventions: The Basis for Current Programming Guidance and Needs for Additional Knowledge and Experience.” In Home Fortification with Micronutrient Powders. Basel, Switzerland: Sight and Life, 2013.
MCC INDONESIA NUTRITION PROJECT IMPACT EVALUATION DESIGN REPORT MATHEMATICA POLICY RESEARCH
70
DHS (Demographic and Health Survey). “Indonesia Demographic and Health Survey 2012.” Jakarta, Indonesia: Statistics Indonesia (Badan Pusat Statistik—BPS), National Population and Family Planning Board (BKKBN), and Kementerian Kesehatan (Kemenkes-MOH), and ICF International, 2013.
Deolalikar, Anil B. “Nutrition and Labor Productivity in Agriculture: Estimates for Rural South India.” The Review of Economics and Statistics, vol. 70, no. 3, 1988, pp. 406–413.
Departemen Kesehatan RI. “Riset Kesehatan Dasar: Riskesdas 2010.” Jakarta: Badan Penelitian dan Pengembangan Kesehatan, Departemen Kesehatan RI, 2010.
De-Regil, Luz M., Parminder S. Suchdev, Gunn E. Vist, Silke Walleser, and Juan P. Peña‐Rosas. “Home Fortification of Foods with Multiple Micronutrient Powders for Health and Nutrition in Children Under Two Years of Age (Review).” Evidence‐Based Child Health: A Cochrane Review Journal, vol. 8, no. 1, 2013, pp. 112–201.
Eilander, Ans, Tarun Gera, Harshpal Sachdev, Catherine Transler, Henk van der Knapp, Frans Kok, and Saskia Osendarp. “Multiple Micronutrient Supplementation for Improving Cognitive Performance in Children: Systematic Review of Randomized Controlled Trials.” The American Journal of Clinical Nutrition, vol. 91, no. 1, 2010, pp. 115-130.
Fleurant, M., R. Kell, J. Love, C. Jenter, L. A. Volk, F. Zhang, D. W. Bates, and S. R. Simon. “Massachusetts e-Health Project Increased Physicians’ Ability to Use Registries, and Signals Progress Toward Better Care.” Health Affairs (Project Hope), vol. 30, no. 7, 2011, pp. 1256–1264.
George, S. M., M. C. Latham, E. A. Frongillo, R. Abel, and N. Ethirajan. “Evaluation of Effectiveness of Good Growth Monitoring in South Indian Villages.” The Lancet, vol. 342, no. 8867, 1993, pp. 348–352.
Gera, Tarun and H.P.S Sachdev. “Effect of iron supplementation on incidence of infectious illness in children: systematic review.” BMJ, 2002, 325:1142.
Gertler, Paul, Christel Vermeersch, D. de Walque, P. J. Gertler, S. Bautista-Arredondo, A. Kwan, J. D. Bizimana, A. Binagwaho, J. Condo, and M. Evangeli. “Using Performance Incentives to Improve Health Outcomes.” Policy Research Working Paper 6100, Impact Evaluation Series No. 60. Washington, DC: World Bank, June 2012.
Glewwe, Paul, and Elizabeth M. King. “The Impact of Early Childhood Nutritional Status on Cognitive Development: Does the Timing of Malnutrition Matter?” The World Bank Economic Review, vol. 15, no. 1, 2001, pp. 81–113.
Grayman, J. H., N. Anggraini, and S. Ruhanawati. “Opportunities and Approaches for Better Nutrition Outcomes in PNPM Generasi.” Jakarta: Coordinating Ministry for People’s Welfare in Cooperation with PNPM Support Facility, 2014.
MCC INDONESIA NUTRITION PROJECT IMPACT EVALUATION DESIGN REPORT MATHEMATICA POLICY RESEARCH
71
Guerrant, D. I., S. R. Moore, A. A. Lima, P. D. Patrick, J. B. Schorling, and R. L. Guerrant. “Association of Early Childhood Diarrhea and Cryptosporidiosis with Impaired Physical Fitness and Cognitive Function Four–Seven Years Later in a Poor Urban Community in Northeast Brazil.” The American Journal of Tropical Medicine and Hygiene, vol. 61, no. 5, 1999, pp. 707–713.
Haider, B. A., and Z. A. Bhutta. “Multiple-Micronutrient Supplementation for Women During Pregnancy.” Cochrane Database of Systematic Reviews, vol. 11, 2012.
Haider, Rukhsana, Ann Ashworth, Iqbal Kabir, and Sharon R. Huttly. “Effect of Community-Based Peer Counsellors on Exclusive Breastfeeding Practices in Dhaka, Bangladesh: A Randomised Controlled Trial.” The Lancet, vol. 356, no. 9242, 2000, pp. 1643–1647.
Hoddinott, John, Harold Alderman, Jere R. Behrman, Lawrence Haddad and Susan Horton. "The Economic Rationale Forinvesting in Stunting Reduction." Maternal and Child Nutrition, 9(Suppl. 2), 2013, pp. 69-82.
Hoddinott, John, Jere R. Behrman, John A. Maluccio, Paul Melgar, Agnes R. Quisumbing, Manuel Ramirez-Zea, Aryeh D. Stein, Kathryn M. Yount and Reynaldo Martorell. "Adult Consequences of Growth Failure in Early Childhood." The American Journal of Clinical Nutrition, 98(5), 2013, pp. 1170-78.
Horta, Bernardo L., Rajiv Bahl, José C. Martines, and Cesar G. Victora. Evidence on the Long-Term Effects of Breastfeeding: Sytematic Reviews and Meta-Analyses. Geneva: World Health Organization, 2007.
Humphrey, J. H. 2009. “Child Undernutrition, Tropical Enteropathy, Toilets, and Handwashing.” Lancet, vol. 374, no. 9694, 2009, pp.1032-1035.
Imdad, Aamer, and Zulfiqar A. Bhutta. “Routine Iron/Folate Supplementation During Pregnancy: Effect on Maternal Anaemia and Birth Outcomes.” Paediatric and Perinatal Epidemiology, vol. 26, no. s1, 2012, pp. 168–177.
Interagency Anemia Steering Group. “Anemia Prevention and Control: What Works – Part I, Program Guidance.” June 2003. Available at [http://siteresources.worldbank.org/NUTRITION/Resources/281846-1090335399908/Anemia_Part1.pdf]. Accessed September 3, 2014.
James, W. P., A. Ferro-Luzzi, and J. C. Waterlow. “Definition of Chronic Energy Deficiency in Adults. Report of a Working Party of the International Dietary Energy Consultative Group.” European Journal of Clinical Nutrition, vol. 42, no. 12, 1988, pp. 969–981.
Jayachandran, S. and R. Pande. “Why Are Indian Children Shorter Than African Children?” Evanston, IL: Northwestern University, 2013.
Khan, W. U., and D. W. Sellen. “Zinc Supplementation in the Management of Diarrhoea.” e-Library of Evidence for Nutrition Actions, World Health Organization. Available at [http://www.who.int/elena/titles/bbc/zinc_diarrhoea/en/]. Accessed April 17, 2014.
MCC INDONESIA NUTRITION PROJECT IMPACT EVALUATION DESIGN REPORT MATHEMATICA POLICY RESEARCH
72
King, Elizabeth M. and Jere R. Behrman. "Timing and Duration of Exposure in Evaluations of Social Programs." World Bank Research Observer, vol. 24, no. 1, 2009, pp. 55-82.
Knops, Noël B., Kommer C. Sneeuw, Ronald Brand, Elysee T. Hille, A. L. den Ouden, Jan-Maarten Wit, and S. P. Verloove-Vanhorick. “Catch-Up Growth up to Ten Years of Age in Children Born Very Preterm or with Very Low Birth Weight.” BMC Pediatrics, vol. 5, no. 1, 2005, p. 26.
Kramer, Michael S., Beverley Chalmers, Ellen D. Hodnett, Zinaida Sevkovskaya, Irina Dzikovich, Stanley Shapiro, Jean-Paul Collet, Irina Vanilovich, Irina Mezen, and Thierry Ducruet. “Promotion of Breastfeeding Intervention Trial (PROBIT): A Randomized Trial in the Republic of Belarus.” Journal of the American Medical Association, vol. 285, no. 4, 2001, pp. 413–420.
Kramer, M.S., and R. Kakuma. “Optimal Duration of Exclusive Breastfeeding.” Cochrane Database of Systematic Reviews 2002, Issue 1. Ar. No.: CD003517. DOI: 10.1002/14651858.CD003517.
Lin, A., B. Arnold, S. Afreen, R. Goto, T. Huda, R. Haque, R. Raqib, L. Unicomb, T. Ahmed, J. Colford, and S. Luby. “Household Environmental Conditions Are Associated with Enteropathy and Impaired Growth in Rural Bangladesh.” American Journal of Tropical Medicine and Hygiene, vol. 89, no. 1, 2013, pp. 130-137.
Lundeen, Elizabeth, Cholpon Imanalieva, Tursun Mamyrbaeva, and Arnold Timmer. “Integrating Micronutrient Powder into a Broader Child Health and Nutrition Program in Kyrgyzstan.” In Home Fortification with Micronutrient Powders. Basel, Switzerland: Sight and Life, 2013, pp. 23.
Maccini, Sharon, and Dean Yang. “Under the Weather: Health, Schooling, and Economic Consequences of Early-Life Rainfall.” The American Economic Review, 2009, pp. 1006–1026.
Mansuri, Ghazala, and Vijayendra Rao. Localizing Development: Does Participation Work? Washington, DC: World Bank, 2012. Available at [https://openknowledge.worldbank.org/ handle/10986/11859].
Martínez, Rodrigo, and Andrés Fernández. 2008. “The Cost of Hunger: Social and Economic Impact of Child Undernutrition in Central America and the Dominican Republic,” February. https://repositorio.cepal.org/handle/11362/39315.
Martorell, R., L. K. Khan, and D. G. Schroeder. “Reversibility of Stunting: Epidemiological Findings in Children from Developing Countries.” European Journal of Clinical Nutrition, vol. 48 Suppl 1, 1994, pp. S45–57.
McDade, Thomas W., Sharon Williams, and Josh J. Snodgrass. “What a Drop Can Do: Dried Blood Spots as a Minimally Invasive Method for Integrating Biomarkers into Population-Based Research.” Demography, vol. 44, no. 4, 2007, pp. 899–925.
MCC INDONESIA NUTRITION PROJECT IMPACT EVALUATION DESIGN REPORT MATHEMATICA POLICY RESEARCH
73
McKay, S., E. Gaudier, D. I. Campbell, A. M. Prentice, R. Albers. “Environmental Enteropathy: New Targets for Nutritional Interventions.” International Health, vol. 2, no. 3, 2010, pp. 172-180.
McLaughlin, Karrie, Adam Satu, and Michael Hoppe. “Kecamatan Development Program Qualitative Impact Evaluation.” Jakarta: World Bank, 2007.
Michaelsen, Kim F. “Complementary Feeding of Young Children in Developing Countries: A Review of Current Scientific Knowledge.” The American Journal of Clinical Nutrition, vol. 71, no. 2, 2000, pp. 605–606.
Miller, Grant, and Kimberly S. Babiarz. “Pay-for-Performance Incentives in Low- and Middle-Income Country Health Programs.” Working Paper 18932. Cambridge, MA: National Bureau of Economic Research, 2013.
Mize, Lucy. “The Paradox of the Posyandu: Challenges for Community Health Services in Indonesia.” Canberra City: AusAID, Health Resource Facility, 2012.
Mora, J. O., B. de Paredes, M. Wagner, L. de Navarro, J. Suescun, N. Christiansen, and M. G. Herrera. “Nutritional Supplementation and the Outcome of Pregnancy. I. Birth Weight.” The American Journal of Clinical Nutrition, vol. 32, no. 2, 1979, pp. 455–462.
MICS (Multiple Indicator Cluster Surveys). MICS1. “Indonesia.” Report No. 1. 1995. Available at [http://www.unicef.org/statistics/index_24302.html].
Nandi, Arindam, Jere R. Behrman, Sonia Bhalotra, Anil B. Deolalikar, and Ramanan Laxminarayan. 2016. “Part 5: The Economics of Child Development. The Human Capital and Productivity Benefits of Early Childhood Nutritional Interventions.” In Disease Control Priorities, 3rd ed., 9:385–402. Washington, D.C.: The World Bank. http://dcp-3.org/sites/default/files/chapters/DCP3%20CAHD_Ch%2027.pdf.
Nyaradi, Anett, Li Jianghong, Siobhan Hickling, Jonathan Foster, and Wendy Oddy. “The Role of Nutrition in Children’s Neurocognitive Development, from Pregnancy through Childhood.” Frontiers in Human Neuroscience, vol. 7, no. 97. doi http://journal.frontiersin.org/Journal/10.3389/fnhum.2013.00097/full
Olken, Benjamin A., Junko Onishi, and Susan Wong. “Indonesia’s PNPM Generasi Program Final Impact Evaluation Report.” Report No. 69142. Jakarta: World Bank, 2012.
Olken, Benjamin A., Junko Onishi, and Susan Wong. “Should Aid Reward Performance? Evidence from a field experiment on health and education in Indonesia.” No. w17892. National Bureau of Economic Research, 2013.
Peabody, J. W., R. Shimkhada, S. Quimbo, O. Solon, X. Javier, and C. McCulloch. “The Impact of Performance Incentives on Child Health Outcomes: Results from a Cluster Randomized Controlled Trial in the Philippines.” Health Policy and Planning, October 17, 2013.
MCC INDONESIA NUTRITION PROJECT IMPACT EVALUATION DESIGN REPORT MATHEMATICA POLICY RESEARCH
74
Penny, Mary E., Hilary M. Creed-Kanashiro, Rebecca C. Robert, M. R. Narro, Laura E. Caulfield, and Robert E. Black. “Effectiveness of an Educational Intervention Delivered Through the Health Services to Improve Nutrition in Young Children: A Cluster-Randomised Controlled Trial.” The Lancet, vol. 365, no. 9474, 2005, pp. 1863–1872.
Pinfold, J. V. “Analysis of Different Communication Channels for Promoting Hygiene Behaviour.” Health Education Research, vol. 14, no. 5, 1999, pp. 629–639.
Powell, A. E., H. T. Davies, and R. G. Thomson. “Using Routine Comparative Data to Assess the Quality of Health Care: Understanding and Avoiding Common Pitfalls.” Quality & Safety in Health Care, vol. 12, no. 2, 2003, pp. 122–128.
Pradhan, Menno, Vijayendra Rao, and Cristina Rosemberg. “The Impact of the Community Level Activities of the Second Urban Poverty Project (UPP).” Department of Economics, University of Amsterdam, Amsterdam, 2010.
Prado, E. L., Alcock, K. J., Muadz, H., Ullman, M. T., Shankar, A. H., & SUMMIT Study Group. Maternal multiple micronutrient supplements and child cognition: A randomized trial in Indonesia. Pediatrics, 130(3), 2012, e536-e546.
Prado, E. L., Ullman, M. T., Muadz, H., Alcock, K. J., Shankar, A. H., & SUMMIT Study Group. “The effect of maternal multiple micronutrient supplementation on cognition and mood during pregnancy and postpartum in Indonesia: A randomized trial.” PloS One, 7(3), e32519, 2012.
Rah, J. H., S. De Pee, K. Kraemer, G. Steiger, M. W. Bloem, P. Spiegel, C. Wilkinson, and O. Bilukha. “Program Experience with Micronutrient Powders and Current Evidence.” The Journal of Nutrition, vol. 142, no. 1, 2012, pp. 191S–6S.
Ramakrishnan, Usha, Tamar Goldenberg, and Lindsay Allen. “Do Multiple Micronutrient Interventions Improve Child Health, Growth, and Development?” The Journal of Nutrition, vol. 141, no. 11, 2011, pp. 2066-2075.
Rasmussen, K. “Is There a Causal Relationship Between Iron Deficiency or Iron-Deficiency Anemia and Weight at Birth, Length of Gestation and Perinatal Mortality?” The Journal of Nutrition, vol. 131, no. 2S-2, 2001, pp. 590S–601S; discussion 601S–603S.
Rasmussen, K. M., and J. P. Habicht. “Maternal Supplementation Differentially Affects the Mother and Newborn.” The Journal of Nutrition, vol. 140, no. 2, 2010, pp. 402–406.
Ruel, M. T., J. P. Habicht, P. Pinstrup-Andersen, and Y. Grohn. “The Mediating Effect of Maternal Nutrition Knowledge on the Association Between Maternal Schooling and Child Nutritional Status in Lesotho.” American Journal of Epidemiology, vol. 135, no. 8, 1992, pp. 904–914.
Ruel, Marie T., and Harold Alderman. “Nutrition-Sensitive Interventions and Programmes: How Can They Help to Accelerate Progress in Improving Maternal and Child Nutrition?” The Lancet, vol. 382, no. 9891, 2013, pp. 536–551.
MCC INDONESIA NUTRITION PROJECT IMPACT EVALUATION DESIGN REPORT MATHEMATICA POLICY RESEARCH
75
Saaka, M. “Maternal dietary diversity and infant outcome of pregnant women in northern Ghana.” International Journal, 1(2), 2012, p. 149.
Saha, K., R. Rawat, A. Khaled, R. Haque, K. Afsana, T. Sanghvi, M. Ruel, and P. Menon. “A Comprehensive Training and Supervision Program Improved Frontline Health Workers’ Knowledge of Infant and Young Child Feeding in Rural Bangladesh.” Annals of Nutrition and Metabolism. Vol. 63, 2013.
Salam, R. A., C. MacPhail, J. K. Das, and Z. A. Bhutta. “Effectiveness of Micronutrient Powders (MNP) in Women and Children.” BMC Public Health, vol. 13, Suppl 3, 2013, p. S22.
Sazawal, Sunil, Robert Black, Mahdi Ramsan, Hababu Chwaya, Rebecca Stoltzfus, Arup Dutta, Usha Dhingra, Ibrahim Kabole, Saikat Deb, Mashavi Othman, and Fatma Kabole. “Effects of Routine Prophylactic Supplementation with Iron and Folic Acid on Admission to Hospital and Mortality in Preschool Children in a High Malaria Transmission Setting: Community-based, Randomized, Placebo-controlled Trial.” Lancet, vol. 376, 2006, pp. 133-143.
Schmidt, W. P., B. Arnold, S. Boisson, B. Genser, S. P. Luby, M. L Barreto, T. Clasen, S. Cairncross. “Epidemiological Methods in Diarrhoea Studies – An Update.” International Journal of Epidemiology, vol. 40, no. 6, 2011, pp. 1678-1692.
Scott, B. E., W. P. Schmidt, R. Aunger, N. Garbrah-Aidoo, and R. Animashaun. “Marketing Hygiene Behaviours: The Impact of Different Communication Channels on Reported Handwashing Behaviour of Women in Ghana.” Health Education Research, vol. 23, no. 3, 2008, pp. 392–401.
Shankar, Anuraj, A. B. Jahari, S. K. Sebayang, M. A. Aditiawarman, B. Harefa, H. Muadz, S. D. A. Soesbandoro, et al. “Effect of Maternal Multiple Micronutrient Supplementation on Fetal Loss and Infant Death in Indonesia: A Double-Blind Cluster-Randomised Trial ” Lancet, vol. 371, 2008, pp. 215–227.
Snyder, Leslie B. “Health Communication Campaigns and Their Impact on Behavior.” Journal of Nutrition Education and Behavior, vol. 39, no. 2, 2007, pp. S32–S40.
Soofi, Sajid, S. Cousens, S. P. Iqbal, T.Akhund, J. Khan, I. Ahmed, A.K.M. Zaidi, Z.A. Bhutta. “Effect of provision of daily zinc and iron with several micronutrients on growth and morbidity among young children in Pakistan: a cluster-randomised trial.” The Lancet, vol 382, 2013, pp. 29-40.
Spears, Dean. “How Much International Variation in Child Height Can Sanitation Explain?” Policy Research Working Paper 6351. Washington, DC: World Bank, February 2013.
Spears, Dean. “Effects of Rural Sanitation on Infant Mortality and Human Capital: Evidence from India’s Total Sanitation Campaign.” Princeton, NJ: Princeton University, 2012.
MCC INDONESIA NUTRITION PROJECT IMPACT EVALUATION DESIGN REPORT MATHEMATICA POLICY RESEARCH
76
Stewart, C. P., L. Iannotti, K. G. Dewey, K. F. Michaelsen, and A. W. Onyango. “Contextualizing Complementary Feeding in a Broader Framework for Stunting Prevention.” Maternal and Child Nutrition, vol. 9, no. Suppl 2, 2013, pp. 27–45.
Stoltzfus, R. J., L. Mullany, and R. E. Black. “Iron Deficiency Anaemia.” In Comparative Quantification of Health Risks: Global and Regional Burden of Disease Attributable to Selected Major Risk Factors, vol. 1, edited by Majid Ezzati, Alan D. Lopez, Anthony Rodgers, and Christopher J. L. Murray, pp. 163–209. Geneva: World Health Organization, 2004.
Taksande, A., S. Tiwari, and A. Kuthe. “Knowledge and Attitudes of Anganwadi Supervisor Workers about Infant (Breastfeeding and Complementary) Feeding in Gondia District.” Indian Journal of Community Medicine: Official Publication of Indian Association of Preventive & Social Medicine, vol. 34, no. 3, 2009, pp. 249–251.
Thompson, Brian, and Leslie Amoroso, eds. Combating Micronutrient Deficiencies: Food-Based Approaches. Rome: Food and Agriculture Organization and CAB International, 2011.
UNICEF (United Nations Children’s Fund). “The State of the World’s Children 2012: Children in an Urban World.” New York: UNICEF, 2012.
———. “Nutrition: Breastfeeding.” Available at [http://www.unicef.org/nutrition/ index_24824.html]. Accessed April 17, 2014.
Vanchinkhuu, Surenchimeg, Bolormaa Norov, and Gereljargal Bat. “Home Fortification in Large-Scale Programs.” In Home Fortification with Micronutrient Powders. p. 18. Basel, Switzerland: Sight and Life, 2013.
Ververs, M. T., A. Antierens, A. Sackl, N. Staderini, and V. Captier. “Which Anthropometric Indicators Identify a Pregnant Woman as Acutely Malnourished and Predict Adverse Birth Outcomes in the Humanitarian Context?” PLoS Currents, vol. 5, 2013.
Victora, Cesar G., Linda Adair, Caroline Fall, Pedro C. Hallal, Reynaldo Martorell, Linda Richter, and Harshpal S. Sachdev. “Maternal and Child Undernutrition: Consequences for Adult Health and Human Capital.” The Lancet, vol. 371, no. 9609, 2008, pp. 340–357.
Victora, Cesar Gomes, Mercedes de Onis, Pedro Curi Hallal, Monika Blössner and Roger Shrimpton. "Worldwide Timing of Growth Faltering: Revisiting Implications for Interventions." Pediatrics 2010.
Voss, John. “Impact Evaluation of the Second Phase of the Kecamatan Development Program in Indonesia.” Working Paper 45590. Jakarta: World Bank, June 2008.
Walker, C. L., and R. E. Black. “Zinc for the Treatment of Diarrhoea: Effect on Diarrhoea Morbidity, Mortality and Incidence of Future Episodes.” International Journal of Epidemiology, vol. 39, suppl 1, 2010, pp. i63–i69.
MCC INDONESIA NUTRITION PROJECT IMPACT EVALUATION DESIGN REPORT MATHEMATICA POLICY RESEARCH
77
West Jr., K. P., Shamim, A. A., Labrique, A. B., Ali, H., Shaikh, S., Mehra, S., et al. “Efficacy of Antenatal Multiple Micronutrient (MM) vs Iron-Folic Acid (IFA) Supplementation in Improving Gestational and Postnatal Viability in Rural Bangladesh: The JiVitA-3 Trial.” The FASEB Journal, vol. 27, April 2013, p. 358.6.
Winkvist, A., H. Stenlund, M. Hakimi, D. S. Nurdiati, and M. J. Dibley. “Weight-Gain Patterns from Prepregnancy Until Delivery Among Women in Central Java, Indonesia.” The American Journal of Clinical Nutrition, vol. 75, no. 6, 2002, pp. 1072–1077.
Wong, Susan. “What Have Been the Impacts of World Bank Community-Driven Development Programs? CDD Impact Evaluation Review and Operational & Research Implications.” Washington, DC: World Bank, 2012.
Wooldridge, Jeffrey M. Econometric Analysis of Cross Section and Panel Data. Cambridge, MA: MIT Press, 2010.
WHO (World Health Organization). “Nutrition Landscape Information System (NLIS) Country Profile Indicators: Interpretation Guide.” Geneva: World Health Organization, 2010.
———. “Iron Deficiency Anaemia: Assessment, Prevention and Control.” Report No. HWO/NHD/01.3. Geneva: World Health Organization, 2011.
———. “Guideline: Use of Multiple Micronutrient Powders for Home Fortification of Foods Consumed by Infants and Children 6-23 Months of Age.” Geneva. 2011.
———.“Infant and Young Child Feeding, Fact sheet no. 342.” Updated February 2014. Available at [http://www.who.int/mediacentre/factsheets/fs342/en/]. Accessed April 17, 2014.
Zlotkin, Stanley H., Claudia Schauer, Anna Christofides, Waseem Sharieff, Mélody C. Tondeur, and S. M. Ziauddin Hyder. “Micronutrient Sprinkles to Control Childhood Anaemia.” PLoS Medicine, vol. 2, no. 1, 2005, pp. e1.
Zlotkin, Stanley, Samuel Newton, Ashley Aimone, Irene Azindow, Seeba Amenga-Etego, Kofi Tchum, Emmanuel Mahama, Kevin Thorpe, and Seth Owusu-Agyei. “Effect of Iron Fortification on Malaria Incidence in Infants and Young Children in Ghana: A Randomized Trial.” JAMA, vol. 310, no. 9, 2013, pp. 938-947.
This page left blank for double sided copying.
MCC INDONESIA NUTRITION PROJECT IMPACT EVALUATION DESIGN REPORT MATHEMATICA POLICY RESEARCH
A-1
ANNEX A. IRB INFORMATION
Mathematica proposes to seek IRB approval for the Nutrition Project evaluation from the Health Research Ethics Committee of the Faculty of Medicine at the University of Indonesia.1 The Ethics Committee is an independent body set up to oversee research on human subjects in compliance with the International Convention on Harmonization of Good Clinical Trial Practice (ICH-GCP). It also ensures compliance with Indonesian research ethics standards set out in Health Act No. 23/1992 and Government Regulation No. 39/1995 on Health Research and Development.
The Committee is composed of faculty, members of outside institutions and laymen. Current members include:
1. Prof. Dr. dr. Rianto Setiabudy, SpFK - Chairman - Science Pharmacology & Therapeutics
2. dr. Muchtarudin Mansyur, SPOK, PhD - Vice Chairman - Community Medicine 3. dr. Nafrialdi, PhD, SpPD - Secretary - Pharmacology & Therapeutic Sciences 4. Prof. Dr. dr. Rita Sita Sitorus, SpM (K) - Member - Eye Health Sciences 5. dr. Kusmarinah Bramono, PhD, SpKK (K) - Member - Dermatology and Venereology 6. Dr. dr. Ratna Dwi Restuti, SpTHT - Member - ENT Medicine 7. Dr. dr. Imam Effendi, SpPD, KGH - Member - Internal Medicine 8. Dr. dr. Murdani Abdullah, SpPD, KGEH - Member - Internal Medicine 9. Dr. Dini Widiarni Widodo, SpTHT. MEpid - Member - ENT Medicine 10. Dr. dr. Andri Maruli tua Lubis, SpOT (K) - Member - Orthopedic Surgery 11. Dr. dr. Suryanto Sidik, SpPD, KGEH - Member - RSAL Mintoharjo 12. dr. Gatot Purwoto, SpOG (K) - Member - Obstetrics and Gynecology 13. Drh. Endi Ridwan, MS - Member - Nutrition Research and Development, Bogor 14. Drh. Safarina G. Malik, MS, PhD - Member - Eijkman Institute 15. Dr. Dra. Dwi Anita Suryandari, M.Biomed - Member - Biological Medicine 16. dr. Ade Firmansyah, SPF - Members - Science & Medical Forensics 17. dr. Nia Kurniati, SpA (K) - Member - Pediatrics 18. R. Mgd. Rajeni P. Tolani - Lay Member 19. Sulistyawati Siregar - Lay Member
1 See http://www.fk.ui.ac.id/?page=content.view&alias=ethic_commitee&lang=id for the Indonesian webpage
and http://www.fk.ui.ac.id/?page=content.view&alias=ethic_commitee&lang=en for the English translation.
This page left blank for double sided copying.
MCC INDONESIA NUTRITION PROJECT IMPACT EVALUATION DESIGN REPORT MATHEMATICA POLICY RESEARCH
B-3
ANNEX B. EVALUATION DESIGN CHANGES (UPDATED APRIL 2019)
This Annex describes key changes to the evaluation design described in the body of this report for the Nutrition Project Evaluation, as of April 2019. In Section A we describe the rationale for these changes by describing how project implementation differed from the original plans. In Section B, we describe the revised data collection activities and reporting for the evaluation after the 2014-2015 baseline. In Section C we describe our updated recommendations regarding respondents and sample sizes for the endline quantitative household survey, and in Section D we reiterate the research questions for the evaluation. Finally, in Section E we briefly describe our revised plans for comparing the costs and benefits of the project.
A. Changes to implementation
The design for the impact evaluation of the Nutrition Project that was developed in late 2014 was based on the expectations for project implementation at the time (as summarized in Figure 1.1). The project was planned such that different activities would be synchronized to have the maximum impact on a cohort of children who would benefit from various activities during gestation and the first 1000 days of life. However, that synchronicity was not possible due to several activity delays and, in some cases, cancellation of planned activities. Also note that some activities, like IFA distribution, were not fully implemented due to delays or other logistical challenges. Figure A.1 shows when each activity was intended to be implemented as of 2014 and when implementation actually occurred over the life of the Compact.
As we anticipated in Chapter II of this report, we were not able to evaluate certain project activities in-depth. One of these is the national-level communications campaign, which affected treatment and control communities equally and therefore could not be evaluated using our proposed methodology. We also could not evaluate the sub-national level of the communications campaign, which consisted largely of district-level advocacy and communications training for desa level health workers, because it was implemented only 11 purposively-selected districts within our evaluation areas. Finally, we were unable to evaluate the private sector response activity—which was ultimately implemented as a grant-making offer for sanitation programs and funded 3 localized sanitation-related projects—using our proposed methodology.
MCC INDONESIA NUTRITION PROJECT IMPACT EVALUATION DESIGN REPORT MATHEMATICA POLICY RESEARCH
B-4
Figure A.1 Implementation of several project activities was delayed
Notes * The distribution of 2017 Generasi block grant funds to the desa continued into early 2018. ** The distribution of IFA to pregnant women at the desa level is estimated to have occurred from September 2017 to September 2018.
These delays and cancellations had two important implications for the evaluation design. First, it would likely take longer for the envisaged impacts to manifest. This motivated a delay in the timing of the endline quantitative survey to early 2019. Second, the project could not fully realize the synchronicity across activities anticipated at the design stage; exposure to project activities varied substantially across cohorts of children, and exposure to the full package of activities was limited. This motivated an interim study in 2017 to better understand the nature of implementation and whether the anticipated long-term outcomes were still realistic (Beatty et al. 2018). It also led to changes in our recommended sample for the endline survey to focus on cohorts with maximum exposure to project activities. In the remainder of this Annex we describe these changes to the original evaluation design in further detail.
B. Data collection and reporting activities
The updated evaluation design includes two rounds of data collection after the late 2014/early 2015 baseline quantitative data collection:
1. Interim data collection. The goal of the interim study was to examine project implementation progress and assess impacts on short- and medium-term outcomes that were hypothesized to lead to the project’s long-term goals, such as improvements in maternal and
Generasi facilitator trainingGenerasi block grants disbursed to district*
NutritionIYCF training at puskesmas/desa levelGrowth monitoring training at puskesmas levelAnthropometric kits distributed to puskesmasIFA for pregnant women distributed to district health offices**Micronutrients for children distibuted NOT IMPLEMENTEDService provider incentives activity NOT IMPLEMENTED
SanitationSanitation training at sanitarian/desa levelSanitation entrepreneur trainingCommunity-level triggering eventsSanitation grant-making activity
Communications campaignCommunication campaign
Projected
Actual
2014 2015 2016 2017 2018
MCC INDONESIA NUTRITION PROJECT IMPACT EVALUATION DESIGN REPORT MATHEMATICA POLICY RESEARCH
B-5
child health. We utilized three data sources for the interim study. First, we conducted quantitative phone surveys of health service providers whom we surveyed at baseline, collected in treatment and control areas between November 2017 and February 2018. Second, we collected qualitative data from focus group discussions and in-depth interviews with stakeholders involved in and targeted by project IYCF and CLTS activities, as well as from direct observations of IYCF trainings for desa-level stakeholders, nutritional group counseling sessions, and sanitation triggering events. We collected these qualitative data between October and December 2017. Third, we used a database from the Ministry of Desas, Disadvantaged Regions, and Transmigration, which includes spending data on Generasi activities in 11 provinces over six years, 2012 to 2017. The database includes information on activities conducted in the 8 non-evaluation provinces for 2012 to 2016 and in the 3 evaluation provinces for 2014 to 2017. Mathematica produced a report with the interim study findings in mid-2018 (Beatty et al. 2018). This report also includes details on the sampling and study motivation.
2. Endline data collection. The endline data for the evaluation are being collected in treatment and control areas in early 2019. They include quantitative surveys with households and caregivers of children under age 3, desa- and puskesmas-level health service providers, and desa leaders. These surveys are similar to those designed at baseline. At endline, we added a survey with kabupaten-level administrative officials to better understand the following: (1) how kabupaten governments adjusted their activities in response to the fact that only some kecamatan in each kebupaten had access to the project (primarily to Generasi and to IYCF, growth monitoring, and CLTS training); and (2) how kabupaten governments are or are not continuing MCA-I-supported activities now that the project has ended. This survey and the desa-level surveys will help us better explain the interim finding that many key outcomes at the desa and kecamatan levels were similar across treatment and control groups. Mathematica will produce a final impact evaluation report based on the analysis of these data by then end of 2019.
As mentioned above, the baseline data collection took place from November 2014 to February 2015. Table B.1 below shows the sample size for each respondent type. Each respondent type received a separate survey instrument.
It was anticipated that some Generasi activities would begin in late 2014, so at baseline we found that almost all treatment desa had begun some program activities related to community engagement and mobilization at the time of the baseline survey. Despite the fact that these startup activities had occurred, Generasi was at an early stage of implementation: just over half of the treatment desa had received the first tranche of funding and 23 percent had received the second tranche by the time of the baseline survey. (Each desa was to receive two tranches total in 2014.) Further, only 5 percent of desa received the first tranche of funding more than a month before the baseline survey. While receipt of funds at the desa level signaled the potential start of project activities that could affect household level behavior, we did not expect this to be a major threat to the integrity of the baseline because of the time lag between the disbursement of funds, initiation of activities, and its impact on household outcomes. Other than Generasi, no other activities had started at the time the baseline was implemented.
MCC INDONESIA NUTRITION PROJECT IMPACT EVALUATION DESIGN REPORT MATHEMATICA POLICY RESEARCH
B-6
Table B.1. Baseline surveys sample sizes
Instrument Number of completed interviews
Household head 4,547 Caregiver 3,034 Pregnant woman 1,513 Kader posyandu 732 Kepala desa 760 FD/KPMD 358 Bidan desa 570 Puskesmas administrators 251 Bidan coordinator 245 Nutritionist 214 Sanitarian 203
For interim, as discussed above, we used three data sources. We used the phone survey data
to estimate differences in health service provision, service provider knowledge, and interactions between service providers and the Generasi project across treatment and control areas. We interviewed five types of service providers: bidan, kader posyandu, bidan coordinators, nutritionists, and sanitarians. The sample sizes for the quantitative survey is shown in Table B.2. Each respondent type received a separate survey instrument.
Table B.2 Interim phone survey sample sizes and response rates
Bidan
Kader posyandu
Bidan coordinators Nutritionists Sanitarians
Interviewed at baseline 560 774 245 214 203 No longer in baseline role 45 129 95 41 44 No phone number available 11 125 3 0 1 Eligible for interim interview 504 520 147 173 158 Completed interim phone interview 409 253 118 143 138 Percentage of eligible interim sample interviewed
81% 49% 80% 83% 87%
Percentage of baseline sample interviewed
73% 33% 48% 67% 68%
The qualitative data collection effort focused on the following components of the Nutrition Project: (1) IYCF training; (2) nutritional group counseling sessions, including kelas ibu hamil and kelas balita; (3) CLTS training; (4) triggering; and (5) Generasi. The goal was to learn about the reach and quality of these activities, and factors facilitating or hindering their implementation. Table B.3 shows the qualitative data sources and selection approach.
MCC INDONESIA NUTRITION PROJECT IMPACT EVALUATION DESIGN REPORT MATHEMATICA POLICY RESEARCH
B-7
Table B.3 Qualitative data sources and selection approach
Data source
Data collection method Number Selection approach
Nutrition
MoH staff IDI 1 Interviewed officials within the MoH’s nutrition improvement and provision (PMKG) subdirectorate.
DHO staff IDI 4 Randomly selected 4 of the 9 study kabupaten; interviewed DHO staff who had received IYCF training and provided training to puskesmas staff.
Puskesmas staff IDI 3 In 3 of the kecamatan where the nutritional group counseling session observations were taking place, interviewed nutritionist and/or bidan coordinator.
IYCF training Observation 4 Observed refreshment trainings for kader posyandu where they were ongoing during the time of data collection.
Bidan FGD 9 Selected 9 kecamatan based on where counseling session observations were taking place. In each kecamatan, invited trained bidan from 9 randomly selected desa (typically 8 that were conducting counseling sessions and one that was not) to participate in FGD. The goal was to learn about on-the-ground implementation of the sessions and potential reasons why they were not being held.
Kader Posyandu FGD 9 Selected 9 kecamatan based on where counseling session observations were taking place. In each kecamatan, invited 2 trained kader posyandu from each of 5 randomly selected desa (typically 4 that were conducting counseling sessions and one that was not) to participate in FGD.
Kelas ibu hamil Observation 8 Observed kelas ibu hamil ongoing at the time of data collection conducted by trained facilitator (bidan, bidan coordinator, or nutritionist).
Kelas ibu hamil participant
FGD 9 Selected 9 kecamatan based on where counseling session observations were taking place. In each kecamatan, randomly selected desa where trained facilitators were conducting kelas ibu hamil. In that desa, randomly selected and invited to FGD 10 women from attendance list of trained facilitator.
Kelas ibu hamil nonparticipant
IDI 9 In the desa where participant FGDs were conducted, and a few neighboring desa (to meet targets), identified respondents by (1) asking bidan to compare kelas ibu hamil attendance list with pregnancy register, (2) asking bidan to recall who did not attend, (3) door-to-door searches by the data collection team, and (4) snowball sampling. Note that SurveyMETER originally planned to conduct FGDs with these respondents. However, this was logistically difficult to accomplish, so the data collection team conducted about 7 IDIs in each desa and summarized that data.
Kelas balita Observation 9 Observed kelas balita ongoing at the time of data collection conducted by trained facilitator; data collectors observed the kelas balita for its entire duration.
Kelas balita participant
FGD 9 Same method as kelas ibu hamil participant.
Kelas balita nonparticipant
FGD 9 Same method as kelas ibu hamil nonparticipant.
MCC INDONESIA NUTRITION PROJECT IMPACT EVALUATION DESIGN REPORT MATHEMATICA POLICY RESEARCH
B-8
Data source
Data collection method Number Selection approach
Sanitation
MoH staff IDI 1 Interviewed officials within the MoH’s environmental health directorate and water and basic sanitation subdirectorate (Sanitasi Air dan Sanitasi Dasar).
DHO staff IDI 3 Interviewed staff who attended IYCF training and provided training to Puskesmas- and desa-level staff.
Puskesmas staff IDI 9 Selected 9 kecamatan based on where nutritional group counseling session observations were taking place. In each kecamatan, interviewed staff—typically the sanitarian or health promotion staff person—who had received MCA-I’s CLTS training.
Sanitation kader FGD 9 Selected 9 kecamatan based on where counseling session observations were taking place. In each kecamatan, invited kader from the 2 to 3 desa that received CLTS training through MCA-I.
Triggering event Observation 4 Observed triggering events ongoing at the time of data collection conducted by trained facilitator.
Triggering participant
FGD 9 Selected 9 kecamatan based on where counseling session observations were taking place. In each kecamatan, randomly selected desa where triggering had been conducted by trained facilitators. In each desa, invited 10 participants randomly from 2–3 different dusun.
Cross-cutting
MCA-I IDI 1 Interviewed MCA-I staff working on the Nutrition Project.
Note: IDI = in-depth interview; FGD = focus group discussion
We used the third data source, the Generasi database, to examine the types of activities that Generasi funded in project desa and the amount of funding that desa allocated to those activities.
As shown in Figure A.1 above, nearly all project activities were completed by the time of the interim survey end of 2017 and early 2018. There were some exceptions: some training was still ongoing at the end of 2017, Generasi block grant disbursement ended the middle of 2018, and IFA for pregnant women was distributed to district health offices through January 2018. Nevertheless, because most activities were completed by the end of 2018, the exposure to treatment at interim was similar to that at endline, which we discuss in section C below.
For endline, the surveys will take place from January to April 2019. Table B.4 below shows the sample size for each respondent type. Each respondent type will receive a separate survey instrument. All project activities were completed by the time of the endline surveys. Again, because most activities had already been completed at interim, beneficiary exposure to treatment was similar to that at interim and is discussed in Section C below. Effectively, the endline study therefore examines longer-term effects of the treatment that had already been received by interim.
MCC INDONESIA NUTRITION PROJECT IMPACT EVALUATION DESIGN REPORT MATHEMATICA POLICY RESEARCH
B-9
Table B.4 Endline surveys sample sizes
Instrument Targeted sample size
Household head/caregivers/children 9,120
Kader posyandu 811
Kepala Desa 760
Bidan desa 760
Bidan coordinator 226
Nutritionist 226
Sanitarian 226
Kabupaten staff 22
C. Justification for respondents and sample sizes for the endline household survey
The lack of synchronicity in project activities due to implementation delays implies that exposure varied substantially across cohorts (Table C.1). Specifically, children born in 2016, who were 24-35 months old at the time the endline data collection, will have received maximum exposure to the program.
Table C.1 Children born in 2016 likely received the greatest exposure to the Nutrition Project activities
Born 2018 Born 2017 Born 2016 Born 2015 Born 2014
Age start of 2019 (endline)
Age 0-11 months
Age 12-23 months
Age 24-35 months
Age 36-47 months
Age 48-60 months
Program exposure
Minimal Generasi implementation, although most activities had stopped by 2018
No active training implementation but could experience the effects of IYCF, growth monitoring and sanitation training for full year of life
Potentially 1-2 years of Generasi implementation (but much of Generasi was winding down by 2017)
Could experience the effects of IYCF, growth monitoring and sanitation training for 2 years of life
Up to 3 years of Generasi implementation
Could experience the effects of IYCF, growth monitoring and sanitation training for 2 years of life
Potentially 1-2 years of Generasi implementation (but there was very little Generasi activity starting in 2014)
Could experience the effects of IYCF and growth monitoring for 1-2 years and sanitation training for 1 year
Potentially half year of Generasi exposure
Too soon for most training effects
Treatment-control contrast in exposure
Minimal contrast Minimal contrast Maximum contrast
Moderate contrast
Minimal contrast
MCC INDONESIA NUTRITION PROJECT IMPACT EVALUATION DESIGN REPORT MATHEMATICA POLICY RESEARCH
B-10
This led us to revise our recommended sample sizes of households with children under age 3 relative to the 6,080 households that we originally recommended, which was driven by the goal of detecting at least a 5 percentage point change in stunting. Specifically, for the endline we recommended a sample size of 9,120 households, comprised of the following:
4,560 households with children age 24-35 months. As described above, these children are the cohort that received maximum exposure to the program. This sample size will enable us to measure a 5.6 percentage point change in stunting for this cohort (Table B.3). Increasing this sample size to the originally planned 6,080 children for stunting only reduces the MDIs by 0.3 percentage points, and therefore the additional cost does not seem justified.
3,040 households with children age 0-11 months. This will enable us to capture both pregnancy and newborn care behaviors using the same sample with an acceptably short recall period. Table B.3 shows the MDIs for key behavioral outcomes for this sample. Because these behavioral outcomes would mainly be affected by the trainings—which should continue to affect new pregnant women and new mothers in the treatment areas—this sample should have sufficient exposure for impacts to manifest. We believe that these MDIs are sufficient because large changes in these behavioral outcomes would be required for substantive changes in health outcomes to occur.
1,520 households with children age 12-23 months. This will round out the sample of children to cover the full 0-35 month age range. With appropriate weighting, we would then be able to detect impacts across the full age range from 0-35 months.
The MDIs for key outcomes in each age range and the full sample of 0-35 month olds are shown in Table C.2. We will be able to detect a change of 4.7 percentage points in the prevalence of stunting. However, because younger children would have had limited program exposure, including them might dilute the impact estimates. Therefore, our primary stunting outcome will be for the 24-35 month group, with stunting for the full 0-35 month group as a secondary outcome.
We recommended dropping the sample of 3,040 pregnant women that we originally proposed in the baseline, for several reasons. First, it seems unlikely that the IFA funded by MCA-I would still be distributed and consumed in treatment desas by the time of the endline, so we would not expect impacts on anemia for women who are pregnant at endline. (This logic also applies to measuring child anemia.) Second, MCC already funded a separate study to look at the effectiveness of IFA distribution, so there is no need to examine this in the impact evaluation. Third, one main purpose of surveying pregnant women would be to capture their pregnancy behaviors; however we will accomplish this more efficiently using the sample of households with children age 0-11 months described above by asking respondents to recall behavior during their pregnancy. An implication of omitting the pregnant women sample for the endline analysis is that we no longer plan to measure MUAC, which might have improved through greater provider access (through Generasi) or counseling sessions (kelas ibu hamil).
MCC INDONESIA NUTRITION PROJECT IMPACT EVALUATION DESIGN REPORT MATHEMATICA POLICY RESEARCH
B-11
Table C.2 Recommended sample sizes and MDIs for key outcomes at endline
Outcome Baseline mean
(percent) MDI
(percentage points)
0-11 month olds (N=3.040)
At least four prenatal visits 70.2 8.0
Delivered with skilled provider 71.6 9.3
Recommended number of postnatal visits 9.7 4.1
Ever attended kelas ibu hamil 11.8 4.9
Ever attended kelas balita 5.7 2.4
Initiated breastfeeding within one hour of delivery 30.2 6.3
Exclusively breastfed (current feeding, 0-5 month old sample) 19.7 7.5
Note: MDI calculations are based on a two-tailed test with 80 percent power at a 95 percent confidence level and assume a 95 percent response rate. MDIs for the full 0-35 month old sample account for weighting due to unequal sampling proportions across age groups.
D. Research questions and key outcomes
The research questions for the endline study are very similar to those described in Chapter III. The only substantive change is to remove the question regarding impacts on pregnancy-related outcomes (research question 1a in Chapter III) because, as discussed in Section C, we no longer plan to measure these at endline. Therefore, the final research questions are as follows:
1. Impacts
1. What is the impact of the Nutrition Project’s package of supply and demand-side activities on key outcomes, including:
a. Child health outcomes (for example, stunting, wasting, underweight, birth weight, and diarrhea)
b. Behavioral practices (for example, sanitation, breastfeeding, complementary feeding, food diversity, overall maternal and child nutrition, iron/folic acid consumption)
c. Receipt of health services (for example, nutritional counseling, growth monitoring, prenatal and postnatal care access and utilization, vaccination, vitamin supplementation, nutritional and growth counseling)
2. What is the impact of the Nutrition Project on key subgroups, such as those defined by socioeconomic status, mothers’ level of schooling, children’s gender, geographic location (peripheral versus more connected areas), and service availability?
MCC INDONESIA NUTRITION PROJECT IMPACT EVALUATION DESIGN REPORT MATHEMATICA POLICY RESEARCH
B-12
2. Implementation
3. How were various components of the Nutrition Project implemented?
a. How did actual implementation compare to planned implementation, and what were the reasons for any deviations from plans?
b. What were the main challenges to implementation, and how were these addressed?
c. Which demand-side and supply-side elements were the key drivers of impacts?
We will answer questions 1, 2, and 3c in the endline report. We largely answered questions 3a and 3b in the interim report but will provide further information about implementation in the endline report based on information collected in the endline surveys.
Similarly, Table II.2 in the design report that shows medium-term project outcomes no longer includes child anemia, maternal anemia or maternal BMI. Table D.1 below reflects these changes.
Children with diarrhea in the last two weeks (under 5)
N/A N/A 14 [18] Children 0–35 months
Children with diarrhea in the last week
N/A N/A N/A Children 0–35 months
Percentage of children who are low birth weight (<2.5 kg)
7 11 [15] 7 [7] Children 0–35 months
Notes: N/A = not available. Prevalence from IFLS is for the 0-35 month age group. Prevalence from Riskesdas is for children under 5. Riskesdas numbers for the three evaluation provinces are a simple unweighted average across these provinces. Riskesdas data are available by age group and thus we could construct comparable prevalence for the 0-35 group, but not by province.
E. Changes to plans for cost-benefit analysis
In Section II.D of this report we describe our plans to use the findings from the impact evaluation to update, to the extent possible, key parameters in the ERR model commissioned by MCC before the project started. However, MCC has recently requested that we instead conduct a new, independent cost-benefit analysis (CBA) that entails developing a new model and utilizing the parameter estimates from the impact evaluation. Therefore, once the evaluation findings are available, we will use them to estimate the economic value of the observed impacts and compare them to the project’s costs to assess whether MCC’s investment was worthwhile.
MCC INDONESIA NUTRITION PROJECT IMPACT EVALUATION DESIGN REPORT MATHEMATICA POLICY RESEARCH
B-13
We plan to focus the CBA on three main potential benefit streams of the project for affected cohorts of children: (1) reduced neonatal and child mortality; (2) reduced morbidity; and (3) increased income in adulthood. These benefit streams reflect those that are highlighted in the literature on the benefits of early childhood nutrition interventions (for example, Alderman and Behrman 2006; Martinez and Fernandez 2008; Nandi et al. 2016) and are the same as those in the original CBA for the Nutrition Project. More specifically, we plan to estimate these benefit streams as follows:
Reduced neonatal and child mortality. We will use the Lives Saved Tool (LiST), a model developed by the Johns Hopkins Bloomberg School of Public Health, to estimate the number of lives saved as a result of the project. This will depend on the estimated impacts on the parameters in the LiST model that could plausibly be affected by the project. These include the following: stunting and wasting, IFA supplementation, delivery at a facility or by a skilled attendant, age-appropriate breastfeeding (early initiation, exclusive breastfeeding, and continued breastfeeding), child vaccinations (three doses of DPT, and measles), use of improved sanitation, and handwashing behavior. We will then convert the estimated number of lives saved into an economic benefit by estimating the expected lifetime wages for those who otherwise would have died.
Reduced morbidity. The Nutrition Project was expected to result in decreased childhood morbidity from diarrhea and other infectious diseases. If these impacts on child morbidity manifest, they will result in economic benefits through decreased costs of care and treatment. This could include savings in terms of: (1) medical costs (including hospitalizations), (2) medications, and (3) caregivers’ wages that would have been foregone to care for a sick child. We will measure these savings directly in our endline surveys.
Increased income in adulthood. Our endline surveys will provide estimates of the project’s impacts on child height-for-age Z-scores (HAZ). Increases in child HAZ could translate into increased income in adulthood through increased educational attainment, cognitive ability, and increased productivity. If we do find significant impacts on child HAZ, we will translate them into income gains in adulthood, using findings from the literature to quantitatively specify this link.
We will then compute the total estimated benefits and compare them to the total project costs, MCC’s fiscal agent estimated these costs as $120,202,385; in addition, the project’s share of compact overhead was $15,013,862. MCC’s guidelines for CBAs require that the project’s share of compact overhead be included as a cost, resulting in a total cost of $135,216,247.49,50
Finally, it will be important to conduct additional sensitivity checks of the CBA results to the parameters used. This will involve re-estimating the CBA by using the upper and lower
49 For the purposes of the CBA it is necessary to allocate these costs across years because of discounting. We
will discuss with MCC whether this information is available and, if not, will assume an allocation across years that corresponds to implementation intensity (which was highest in 2016 and 2017).
50 There might also be private costs, including the opportunity costs of attending pre- or post-natal check-ups, the opportunity cost of attending kelas ibu hamil and kelas balita, and the costs of latrine constriction. If there are impacts on the rate of attendance at checkups or classes, or the availability of latrines, we will include these costs in the CBA. However, we expect them to be small relative to MCC’s costs.
MCC INDONESIA NUTRITION PROJECT IMPACT EVALUATION DESIGN REPORT MATHEMATICA POLICY RESEARCH
B-14
confidence-interval bounds from the impact evaluation, as well as by modifying other parameters within a plausible range (such as the effects of child stunting on income in adulthood, or the real growth rate in wages over time). We will also explore the feasibility of using Monte Carlo simulations as a more comprehensive approach to conducting these checks. These sensitivity checks will enable us to arrive at a sense of the possible range of the CBA estimates.
Overall, the changes described in this Annex helped ensure that the evaluation design was aligned with the way the project was implemented, which will maximize the learning value of the evaluation for MCC and other stakeholders.
This page left blank for double sided copying.
www.mathematica‐mpr.com
Improving public well-being by conducting high quality, objective research and surveys PRINCETON, NJ ■ ANN ARBOR, MI ■ CAMBRIDGE, MA ■ CHICAGO, IL ■ OAKLAND, CA ■ WASHINGTON, DC


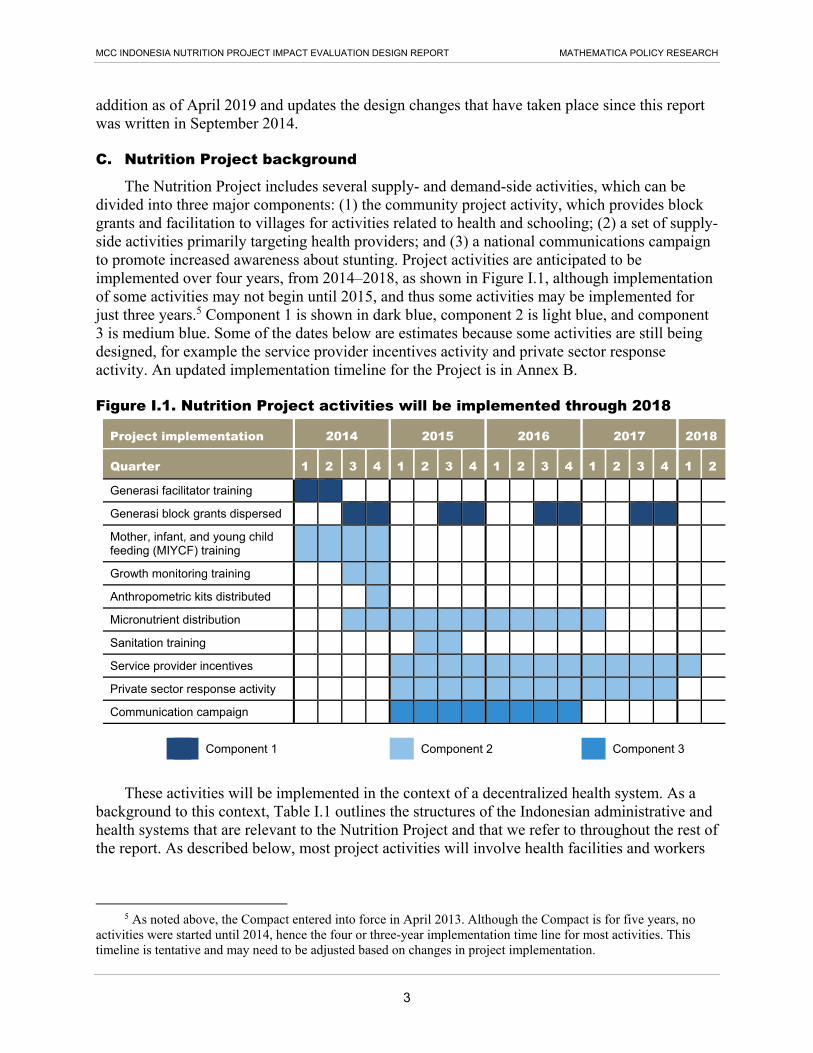
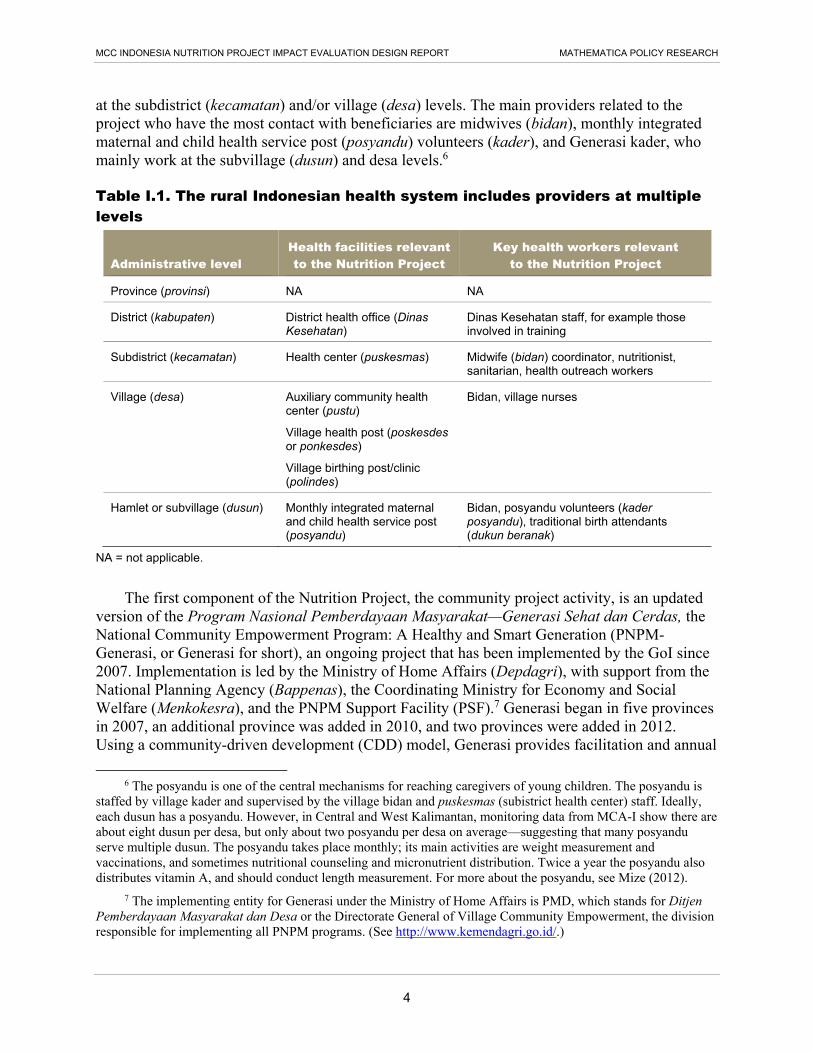


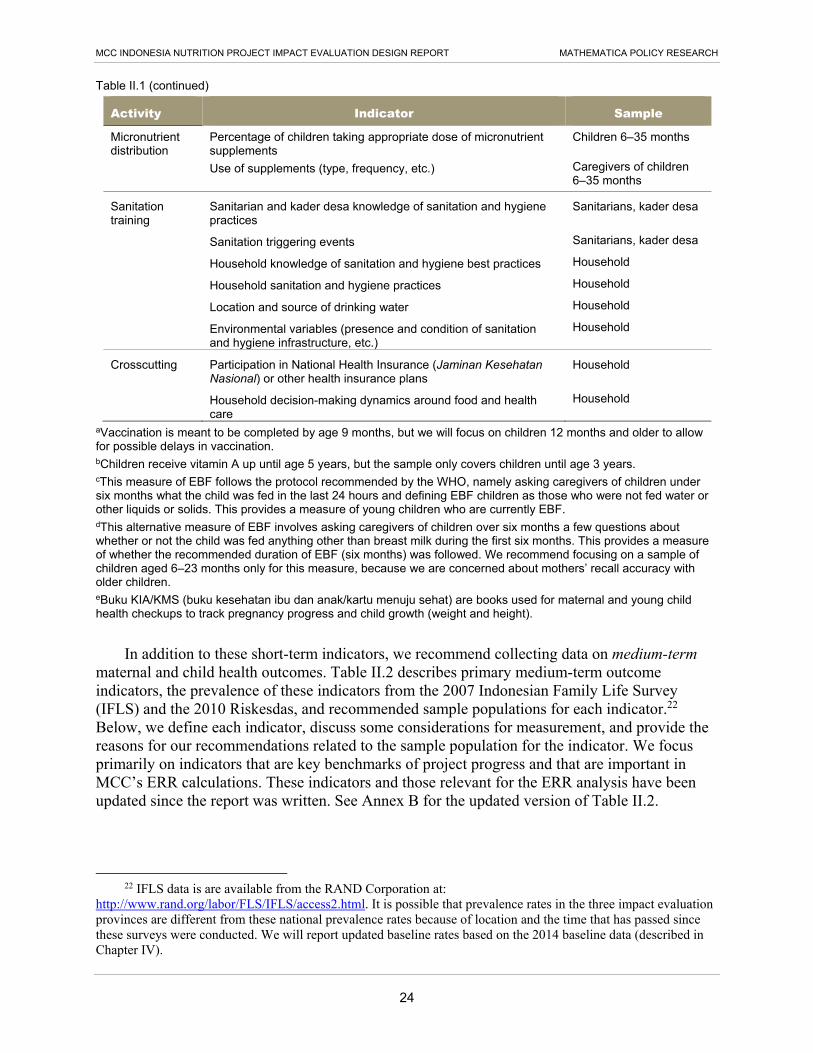


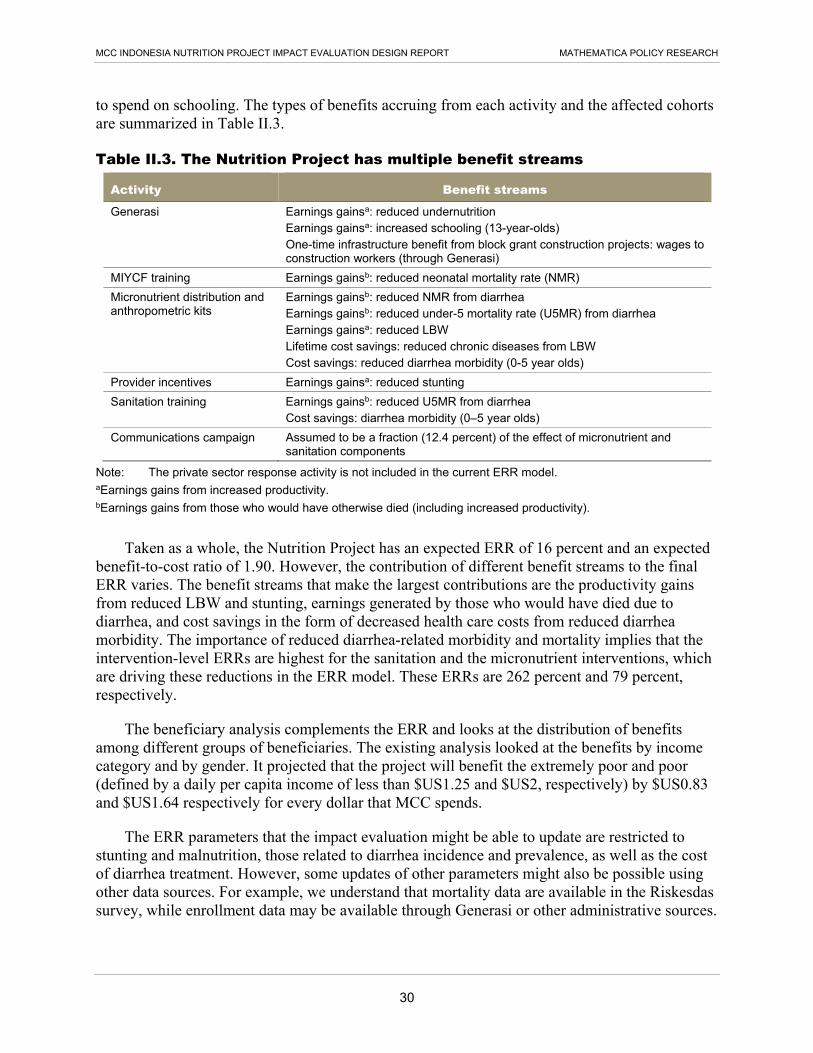


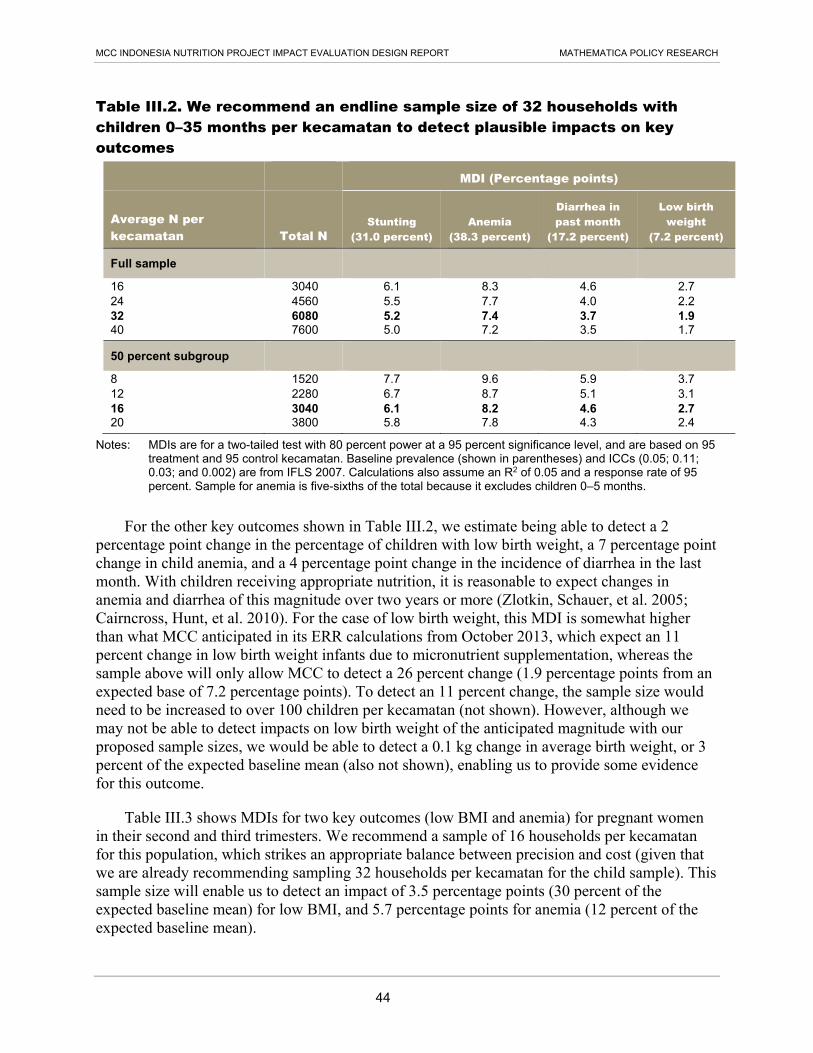


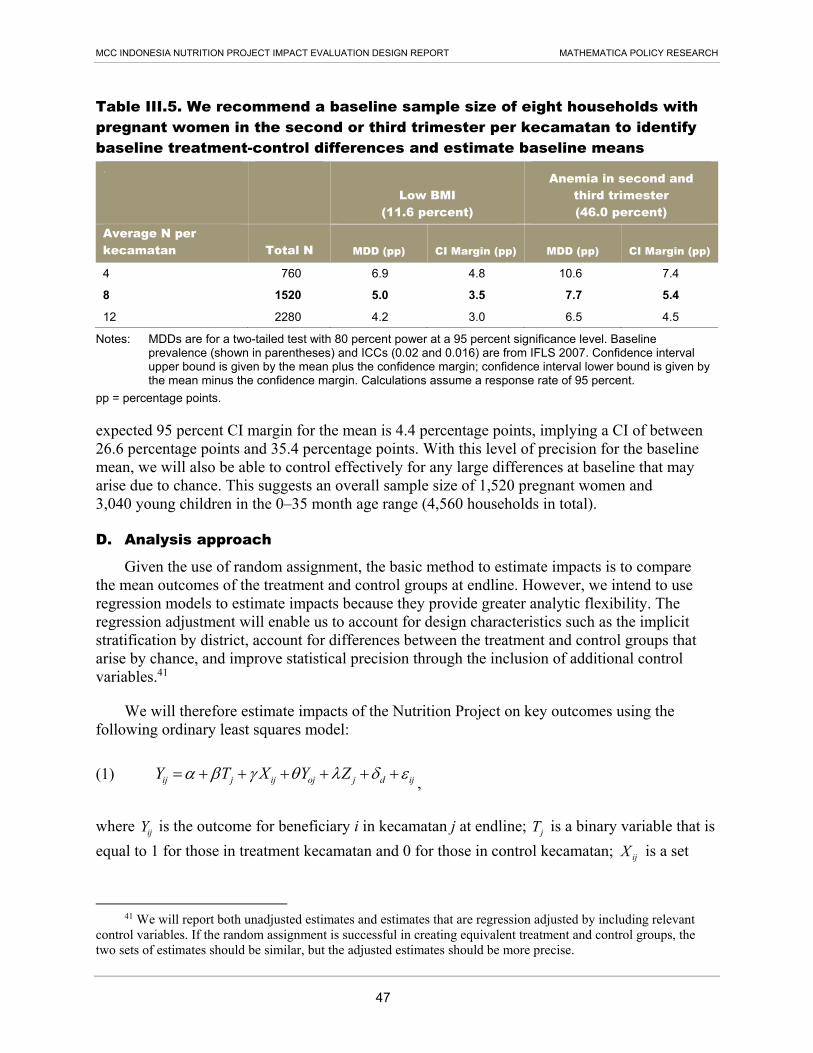


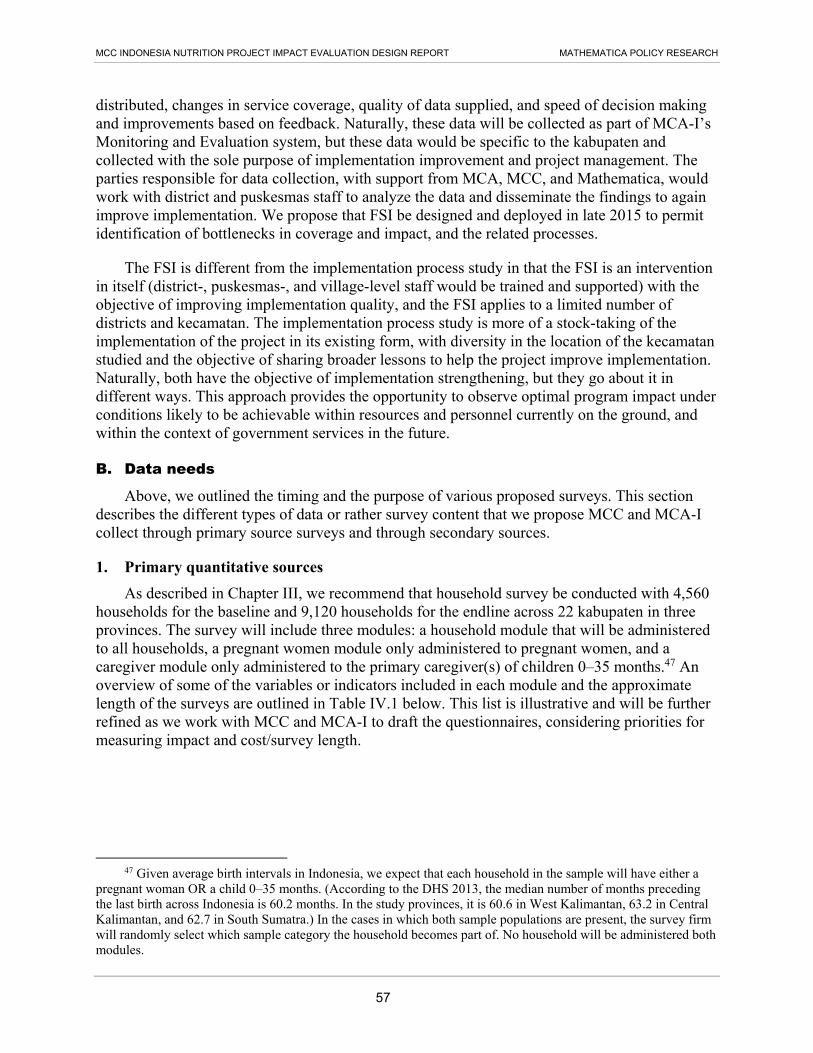

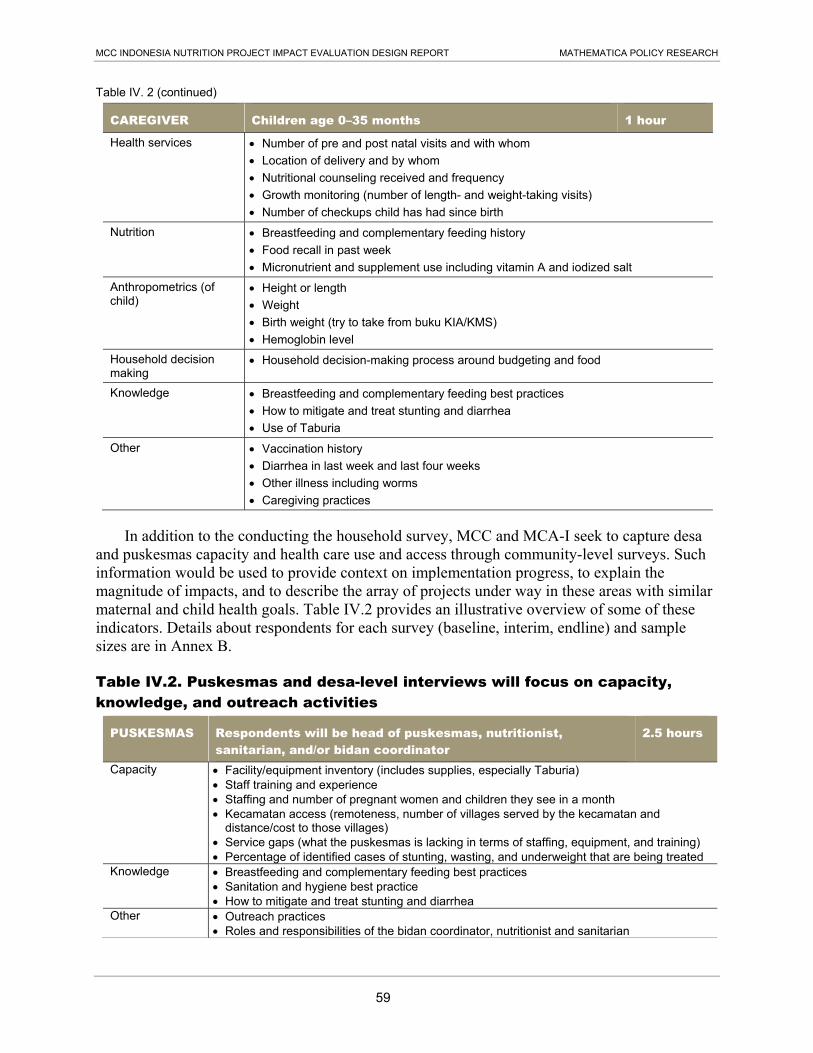
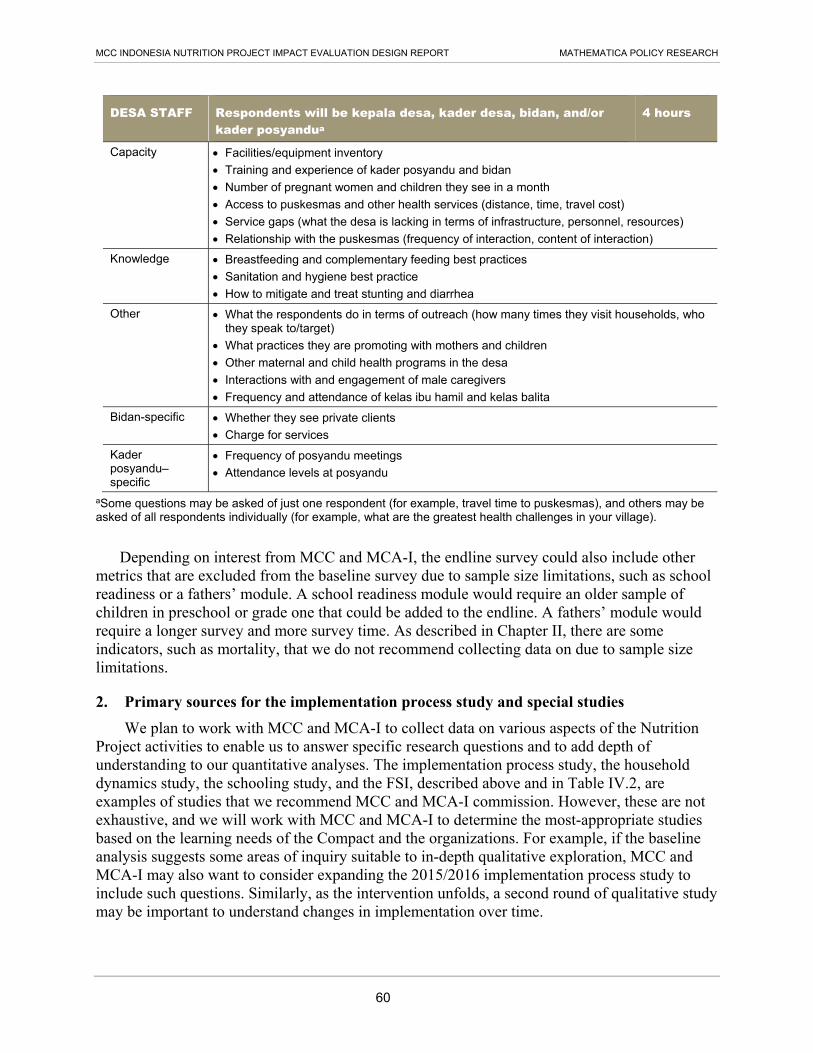


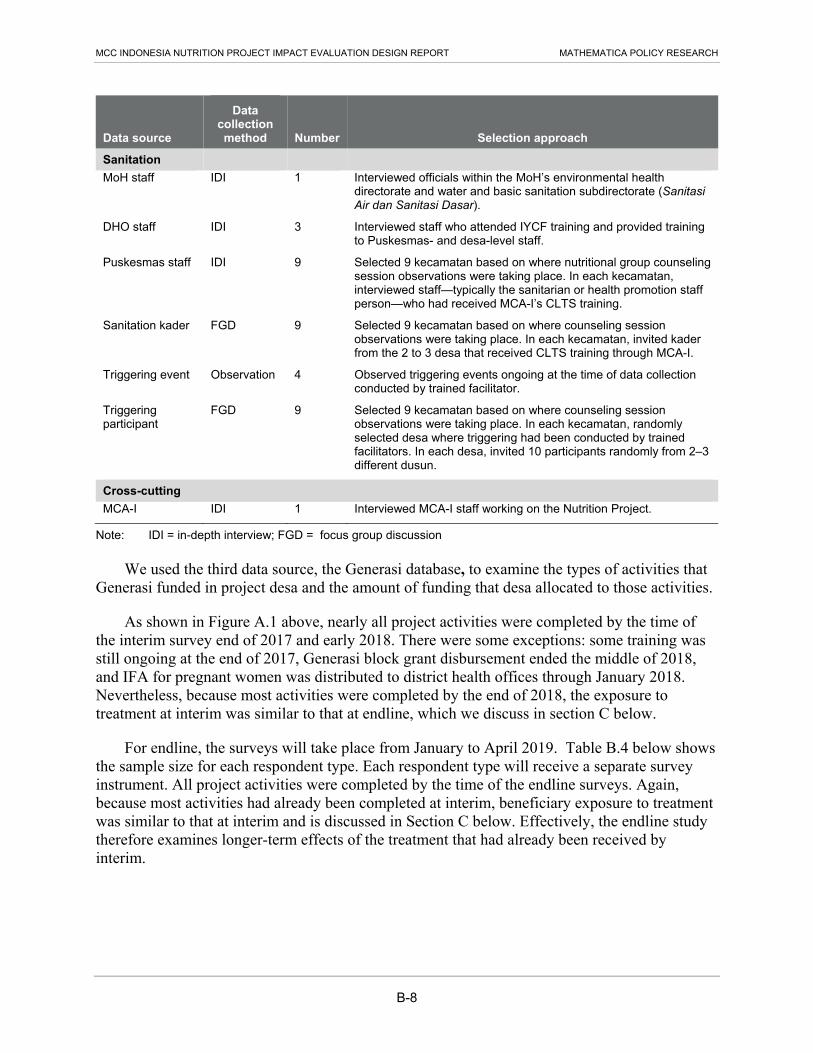

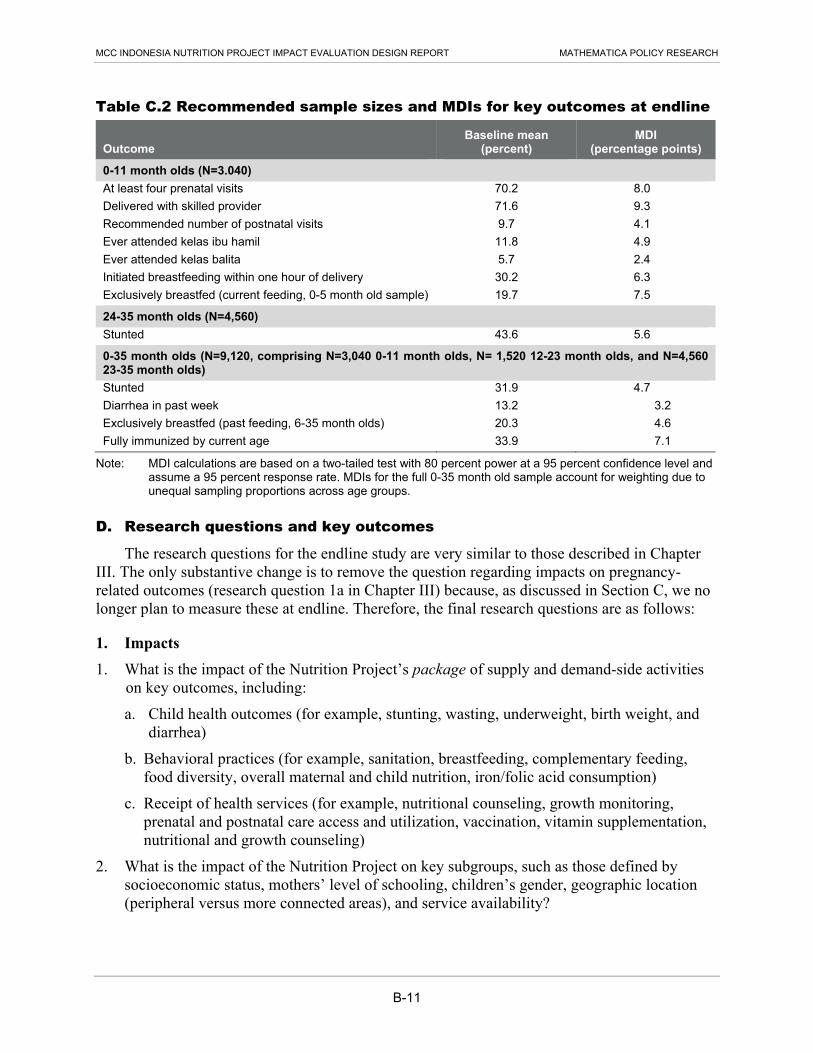


![Fb Twitter Presentation Cd April19 [Compatibility Mode]](https://static.documents.pub/doc/80x56/5559a814d8b42aa4288b4d92/fb-twitter-presentation-cd-april19-compatibility-mode.jpg)


