Nutrition & Physical Activity Report Card 2012-2013 The Russellville Independent Schools are dedicated to serving nutritious meals and providing multiple physical activity opportunities as a means of helping our students reach “Promoting healthy and safe behaviors among students is an important part of the fundamental mission of schools.” School Health Index-Centers for Disease Control (CDC) Intense physical activity programs have positive effects on academic achievement , including increased concentration; improved mathematics, reading, and writing test scores; and reduced disruptive behavior. -- Curricular Physical Activity and Academic Performance, Pediatric Exercise Science * Physical Activity & Achievement Schools play a crucial role in influencing physical activity behaviors. Sound curriculum, policies, and facilities create an environment encouraging students and staff to engage in a variety of physical activity opportunities. Evidence supports a correlation between SAT scores and the physical well-being of students. The data presented above is a summary from the assessment of our physical activity environment. RUSSELLVILLE INDEPENDENT SCHOOLS School Physical Activity Environment Assessment Program/activity Elem High Provide daily recess Yes N/A Provide at least 150 minutes of physical education per week Yes Yes Provide classroom physical activity integrated into school day Yes Yes Provide intramural physical activity opportunities Yes No Offer facilities to families / community for physical activity opportunities Yes Yes
Transcript
Nutrition & Physical Activity Report Card
2012-2013
The Russellville Independent Schools are dedicated to serving nutritious meals and providing
multiple physical activity opportunities as a means of helping our students reach
proficiency.
“Promoting healthy and safe behaviors among students is an important part of the fundamental mission of schools.”
School Health Index-Centers for Disease Control (CDC)
Intense physical activity programs have positive effects on academic achievement , including increased concentration; improved mathematics, reading, and writing test scores; and reduced disruptive behavior.
-- Curricular Physical Activity and Academic Performance, Pediatric Exercise Science
*
Physical Activity & Achievement
Schools play a crucial role in influencing physical activity behaviors. Sound curriculum, policies, and facilities create an environment encouraging students and staff to engage in a variety of physical activity opportunities. Evidence supports a correlation between SAT scores and the physical well-being of students.
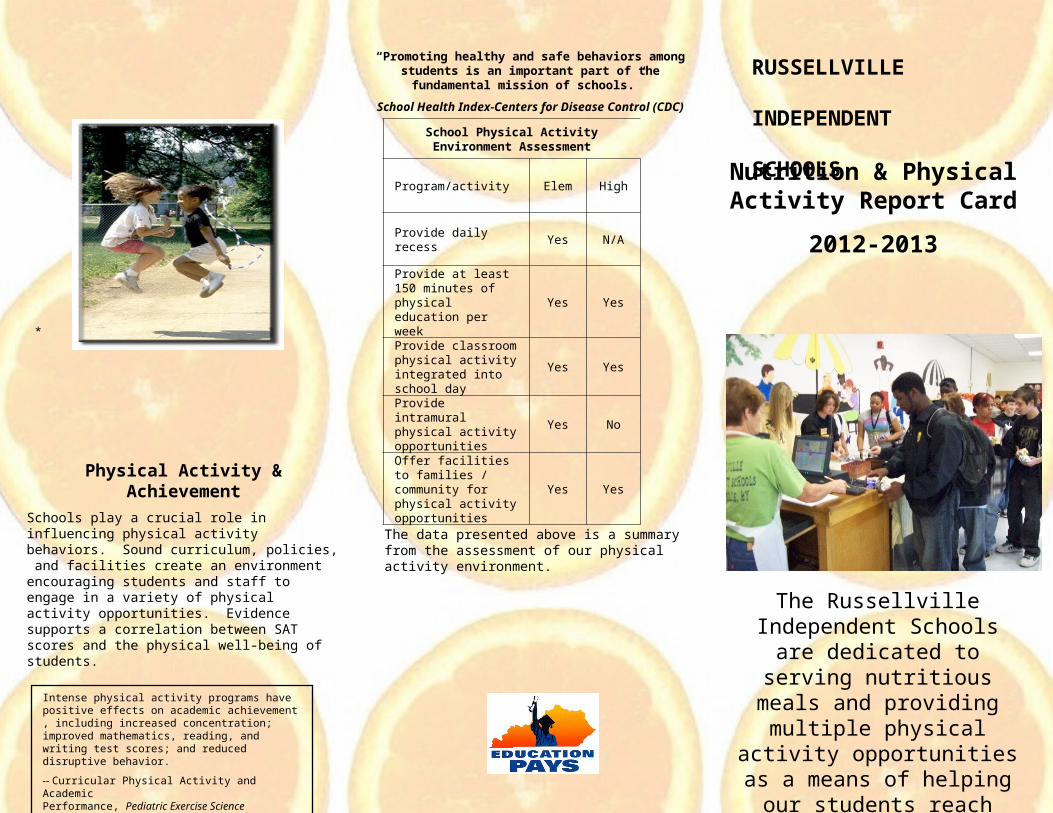
The data presented above is a summary from the assessment of our physical activity environment.
RUSSELLVILLE INDEPENDENT SCHOOLS
School Physical Activity Environment Assessment
Program/activity Elem High
Provide daily recess Yes N/A
Provide at least 150 minutes of physical education per week
Yes Yes
Provide classroom physical activity integrated into school day
Yes Yes
Provide intramural physical activity opportunities
Yes No
Offer facilities to families / community for physical activity opportunities
Yes Yes
School Breakfast
The School Breakfast Program (SBP) was established in 1966. School districts receive federal reimbursement for each school breakfast served that meets the U.S. Department of Agriculture’s nutrition guidelines. There will also be phase-in changes to School Breakfast Program over a three year period, beginning with 2013-14 school year.
Studies show that children who participate in the School Breakfast Program have significantly higher standardized achievement test scores than non-participants. Children with access to school breakfast also had significantly reduced absence and tardiness rates.
National School Lunch
The National School Lunch Program (NSLP) was conceived in 1946 as a “measure of national security to safeguard the health and well-being of the Nation’s children.” School districts receive federal reimbursement for each school lunch served that meets the United States Department of Agriculture nutrition guidelines. These guidelines promote meal quality while commodity donations help the farmer and help schools keep down meal prices.
Our lunch meals are planned on a three-week menu cycle.
On December 13, 2010, President Obama signed into law Public Law 111-296, the Healthy, Hunger-Free Kids Act of 2010. This historic legislation marked the most comprehensive changes to the school meals standards in more than a generation. The timing of this legislation and USDA’s standards are critically needed to help combat the epidemic of childhood obesity as well as the urgent problem of childhood hunger. Nearly 1 in 3 children are at risk for preventable diseases like diabetes and heart disease due to overweight and obesity. Changes to the meal pattern for the 2012-13 school year include weekly amounts of grains, fruits and vegetables, meat/meat alternates and maximum calorie amounts for grades K-5; 6-8 and 9-12.
The table below provides a synopsis of the lunch program, including participation and financial data. This information is based on data from the 2011-2012 school year.
Federal Reimbursement $145,032
# Schools Participating 2
Total Breakfasts Served 92498
Average Daily Participation 518
Breakfast Prices Adult Price $1.75
Student Reduced-price: $ .30
Student Paid: $1.15
Federal Reimbursement $315,841
# Schools Participating 2
Total Lunches Served 149,188
Average Daily Participation 862
Cost of Food Used $271,907
# Students Approved for Free Meals 689
# Students Approved for Reduced-price Meals
99
# Students approved for Paid Meals 338
Lunch Prices Adult: $2.85
Reduced-price : $.40
Paid : 1.85
A USDA study showed students who eat school meals are more likely to consume milk, meats, grain mixtures and vegetables compared to students who did not, including students who brought meals from home. Also, students who eat school meals have higher intakes of some vitamins and minerals, including calcium and Vitamin A -- nutrients that tend to be “problem nutrients” for kids.
Cost-wise, schools work very hard to make sure that school meals are a good value. Take a look at the number of items typically offered to students at lunch -- an entrée, two servings of fruits and vegetables, a bread or grain item and 8 ounces of milk. It takes a real balancing act to beat that value with a bag lunch.
--National Dairy Council
.
“Protecting children’s health and cognitive development may be the best way to build a strong America.”
-- Dr. J. Larry Brown, Tufts University School of Nutrition
Breakfast participation in our school district has increased considerably over the past 5 years. 51% of our student enrollment eats school breakfast on a daily basis.
MyPlate illustrates the five food groups that are the building blocks for a healthy diet using a familiar image—a place setting for a meal. Before you eat, think about what goes on your plate or in your cup or bowl. To learn more about building a healthy plate, go to www.choosemyplate.gov.
“In accordance with Federal law,And U. S. Department ofAgriculture policy, this institution is prohibited from discriminatingon the basis of race, color,national origin, sex, age ordisability. To file a complaint ofDiscrimination, write USDA, Director, Office of Civil Rights, 1400 Independence Avenue, SW,Washington, DC 20250-9410 or call (800) 795-3272 (voice) or (202) 720-6392 (TTY). USDA is an equal opportunityprovider and employer.”