23
NUTRITION SURVEY REPORT RABDURE DISTRICT BAKOOL REGION SOMALIA September 2002

NUTRITION SURVEY REPORT
RABDURE DISTRICT
BAKOOL REGION SOMALIA
September 2002
Table of Contents ACKNOWLEDGEMENTS 3
1. EXECUTIVE SUMMARY 4
3. INTRODUCTION 7 3.1 The health context______________________________________________________________________ 7
3.2 Water and environmental sanitation ________________________________________________________ 8
3.3 Food Security Context___________________________________________________________________ 9
4. JUSTIFICATION/OBJECTIVE OF THE NUTRITION SURVEY Error! Bookmark not defined. 5. METHODOLOGY 11
5.1 Sample size __________________________________________________________________________ 11
5.2 Sampling methodology _________________________________________________________________ 11
5.3 Variables examined____________________________________________________________________ 12
5.4 Indicators and cut-offs__________________________________________________________________ 13
5.5 Data preparation and analysis ____________________________________________________________ 13
6. PRESENTATION OF THE SURVEY RESULTS 14 6.1 Age and gender distribution of children surveyed ____________________________________________ 14
6.2 anthropomentric analysis _______________________________________________________________ 14
7. ANALYSIS OF FINDINGS 18 7.2 Feeding of children ______________________________________________ Error! Bookmark not defined.
7.3 Health seeking behaviour _______________________________________________________________ 18
7.4 Care practices __________________________________________________ Error! Bookmark not defined.
7.5 Food security___________________________________________________ Error! Bookmark not defined.
8 RECOMMENDATIONS 20
REFERENCES 21 ANNEX:1 Estimated population, cumulative and total clusters. ____________________________________________ 22 TRADITIONAL CALENDAR FOR NUTRITION SURVEY IN RABDURE DISTRICT _______________________ 23
1
2
ACKNOWLEDGEMENTS UNICEF is grateful to IMC for participating in planning the survey, training field staff, supervising data
collection, and providing some logistic support. The contribution of local authorities in identification of
enumerators and ensuring security for the fieldwork in Rabdure district is much appreciated. The data
could not have been obtained without the co-operation and support of the communities surveyed,
especially the mothers and caregivers who took time off their busy schedules to respond to the
interviewers.
The comments of some members of the Nutrition Working Group, FSAU in particular on the draft report
are also gratefully acknowledged.
3

2 EXECUTIVE SUMMARY In September 2002, UNICEF conducted a nutrition survey in Rabdure District, Bakool Region in South and Central Somalia in collaboration with IMC, FSAU and local authorities. The survey was conducted to monitor the nutrition situation of Rabdure district and progress made by agencies’ intervention since the last nutrition survey in September 2001. The main objective of the survey was to determine the level of wasting and oedematous malnutrition among children below five years, and some possible factors that may be contributing to child malnutrition in the district. Using a two-stage random cluster sampling methodology, a total of 907 children between age 6-59 months or measuring 65-110 cm were examined. Nutritional status assessments were based on weight and height measurements. Moreover, information relating to diarrhoea, ARI, malaria incidence two weeks prior to the survey and measles incidence one month prior to the survey, Vitamin A supplementation and measles vaccination status of the children were also collected. Qualitative information was also collected prior to the field work with some key informants and a group of mothers on issues relating to household food security and childcare practices in order to gain understanding of factors affecting nutrition in the district. The preliminary report on anthropomentric analysis, background information and qualitative information provided by the key informants were examined by UNICEF. Wasting of muscle and fat tissues, a rapid response to acute nutritional deficiency caused by infections and dietary inadequacies was found in 14.8% of children with 1.9% being severely malnourished. Information collected on immunisation status during the survey indicated that slightly more than 80% of the children had been vaccinated against measles, out of which 73% were vaccinated within the past 6 months and 27% before the past 6 months. Almost 20% were not vaccinated at all while slightly more than 83% of the children were provided with Vitamin A supplements during the past six months. About 16% of the children had diarrhoea, 15% had ARI and 11% had malaria in two weeks prior to the survey while slightly more than 1% had measles in one month prior to the survey. Almost 90% were introduced food other than milk before four months. Twenty one percent of the children were from households headed by females. About 2% of the households were from displaced populations and almost 5% from returnee populations. Diseases, limited access to quality water, and poor child-feeding practices seem to be contributing substantially to malnutrition in Rabdure district. Continuation of the UNICEF, IMC and WFP supplementary feeding and family rations to malnourished children and their families until proper harvest will sustain the improvements made and prevent massive displacements in the area. A longer-term plan to improve further the nutritional status of the population needs to be developed in a multi-sectoral approach in water and environmental sanitation, promotion of early child care and introduction of small-scale business through community based action groups. The main areas of focus should include promoting exclusive breastfeeding, appropriate young child feeding, diversification of diets, improvement in household hygiene and health care practices, income generation activities, and rehabilitation of water points with the active participation of pregnant mothers, fathers and other caregivers in order to sustain improvements in the nutrition situation in Rabdure district.
4

3 . SUMMARY FINDINGS Indicator
Number Percentage
Under five children screened during the survey. 907 100 Number of boys in the sample 484 53.4 Number of girls in the sample 423 46.6 Global acute malnutrition according to Weight For Height Index in Z-Score or presence of oedema
134 14.8
Severe acute malnutrition according to Weight For Height Index in Z-Score or presence of oedema
17 1.9
Global acute malnutrition according to Weight For Height Median or presence of oedema
81 8.9
Severe acute malnutrition according to Weight For Height in % Median or presence of oedema
13 1.4
Proportion of children with diarrhoea in two weeks prior to the survey. 143 15.8 Proportion of children with ARI in two weeks prior to the survey. 138 15.2 Proportion of children with Malaria in two weeks prior to the survey. 101 11.1 Proportion of children with Measles in one month prior to the survey. 11 1.2 Proportion of children supplemented with Vitamin A in six months prior to the survey.
754 83.1
Proportion of children immunised against Measles. 729 80.4 Proportion of children on breastfeeding 223 24.6 Proportion of children breastfed less than 6 months 24 3.5 Proportion of children breastfed 6-11 months 143 20.9 Proportion of children breastfed 12-18 months 193 28.2 Proportion of children breastfed 18 months and more 324 47.4 Proportion of children introduced food before 4 months 814 89.7 Proportion of children introduced food during 4-6 months 71 7.8 Proportion of children introduced food after 6 months of age 22 2.4 Proportion of children fed once a day 7 1 Proportion of children fed twice a day 98 11 Proportion of children fed 3-4 times a day 600 66 Proportion of children fed more than 4 times/day 202 22 Proportion of female-headed households. 107 21.3 Proportion of displaced households 10 2.0 Proportion of returnee/refugee households 23 4.6 Two main reason of displacement/returnee Food shortage 18 54.5 Insecurity 7 21.2 Two main source of food Household crop production 238 47.4 Purchases 108 21.5 Two main source of income Sale of crops 180 35.9
5

Sales of animals and animal products 150 29.9 Two main coping strategies during food shortage Wild food collection 125 24.9 Food aid 117 23.3 Two main source of drinking water Open hand dug well 317 63.3 Water pond 148 29.5 Main practice of human excreta disposal Bush/Open ground 434 86 Main source of treatment when a child is sick Private clinic and pharmacy 346 70.5 Traditional healer 112 22.8
6

3. INTRODUCTION Rabdure district which is located 120km northwest of Baidoa town and 30km west of the Somali border with Ethiopia is one of the most food insecure districts in Bakool region with an estimated population of 13,000-15,000. The population can be broadly categorised into three food economy groups namely southern agro-pastoral herders, pure pastoral and agro-pastoral farmers. The headquarter town and some of the surrounding villages were completely destroyed during the inter-clan fighting that ensued after the occupation of Bay and Bakool regions by the Somali National Alliance (SNA) in 1995.
#
#
#
#
#
%XUDUR
YEED
WAJID
TAYEGLOW
Ceel Barde
RAB DHUURE
Bay-Bakol Agro-Pastoral: High potential sorghum, cattle, camelDawo Pastoral: Sheep & goats, cattle, camelSouthern Agro-Pastoral: Camel, cattle, sorghumSouthern Inland Pastoral: Camel, sheep & goats
Food Economy Zones
Since 2000, the district has experienced the cumulative effect of drought, poor harvest, reduced pastures and population movement causing deterioration in food security. The Deyr 2001/2002-crop failure further suppressed the agro-pastoral high potential farmers in areas like Quracle and Isdhowrto thus rendering the district to be more vulnerable. UN agencies and international non-governmental organisations have been providing humanitarian assistance to the population. 3.1 JUSTIFICATION OF THE NUTRITION SURVEY Following reports of high malnutrition rates in September 2001 (19.2% GAM), interagency intervention commenced in late 2001. The food security situation continued to deteriorate with the poor performance of the deyr 2001/2002 crop. Pastures got depleted and water shortage problem escalated. However UNICEF, IMC, and WFP continued with the intervention efforts through the district MCH and the satellites sites established. Further WFP continued with the food for work activities in the district where water projects, To evaluate the intervention programme performance through quantitative means and as a means of monitoring the nutrition situation, a nutrition survey was recommended. The nutrition survey was a joint effort of UNICEF, IMC and FSAU.
3.2. SURVEY OBJECTIVES • To determine the level of malnutrition and nutritional oedema among children aged 6-59 months or with
height/length of 65-110cm in Rabdure District. • To determine some of the possible causes of malnutrition among young children in the district • To determine the prevalence of some common diseases (measles, diarrhoea, malaria, and ARI) in the district. • To determine the measles vaccination and Vitamin A supplementation coverage among children in Rabdure. • To establish baseline data for evaluating the effect on an integrated drought response strategy proposed for
Bakool Region • To assess the effects of household movement in the district on nutrition status • To gather background information on household food sources, income and coping mechanisms.
4 BACKGROUND INFORMATION The health context The District Health Committee established a Maternal and Child Heath Centre in Rabdure town in 1999 with support from UNICEF. It is the main health facility in the entire district providing the essential package of health services for children and women. In addition to this, there are six health posts in Yeed, Quracle, Dhurey, Wabgarad,
7

Himilow and Boodaan villages providing basic services for treatment of common illnesses, micronutrient supplementation, supervising clean deliveries, supporting outreach immunisation activities and sensitising communities on health issues. IMC took over management of the MCH and health posts in 2000 and runs it with support from UNICEF.. Malnourished children identified through nutrition screening activities at the MCH receive systematic treatment through a dry ration supplementary feeding programme. Despite the routine MCH Supplementary Feeding Programme (SFP) targeting malnourished children in Rabdure town and other districts in Bakool region, the general cumulative trend of proportion of screened malnourished children recorded between January to August remained alarmingly high as illustrated in Figure 1 below.
Fighure 1: Cumulative MCH malnutrition trend
43
27
43
5045
4953 52
4 3 3 6 4 5 4 50
500
1,000
1,500
2,000
2,500
3,000
3,500
Jan-01 Feb-01 Mar-01 Apr-01 May -01 Jun-01 Jul-01 Aug-01
No. o
f chil
dren
scre
ened
0
10
20
30
40
50
60
Prop
. (%
) maln
ouris
hed
Total screened Global acute malnutrition (%) Sev ere acute malnutrition (%)
Additional pressure was felt with influx of 300 – 400 families from Ethiopia in August 2001. Of these, 70% were returnees who had migrated to the Barey and Kumbul areas of Ethiopia in the early 1990s and had been forced to return due to rising tension between them and their Ethiopian hosts. The rest came from Wajid district and surrounding villages following rumour of food distribution. A rapid Mid Upper Arm Circumference (MUAC) assessment carried out on the 6-59 months old children from the returnee households by FSAU, IMC and the local authorities revealed a 38% acute malnutrition rate with an overall 67% of the children at risk (see Table 1). Vitamin A deficiency was also found to be prevalent as suggested by identification of 3 cases of bitot spots in children assessed. In early September 2001, WFP responded by providing a general distribution of 17 metric tons of foodstuff – maize, pulses and oil – to these families. Table 1: Distribution according to origin and nutrition status (MUAC)
MUAC measurement
Origin Oedema (%) Severe acute malnutrition
<11 cm (%)
Moderate acute malnutrition
11≤ to <12.5 cm (%)
At risk of malnutrition
12.5 to 13.5 (%)
Normal
≥13.5 (%)
Total
Ethiopia Returnees 1 (0.5) 19 (8.8) 67 (31.2) 63 (29.3) 65 (30.3) 215 (87.8) IDPs – Wajid etc 0 0 6 (20) 7 (23.3) 17 (56.7) 30 (12.2) Total 1 (0.4) 19 (7.8) 73 (29.8) 70 (28.6) 82 (33.4) 245 (100) 3.2 Water and environmental sanitation
8

Access to water for human and livestock consumption has been a major problem in Rabdure district. There are 3 boreholes in the district, located in Rabdure town, Yed village and Shimbirow village, and 300 hand-dug wells in various locations. Although the town borehole can be rehabilitated, the high salinity and turbidity, as well as underground contamination make it unfit for human and animal consumption. Majority of the hand-dug wells are located on limestone depressions and seasonal rainwater stagnation areas, with an average depth of 11m and average water column of 2.5m in the rainy season, and 1m in the dry season. Dug wells are usually lined with traditional timber logs, their mouths being level with the ground or sometimes below it, making them prone to contamination from animal wastes and surface run offs. UNICEF supported the rehabilitation of some 33 shallow wells in Rabdure district but the endeavour has not solved the district's chronic problem of water shortage. The water table has been receding season after season, drying up a great number of shallow wells and contributing to deterioration of the already bad water quality. The underground contamination and lethal mineral content of shallow wells in the dry seasons, as well as the accumulation of deadly biogas resulting from the decomposition of animal wastes, are well known causes of animal and even human deaths. The community's seasonal de-silting and maintenance efforts have not matched the speed at which the water level is going down. Failure in the Gu and Deyr rainfalls of 2001 added to the patchy 2002 Gu rainfall badly affected pastoralists and farmers in Rabdure district. Water shortage was experienced both for human and livestock consumption. Livestock conditions, mainly cattle and goat deteriorated with consequent reduction in their milk production and marketability. Populations were forced to migrate to water catchments within the district, while the agropastoral and pure pastoral population moved with their livestock in search of water especially towards Garasweyne, 45km Northwest of Hoddur town. 3.3 Food Security Context Main events affecting food security in Rabdure District Period Major event June 2002 Lack of rain continuity resulting to wilting of the sorghum crop before maturation. April 2002 Timely onset of Gu rains in most parts of the district March 2002 Significant reduction of household cereal stocks Feb 2002 Increased milk prices due to scarcity as pastures reduce Jan 2002 Total Deyr crop failure in most parts of Rabdure. A significant population proportion estimated
to have a substantial food deficit of 15-30% over the year (FSAU, March 2002). Sept/Oct 2001 Commencement of UNICEF/WFP sponsored SFP/family rations distribution through Rabdure
MCH and Bodan and Isdowrto outreach sites. Intensification of food for work programmes. Rabdure District survey by UNICEF (19.3% <-2 z-score/oedema and 2.6% <-3 Z-score/oedema)
August 2001
Poor Gu crop harvest (whole of Bakool Region). High cereal prices due to shortage and inflation. Serious water shortage in Rabdure District and the neighbouring district. Pastoralists from Rabdure move to Elberde-Ethiopian belt with their livestock IDPs increased significantly in Rabdure town. A nutrition assessment in August 2001 recorded 38% malnutrition using MUAC among the IDP population in Rabdure (FSAU August 2001)
April/May 2001
Trickling in of IDPs from Ethiopia to Rabdure
August 2000 IMC survey in Elberde and Rabdure Districts recorded a 13.7% global malnutrition and 3.8% severe Good Gu harvest. Pasture and water available though a few pockets in the districts experiencing shortage
April-June 2000
Relatively good Gu rains boosting the food security of Bakol residents. Pasture and milk making available.
9
Water is available for both human and animal consumption. March 2000 Supplementary feeding programmes through the MCH targeting malnourished children
commences Feb 2000 Rabdure town survey by UNICEF(30% <-2 z-score/oedema and 3% <-3 Z-score/oedema Jan/Feb 2000 Crop failure and poor livestock condition Oct/Nov 1999 Poor Deyr rains leading population movements in search of water and pasture in other areas
including Ethiopia. Oct 1999 District taken over by Rahanwein Resistance Army- improvement of security Oct ’97-Feb 1998
El-nino rains leading to outbreak livestock disease particularly to camels
June 1994 Rabdure District survey by UNICEF recorded 21.3% global malnutrition rate using the percentage of the median (<80%/oedema) as the reference cut-offs
Sources: Extracted from previous FSAU food security assessment and UNICEF reports. Current food security situation Following short Gu 2002 rains, sorghum crop in most areas never got to maturity while pasture and water scarcity started being experienced by mid August. As a result livestock started moving within the region in search of pasture and water, particularly towards Leg-gale area (Garaswein area) and Quracle area. The Leg-gale area hosted a lot of livestock leading to fast depletion of pastures. Due to lack of quality pasture the livestock milk production declined thus affecting prices upwards, where available. During the last week of August the milk prices were as high as 8,000Ssh/litre up from normal price of 2-3,000Ssh/litre. Livestock are also currently far from the households implying limited milk availability and access to the households. Some areas are experiencing severe water shortage making some households to shift; for example; Sedahburot, Warbarbar and Iskri. Many catchments are dry forcing long distant travelling in search of water for both livestock and domestic purposes. Income opportunities among the Rabdure residents have been limited to sale of livestock among the better-off groups as the poor collect bush product for sale in Rabdure town. Search for casual labour is also common among the poor in their effort to cope with stress. Generally the poor crop performance has greatly reduced income level for the agro-pastoral community thus compromising their food access capacity. The status of the low incomes is exacerbated by increased cereal prices thus further affecting the poor. Due to low sorghum production in the area the cereal prices are relatively high (120,000Ssh/50kg sorghum compared to 90,000Ssh normal price). This implies limiting food access, particularly to the poor who have few or no livestock to exchange for cereals. The poor adopted movement or migration to urban areas or large villages in search of employment as a coping strategy during stress However, the on-going UNICEF/WFP sponsored SFP/family ration has greatly contributed to the food gap in the targeted households. Inter-agency nutrition intervention UNICEF, WFP and IMC embarked on intense field activities providing supplementary food and family ration to families with malnourished children. The extended and expanded supplementary feeding approach adopted reduced distance covered by the mothers/caretakers to access both nutrition and health services. In the beginning,there was an overwhelming increase in caseloads at the Huddur and Rabdure MCHs with beneficiaries coming from as far as 40-60 Km away. The beneficiaries were required to walk 3-4 times per month for EPI, screening, supermix distribution and WFP’s family ration sessions. MCH staffs were predominantly preoccupied with supplementary feeding activities leaving them with little or no time for routine MCH service. The Rabdure programme involves provision of supplementary food and systematic treatment to the moderately malnourished children at both the MCH and newly established outreach sites (which also serve as health posts at regular days). The two sites located in Isdhowrto and Bodan villages serve the rural population while the Rabdure MCH serves the Rabdure town population as well as the immediate surrounding villages. Each of the moderately malnourished child identified receives a monthly ration consisting of about 100 kg of maize, 10kg of pulses, 3.6kg of oil and 10kg unimix. The unimix is meant for the child while the rest is meant for use by the family.
10
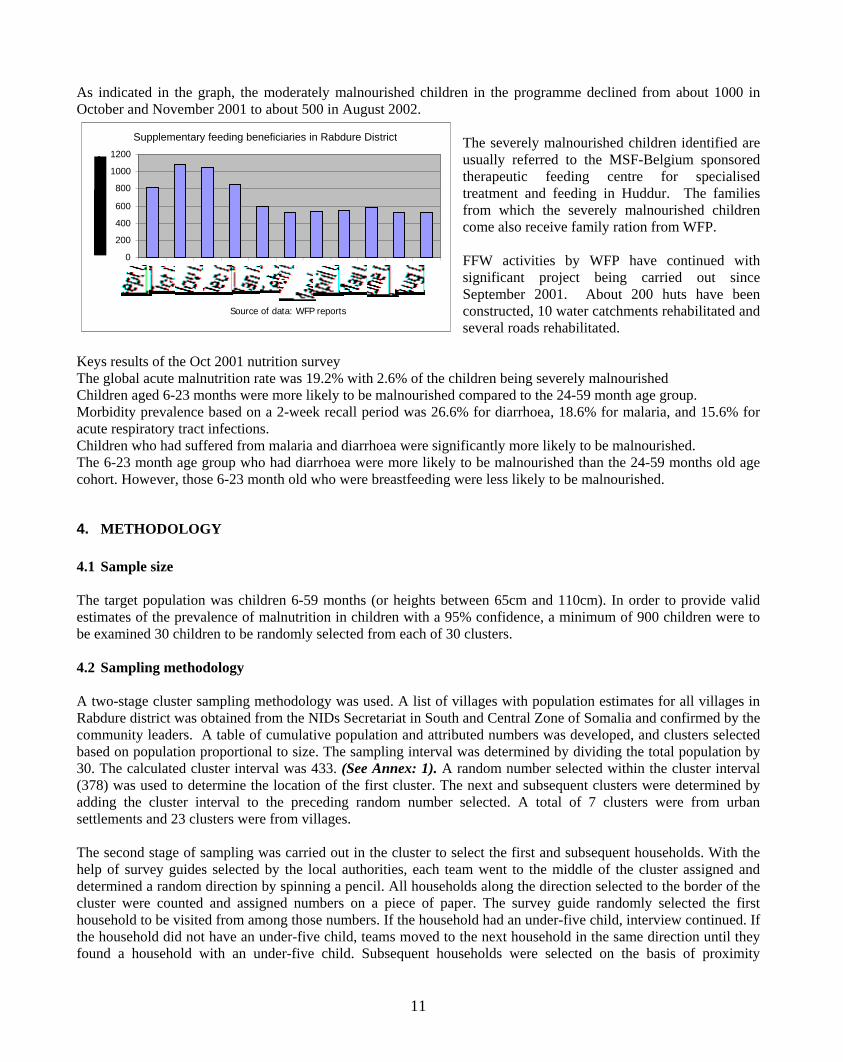
As indicated in the graph, the moderately malnourished children in the programme declined from about 1000 in October and November 2001 to about 500 in August 2002.
Supplementary feeding beneficiaries in Rabdure District
0 200
400
600 800
1000 1200
Source of data: WFP reports
The severely malnourished children identified are usually referred to the MSF-Belgium sponsored therapeutic feeding centre for specialised treatment and feeding in Huddur. The families from which the severely malnourished children come also receive family ration from WFP. FFW activities by WFP have continued with significant project being carried out since September 2001. About 200 huts have been constructed, 10 water catchments rehabilitated and several roads rehabilitated.
Keys results of the Oct 2001 nutrition survey The global acute malnutrition rate was 19.2% with 2.6% of the children being severely malnourished Children aged 6-23 months were more likely to be malnourished compared to the 24-59 month age group. Morbidity prevalence based on a 2-week recall period was 26.6% for diarrhoea, 18.6% for malaria, and 15.6% for acute respiratory tract infections. Children who had suffered from malaria and diarrhoea were significantly more likely to be malnourished. The 6-23 month age group who had diarrhoea were more likely to be malnourished than the 24-59 months old age cohort. However, those 6-23 month old who were breastfeeding were less likely to be malnourished.
4. METHODOLOGY 4.1 Sample size The target population was children 6-59 months (or heights between 65cm and 110cm). In order to provide valid estimates of the prevalence of malnutrition in children with a 95% confidence, a minimum of 900 children were to be examined 30 children to be randomly selected from each of 30 clusters. 4.2 Sampling methodology A two-stage cluster sampling methodology was used. A list of villages with population estimates for all villages in Rabdure district was obtained from the NIDs Secretariat in South and Central Zone of Somalia and confirmed by the community leaders. A table of cumulative population and attributed numbers was developed, and clusters selected based on population proportional to size. The sampling interval was determined by dividing the total population by 30. The calculated cluster interval was 433. (See Annex: 1). A random number selected within the cluster interval (378) was used to determine the location of the first cluster. The next and subsequent clusters were determined by adding the cluster interval to the preceding random number selected. A total of 7 clusters were from urban settlements and 23 clusters were from villages. The second stage of sampling was carried out in the cluster to select the first and subsequent households. With the help of survey guides selected by the local authorities, each team went to the middle of the cluster assigned and determined a random direction by spinning a pencil. All households along the direction selected to the border of the cluster were counted and assigned numbers on a piece of paper. The survey guide randomly selected the first household to be visited from among those numbers. If the household had an under-five child, interview continued. If the household did not have an under-five child, teams moved to the next household in the same direction until they found a household with an under-five child. Subsequent households were selected on the basis of proximity
11
following a clockwise direction. All eligible children in each household visited were measured and weighed. If a caregiver or child was absent an appointment was made, and the household revisited to examine the child before leaving the cluster. The missing children were noted in the survey form though no other child specific details were collected. A total of 907 children were examined for weight for height. Their caregivers were interviewed as to whether the children had received Vitamin A or Measles vaccination in the past 6 months, or had suffered from diarrhoea or ARI diseases two weeks prior to the survey. Five teams were used to collect the data. Each team had two enumerators, one supervisor and a survey guide. Enumerators were selected based on their experience with previous nutrition surveys. IMC and local authority in Rabdure district assisted in the identification of qualified persons. They were given a three-day training in anthropomentric techniques, sampling techniques and how to complete survey questionnaires including one day of field practice in a village near Rabdure town (the selected village was not one of the villages selected for the survey). Additional qualitative information was collected using focus group discussions and key informants interviews. 4.3 Variables examined Age – Only children between 6-59 months or whose length/height is 65-110cm were selected for examination. The age of a child was determined from the mother/caregiver’s recall, the under fives growth monitoring card, or from a local events calendar (See Annex 2) in instances where date of birth was not stated. Weight – UNICEFF electronic scales were used to weigh children to the nearest 0.1 kg or 100g. Height – Children were measured barefooted and bareheaded using height measuring boards graduated to the nearest 0.5cm. Children with height < 85 cm were measured lying, while those equal to or >85 cm were measured standing. Oedema – Children were examined for the presence of bilateral pedal oedema. The occurrence of pitting as a result of thumb pressure on the foot or leg for 3 seconds was indicative of nutritional oedema. Diarrhoea – Mothers/caregivers were interviewed regarding any episode of three or more loose, watery stools in a day, within the preceding two weeks. Acute Respiratory Infections (ARI) – collected from interviewing the mother/caregiver whether the child had “oof wareen or wareento” (local term of pneumonia) two weeks prior to the survey. This term was validated by further asking if the child had cough, fever and rapid breathing. Malaria– collected from interviewing the mother/caregiver whether the child had malaria two weeks prior to the survey. Measles immunisation status – the information was either provided by the mother or recorded from the child’s vaccination card. Measles prevalence– the information was collected by asking the mother/caregiver whether the child had measles in one-month period prior to the survey. Vitamin A supplementation - the information was collected from interviewing the mother or recorded from the child’s vaccination card.
12

Residential status – In all households visited, the mother/caregiver was asked whether they were originally resident from the village/town, or if they were displaced from elsewhere. Sex of household head – The mother/caregiver was asked to state the sex of the person who makes decisions regarding welfare of all household members. Feeding – Introduction of breastfeeding and weaning practices and times feed to children was assessed by interviewing mother/caregiver to all children. Public health facilities- health facilities offering free health assistance and usually sponsored by humanitarian organisations 4.4 Indicators and cut-offs Weight for height - expressed in Z score - is the most appropriate indicator for quantifying wasting in a population during an emergency. However, the two modes of expression in the table below were used for presentation of results. Nutritional status
Weight for Height in Z-score Weight for Height in % of Median
Global acute malnutrition < -2 or oedema < 80% or oedema Severe acute malnutrition < -3 or oedema < 70% or oedema
4.5 Data preparation and analysis During the data collection phase, each questionnaire was thoroughly checked by the filed supervisors for omissions, inappropriate responses and for unlikely weight for height measurements. Survey Co-ordinator travelled to enumeration areas making spot checks and ensuring that the methodology was standardised. Pre-coded responses were entered into the EPI Info version 6-software programme for data analysis. Confidence intervals were used to test for significant differences between prevalence of malnutrition among different age and food economy groups.
13
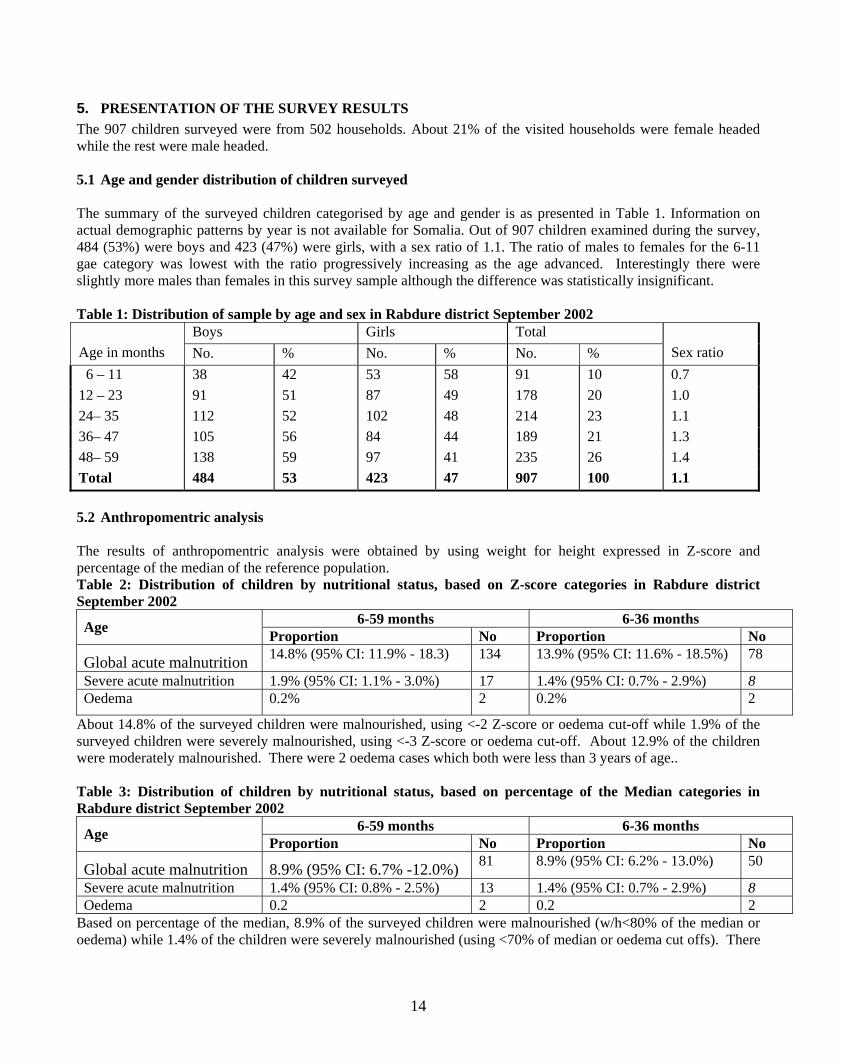
5. PRESENTATION OF THE SURVEY RESULTS The 907 children surveyed were from 502 households. About 21% of the visited households were female headed while the rest were male headed. 5.1 Age and gender distribution of children surveyed The summary of the surveyed children categorised by age and gender is as presented in Table 1. Information on actual demographic patterns by year is not available for Somalia. Out of 907 children examined during the survey, 484 (53%) were boys and 423 (47%) were girls, with a sex ratio of 1.1. The ratio of males to females for the 6-11 gae category was lowest with the ratio progressively increasing as the age advanced. Interestingly there were slightly more males than females in this survey sample although the difference was statistically insignificant. Table 1: Distribution of sample by age and sex in Rabdure district September 2002
Boys Girls Total Age in months No. % No. % No. % Sex ratio 6 – 11 38 42 53 58 91 10 0.7 12 – 23 91 51 87 49 178 20 1.0 24– 35 112 52 102 48 214 23 1.1 36– 47 105 56 84 44 189 21 1.3 48– 59 138 59 97 41 235 26 1.4 Total 484 53 423 47 907 100 1.1 5.2 Anthropomentric analysis The results of anthropomentric analysis were obtained by using weight for height expressed in Z-score and percentage of the median of the reference population. Table 2: Distribution of children by nutritional status, based on Z-score categories in Rabdure district September 2002
6-59 months 6-36 months Age Proportion No Proportion No
Global acute malnutrition 14.8% (95% CI: 11.9% - 18.3) 134 13.9% (95% CI: 11.6% - 18.5%) 78
Severe acute malnutrition 1.9% (95% CI: 1.1% - 3.0%) 17 1.4% (95% CI: 0.7% - 2.9%) 8 Oedema 0.2% 2 0.2% 2
About 14.8% of the surveyed children were malnourished, using <-2 Z-score or oedema cut-off while 1.9% of the surveyed children were severely malnourished, using <-3 Z-score or oedema cut-off. About 12.9% of the children were moderately malnourished. There were 2 oedema cases which both were less than 3 years of age.. Table 3: Distribution of children by nutritional status, based on percentage of the Median categories in Rabdure district September 2002
6-59 months 6-36 months Age Proportion No Proportion No
Global acute malnutrition 8.9% (95% CI: 6.7% -12.0%) 81 8.9% (95% CI: 6.2% - 13.0%) 50
Severe acute malnutrition 1.4% (95% CI: 0.8% - 2.5%) 13 1.4% (95% CI: 0.7% - 2.9%) 8 Oedema 0.2 2 0.2 2
Based on percentage of the median, 8.9% of the surveyed children were malnourished (w/h<80% of the median or oedema) while 1.4% of the children were severely malnourished (using <70% of median or oedema cut offs). There
14

was no significant difference between the prevalence of malnutrition in children aged 6-36 months and those aged 6-59 months. Table 4: Distribution of children by nutrition status and age in, Rabdure district, September 2002
Total children > -2 Z-score
< -2 and > -3 Z-score or oedema < -3 Z-score or oedema Age group
Months Number No. % No. % No. % 6 – 11 91 84 92 5 6 2 2 12 – 23 178 144 81 31 17 3 2
24– 35 214 185 86.5 26 12 3 1.5 36– 47 189 163 86 23 12 4 2 48– 59 235 198 84 32 14 5 2 Total 907 773 85.2 117 12.9 17 1.9
The 12-23 age category was recorded to have the highest malnutrition (19%) within the age categories Table 5: Distribution of children by common disease prevalence, measles vaccination and Vitamin A supplementation status , Rabdure district in September 2002
Total
Diarrhoea in last two weeks
ARI in last two weeks
Malaria in last two weeks
Measles cases in last one month
Measles vaccinations
Vit A Supplementation in last 6 months
Age group Months No. No. % No. % No. % No. % No. % No. % 6 – 11 91 13 14 12 13 8 9 2 2 50 55 70 77 12 – 23 178 49 28 33 19 22 12 3 2 135 76 146 82 24– 35 214 45 21 39 18 34 16 4 2 178 83 181 85 36– 47 189 24 13 31 16 22 12 2 1 166 88 160 85 48– 59 235 12 5 23 10 15 6 0 3 200 85 197 84 Total 907 143 16 138 15 101 11 11 1.2 729 80 754 83 The overall incidence of diarrhoea, ARI and malaria among under-fives was 16%, 15% and 11% respectively with slightly high episodes observed in the first three years of age. A total of 22%, 25% and 16% of the malnourished children had diarrhoea, ARI and malaria respectively. ARI (p<0.05), malaria (p= 0.03) and diarrhoea (p= 0.04) was found to be significantly associated with wasting in children. The survey also revealed that diarrhoea was significantly associated to children age category with those likely to be breastfeeding (6-23months) being at higher risk of diarrhoea (p<0.05). This is supported by qualitative information revealing immediate introduction of food other than breast milk after birth. There were more cases of diarrhoea in the 12-23 and 24-35 age categories than in the other age categories. Six months prior to the survey, measles immunisation coverage was 80% while 83% of the surveyed children had received Vitamin A supplementation over the same period.
15

Table 6: Social economic characteristics of the Rabdure population
Most of the households included in the survey were located in their original place of residence with only 5% and 2% being returnees and internally IDP respectively. Food shortage and insecurity are the main factors attributed to population movement. According to data in Table 6, sale of crops and sale of animals as well as their products are the main income sources for the households in Rabdure. With regard to food sources, household crop production and food purchases were the main food sources. The commonly purchased food items include sorghum, sugar, milk, meat, oil, ghee, wheat flour, rice and beans in normal situation while during crisis sorghum, sugar and wheat flour are prioritised. Dependency on wild food (dik dik) and relief food distributed through the ongoing interventions are the main coping strategies currently employed by the Rabdure residents. Qualitative information further indicate that in times of severe food shortage wild food collection is one of the main strategy of coping in Rabdure. Some households reduce the quantity per serving and number of meals consumed. An in-depth analysis between global acute malnutrition and variables like food source, income source, and source of drinking water indicate no direct relationship. However, it was found that children whose households income source is casual labour and salaried employment are more likely to be malnourished compared with other sources. Survey data revealed hand dug wells and water catchments/ponds as the main sources of water in Rabdure with about 63% and 30% of the households respectively depending on them.
With regard to seeking health assistance, most of the children are taken to public health facilities that are sponsored by International Medical Corps, when sick. The data indicated that majority of the households did not have access to toilet facility.
Sex of Household Head Total Percentage Female headed households 107 21 Male headed households 395 79 Total 502 100 Residential Status of households Indigenous residents 469 93 Returnees 23 5 Displaced 10 2 Total 502 100 Two main reason of displacement/returnee
Food shortage 18 54.5 Insecurity 7 21.2 Two main source of food Household crop production 238 47.4 Purchases 108 21.5 Two main source of income
Sale of crops 180 35.9 Sales of animals and animal products
150 29.9
Two main coping strategies during food shortage
Wild food collection 125 24.9 Food aid 117 23.3 Two main source of drinking water
Open hand dug well 317 63.3 Water pond 148 29.5 Main practice of human excreta disposal
Bush/Open ground 434 86 Main source of treatment when a child is sick
Public facility 346 70.5 Traditional healer 112 22.8
16
5.3 Childcare aspects influencing nutritional status of children The survey revealed that about 4% of surveyed children were breastfed less than 6 months, 21% were breastfed between 6-11 months, slightly more than 28% are breastfed between 12-18 months while the rest 47% were breastfed more than 18 months. Almost 90% of the children were introduced foods other than breast milk before 4 months of age, 8% were weaned at age 4-6 months while slightly more that 2% were weaned after 6 months. Less than 1% of children are fed once a day, 11% are fed twice a day while the other 88% are fed three and more times a day. Additional information collected through Focus Group Discussions with women groups and caretakers indicate that most of the mothers introduce to their babies water with sugar immediately after birth. During breastfeeding period, mothers breastfeed 6-8 times /day, (5 times between morning and night and 3 times in the night) unless the mother becomes pregnant or sick. Usually, breastfeeding continues up to 24 months unless on special circumstances when breastfeeding stops (mother’s pregnancy and/or sickness). In the case when the mother is away, elder sister or grand mother feed babies with whatever is available (milk, porridge, tea with milk or sugar solution) with a cup or traditional bowl. Mothers and elder sister usually assist young children (less than three years) in the feeding. Sometimes food preparation is done under poor unhygienic condition mainly due to lack of water and/ or simply the caretaker/mother not being sensitive on cleanliness. Through focus group discussion it was revealed that sorghum porridge is usually prepared for infants and is given with a cup or some times with spoon. Infants are given between 1/8 - 1/4 of a litre of porridge at one feed with a cup for 3-4 times/ day or on child’s demand. The ingredients and composition of the porridge depends on the household income and purchasing power, with the poor households inclining to give less dense food. Normally, the porridge consists of sorghum flour with any one of the following items, sesame oil, vegetable oil, sugar or milk. Over the past few months, the porridge consumed mainly consists of sorghum flour with milk only and sometimes without milk. It was reported also that there is tendency of holding back food when children are sick and presenting them late at the health facility when home remedies have failed. Normally, families consume three meals unlike in stress period when they get one or two meals a day. Families eat sorghum, meat and milk in a normal day and in case of stressful situation, sorghum and meat or sorghum and milk, if milk and meat are available and affordable. Wild food, dik dik and some wild fruit in particular, is consumed during stress period. Additional qualitative information on childcare indicated that most of mothers/caretakers do not have enough time to devote to their children due to their involvement in household income activities as well as household chores. Some mothers are the breadwinners of the households besides fetching water, fire wood and cooking food etc. The mothers/ caretakers are sometimes fatigued leading to less attention to their children. Sometimes childcare is delegated to siblings in the absence of the caretaker/mother. During pregnancy, mothers avoid consumption of some foodstuffs as they prefer others. Women reported reduced consumption of liver and milk during pregnancy to control foetal growth1. When breastfeeding, mothers consume more and prefer better quality food (liver and milk) if they can afford. In case of sickness mothers prefer soft food. Mothers have limited access to information on good childcare practices, much of which is given at the limited health facilities. Beside access problem, it was reported that mothers are expected to get consent from their husbands before seeking medical assistance. Regarding intra household childcare aspects, there is no sex bias rather priority is given to the youngest children at the time of feeding and attention.
1 Birth of large babies is reported to contribute to difficulties during delivery, particularly in the light of limited quality gynaecological services available in most parts of Somalia.
17

6. ANALYSIS OF FINDINGS 6.1 Nutrition status improves with consorted humanitarian response The prevalence of total/global acute malnutrition among children in Rabdure district (14.8%) was an unacceptably high. However, the survey result depicts an improvement of nutritional situation in Rabdure with a noticeable drop from 19.2% in October 2001 to 14.8% in global acute malnutrition. A similar drop was also realized in severe acute malnutrition2 i.e. 1.9% down from 2.9% in October 2001. The drop is partly attributed to the impact of the on-going humanitarian interventions and partly to the short-lived improvement in food security during May and June 2002 (following some Gu rains). The humanitarian interventions improved access to food among vulnerable households as well as improving the population’s access to essential health services. The water and pasture situation slightly improved during the Gu season. It is notable that before the commencement of the current interventions, the food security indicators showed significant deterioration. The Gu 2001 rains were very low resulting to poor harvest/ near total crop failure in the district. There was also reduced pasture and severe water shortage that had caused outward livestock movement. In addition, was the arrival of internally displaced persons from Ethiopia between May and July 2001 that added strain on the population that was depending on limited resources and experienced food shortage. The poor nutritional situation documented in October 2001 (global acute malnutrition of 19.2%) was mainly attributed to food insecurity. This triggered the ongoing response by the humanitarian organisation. The interventions countered among others, the challenges of reduced food access and availability and erratic food prices. Besides providing ration for malnourished children’s families, WFP also supported food for work activities that included, among other things, construction of SFP MCH outreach sites, support to 4 SFP women groups who were implementing partners, rehabilitation of water catchment areas, pit latrine construction and agriculture related activities. This implicitly gave a boost to the general welfare of the Rabdure population. Regarding relationship between malnutrition and social economic variables, there was no significant relationship in almost all the factors with malnutrition.. However, it was found that children whose income is from casual labour and salaried employment are more likely to be malnourished compared with other sources. This could probably be due to compromised childcare. The current food security indications look bleak with recent outward movement of livestock from the district, following reduced pasture and water availability in most parts. Milk prices are on the increase implying milk access to the poor getting lower. The crop prospects are poor leading to a rise in cereal prices available in the district. Based on this, reliance on the current coping strategies, wild food collection and food aid, may persist. 6.2 Morbidity aspects and the health seeking behaviour A total of 22%, 25% and 16% of the malnourished children had diarrhoea, ARI and malaria respectively. ARI (p<0.05), malaria (p=0.03) and diarrhoea (p=0.04) were found to be significantly associated with wasting in children. The survey also revealed that diarrhoea was significantly associated to children age categories with those likely to be breastfeeding (between 6-23months) (p<0.05) being likely to have diarrhoea. This could probably have resulted from immediate introduction of food other than breast milk after birth. This is also the crawling age at which children get in touch with dirt. Of those children with diarrhoea, malaria and ARI, 83%, 70% and 71% were less than 36 months. Diseases seem to suppress the immunity of the children in Rabdure therefore putting them at risk of malnutrition. Diseases usually lead to increased nutritional demands to make up for the tissue breakdown. Also poor childcare practices (introduction of weaning foods) have been identified to contribute to diseases and possibly to malnutrition. The high measles immunisation coverage (80%) and Vitamin A supplementation (83%) is a positive indication of a boost to the Rabdure children’s immunity. Further about 73% of the children were vaccinated against measles in
2 Severe acute malnutrition based on <-2 z score or oedema cut off level
18

last six months (recent past). The high vaccination and immunisation coverage could be attributed the ongoing health interventions and the regular WHO anti-polio campaigns. Though high, the prevalences of various diseases were lower than those reported in the Oct 2001 survey report. For example, about 27% of the children surveyed in Oct 2001 had diarrhoea two weeks prior to the survey, 16% had ARI, 19% had malaria and 3% had measles a month prior to the survey. In the August 2002 survey report, about 16% of the children had diarrhoea, 15% had ARI, 11% had malaria and about 1.2% had measles. The relative decline in the disease prevalence is a positive aspect that could have contributed to the drop in the current rate of malnutrition (August 2002 survey). Public health facility and traditional healer seem to be major sources of health services when a child is sick in Rabdure district with almost 71% and 23% respectively. However, distance could be limiting utilisation of the health facility. The availability of only one MCH in Rabdure town and six health posts that are located in main villages calls for long distance trekking of health service seekers. In effect some people do not access the services. Inadequate access to safe water and poor human excreta disposal remain a major concern in Rabdure district. About 69% and 23% of the visited households use open hand dug wells and water pond/catchment as the main water source respectively. A total of 86% out of 502 respondents use bush/open ground for defecation, an indication of poor sanitary condition especially during wet weather. Of the 14% that use latrines, 36% were observed dirty and in bad condition. In rural village, children defecate around their settlement and water catchments. This implies need for community sensitisation on proper hygiene and environmental sanitation practices. 6.3. Childcare practices as it influences nutrition status of the Rabdure District. Exclusive breastfeeding and sound complementary feeding practices are crucial for enhancing the nutritional and health status of infants and young children. Unfortunately, a large proportion of children surveyed (90%) in Rabdure were introduced to foods other than breast milk before four months while about 25% of the children were breastfed for less than a year. This is a major impediment to optimal growth for children in Rabdure. In addition, feeding young children less dense food and limited in diversity reduces energy and other nutrients availability and access to the young children. The unhygienic conditions under which the foods are sometimes prepared exposes food to contamination and may predispose children to risk of diarrhoea episodes and finally reduced resistance to other common infections. It was notable that about 28% of children between 12 and 23 months had diarrhoea two weeks prior to the survey. It is not surprising therefore that high malnutrition (19%) were recorded among children aged 12-23 months. Some feeding habits among expectant mothers limit consumption thus increasing chances of delivery of low birth weights. Through the ongoing health and nutrition intervention activities coupled with the WHO’s anti-Polio campaigns, the Vitamin A coverage has tremendously improved on comparison with the previous survey results. About 83% of the surveyed children had received Vitamin a supplementation six months prior to the survey up from 66% coverage recorded in October 2001. Measles immunisation coverage had also improved from 66% (Oct 2001) to 80% (Aug 2002). Though the immunisation and supplementation coverage improved, diseases continue to hamper children’s proper growth hence continued recording of unacceptable levels of malnutrition (14.8%). The practice of holding back food when children are sick and the tendency to present sick children to the health facility when home remedies fail is likely to have negative effects on child’s well being. The bureaucracy within households (particularly in light of 79% of the households being male headed) for a decision to be made on seeking health services also limits fast seeking of help, further advancing possibility of health status deterioration for the mothers and for children. Regarding feeding the food variety accessible to the children is limited to sorghum porridge and milk which is not usually regular. The diet consumed by children at age twelve months is monotonous and mainly dictated by local
19
availability and price of foods in the market. About 88% of the children are fed more than two meals in a day. Meals for the adults mainly consist of sorghum or maize and meat. Additional qualitative information collected indicated that most of mothers do not have enough time to devote to their children because mostly mothers are the breadwinners of the households besides fetching water, fire wood collection and cooking food etc. This has likely consequence of compromised childcare. On overall the nutrition situation in Rabdure has improved. However, the current malnutrition rates indicate fragility of the situation that has been improved by UNICEF/IMC/WFP interventions since the end of 2001. The problems of food availability and access faced by poor households combined with the high incidence of diseases, poor sanitary practices and limited access to safe water are factors contributing to the high malnutrition rates. These problems must be urgently addressed to sustain the progress and prevent further nutritional situation deterioration.
7 RECOMMENDATIONS Recommendations to alleviate the immediate causes of malnutrition such as diseases and inadequate dietary intake are important and urgent in the light of the global acute malnutrition in Rabdure district. •
•
•
•
•
•
Continuation of UNICEF/IMC and WFP intervention in SFP and family food ration to malnourished children until support systems are put in place to prevent a deterioration of the situation.
• Need to consider strategy of distributing general rations to increase access to food and prevent displacements
until good harvest.
Continuation of WFP food for work to complement food shortage in the area until good harvest.
To address the issues of limited access to water and need for other sectors including Water & Environmental Sanitation, Agricultural and Veterinary sectors to take a more proactive role in addressing malnutrition.
To initiate income generating activities to improve the socio-economic situation of Rabdure district by introduce small-scale credit system.
To continue the supportive supervisory visits to outreach feeding programme and feeding centres in Rabdure district to monitor progress.
Intensifying health and nutrition education activities at the household level to address care concerns, targeting mothers, fathers and other caregivers. The main areas of focus should include promoting exclusive breastfeeding, appropriate young child feeding, diet diversification, and improvements in household hygiene and health care practices. Also continued support of primary health care is crucial.
20
REFERENCES FSAU Monthly Food Security Report, 2002 FSAU Nutrition Update Report, 2002 and 2001 Maxwell, S. & Frankenberger, T. R. (1992) Household Food Security: Concepts, Indicators, Measurements New York and Rome UNICEF/IFAD SACB/Nutrition Working Group 1999, Nutrition Survey, Recommendations for Somalia UNICEF, 1990. Strategy for Improved Nutrition of Children and Women in Developing Countries New York: UNICEF UNICEF Somalia, 1998, Children and Women in Somalia, A Situation Analysis WHO Regional Office for the Eastern Mediterranean, 1995 Field Guide on Rapid Nutritional Assessments in Emergencies.
21

ANNEX:1 Estimated population, cumulative and total clusters. NAME Estimated Cumulative Total clusters Populations Populations Arunlei 300 300 Lahelo 300 600 1 Imilka 600 1200 2 Guubey 400 1600 3 Rab Dhuure 2400 4000 4, 5,6, 7, 8, 9 Quracle 400 4400 10 Maduul 200 4600 Dhurey 300 4900 11 Yeed 400 5300 12 Riiga 200 5500 Lawareegow 300 5800 13 Haboow 300 6100 14 Dambas / Daremaley 200 6300 Waabgarad 300 6600 15 Raxale 300 6900 16 Caatow 400 7300 17 Dhoobaale 300 7600 Hurre 300 7900 18 Boodaan 500 8400 19 Warsankoor/Warxajin 400 8800 20 Wardhujiiley 680 9480 21, 22 Koronkoor 120 9600 Isdhowrto 400 10000 23 Wartiriibka 200 10200 Sadexbuurood 200 10400 24 Warxinshile 300 10700 Warbarbaar 200 10900 25 Banaaneey 200 11100 Lagalaay 200 11300 26 Cimilow 400 11700 27 Doonful 200 11900 Bakal 300 12200 28 Biyocadoweyn 200 12400 Iskiri 300 12700 29 Lowijiiley 100 12800 Wargomoro 200 13000 30 Total 13000 Sampling Interval 433 Random selection 378
22

TRADITIONAL CALENDAR FOR NUTRITION SURVEY IN RABDURE DISTRICT ANNEX:2 Month Events 1997 1998 1999 2000 2001 2002 Jan. Beginning
of Jiilal
55 Soonfur
43 Soonfur
31 Soonfur
19 Soonfur
7 Soonfur
Feb. Mid of Jiilaal
54 Siditaal
42 Siditaal
30 Siditaal
18 Siditaal
6 Siditaal
Mar. End of Jiilaal
53 Arafo/Dul-Xaj
41 Arafo/Dul-Xaj
29 Arafo/Dul-Xaj
17 Arafo/Dul-Xaj
5 Arafo/Dul-Xaj
Apr. Beginning of Gu’
52 Sako
40 Sako
28 Sako
16 Sako
4 Sako
May Mid of Gu’
51 Safar
39 Safar
27 Safar
15 Safar
3 Safar
Jun. End of Gu’
50 Mawliid
38 Mawliid
26 Mawliid
14 Mawliid
2 Mawliid
Jul. Beginning of Xagaa
49 Malmadoone
37 Malmadoone
25 Malmadoone
13 Malmadoone
1 Malmadoone
Aug. Mid of Xagaa
48 Jamadul-Awal
36 Jamadul-Awal
24 Jamadul-Awal
12 Jamadul-Awal
Sep. End of Xagaa
59 Jamadul-Akhir
47 Jamadul-Akhir
35 Jamadul-Akhir
23 Jamadul-Akhir
11 Jamadul-Akhir
Oct. Beginning of Deyr
58 Rajab
46 Rajab
34 Rajab
22 Rajab
10 Rajab
Nov. Mid of Deyr
57 Shacbaan
45 Shacbaan
33 Shacbaan
21 Shacbaan
9 Shacbaan
Dec. End of Deyr
56 Ramadan
44 Ramadan
32 Ramadan
20 Ramadan
8 Ramadan
Jiilaal GU’ Xagaa Deyr
23


