KENYA MISSION NUTRITIONAL ANTHROPOMETRIC SURVEYS FINAL REPORT PASTORAL, RIVER BANK AND URBAN COMMUNITIES OF GARISSA, LAGDERA AND FAFI DISTRICTS (FORMALLY GARISSA DISTRICT) NORTH EASTERN PROVINCE, KENYA 19 TH NOVEMBER – 4 TH DECEMBER 2007 ACTION AGAINST HUNGER (ACF-USA) MINISTRY OF HEALTH UNICEF
Transcript
KENYA MISSION
NUTRITIONAL ANTHROPOMETRIC SURVEYS
FINAL REPORT
PASTORAL, RIVER BANK AND URBAN COMMUNITIES OF GARISSA, LAGDERA AND FAFI DISTRICTS (FORMALLY GARISSA DISTRICT)
NORTH EASTERN PROVINCE, KENYA
19TH NOVEMBER – 4TH DECEMBER 2007
ACTION AGAINST HUNGER (ACF-USA) MINISTRY OF HEALTH
UNICEF
2
ACKNOWLEDGMENTS AAH would like to express its deep gratitude to the Ministry of Health and UNICEF in Garissa district, for Participating in the survey We would like to thanks AAH staff, particularly the management team for the preparation of the survey, logistics, personnel and administrative issues, fieldwork without which this survey would not have been possible. We appreciate the team members (Measures, Data recorders and Supervisors) who were involved in ensuring the survey obtained good quality data. Thanks also to all the drivers who ensured timely movement of field staff. We finally wish to say many thanks to the mothers and the fathers who pleasantly allowed the team to measure their children and patiently sat through the interviews and shared with the team valuable information without which the survey would not have been possible. AAH would like to thank the following people for their support and assistance without which the survey would not have been possible. Special thanks are due to the Chief of all the divisions and the elders of Garrisa, Lagdera and Fafi districts, for their support during the survey, and to the elders and some home visitors for their support during the survey
3
Table of content
I EXECUTIVE SUMMARY ............................................................................................................................................ 4 II INTRODUCTION .......................................................................................................................................................... 9 III METHODOLOGY................................................................................................................................................... 9
III.1 Type of Survey and Sample Size..............................................................................................................9 III.2 Data Collection ........................................................................................................................................10 III.3 Indicators, Guidelines, and Formula’s Used ...........................................................................................10
III.4 Field Work ...............................................................................................................................................11 III.5 Data Analysis ..........................................................................................................................................12
IV RESULTS OF THE QUALITATIVE ASSESSMENT ....................................................................................... 12 IV.1 Social demographic characteristics.........................................................................................................12 IV.2 Water and sanitation ...............................................................................................................................12 IV.3 Nutrition and food security ......................................................................................................................13 IV.4 Health ......................................................................................................................................................13
V RESULTS OF THE ANTHROPOMETRIC SURVEY ............................................................................................ 14 V.1 ANTHROPOMETRIC RESULTS IN PASTORAL COMMUNITY ............................................................14
V.1.1 Distribution by Age and Sex.............................................................................................................14 V.1.2 Anthropometrics Analysis ................................................................................................................14
V.2 ANTHROPOMETRIC RESULT IN GARISSA RIVER BANK COMMUNITIES .......................................16 V.2.1 Distribution by Age and Sex.............................................................................................................16 V.2.2 Anthropometrics Analysis ................................................................................................................17
V.3 ANTHROPOMETRIC RESULT IN GARISSA URBAN COMMUNITIES.................................................18 V.4 MEASLES VACCINATION COVERAGE ................................................................................................19 V.5 COMPOSITION OF THE HOUSEHOLDS ..............................................................................................19
VI RESULTS OF THE RETROSPECTIVE MORTALITY SURVEY ................................................................. 19 VII DISCUSSION AND CONCLUSION.................................................................................................................... 20
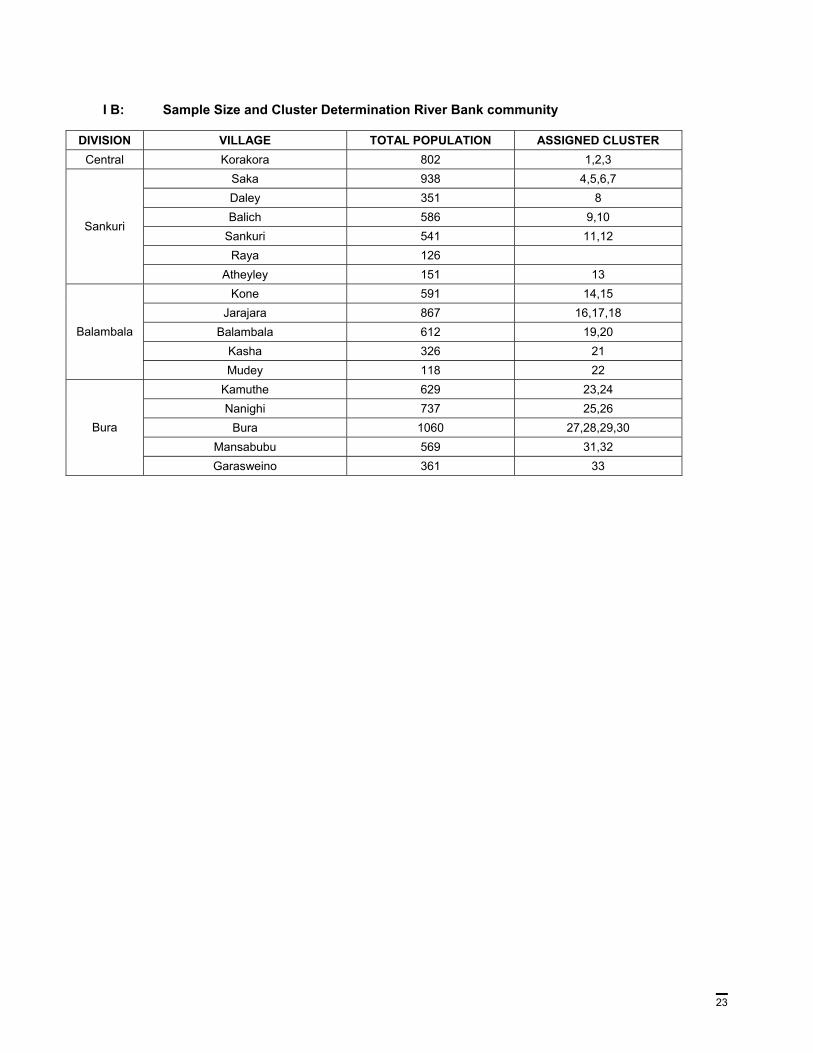
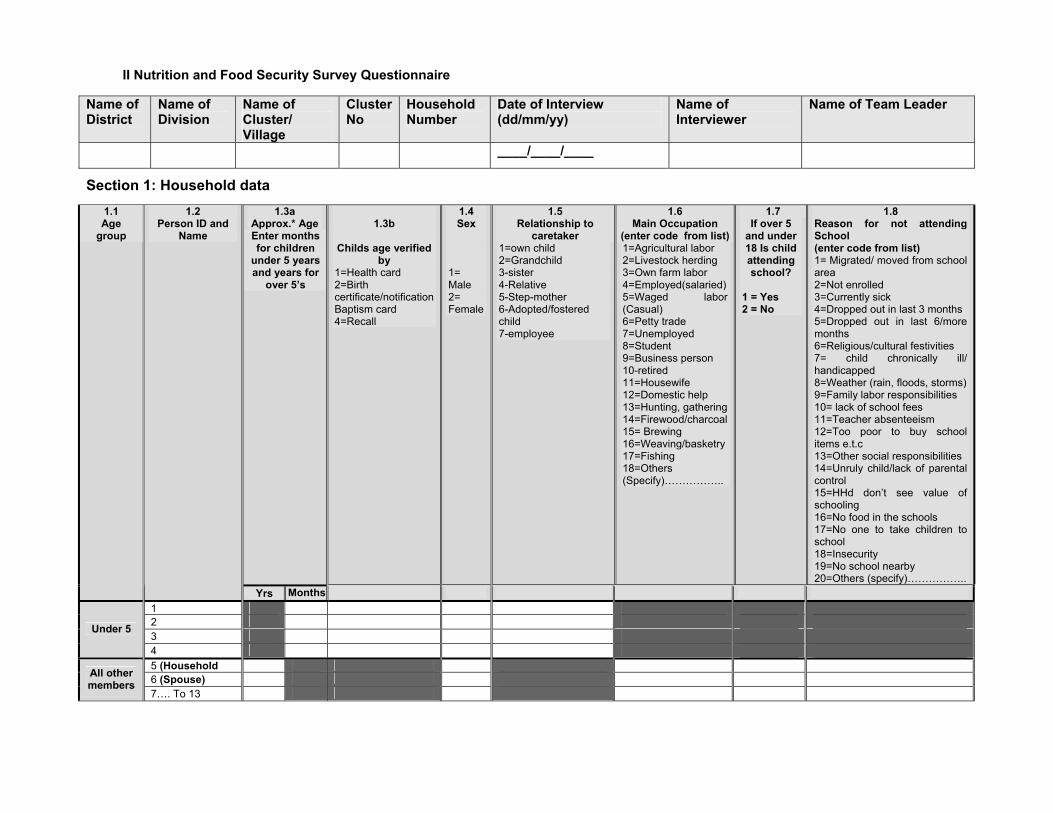
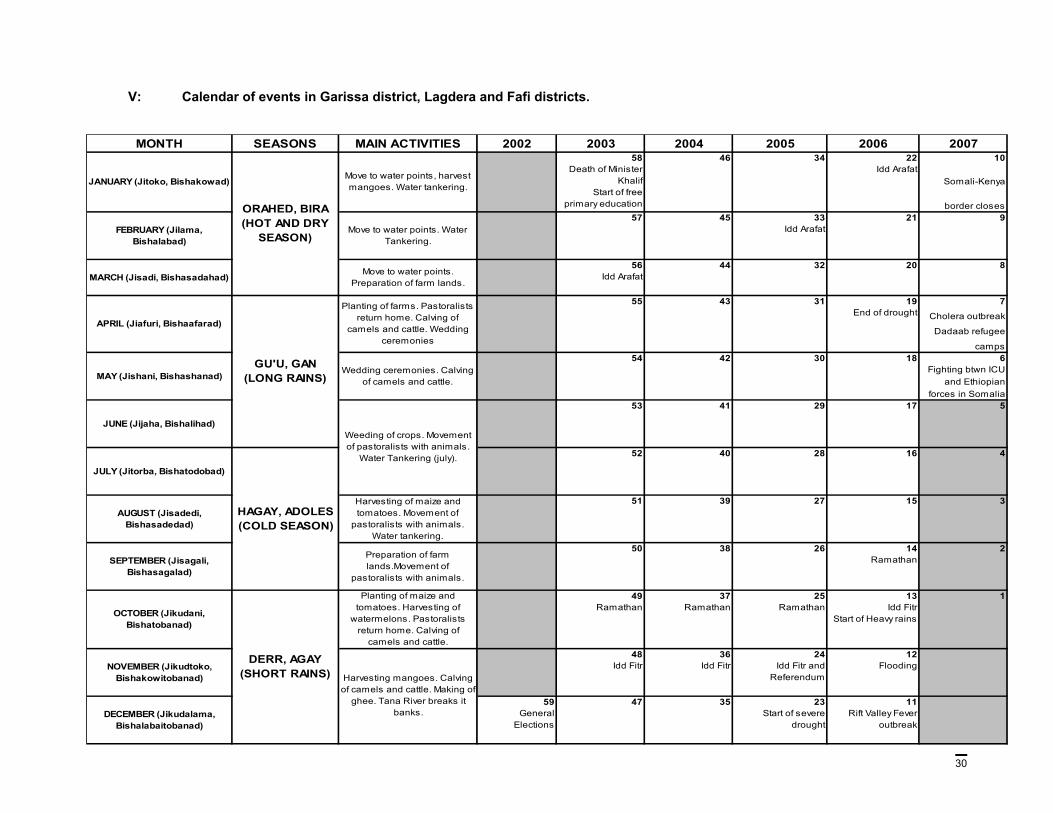
Appendix ............................................................................................................................................................22 I A: Sample Size and Cluster Determination Pastoral Community....................................................................22 I B: Sample Size and Cluster Determination River Bank community............................................................23 II Nutrition and Food Security Survey Questionnaire.........................................................................................24 Section 1: Household data.................................................................................................................................24 Section 2: Data for Children aged 6 – 59 months..............................................................................................25 Section 3: Household water consumption..........................................................................................................26 Section 4: Sanitation – Toilet facility ..................................................................................................................26 Section 5: DIETARY DIVERSITY ......................................................................................................................27 Section 6: FOOD SECURITY ............................................................................................................................27 Section 7: Malaria ..............................................................................................................................................27 III Household enumeration data collection form for a death rate calculation survey....................................28 IV Enumeration data collection form for a death rate calculation survey......................................................29 V: Calendar of events in Garissa district, Lagdera and Fafi districts. ...........................................................30
4
I Executive summary
INTRODUCTION Garissa District is one of the four districts of North Eastern Province. It boarders Isiolo District to the Northwest, Wajir to the North, Republic of Somalia to the East, Tana River District to the West and Ijara District to the South. The district covers an area of 33,620 km² and is administratively divided into 11 divisions, 42 locations and 60 sub locations. Garissa is the major town of the district which accounts for more than 20% of the district population. The rest of the population is nomadic and shift with the livestock in search for water and pasture. Garissa is low lying with altitudes ranging between 70m and 400m above sea level. The district is generally arid. The soils range from the sandstone, dark clays in some patches, to alluvial soils along the River Tana basin. The River Tana, which runs along the western boundary of the district, is the only permanent river. It has tremendous influence over the climate, settlement patterns, and economic activities within the district, as it forms the single most important source of water for the fast growing Garissa Town and the surrounding areas. The district receives rain in two seasons, these are the long rains season between March and April and the short rain season between October and December. The rainfall is unreliable with some torrential rains which in many cases are detrimental to vegetation growth. North Eastern province has been in the past hit by droughts and floods increasing the vulnerability of the populace in the region. In 2006 floods hit the province especially Garissa district that resulted to increased number of malnourished children in the district. To address this issue, Action Against Hunger collaborated with the MOH in establishing an Outpatient Therapeutic Program in 2007. A nutrition survey was done in the district, covering Modogashe, Shant Abak, Sunkuri and Bura divisions (the river bank and the pastoral communities), in October 2005 by MOH and UNICEF. It revealed a GAM of 18.6% (16.0%- 21.5%) and a SAM of 3.1% (2.4%-5.0%). The results of this survey are not be to directly compared to the ones presented in the present report, as it does cover a different geographic frame. In 2007, ACF-USA, the MOH and UNICEF decided to assess the nutritional status of the population of the district. Due to the heterogeneity of the communities in the district, 3 surveys were conducted into three livelihood zones namely pastoral, river bank and urban areas. The surveys were done from 20th November to 4th December 2007 with the following specific objectives.
To evaluate the nutritional status of children aged 6 to 59 months. To estimate the measles immunization coverage of children aged 9 to 59 months. To estimate the crude mortality rate through a retrospective survey To build the capacity of MOH in detection of malnutrition.
METHODOLOGY SMART1 methodology was utilized in the training, planning, collection and analysis of both anthropometric and mortality data. The SMART methodology was applied for the calculation of the sample size for each livelihood area. The sampling frame covered all accessible villages in the divisions selected. The clusters were selected with the Nutrisurvey software. In each cluster, the EPI method was applied in the random selection of households. At first the centre of the clustered sub village was identified and thereafter a pen was spun to determine a starting direction so as to eliminate bias towards the centre. The survey team then moved along the pointed direction to the periphery of the village where the pen was re-spun and a starting point established using simple balloting. The next
1 Standardized Monitoring and Assessment In relief and Transition.
5
households were determined through proximity or to the right depending on household distribution in the villages. All the children aged between 6 and 59 months of the same family, defined as a woman and her children living the same household, were included in the survey if there are. A retrospective mortality survey over the past three months was undertaken alongside the anthropometric survey, using SMART methodology. Qualitative data was gathered alongside the aforementioned. A structured qualitative questionnaire and observation was used to collect secondary data in regard to Maternal and Child Health (MCH); Water, Sanitation and Hygiene (WASH); food security; availability and use of health facilities. The questionnaire was systematically administered in every household that had children under five. Nutrition and mortality data were analyzed using Nutrisurvey version October 2007 software. SUMMARY OF FINDINGS Context description The district has been divided into three livelihood zones namely urban, river bank and pastoral communities. The urban community relies on both formal and informal employment for their income; the river bank community practice farming along the Tana River; the pastoral community keeps cattle, camels and goats. Food production in Garissa district is limited and variable due to unreliable weather patterns. The district is a net importer of food (mainly rice and maize). Thus accessibility to the markets forms a critical component of household food security in the district. Being largely pastoralist, the inhabitants of Garissa draw heavily on their livestock assets for income and food needs. However, the district is prone to rain failure and cyclical droughts, livestock disease outbreaks, insecurity due to cattle rustling and flooding, that have severely hampered pasture growth, livestock rearing and agricultural activities. These have disastrous effects on household food security. The consequent decrease in purchasing power lowers affordability of food in the markets predisposing the households to starvation.
6
As a result of perennial food insecurity and humanitarian crisis in the district both UN agencies and humanitarian organizations have been running different programs, the main ones are listed below.
• World food program- Food distribution • UNICEF- Nutrition, health, water and sanitation • WHO- Health • Red Cross Food distribution, health and nutrition • AAH- Nutrition, food security and Water and sanitation. • CARE- food security and Water and Sanitation • GTZ- Health and Nutrition in the refugee camps
Nutrition and Mortality Survey Results
1. River bank community
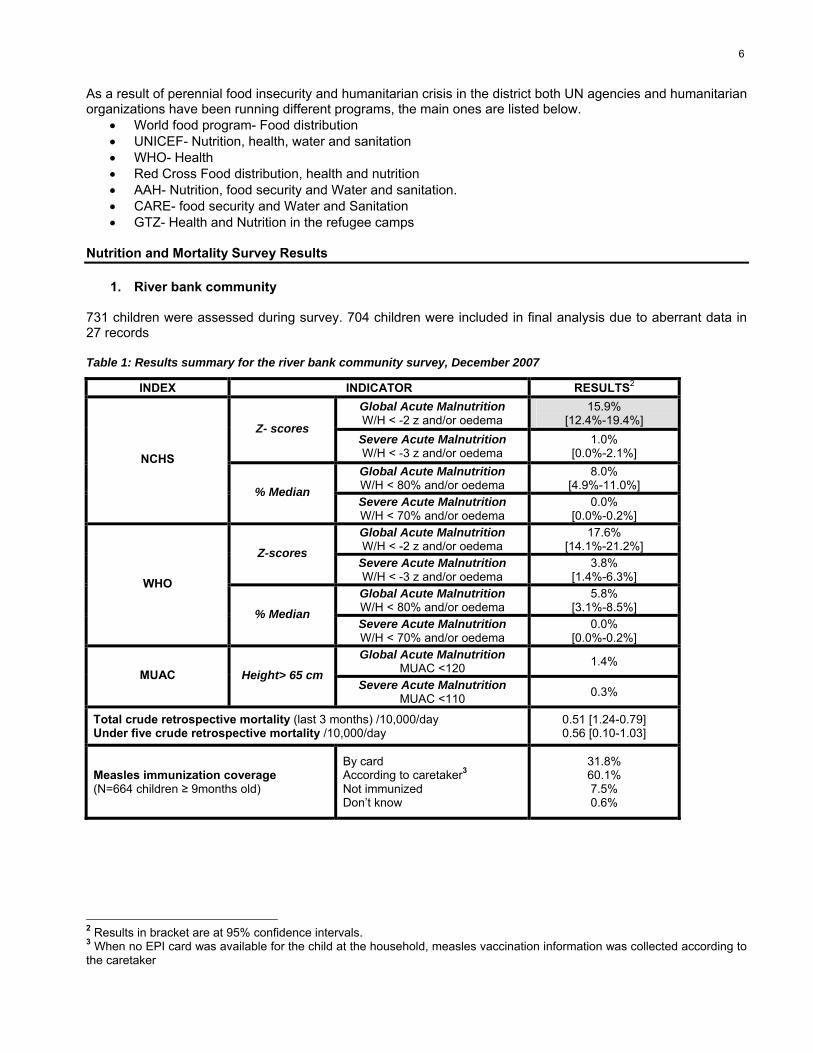
731 children were assessed during survey. 704 children were included in final analysis due to aberrant data in 27 records Table 1: Results summary for the river bank community survey, December 2007
INDEX INDICATOR RESULTS2 Global Acute Malnutrition W/H < -2 z and/or oedema
15.9% [12.4%-19.4%]
Z- scores Severe Acute Malnutrition W/H < -3 z and/or oedema
1.0% [0.0%-2.1%]
Global Acute Malnutrition W/H < 80% and/or oedema
8.0% [4.9%-11.0%]
NCHS
% Median Severe Acute Malnutrition W/H < 70% and/or oedema
0.0% [0.0%-0.2%]
Global Acute Malnutrition W/H < -2 z and/or oedema
17.6% [14.1%-21.2%] Z-scores
Severe Acute Malnutrition W/H < -3 z and/or oedema
3.8% [1.4%-6.3%]
Global Acute Malnutrition W/H < 80% and/or oedema
5.8% [3.1%-8.5%]
WHO
% Median Severe Acute Malnutrition W/H < 70% and/or oedema
0.0% [0.0%-0.2%]
Global Acute Malnutrition MUAC <120 1.4%
MUAC Height> 65 cm Severe Acute Malnutrition
MUAC <110 0.3%
Total crude retrospective mortality (last 3 months) /10,000/day Under five crude retrospective mortality /10,000/day
0.51 [1.24-0.79] 0.56 [0.10-1.03]
Measles immunization coverage (N=664 children ≥ 9months old)
By card According to caretaker3 Not immunized Don’t know
31.8% 60.1% 7.5% 0.6%
2 Results in bracket are at 95% confidence intervals. 3 When no EPI card was available for the child at the household, measles vaccination information was collected according to the caretaker
7
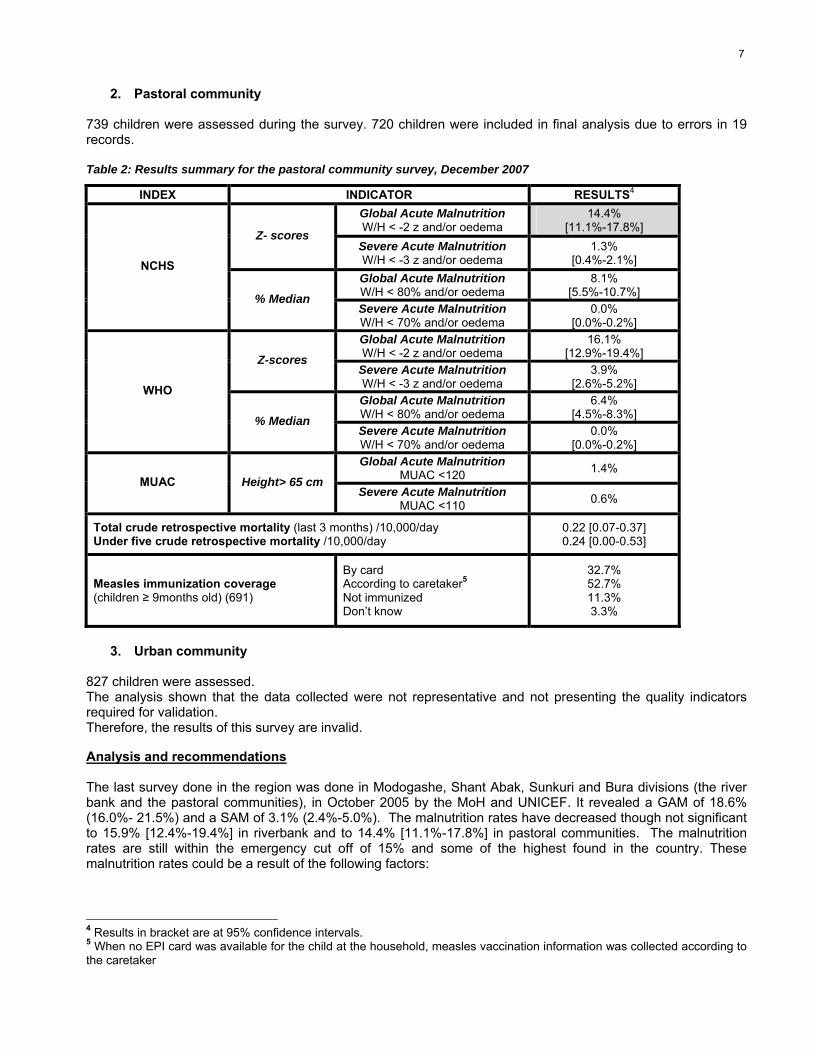
2. Pastoral community 739 children were assessed during the survey. 720 children were included in final analysis due to errors in 19 records. Table 2: Results summary for the pastoral community survey, December 2007
INDEX INDICATOR RESULTS4 Global Acute Malnutrition W/H < -2 z and/or oedema
14.4% [11.1%-17.8%]
Z- scores Severe Acute Malnutrition W/H < -3 z and/or oedema
1.3% [0.4%-2.1%]
Global Acute Malnutrition W/H < 80% and/or oedema
8.1% [5.5%-10.7%]
NCHS
% Median Severe Acute Malnutrition W/H < 70% and/or oedema
0.0% [0.0%-0.2%]
Global Acute Malnutrition W/H < -2 z and/or oedema
16.1% [12.9%-19.4%] Z-scores
Severe Acute Malnutrition W/H < -3 z and/or oedema
3.9% [2.6%-5.2%]
Global Acute Malnutrition W/H < 80% and/or oedema
6.4% [4.5%-8.3%]
WHO
% Median Severe Acute Malnutrition W/H < 70% and/or oedema
0.0% [0.0%-0.2%]
Global Acute Malnutrition MUAC <120 1.4%
MUAC Height> 65 cm Severe Acute Malnutrition
MUAC <110 0.6%
Total crude retrospective mortality (last 3 months) /10,000/day Under five crude retrospective mortality /10,000/day
By card According to caretaker5 Not immunized Don’t know
32.7% 52.7% 11.3% 3.3%
3. Urban community
827 children were assessed. The analysis shown that the data collected were not representative and not presenting the quality indicators required for validation. Therefore, the results of this survey are invalid. Analysis and recommendations The last survey done in the region was done in Modogashe, Shant Abak, Sunkuri and Bura divisions (the river bank and the pastoral communities), in October 2005 by the MoH and UNICEF. It revealed a GAM of 18.6% (16.0%- 21.5%) and a SAM of 3.1% (2.4%-5.0%). The malnutrition rates have decreased though not significant to 15.9% [12.4%-19.4%] in riverbank and to 14.4% [11.1%-17.8%] in pastoral communities. The malnutrition rates are still within the emergency cut off of 15% and some of the highest found in the country. These malnutrition rates could be a result of the following factors:
4 Results in bracket are at 95% confidence intervals. 5 When no EPI card was available for the child at the household, measles vaccination information was collected according to the caretaker
8
Health Access. The health centres in the three districts are spread out, and some villages are far away from these units. Poor road network and transport means result in to limited access to health care. The government of Kenya, in the recent years, has made constant supplies of drugs to all the health centres, the only major draw back being that most of these facilities don’t have enough staff to cater for the populace adequately. Malaria and diarrhoea have been reported as the major diseases affecting the communities in the region.
Water and Sanitation. The availability of water in the North Eastern province has been a major
challenge for the residents of the region, but Garissa is endowed with a permanent river (Tana river) that has been instrumental in provision of water for the communities especially for urban and river bank communities. In the pastoral region bore holes are the major source of water and most of the populace have a source of safe water, though some villages rely on water trucking during the dry seasons. Water availability and access in the pastoral communities is still a major challenge. Sanitation in the region is wanting; only 26% and 32.2% of the pastoral and river bank communities have access to toilet which can be a major health hazard as most of the populace defecate in bush. This could lead to contamination of the water sources especially during the wet seasons; this could also explain why diarrhoea is one of the most common diseases in the districts.
Food Security. The Tana River has contributed significantly to the accessibility of some food crops in
the region. The riverbank communities mainly farm vegetables, fruits and maize. The pastoral communities mainly rely on cattle keeping as their main source of livelihood. The major food source for both communities is through purchase; hence most of the people spend money every day for the purchase of household food. Food aid has been another source, as 50% of the communities said that they had received Food Aid in the last three months. Food diversification is a major challenge in the region; among the 12 food groups in the household food diversification table, the river bank had an average of 5.3 while river bank had 6.5 score. This shows that most of the populace had not diversified their food; they mainly ate cereals, meat and milk while fruits and vegetables scored poorly.
Nutrition and Health Education. Inadequate nutrition and health practices have been observed among
the mothers, regarding topics such as proper breastfeeding, weaning, balanced diets and food safety. In order to improve the nutrition status of the surveyed communities, we recommend the following: Health and nutrition Integration of nutritional treatment activities in the existing health facilities Increase of the number of outreach programs to cover other parts of the districts. This will help in screening the children and in early decision taking.
Implementation of a provisory mobile clinic in every division to enhance the access of heath services Nutrition survey methodology Respect of SMART recommendations for the conduction of nutritional surveys in order to ensure the good quality of the data collected: maximum of five teams per survey, daily check of data, limitation of the qualitative questionnaire to the minimum necessary, etc.
Nutrition and health education Continuation of health education programs in the communities, schools and other institutions to improve hygiene practices.
Water and Sanitation Increase of the accessibility to safe water by construction/rehabilitation of earth pans and water storage tanks, particularly in Lagdera area.
Continuation of sanitation programs such as water protection, and increase of safe human waste disposals.
Food Security Device ways of enhancing food security of the pastoralist communities especially through improving grazing lands, establishing market for the livestock’s and improving crop cultivation especially along the rivers.
9
II INTRODUCTION
The district has been divided into three livelihood zones namely urban, river bank and pastoral communities. The urban community relies on both formal and informal employment for their income; the river bank community practices farming along the Tana River; the pastoral community keeps cattle, camels and goats. Food production in Garissa district is limited and variable due to unreliable weather patterns. The district is a net importer of food (mainly rice and maize). Thus accessibility to the markets forms a critical component of household food security in the district. Being largely pastoralist, the inhabitants of Garissa draw heavily on their livestock assets for income and food needs. However, the district is prone to rain failure and cyclical droughts, livestock disease outbreaks, insecurity due to cattle rustling and flooding, that have severely hampered pasture growth, livestock rearing and agricultural activities. These have disastrous effects on household food security. The consequent decrease in purchasing power lowers affordability of food in the markets predisposing the households to starvation. Table 3: Results for 2005 nutrition surveys done, results in Z-scores, reference NCHS
DIVISIONS GAM SAM
Modogashe, Shant Abak, Samkuri and Bura Divisions
18.6% [16.0%-21.5%]
3.1%[2.45-5.0%]
In order to continue monitoring the nutrition situation, anthropometric and retrospective mortality surveys were done in following divisions:
River bank community Pastoral community Urban community
III METHODOLOGY
III.1 Type of Survey and Sample Size
A two-stage cluster sampling method was used. The anthropometric surveys target children aged between 6 and 59 months utilizing SMART methodology, which ensures accuracy and precision of data collected. Selection of accessible villages was done using a map of the area indicating administrative boundaries of the divisions and villages. Information on population figures for the three zones was collected. The geographical units and their respective population were then inputted into the Nutrisurvey for SMART software October 2007 for planning the survey. The total population for all accessible villages in the different surveys is estimated as follows:
106,452 persons in Pastoral community 46,824 persons in River bank community
At the first stage, the sample size was determined by inputting necessary information into the Nutrisurvey software for both anthropometric and mortality surveys. The information included estimated population sizes, expected prevalence rates of mortality and malnutrition, the desired precision and the design effect. Pastoral community Sample size calculation. Utilizing malnutrition prevalence of 21.5% based on previous surveys, precision of 4% and design effect of 2, a sample size of 795 children was obtained. In the mortality session, an estimated prevalence of 0.87, a desired precision of 0.4 and a design effect of 2 resulted in a sample size 4,508.
10
River line community sample calculation Using malnutrition prevalence of 21.5% based on previous surveys, precision of 4% and design effect of 2, a sample size of 777 children was obtained. In the mortality session, an estimated prevalence of 0.87, a desired precision of 0.4 and a design effect of 2 resulted in a sample size 4,390. At the second stage, a selection of the households to be visited within each cluster was done. An adaptation of the EPI methodology was used whereby a pen was spun from the centre of the village to randomly choose a direction. The team then walked in the direction indicated to the edge of the village. At the edge of the village the pen was spun again, until it pointed into the body of the village. The team then walked along this second line counting each house on the way. Using simple balloting, the first house to be visited was selected at random by drawing a number between one and the number of households counted when walking. The next households were selected by always choosing the closest one on the right, till completion of the cluster sample. In each selected household, all children aged 6-59 months were included. If there was more than one wife (care taker) in the household6, each wife was considered separately regardless of whether they were cooking together. If there were no children in a household, the house remained a part of the “sample” that contributed zero children to the nutritional part of the survey. The household was recorded on the nutritional data sheet as having no eligible children. The mortality questionnaire was only administered in households that were included in the anthropometric questionnaire and numbered correspondingly.
III.2 Data Collection
For each selected child, information was collected during the anthropometric survey. The information included
• Age: recorded with the help of a local calendar of events • Gender: male or female • Weight: children were weighed without clothes, with a SALTER balance of 25kg (precision of 100g). • Height: children were measured on a measuring board (precision of 0.1cm). Children less than 85cm
were measured lying down, while those greater than or equal to 85cm were measured standing up. • Mid-Upper Arm Circumference: MUAC was measured at mid-point of left upper arm for measured
children (precision of 0.1cm). • Bilateral Oedemas: assessed by the application of normal thumb pressure for at least 3 seconds to
both feet. • Measles vaccination: assessed by checking for measles vaccination on EPI cards or by asking
caretakers.
III.3 Indicators, Guidelines, and Formula’s Used
III.3.1 Acute Malnutrition
Weight for Height Index Acute malnutrition rates are estimated from the weight for height (WFH) index values combined with the presence of Oedemas. The WFH indices are expressed in both Z-scores and percentage of the median, according to both NCHS7 and WHO references8. The complete analysis is done with the NCHS reference. The expression in Z-scores has mainly statistical meaning, and allows inter-study comparison. The percentage of the median, on the other hand, is used for the identification criteria of acute malnutrition in nutrition programs. Guidelines for the results expressed in Z-score: • Severe malnutrition is defined by WFH < -3 SD and/or existing bilateral Oedemas on the lower limbs
Moderate malnutrition is defined by WFH < -2 SD and ≥ -3 SD and no Oedemas. • Global acute malnutrition is defined by WFH < -2 SD and/or existing bilateral Oedemas.
6 A household refers to a caretaker and his/her children 7 NCHS: National Center for Health Statistics (1977) NCHS growth curves for children birth-18 years. United States. Vital Health Statistics. 165, 11-74. 8 WHO reference, 2005
11
Guidelines for the results expressed in percentage of median: • Severe malnutrition is defined by WFH < 70 % and/or existing bilateral Oedemas on the lower limbs • Moderate malnutrition is defined by WFH < 80 % and ≥ 70 % and no Oedemas. • Global acute malnutrition is defined by WFH <80% and/or existing bilateral Oedemas
Children’s Mid-Upper Arm Circumference (MUAC) The weight for height index is the most appropriate index to quantify wasting in a population in emergency situations where acute forms of malnutrition are the predominant pattern. However the mid-upper arm circumference (MUAC) is a useful tool for rapid screening of children at a higher risk of mortality. MUAC measurements are significant for children with a height of 65 cm or one year and above. The guidelines are as follows: MUAC < 110 mm severe malnutrition and high risk of mortality MUAC ≥ 110 mm and <120 mm moderate malnutrition and moderate risk of mortality MUAC ≥ 120 mm and <125 mm high risk of malnutrition MUAC ≥ 125 mm and <135 mm moderate risk of malnutrition MUAC ≥ 135 mm adequate’ nutritional status
III.3.2 Mortality
Mortality data was collected using Standardized Monitoring and Assessment of Relief. The crude mortality rate (CMR) is determined for the entire population surveyed for a given period. The CMR is calculated using Nutrisurvey for SMART software for Emergency Nutrition Assessment. The formula below is applied: Crude Mortality Rate (CMR) = 10,000/a*f/ (b+f/2-e/2+d/2-c/2), Where: a = Number of recall days (90) b = Number of current household residents c = Number of people who joined household d = Number of people who left household e = Number of births during recall f = Number of deaths during recall period The result is expressed per 10,000-people / day. The thresholds are defined as follows9: Total CMR:
Six teams composed of two measurers and one data recorder each executed the fieldwork. They were recruited within the local communities. All the data recorders and measurers participating in the survey underwent 4-day training. ACF-USA staff and MOH staff supervised the teams in the villages. The survey (including training, data collection and travelling) lasted for a period of 27 days.
9 Health and nutrition information systems among refugees and displaced persons, Workshop report on refugee’s nutrition, ACC / SCN, Nov 95.
12
III.5 Data Analysis
Data processing and analysis for both anthropometric and mortality were carried out using Nutrisurvey for SMART software, October 2007 version using both NCHS and WHO references. Excel was used to carry out analyses on MUAC, measles immunization coverage, household status and composition.
IV RESULTS OF THE QUALITATIVE ASSESSMENT
IV.1 Social demographic characteristics
Garissa district, North-Eastern Province, covers an area of 33,620 km2 with only about 1% being arable. Garissa is low lying with altitude varying between 70m to 400m above sea level. The climate is arid and rainfall is bimodal with mean annual rainfall of 434.8 mm but the rains are very unreliable. The soils range from sandstones (Balambala Division), dark clays in some patches (southern divisions) to fertile alluvial soils along the River Tana Basin. Except for the sandstones and the clays, the rest are fertile soils suitable for crop production in regions with adequate rainfall. Nomadism is the most common land use activity in the region.
IV.2 Water and sanitation
In all the communities, the nature of the main source of water was surveyed; the graph below shows the current water sources.
River was the main source for the riverbank community while Boreholes were the main water source for the pastoral community. It takes an average of 50 minutes to get water from their water source in both communities, and in both of them, the consumption is in average of 85 litres per day. 67% of the riverbank community members did not pay for the water they used for household consumption, while 42% of the pastoral community members paid 2 shillings to access their main waster source. Drinking water was not treated by 96.3% of the people of the pastoral community and by 80.5% of people of the river bank community. 26% and 32.2% only of the people had access to toilet facilities in the pastoral and the riverbank communities respectively. Among those who did not have access to toilet facilities, 89% in riverbank and 93.5% in pastoral communities disposed their human wastes in the bush. The table below shows how children wastes were disposed.
0
10
20
30
40
50
60
70
80
River
Water ta
p
Bore Hole
Protec
ted well da
m
Unprot
ected
wellTake
rLa
ga
Protec
ted sp
ring
Public
pan
Others
Main current sources of water
River Bank
Past oral
13
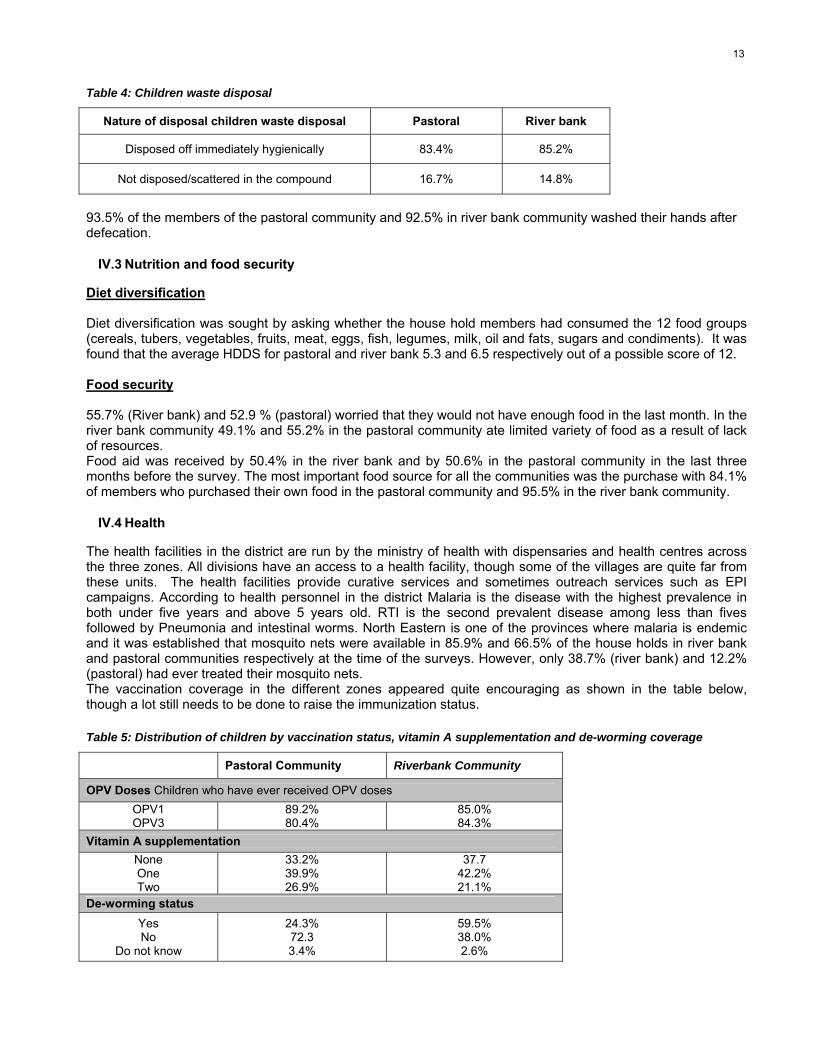
Table 4: Children waste disposal
Nature of disposal children waste disposal Pastoral River bank
Disposed off immediately hygienically 83.4% 85.2%
Not disposed/scattered in the compound 16.7% 14.8%
93.5% of the members of the pastoral community and 92.5% in river bank community washed their hands after defecation.
IV.3 Nutrition and food security
Diet diversification Diet diversification was sought by asking whether the house hold members had consumed the 12 food groups (cereals, tubers, vegetables, fruits, meat, eggs, fish, legumes, milk, oil and fats, sugars and condiments). It was found that the average HDDS for pastoral and river bank 5.3 and 6.5 respectively out of a possible score of 12. Food security 55.7% (River bank) and 52.9 % (pastoral) worried that they would not have enough food in the last month. In the river bank community 49.1% and 55.2% in the pastoral community ate limited variety of food as a result of lack of resources. Food aid was received by 50.4% in the river bank and by 50.6% in the pastoral community in the last three months before the survey. The most important food source for all the communities was the purchase with 84.1% of members who purchased their own food in the pastoral community and 95.5% in the river bank community.
IV.4 Health
The health facilities in the district are run by the ministry of health with dispensaries and health centres across the three zones. All divisions have an access to a health facility, though some of the villages are quite far from these units. The health facilities provide curative services and sometimes outreach services such as EPI campaigns. According to health personnel in the district Malaria is the disease with the highest prevalence in both under five years and above 5 years old. RTI is the second prevalent disease among less than fives followed by Pneumonia and intestinal worms. North Eastern is one of the provinces where malaria is endemic and it was established that mosquito nets were available in 85.9% and 66.5% of the house holds in river bank and pastoral communities respectively at the time of the surveys. However, only 38.7% (river bank) and 12.2% (pastoral) had ever treated their mosquito nets. The vaccination coverage in the different zones appeared quite encouraging as shown in the table below, though a lot still needs to be done to raise the immunization status. Table 5: Distribution of children by vaccination status, vitamin A supplementation and de-worming coverage
Pastoral Community Riverbank Community
OPV Doses Children who have ever received OPV doses OPV1 OPV3
89.2% 80.4%
85.0% 84.3%
Vitamin A supplementation None One Two
33.2% 39.9% 26.9%
37.7 42.2% 21.1%
De-worming status Yes No
Do not know
24.3% 72.3 3.4%
59.5% 38.0% 2.6%
14
V RESULTS OF THE ANTHROPOMETRIC SURVEY
V.1 ANTHROPOMETRIC RESULTS IN PASTORAL COMMUNITY
739 children were assessed during the survey. 720 children were included in final analysis due to errors in 19 records.
V.1.1 Distribution by Age and Sex
Table 6: Distribution by age and Sex in pastoral area
Total 376 52.2 344 47.8 720 100.0 1.1 The above table 2 shows the proportion of boys to girls gives a sex ratio (B/G) of 1.1 this is acceptable. Figure 1: Distribution by Age and Sex
V.1.2 Anthropometrics Analysis
Distribution of Acute Malnutrition in Z-Scores
Table 7: Weight for Height distribution by age in Z-scores in pastoral area (NCHS Reference)
Severe wasting (<-3 z-scores)
Moderate wasting [>= -3 and <-2 z-
scores] No wasting
(> = -2 z scores) Oedemas Age groups (months) N
n % n % n % n % 6-17 120 2 1.7 14 11.7 104 86.7 0 0.0
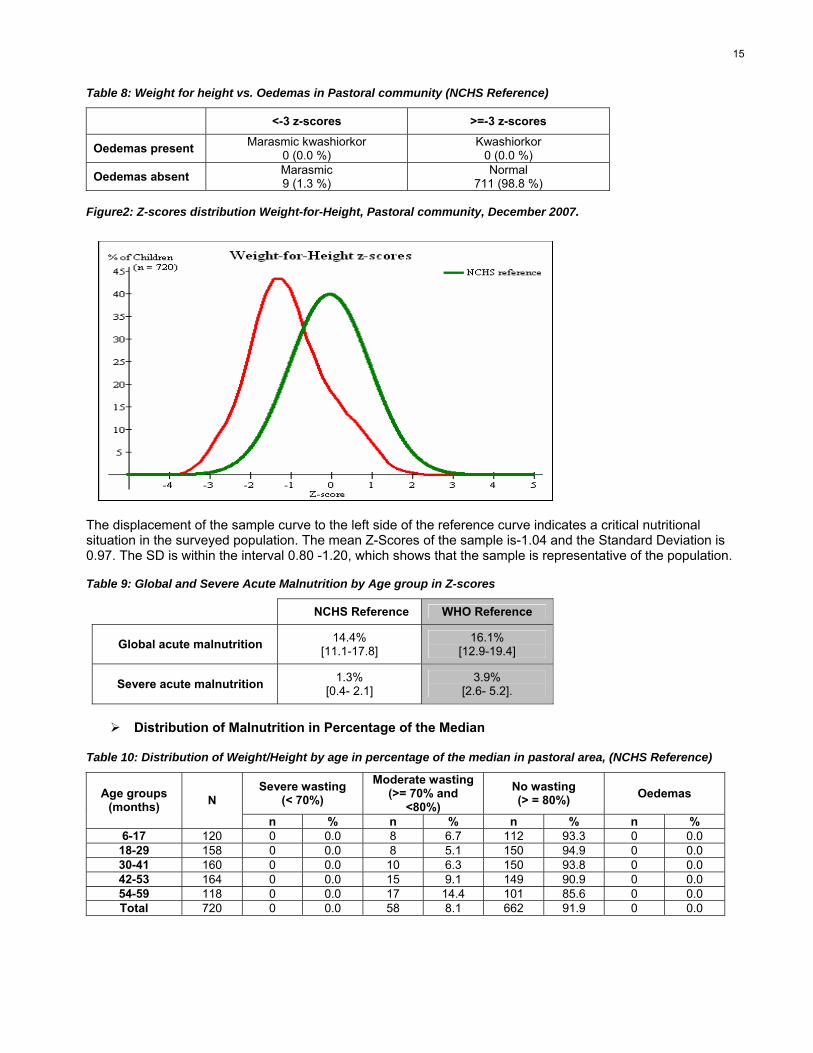
Table 8: Weight for height vs. Oedemas in Pastoral community (NCHS Reference)
<-3 z-scores >=-3 z-scores
Oedemas present Marasmic kwashiorkor 0 (0.0 %)
Kwashiorkor 0 (0.0 %)
Oedemas absent Marasmic 9 (1.3 %)
Normal 711 (98.8 %)
Figure2: Z-scores distribution Weight-for-Height, Pastoral community, December 2007.
The displacement of the sample curve to the left side of the reference curve indicates a critical nutritional situation in the surveyed population. The mean Z-Scores of the sample is-1.04 and the Standard Deviation is 0.97. The SD is within the interval 0.80 -1.20, which shows that the sample is representative of the population. Table 9: Global and Severe Acute Malnutrition by Age group in Z-scores
NCHS Reference WHO Reference
Global acute malnutrition 14.4% [11.1-17.8]
16.1% [12.9-19.4]
Severe acute malnutrition 1.3% [0.4- 2.1]
3.9% [2.6- 5.2].
Distribution of Malnutrition in Percentage of the Median
Table 10: Distribution of Weight/Height by age in percentage of the median in pastoral area, (NCHS Reference)
Severe wasting (< 70%)
Moderate wasting (>= 70% and
<80%) No wasting (> = 80%) Oedemas Age groups
(months) N
n % n % n % n % 6-17 120 0 0.0 8 6.7 112 93.3 0 0.0
Table 14: Weight for height vs. Oedemas in River bank community (NCHS Reference)
<-3 z-scores >=-3 z-scores
Oedemas present Marasmic kwashiorkor 0 (0.0 %)
Kwashiorkor 0 (0.0 %)
Oedemas absent Marasmic 7 (1.0 %)
Normal 697 (99.0 %)
Figure 1. Weight for height in Z-scores River Bank communities
The displacement of the sample curve to the left side of the reference curve indicates a critical nutritional situation in the surveyed population. The mean Z-Scores of the sample is – 0.96, and the Standard Deviation is 1.02.The SD is within the interval 0.80 - 1.10, which shows that the sample is representative of the population.
-60% -40% -20% 0% 20% 40% 60% 80%
6-17
18-29
30-41
42-53
54-59
Boys
Girls
18
Table 15:Global and Severe Acute Malnutrition by Age group in Z-scores
NCHS Reference WHO Reference
Global acute malnutrition 15.9% [12.4-19.4]
17.6% [14.1-21.2]
Severe acute malnutrition 1.0% [0.0- 2.1]
3.8% [1.4- 6.3].
Distribution of Malnutrition in Percentage of the Median
Table 16: Distribution of Weight/Height by age in percentage of the median in River bank community
Severe wasting (< 70%)
Moderate wasting (>= 70% and
<80%) No wasting (> = 80%) Oedemas Age groups
(months) N
n % n % n % n % 6-17 158 0 0.0 8 5.1 150 94.9 0 0.0
According to the MUAC criteria, 0.4% and 1.4% children surveyed are severely and moderately malnourished respectively.
V.3 ANTHROPOMETRIC RESULT IN GARISSA URBAN COMMUNITIES
827 children were assessed. The analysis shown that the data collected were not representative and not presenting the quality indicators required for validation. Therefore, the results of this survey are invalid.
19
V.4 MEASLES VACCINATION COVERAGE
The source of information on immunization was either the child’s health card or the mother’s recall. A child was considered fully vaccinated if he had received the last dose of the EPI programme (from 9 months of age, according to the national protocol). It is important to mention however, that these results should be interpreted with caution since they are based on the caretaker’s recall, when no health card is available. Table 19: Measles Vaccination Coverage in all the divisions surveyed
Pastoral community River Bank community
Population >= 9 months 691 664 Immunized with card 32.7% 31.8%
Immunized without card 52.7% 60.1% Not immunized 7.5%
V.5 COMPOSITION OF THE HOUSEHOLDS
Table 20: Age group proportion
Pastoral Community River Bank Community Age groups
N % N % Under 5 years 21% 1013 23% 21%
Adults 79% 3321 77% 79% Total 100% 4334 100% 100%
The average composition of the households is described below: Table 21: Household Composition
Average number of people per household
Average number of <5 per
household Pastoral Community 7.1 1.5
Rive bank community 7.5 1.7
VI RESULTS OF THE RETROSPECTIVE MORTALITY SURVEY
The crude mortality rate was calculated from the figures collected from families with or without children under 5 years, over the past 3 months. Data of the urban community were invalid. Table 22: Demographic information
Demographic data Pastoral Community River Bank Community
Current resident HH 4471 4334 Current resident < 5 years old 920 1013 People who joined HH 33 222 < 5 years old who joined HH 4 14 People who left HH 233 246 < 5 years old who left HH 10 7 Birth 46 45
20
Both the crude and under-5 mortality rates were below the alert levels of 1/10,000 and 2/10,000 per day respectively.
VII Discussion and conclusion
The last survey done in the region was done in Modogashe, Shant Abak, Sunkuri and Bura divisions (the river bank and the pastoral communities), in October 2005 by the MoH and UNICEF. It revealed a GAM of 18.6% (16.0%- 21.5%) and a SAM of 3.1% (2.4%-5.0%). The malnutrition rates have decreased though not significant to 15.9% [12.4%-19.4%] in riverbank and to 14.4% [11.1%-17.8%] in pastoral communities. The malnutrition rates are still within the emergency cut off of 15% and some of the highest found in the country. These malnutrition rates could be a result of the following factors:
Health Access. The health centres in the three districts are spread out in all divisions but some villages are far away from these units. Poor road network and transport means result in to many of the residents having limited access to health care. The government of Kenya, in the recent years, has made constant supplies of drugs to all the health centres, the only major draw back being that most of these facilities don’t have enough staff to cater for the populace adequately. Malaria and diarrhoea have been reported as the major diseases affecting the communities in the region.
Water and Sanitation. The availability of water in the North Eastern province has been a major
challenge for the residents of the region, but Garissa is endowed with a permanent river (Tana river) that has been instrumental in provision of water for the communities especially for urban and river bank communities. In the pastoral region bore holes are the major source of water and most of the populace have a source of safe water, though some villages rely on water trucking during the dry seasons. Water availability and access in the pastoral communities is still a major challenge. Sanitation in the region is wanting; only 26% and 32.2% of the pastoral and river bank communities have access to toilet which can be a major health hazard as most of the populace defecate in bush. This could lead to contamination of the water sources especially during the wet seasons; this could also explain why diarrhoea is one of the most common diseases in the districts.
Food Security. The availability of the Tana River along the river bank communities has contributed
significantly to the accessibility of some food crops in the region. The river bank communities mainly farm vegetables, fruits and maize along the river. The pastoral communities mainly rely on cattle keeping as their main source of livelihood. The major food source for both communities is through purchase; hence most of the people spend money every day for the purchase of household food. Food aid has been another source of food as 50% of the communities said that they had received Food Aid in the last three months before the survey. Food diversification is a major challenge in the region; among the 12 food groups in the household food diversification table, the river bank had an average of 5.3 while river bank had 6.5 score. This shows that most of the populace had not diversified their food; they mainly ate cereals, meat and milk while fruits and vegetables scored poorly.
Nutrition and Health Education. Inadequate nutrition and health practices have been observed
among the mothers, regarding topics such as proper breastfeeding, weaning, balanced diets and food safety. The food proposed to the children is therefore of a poor quality, predisposing the children to malnutrition as they lack essential nutrients required for their growth.
Death 9 20 Death < 5 years old 2 5 CMR (deaths /10,000 people/day) 0.22 [00.7-0.37] 0.51 [0.24-0.74] U5MR (deaths in children<5/ 10000 / day ) 0.25 [0.00-0.53] 0.56 [0.10-1.03]
21
In order to improve the nutrition status of the surveyed communities, we recommend the following: Health and nutrition
Integration of nutritional treatment activities in the existing health facilities to ensure sustainability in centres where it has not been done
Increase of the number of outreach programs to cover other parts of the districts. This will help in screening the children and in early decision taking.
Implementation of a provisory mobile clinic in every division to enhance the access of heath services Nutrition survey methodology
Respect of SMART recommendations for the conduction of nutritional surveys in order to ensure the good quality of the data collected: maximum of five teams per survey, daily check of data, limitation of the qualitative questionnaire to the minimum necessary, etc.
Nutrition and health education
Continuation of health education programs in the communities, schools and other institutions to improve hygiene practices.
Water and Sanitation
Increase of the accessibility to safe water by construction/rehabilitation of earth pans and water storage tanks, particularly in Lagdera area.
Continuation of sanitation programs such as water protection, and increase of safe human waste disposals.
Food Security
Device ways of enhancing food security of the pastoralist communities especially through improving grazing lands, establishing market for the livestock’s and improving crop cultivation especially along the rivers.
Appendix
I A: Sample Size and Cluster Determination Pastoral Community
DIVISION VILLAGE TOTAL POPULATION ASSIGNED CLUSTER Shimbir 327 1
1.8 Reason for not attending School (enter code from list) 1= Migrated/ moved from school area 2=Not enrolled 3=Currently sick 4=Dropped out in last 3 months 5=Dropped out in last 6/more months 6=Religious/cultural festivities 7= child chronically ill/ handicapped 8=Weather (rain, floods, storms) 9=Family labor responsibilities 10= lack of school fees 11=Teacher absenteeism 12=Too poor to buy school items e.t.c 13=Other social responsibilities 14=Unruly child/lack of parental control 15=HHd don’t see value of schooling 16=No food in the schools 17=No one to take children to school 18=Insecurity 19=No school nearby 20=Others (specify)……………..
1.1 Age
group
1.2 Person ID and
Name
Yrs Months 1 2 3 Under 5
4 5 (Household 6 (Spouse) All other
members 7…. To 13
25
Section 2: Data for Children aged 6 – 59 months
2.1 Child
ID
2.2 MUAC To the
nearest 0.1 cm
2.3 Oedema in both feet? (U5 only)
1=Yes 2=No
2.4 Height
to nearest 0.1 cm
(U5 only)
2.5
Weight to
nearest 100 gm
(U5 only
2.6 Is the child currently
enrolled in a feeding program?
(Confirm
by a card if the child is currently enrolled)
1=yes(OTP) 2=yes (SFP)
3=No 4=Don’t know
2.7 Has the
child received measles immun-ization? (enter cod e)
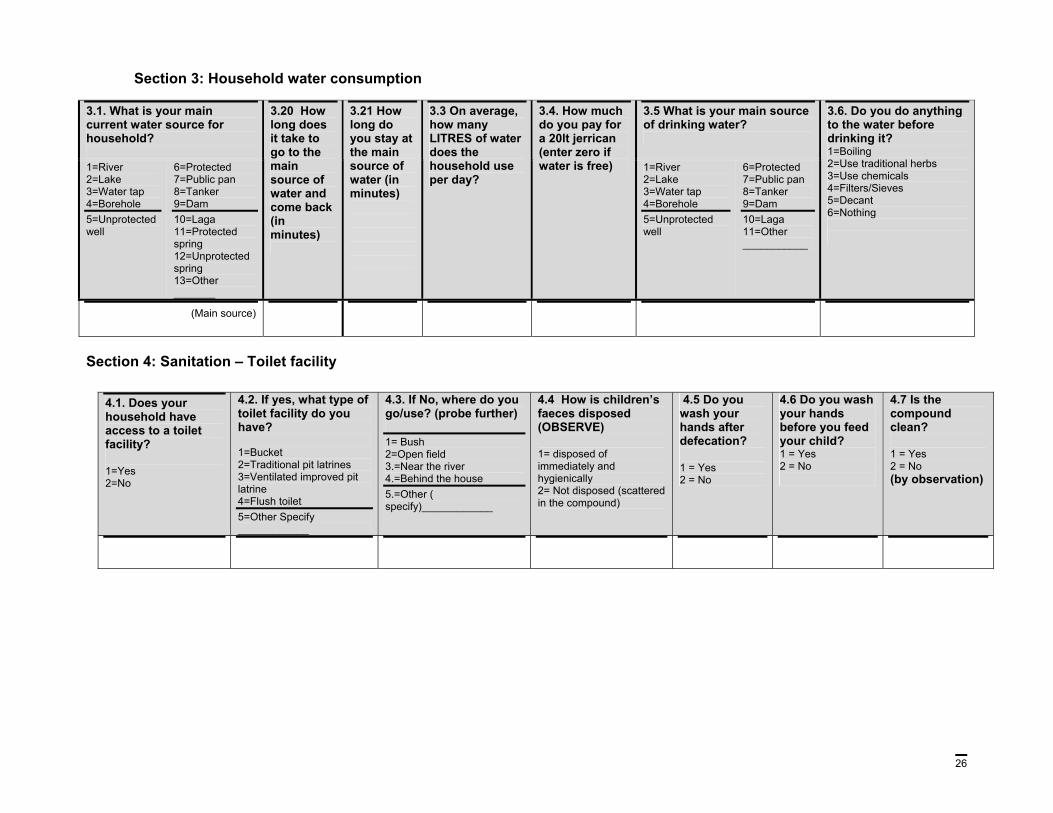
3.1. What is your main current water source for household?
3.5 What is your main source of drinking water?
1=River 2=Lake 3=Water tap 4=Borehole 5=Unprotected well
6=Protected 7=Public pan 8=Tanker 9=Dam 10=Laga 11=Protected spring 12=Unprotected spring 13=Other _______
3.20 How long does it take to go to the main source of water and come back (in minutes)
3.21 How long do you stay at the main source of water (in minutes)
3.3 On average, how many LITRES of water does the household use per day?
3.4. How much do you pay for a 20lt jerrican (enter zero if water is free) 1=River
2=Lake 3=Water tap 4=Borehole 5=Unprotected well
6=Protected 7=Public pan 8=Tanker 9=Dam 10=Laga 11=Other ___________
3.6. Do you do anything to the water before drinking it? 1=Boiling 2=Use traditional herbs 3=Use chemicals 4=Filters/Sieves 5=Decant 6=Nothing
(Main source)
Section 4: Sanitation – Toilet facility
4.1. Does your household have access to a toilet facility? 1=Yes 2=No
4.2. If yes, what type of toilet facility do you have? 1=Bucket 2=Traditional pit latrines 3=Ventilated improved pit latrine 4=Flush toilet 5=Other Specify ____________
4.3. If No, where do you go/use? (probe further) 1= Bush 2=Open field 3.=Near the river 4.=Behind the house 5.=Other ( specify)____________
4.4 How is children’s faeces disposed (OBSERVE) 1= disposed of immediately and hygienically 2= Not disposed (scattered in the compound)
4.5 Do you wash your hands after defecation? 1 = Yes 2 = No
4.6 Do you wash your hands before you feed your child? 1 = Yes 2 = No
4.7 Is the compound clean? 1 = Yes 2 = No (by observation)
27
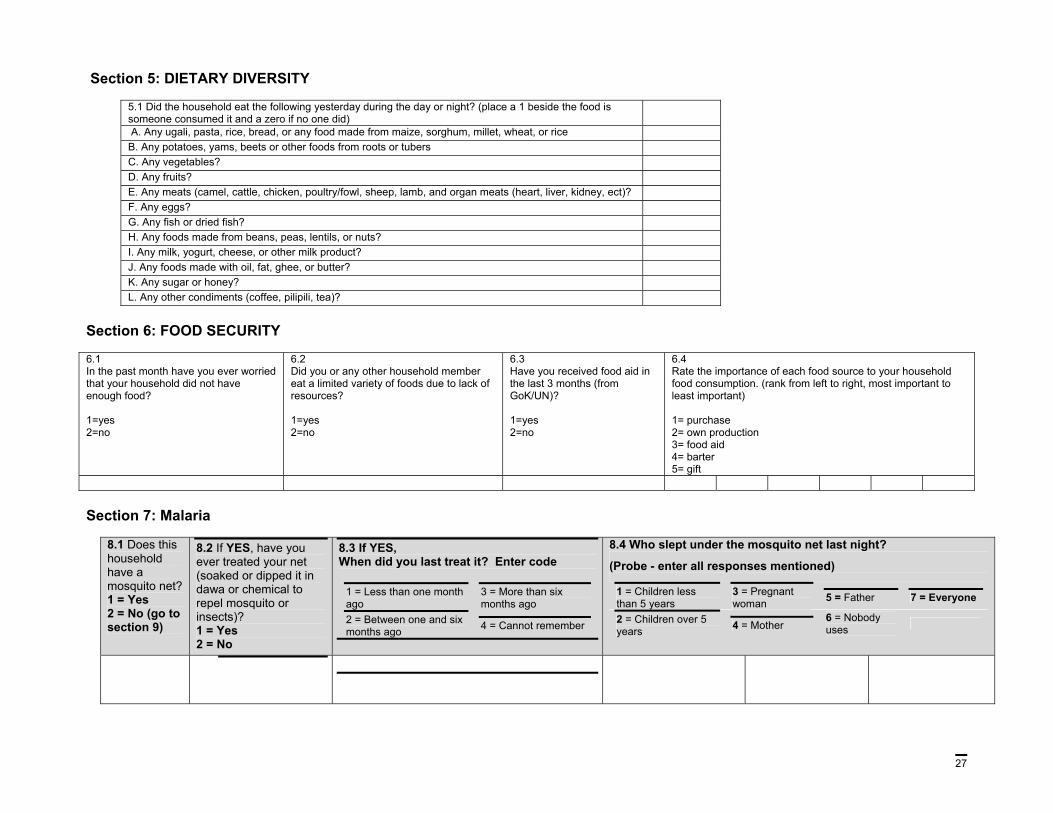
Section 5: DIETARY DIVERSITY
5.1 Did the household eat the following yesterday during the day or night? (place a 1 beside the food is someone consumed it and a zero if no one did)
A. Any ugali, pasta, rice, bread, or any food made from maize, sorghum, millet, wheat, or rice B. Any potatoes, yams, beets or other foods from roots or tubers C. Any vegetables? D. Any fruits? E. Any meats (camel, cattle, chicken, poultry/fowl, sheep, lamb, and organ meats (heart, liver, kidney, ect)? F. Any eggs? G. Any fish or dried fish? H. Any foods made from beans, peas, lentils, or nuts? I. Any milk, yogurt, cheese, or other milk product? J. Any foods made with oil, fat, ghee, or butter? K. Any sugar or honey? L. Any other condiments (coffee, pilipili, tea)?
Section 6: FOOD SECURITY
6.1 In the past month have you ever worried that your household did not have enough food? 1=yes 2=no
6.2 Did you or any other household member eat a limited variety of foods due to lack of resources? 1=yes 2=no
6.3 Have you received food aid in the last 3 months (from GoK/UN)? 1=yes 2=no
6.4 Rate the importance of each food source to your household food consumption. (rank from left to right, most important to least important) 1= purchase 2= own production 3= food aid 4= barter 5= gift
Section 7: Malaria
8.1 Does this household have a mosquito net? 1 = Yes 2 = No (go to section 9)
8.2 If YES, have you ever treated your net (soaked or dipped it in dawa or chemical to repel mosquito or insects)? 1 = Yes 2 = No
8.3 If YES, When did you last treat it? Enter code
1 = Less than one month ago
3 = More than six months ago
2 = Between one and six months ago 4 = Cannot remember
8.4 Who slept under the mosquito net last night?
(Probe - enter all responses mentioned)
1 = Children less than 5 years
3 = Pregnant woman 5 = Father 7 = Everyone
2 = Children over 5 years 4 = Mother
6 = Nobody uses
28
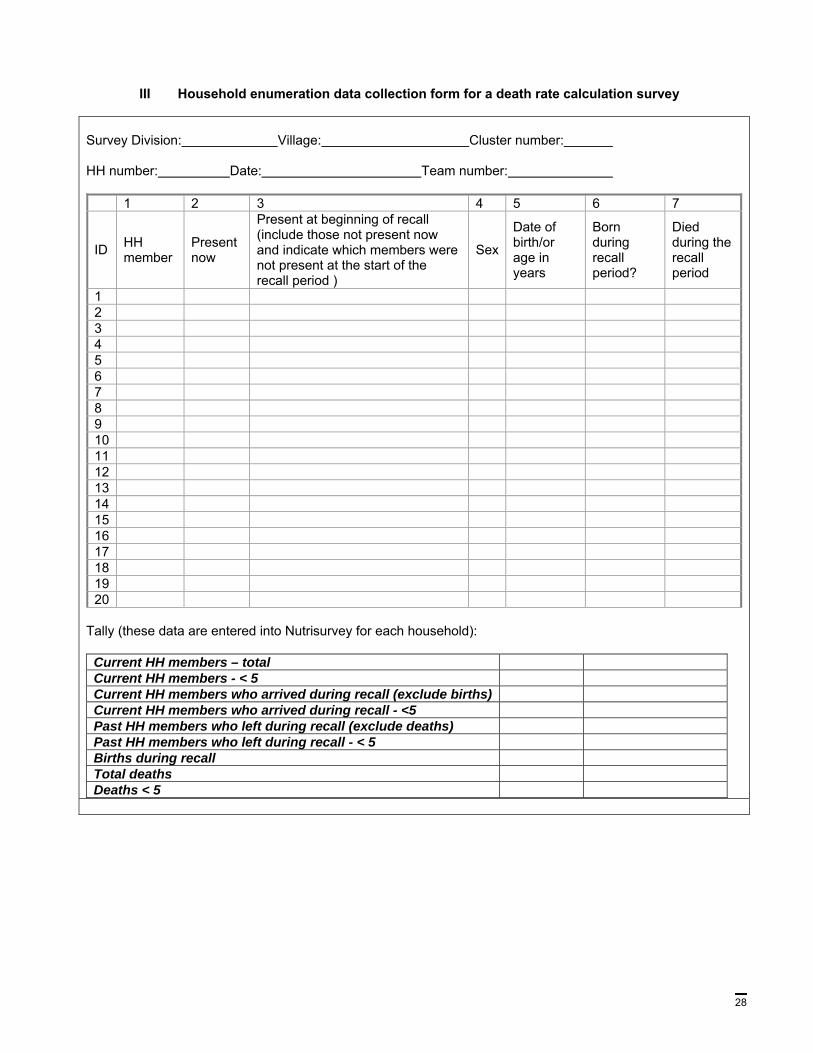
III Household enumeration data collection form for a death rate calculation survey Survey Division: Village: Cluster number: HH number: Date: Team number:
1 2 3 4 5 6 7
ID HH member
Present now
Present at beginning of recall (include those not present now and indicate which members were not present at the start of the recall period )
Tally (these data are entered into Nutrisurvey for each household):
Current HH members – total Current HH members - < 5 Current HH members who arrived during recall (exclude births) Current HH members who arrived during recall - <5 Past HH members who left during recall (exclude deaths) Past HH members who left during recall - < 5 Births during recall Total deaths Deaths < 5
29
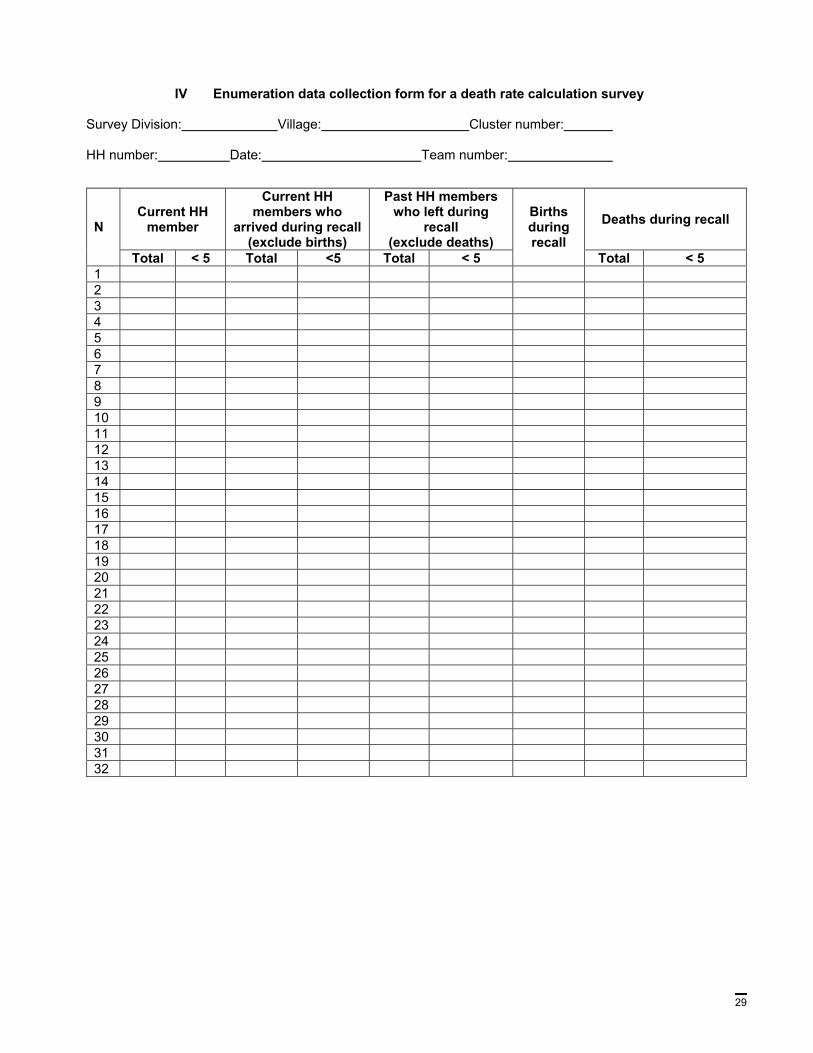
IV Enumeration data collection form for a death rate calculation survey Survey Division: Village: Cluster number: HH number: Date: Team number: