Nutritional Status and Associated Factors in Human Immunodeficiency Virus Infected Children in Hawassa University Referral Hospital Hawassa City, SNNPR ,Ethiopia. Conference place By: Wude Beyene Wondimu(HO BSc)
Transcript
Nutritional Status and Associated Factors in Human
Immunodeficiency Virus Infected Children in Hawassa University Referral Hospital Hawassa City, SNNPR ,Ethiopia.
Conference place By: Wude Beyene Wondimu(HO BSc)
Content
Introduction
Significance of the Study
Objective
Methodology
Result
Discussion
Conclusion
Recommendation
Introduction
Malnutrition and HIV infection become an epidemic.
HIV infection and under nutrition are both highly prevalent , especially in SSA (Scott Drimie et al; 2006).
HIV infection and under nutrition leads to growth failure and stunting in children. (FANTA,2007)
Nearly 90% of children infected with HIV and more than 76% AIDS deaths in 2007 occurred in SSA (Olalekan ., 2008).
Intro cont…
HIV prevalence in Ethiopia was 1.5 percent & in SNNPR estimated at 0.9 %, in 2011 (EDHS; 2011).
National prevalence of malnutrition in under-five children in Ethiopia was reported to be 40% stunting, 9% wasting and 25% underweight (EDHS; 2014).
High rates of malnutrition worsen the impact of HIV and pose significant challenges to HIV care and treatment programs (Ethiopia HIV and Nutrition Guidelines ;2008).
symptomatic Children need between 50% and 100% more energy every day (Ethiopia HIV and Nutrition Guidelines ;2008).
ObjectivesGeneral objective:
To assess nutritional status and associated factors in HIV
infected children in Hawassa University Referral Hospital
Hawassa City, SNNPR ,Ethiopia.
Specific objectives:
1.To determine nutritional status of HIV infected children of
six week to fourteen years
2.To determine factors associated with nutritional status of
HIV infected children of six week to fourteen years.
MethodologyStudy area
Hawassa is located 275 kilometer far away from the
capital city, Addis Ababa, in SNNPR.
Hawassa University referral Hospital located in
Hawassa.
It is the public hospital providing training for health
sciences student and high level of clinical care for nearly
a million of catchment area population.
Study period
• June 1st to August 30th 2014.
Study Design
• Facility based cross sectional study.
Source and study populations
Source populations
All HIV positive children in Hawassa university
Referral hospital six week to fourteen years who are
enrolled in HIV care and treatment clinic .
Study populations
All HIV positive children six week to fourteen year
age (inclusive) who are enrolled in HIV care and
treatment clinic in the study hospital.
Inclusion and Exclusion criteriaInclusion criteria
All HIV infected children who have follow up in
Hawassa University referral Hospital pediatrics ART
clinic.
Exclusion criteria
Children, who are critically ill and those care givers
who are not able to communicate and are not
voluntary to participate in the study.
Sampling Technique
HIV status was established from previous results
testing for HIV from medical record.
Hence the number of study population are possible
to manage, I used all HIV positive children.
This was equal-probability method, in which every
HIV positive child under fifteen years was selected
to include in the study.
Sample size
• 455 HIV positive children in Hawassa university referral
Hospital
Variables of the study
Dependent variable: were nutritional status as
measured by HAZ, WAZ, WHZ, BAZ.
Independent variables
Age and sex of the child, marital & educational status
of care giver, WHO HIV clinical stage, birth order,
family size, average monthly income, feeding
practice, dietary counseling history, presence of
acute disease and eating problems.
Data Collection Tools
Questionnaire
Anthropometric measurement
Salter scale® (UK) calibrated to 0.1kg
Standardized Seka® digital scale (Brooklyn, USA)
Measuring tape with a precision of 0.5 cm.
Seka® measuring rod calibrated to 0.5cm.
Anthropometric standardization form sheet:
Data Collection procedure
Data collectors were recruited and conducted one-day training by principal researcher.
Anthropometric measurements, record review, and face to face interview were conducted .
Weight and height/length were measured for each subject.
During data collection, nutritional advice was provided to all care givers and who had a malnourished child were linked to therapeutic feeding program.
Data quality assurancePre-test was conducted at Sheshemne Referral Hospital
During data collection, all the activities were carefully monitored and supervised.
Weights & height/length were measured using a standardized tools & calibration was applied.
Questionnaire were prepared in English and translated to Amharic.
Anthropometric were done by the investigator herself and trained health workers to minimize error.
Data processing and analysis
Each questionnaire was checked for completeness
and codes were given before entry.
WHO Anthro v2.0.2 and WHO Anthro plus v1.0.4
was used
Anthropometric measurements were converted to
physical growth indices (WAZ,HAZ,WHZ&BAZ).
Data process cont…
SPSS version 20.0. were used
Kolmogorove-smirnove test was used for continuous data to check for normality.
Descriptive statistical tests were applied to indicate the prevalence of under nutrition & other socio demographic characteristics.
To control confounders & to test the presence as well as strength of association logistic regressions was applied.
Data proc cont…
Variables with a p-value of less than 0.2 in the
bivariate analysis were entered into multivariate
logistic regression to isolate an independent effect of
the predictors.
Strength of association was reported using adjusted
odds ratio (AOR) with 95% confidence interval.
Significance was declared at p<0.05.
Ethical consideration
The study protocol was reviewed and approved by
institutional review board Hawassa University
College of Medicine and Health Sciences.
Written consent form was used.
Privacy and confidentiality was maintained
Permission was obtained from HURH.
Result and Discussion
A total of 455 children on HIV/AIDS care and treatment
follow-up from Hawassa University Referral Hospital
were included with a response rate of 420(92.3 %).
The mean (+SD) age of children included in the study
was 8.9(+ 3.2) years ranging from 6 month to 14 years.
There was no edematous malnutrition, nor over weight
among the studied children
Table 1:Distribution of Socio demographic characteristic of HIV positive children at Hwassa referral hospital, South Ethiopia , 2015. n=420
Characteristic
Male
N
240
%
57.1
Sex Female 180 42.9
age in months
<60 33 7.9
60 to 120 241 57.4
121 to 168 146 34.8
Resident Urban 393 93.6
Rural 27 6.4
child birth order
1st born 278 66.2
2nd born 81 19.3
3rd born 32 7.6
>4th born 29 6.9
Table 1: Socio demographic characteristic cont…
Children`s living with
Parent(s)
N
319
%
76
Sister /brother 13 3.1
Aunt /uncle 14 3.3
Grandparent(s) 52 12.4
Family size >4 family 243 57.9
< 4family 177 42
Educational status of care giver
No formal education 121 28.8
Formal education 299 71.2
Marital status of the care giver
Married 265 63.1
Widowed 108 25.7
divorced/separated 31 7.4
Single 16 3.8
Table 2: Distribution of Socio demographic characteristic and nutritional related
profiles of HIV positive children at Hwassa referral Hospital, South Ethiopia, 2015, n=420
Characteristic
Care giver Receive dietary
counselling before the survey N %
Yes 133 31.6
No 287 68.3
Exclusive breast
feed Yes 403 96
No 17 4
Average monthly
income of the family
<500ETB 39 9.3
>500ETB 381 90.7
Table 2: Socio demographic characteristic and nutritional related profiles cont…
Food variety per 24
hrs N %
<4 variety 367 87.4
>4 variety 53 12.6
Child meal pattern
per 24hr
>5 Meal 39 9.3
<5 Meal 381 90.7
Table 3:Medical and related problems of HIV positive children
at Hwassa referral hospital ,South Ethiopia,2015,n=420.
Disease/problem
N %
Eating problem Yes 67 16
No 353 84
Type of eating problems
loss of appetite 57 13.6
Swallowing difficulty 3 0.7
Vomiting 8 1.9
Acute disease 2 week prior to data
collection
Yes 43 10.2
No 377 89.8
Type of acute disease
Gastroenteritis / diarrheal disease 10 2.4
Pneumonia 16 3.8
Other AFI 16 3.8
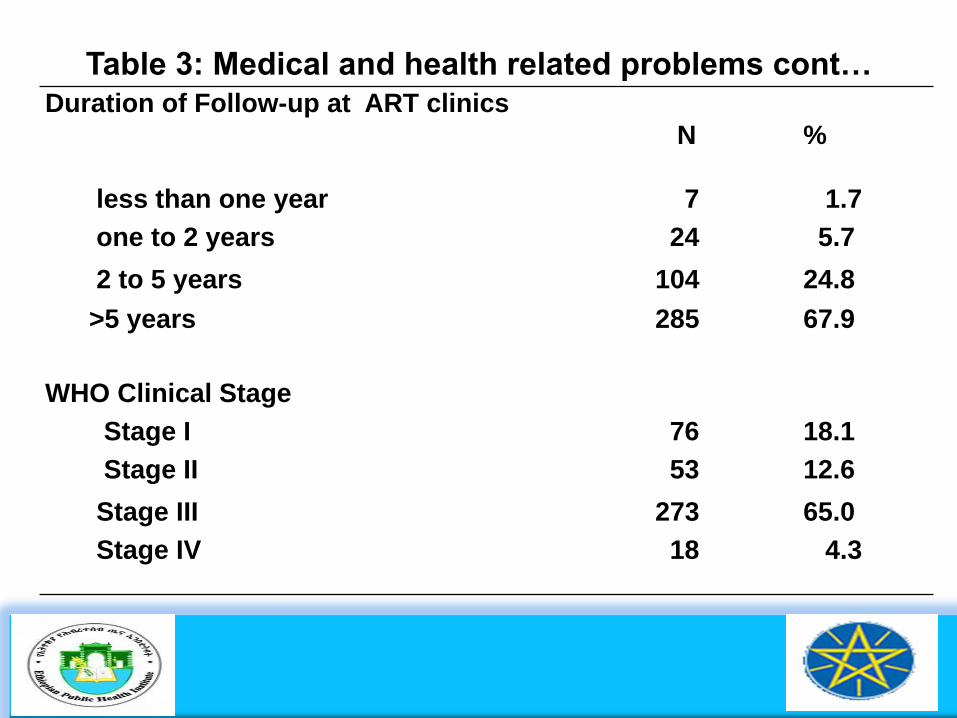
Table 3: Medical and health related problems cont…Duration of Follow-up at ART clinics
N %
less than one year 7 1.7
one to 2 years 24 5.7
2 to 5 years 104 24.8
>5 years 285 67.9
WHO Clinical Stage
Stage I 76 18.1
Stage II 53 12.6
Stage III 273 65.0
Stage IV 18 4.3
Table 4: Nutritional status of HIV positive children at Hwassa referral Hospital,
South Ethiopia,2015, n=420.
Wasted
(WHZ&BAZ<-2SD)
Yes
Sever wasting
(WHZ &BAZ<-3)
Moderate
wasting (WHZ
&BAZ=b/n -3&- 2)
WHZ&BAZ>-2
Normal
N % N % N % N %
Male 54 12.9 31 7.4 26 6.2 186 44.3
Female 36 8.6 18 4.2 15 3.6 144 34.3
Total 90 21.4 49 11.6 41 9.8 330 78.8
Under wt
(WAZ-2SD)
Yes
Sever under wt
(WAZ<-3)
Moderate under wt
(WAZ=b/n-3&-2)
Normal (WAZ>-2)
Male
N %
104 24.7
N %
21 5
N %
84 20
N %
136 32.4
Female 69 16.4 14 3.3 54 12.8 111 26.4
Total 173 41.2 35 8.3 138 32.8 247 58.8
Table 4: Nutritional status cont…
Stunting (in < 15 years)
Stunted
(HAZ<-
2SD)
Sever Stunting
(HAZ<-3)
Moderate Stunting
(HAZ b/n-3&-2)
Normal
HAZ>-2
Yes
N % N % N % N %
Male 144 34.3 28 6.7 116 27.6 97 23.1
Female 110 26.2 16 3.8 94 22.4 70 16.7
Total 254 60.5 44 10.5 210 50 166 39.5
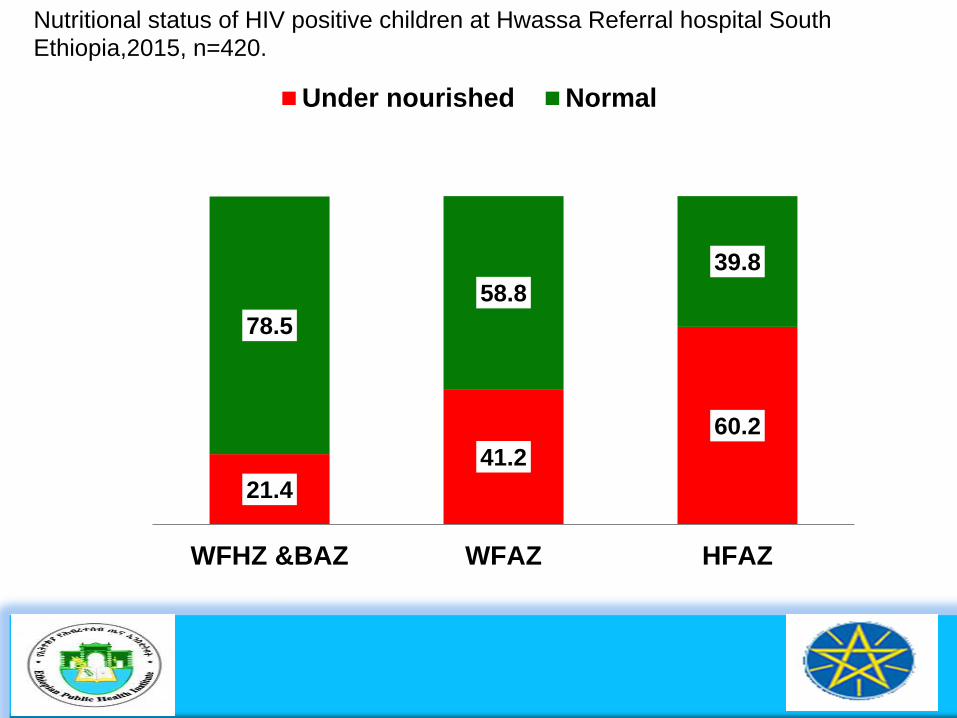
Nutritional status of HIV positive children at Hwassa Referral hospital South Ethiopia,2015, n=420.
21.4
41.2
60.2
78.5
58.8
39.8
WFHZ &BAZ WFAZ HFAZ
Under nourished Normal
Figure 4: The Z-score distribution of weight for age status of studied children, aged 5year to 10 years (Values are based on WHO Reference).
Figure 5:The Z-score distribution of height for age status of studied
children, aged 6week -14 years (value based on WHO growth standards &
WHO reference)
Figure 6:The Z-score distribution of weight for height status of studied
children aged 6week to 59month (values are based on WHO standards)
Table 6: Factors associated with nutritional status of HIV positive Children
6weeks to 14 years at Hwassa referral hospital as measured by WFH and BMIFAZ, South Ethiopia, 2015,n=420.Predictor variable
Table 7: Factors associated with nutritional status of HIV positive children at Hawassa Referral Hospital as measured by WFAZ, South Ethiopia,2015,n=420
Predictor variable
under weight
Residential area
Yes No
Crude OR
(95%CI)
Adjusted (95%
CI)
p-value
Rural 14 13 1.78(0.85,3.71) 0.57(0.24,1.36) 0.2
Urban(Ref) 159 234 1.00 1.00
Acute disease presence 2 weeks prior to survey done
Yes 20 153 0.97(0.82,1.14) 0.82(0.53,1.26) 0.37
No(REF)
HIV/AIDS WHO clinical stage
23 224 1.00 1.00
Advanced stage 171 120 1.75(1.31,2.33) 0.000***
Early stage (Ref) 2 127 1.00 1.00
Meal frequency
< 5 Meal 172 209 1.14(1.07,1.20) 0.000***
>5 Meal (Ref) 4 38 1.00 1.00
Food variety per 24 hrs
>4 Variety 14 39 0.51(0.28,0.91) 0.04*
<4 Variety(REF) 159 208 1.00 1.00
Average monthly income of the
family
<500ETB 31 8 4.14(2.07,8.27) 0.000***
>500ETB(REF) 142 239 1.00 1.00
Care taker take dietary counseling
Yes 40 93 0.61(0.45,0.84) 0.000***
No(REF) 133 154 1.00 1.00
2.33(1.47,3.67)
7.49(2.48,22.65)
0.46(0.23,0.95)
0.46(0.23,0.95)
0.46(0.29,0.75)
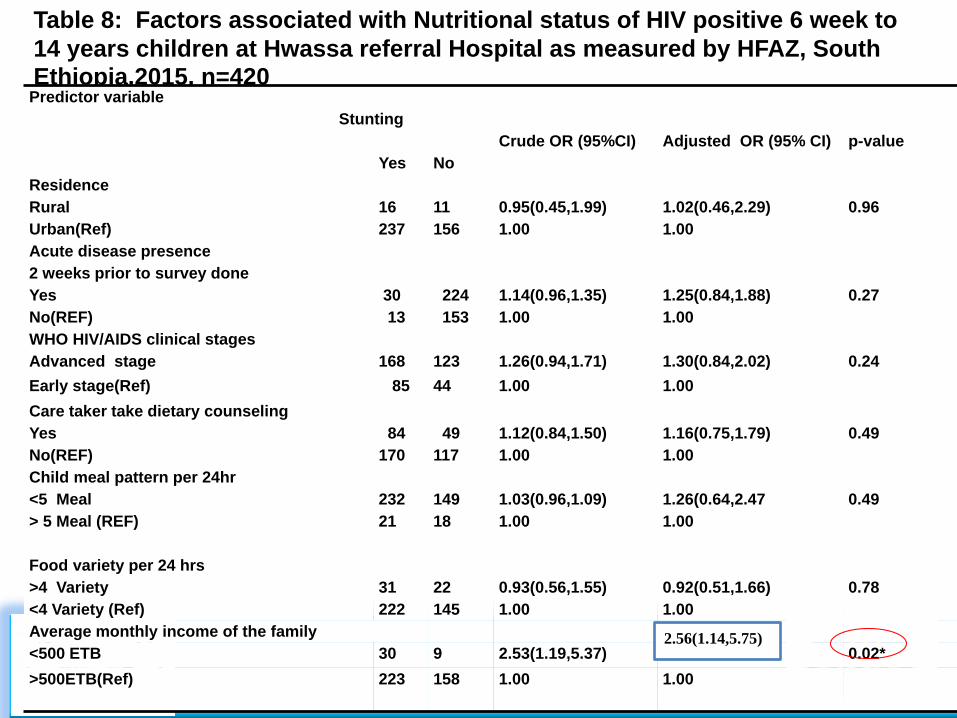
Table 8: Factors associated with Nutritional status of HIV positive 6 week to
14 years children at Hwassa referral Hospital as measured by HFAZ, South Ethiopia.2015, n=420Predictor variable
DiscussionNutritional status of children in the present study
showed that under nutrition was more prevalent as
compared to WHO/2007 international reference
standards (deonis et al., 2007).
This indicates greater nutritional deficits in this group
compared to overall Ethiopian children of unknown
HIV status below five years of age (EDHS, 2014).
Discuss cont…
Avery similar prevalence of stunting and
underweight with the present study reported in
Ethiopia, Tanzania and south western Uganda
(Berihun M. et al., 2013; Sunguya BF. et al., 2014;
Joyce K.K and Hanifa K;2006).
However, the prevalence of Stunting and
underweight was lower than study done as a
baseline evaluation of the first HIV-infected children
to receive ART in Botswana (Anabwani, G et al.,
2005).
Discuss cont…The association we found between under weight and
independent variables are in agreement with the result from previous studies conducted in Kenya, Uganda, Tanzania and Malaysia revealed that
Advanced clinical stage of HIV, low dietary diversity ,low meal pattern , low average monthly income of the family and absence of dietary counseling for care giver was significantly associated (Onyango A, et al., 2009, J Bukusuba et al., 2009, Ali D. J., 2010; Mohd N. MT et al., 2011).
Discuss cont…
In current study acute malnutrition or wasting was significantly associated with presence of acute disease, absence of dietary counseling and residing in Rural area.
In agreement with the finding by E.Kimami-M in South Africa and Anna M Rose in London who revealed that acute malnutrition was higher among HIV positive children with acute infection, absence of dietary counseling for the family and residing in rural area than residing in urban area (E.Kimami-M et al; 2011, Rose AM, et al., 2013).
Discuss cont…
This study show that stunting was significantly associated with average monthly income of the family in agreement with the result from previous studies conducted in Ethiopia, Tanzania and Uganda (Berihun M et al., 2013; Sunguya . et al., 2011 and Ali D. J., 2010).
One possible explanation for the strong association between stunting and average monthly income of the family is that average monthly income of the family may acts as the proxy for house hold economic status(FANTA;2007).
Conclusion Recommendation
High proportion of study participants reportedly consumed food less frequently and less diversified with in a day this possibly contributes to the poor quality of life.
More than half of the care giver of children reported they do not have dietary counseling.
Majority of the children were in advanced stage or late stage of WHO clinical stage
Conclusion cont...Result from the survey also show that majority of the children had poor
nutritional status and poor growth as described by the high prevalence of wasting,
underweight and stunting.
Poor nutritional status and poor growth has a significant adverse effect on the
long-term survival and overall health status of the children.
Factors associated with under nutrition were residence area, low average
monthly income of family, absence of dietary counseling, presence of acute
disease, low meal frequency, undiversified diet and Advanced WHO HIV/AIDS
clinical stage.
Recommendations
Promote nutrition counseling on appropriate feeding
practices.
Promote dietary diversity.
Early detection and control the progression of HIV
Further community based nutritional study involving HIV
infected children is recommended.
AcknowledgementFirst of all, I would like to thank my God for his support,
protection and giving me health.
To my major advisor Professor.Yifru Brahen.
And my thanks go for my co-advisor Dr. Kusum Lata
To Dr. Eskinder Loha, Dr. Dejene Hailu and Dr.Samison
G/medhin
To s/r Tadelech Sinamo, Mr. Alemneh Kabata and Mulukan
Brhanu
To Hawassa referral hospital pediatric ART staffs for their help
on data collection and constructive ideal support.