Nutritional Status Of Children In Uttar Pradesh Sheila C. Vir and A.K. Nigam nourished children (weight-for-age < -3 sd) was 22.4 per cent. This is very similar to the reported national data (Table 3). TABLE 1 elected for Logistic Regression Variables Child's age Children of 12-35 months Children from kutcha households with no toilet facility and inadequate drainage Children suffering from any of these diseases - diarrhoea, measles and ARI Children whose mothers took better diet and more rest and did less heavy work during the last three months of pregnancy Children of illiterate mothers Children of mothers with BMI < 18.5 Children who were introduced to complementary feeding at four to six months Immunised, not immunised Uttar Pradesh is the most popu- lous state of India with a population of over 150 million - 16 per cent of the country's population. Data on the nutrition profile of this large state, with diverse geographical character- istics, is limited. A region-wise survey in Uttar Pradesh' was carried out in a total of 9,206 householdS from the defined five economic regions (Bundelkhand, Central, Eastern, Hill, Western) covering 17 of the then 63 districts. The target groups surveyed were children of three to 59 months of age and 'ever married women' in the age group of 15 to 45. The latter included currently married, widowed, separated and divorced categories as well as pregnant and lactating mothers. The survey comprised completion of a ques- tionnaire on the feeding, hygiene/ sanitation practices and utilisation of health services. Data with reference to education, housing facilities, etc, were also collected. Nutritional status of children was assessed by weight for age (underweight), height for age (stunting), and weight for height (wast- ing) by using standard deviation clas- sification. In case of women, the nutri- tional status was measured as body mass index (BMI) and pregnant women were excluded from this group. The data on the nutritional sta- tus of children were analysed in terms of the geographical trend for the un- derweight, pattern of underweight in children with age and also associated 'risk factors' for moderate and severe malnutrition in children. The risk fac- tors presented in Table 1 were exam- ined by logistic regression analysis. INCIDENCE OF MALNUTRITION A region-wise analy- sis of the malnutrition pat- tern in women and children indicated that about 30 per cent of women (Table 2) had BMI < 18.5 and 4.9 per cent of these had BMI < 16. The Eastern region had the highest prevalence of mal- nutrition (38 per cent), fol- lowed by the Hill region (33 per cent). Out of the 17 selected districts, Bahraich and Basti districts of the Eastern region had the high- est prevalence of malnutrition (56 and 43 per cent, respectively). More than half of the children were found to be underweight (Table 2). The percentage of severely mal- MALNUTRITION: REGION-WISE PATTERN On mapping the district-wise prevalence of underweight incidence of < 50 per cent, 50-69 per cent and ~70 per cent, a distinct geographical pattern was observed (Fig 1). The highest incidence of malnu- trition was observed in the eastern FIGURE 1 Underweight children (%) <50_ 50-69~ ;'70 lID!] No Data 0 belt which is a waterlogged region, followed by Vindhyachal which also includes the dry Bundelkhand region. This distribution of underweight chil- dren in the state was not in concur- rence with the common belief that the highest incidence of malnutrition in the state is in the poorer socio-eco- nomic region of Bundelkhand. Higher incidence of undernutrition was, in fact, noted in the waterlogged east- ern and the wet Gangetic belt. This can be attributed to possibly higher occurrence of diarrhoea, infection and worm infestation which adversely af- fect the nutritional status of children. With such geographical pattern of malnutrition observed, the data were further analysed to identify 'risk fac- tors' associated with malnutrition. The findings confirmed that the four risk factors with highest loadings were body mass index (BMI) of the mothers, oc- currence of childhood diseases, child's age 12-35 months and illiteracy of mothers (Table 4). Poor hygiene and sanitation services were found to be important contributory factors of stunting in children. Occurrence of childhood
Transcript
Nutritional Status Of Children In Uttar Pradesh
Sheila C. Vir and A.K. Nigam
nourished children (weight-for-age<-3 sd) was 22.4 per cent. This is verysimilar to the reported national data(Table 3).
TABLE 1Risk Factors Selected for Logistic Regression
Binary form
Variablesof variables
Child's age
Children of 12-35 months
Hygiene
Children from kutcha households with no toiletfacility and inadequate drainageDisease
Children suffering from any of these diseases -diarrhoea, measles and ARICare
Children whose mothers took better diet and morerest and did less heavy work during the last threemonths of pregnancy
Literacy
Children of illiterate mothers
BMI
Children of mothers with BMI < 18.5
Complementary
Children who were introduced to complementaryfeeding
feeding at four to six months
Immunisation
Immunised, not immunised
Uttar Pradesh is the most populous state of India with a population ofover 150 million - 16 per cent of thecountry's population. Data on thenutrition profile of this large state,with diverse geographical characteristics, is limited. A region-wise surveyin Uttar Pradesh' was carried out in atotal of 9,206 householdS from thedefined five economic regions(Bundelkhand, Central, Eastern, Hill,Western) covering 17 of the then 63districts.
The target groups surveyed werechildren of three to 59 months of ageand 'ever married women' in the agegroup of 15 to 45. The latter includedcurrently married, widowed, separatedand divorced categories as well aspregnant and lactating mothers. Thesurvey comprised completion of a questionnaire on the feeding, hygiene/sanitation practices and utilisation ofhealth services. Data with referenceto education, housing facilities, etc,were also collected. Nutritional statusof children was assessed by weightfor age (underweight), height for age(stunting), and weight for height (wasting) by using standard deviation classification. In case of women, the nutritional status was measured as bodymass index (BMI) and pregnant womenwere excluded from this group.
The data on the nutritional status of children were analysed in termsof the geographical trend for the underweight, pattern of underweight inchildren with age and also associated'risk factors' for moderate and severemalnutrition in children. The risk factors presented in Table 1 were examined by logistic regressionanalysis.
INCIDENCE OFMALNUTRITION
A region-wise analysis of the malnutrition pattern in women and childrenindicated that about 30 percent of women (Table 2)had BMI < 18.5 and 4.9 percent of these had BMI < 16.The Eastern region had thehighest prevalence of malnutrition (38 per cent), followed by the Hill region (33per cent). Out of the 17selected districts, Bahraichand Basti districts of theEastern region had the highest prevalence of malnutrition (56 and43 per cent, respectively).
More than half of the childrenwere found to be underweight (Table2). The percentage of severely mal-
MALNUTRITION:REGION-WISE PATTERN
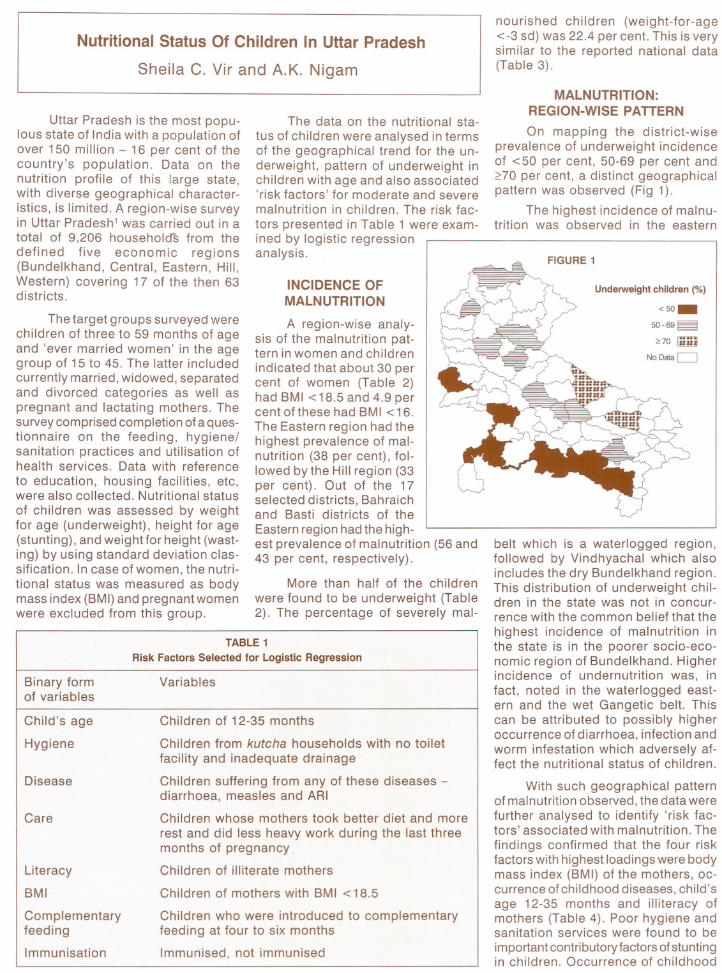
On mapping the district-wiseprevalence of underweight incidenceof < 50 per cent, 50-69 per cent and~70 per cent, a distinct geographicalpattern was observed (Fig 1).
The highest incidence of malnutrition was observed in the eastern
FIGURE 1
Underweight children (%)
<50_50-69~
;'70 lID!]
No Data 0
belt which is a waterlogged region,followed by Vindhyachal which alsoincludes the dry Bundelkhand region.This distribution of underweight children in the state was not in concurrence with the common belief that thehighest incidence of malnutrition inthe state is in the poorer socio-economic region of Bundelkhand. Higherincidence of undernutrition was, infact, noted in the waterlogged eastern and the wet Gangetic belt. Thiscan be attributed to possibly higheroccurrence of diarrhoea, infection andworm infestation which adversely affect the nutritional status of children.
With such geographical patternof malnutrition observed, the data werefurther analysed to identify 'risk factors' associated with malnutrition. Thefindings confirmed that the four riskfactors with highest loadings were bodymass index (BMI) of the mothers, occurrence of childhood diseases, child'sage 12-35 months and illiteracy ofmothers (Table 4). Poor hygiene andsanitation services were found to beimportant contributory factors of stuntingin children. Occurrence of childhood
TABLE 2Region-wise Prevalence of Malnutrition in Women and Children
Region
WomenChildren
BMI <16
BMI <18.5SevereUnderweightunderweight
(-2 sd)(-3 sd)
Bundelkhand
2.222.114.942.7
Central
4.626.623.358.9
Eastern
8.137.829.158.4
Hill
5.133.223.753.3
Western
3.224.520.348.2
Uttar Pradesh
4.929.722.452.0 age of eight to 12 months coincideswith a significant increase in nutritional requirement of infants, limitedcapacity for mastication and stomachvolume as well as increased activity,exposure to environment and susceptibility to diarrhoea. Moreover, theseyoung infants cannot feed themselves.They need to be fed. This requires notonly an appreciation of food requirements and resources but also of time,skill and patience of the caregiver.Feeding practices need to focus onadaptations of feeding to the child'sabilities, responsiveness to cues andan appropriate feeding context withreference to how, when and where3.
CONCLUSIONS ANDPROGRAMME IMPLICATIONS
FIGURE 2
Pattern of Underweight in Uttar Pradesh
The findings of this study havethe following important implicationswith reference to policy as well asprogramme intervention measures:
• Infant undernutrition needs to be
Similar findings have been reportedfrom Uganda; the prevalence of diarrhoea and low weight-for-age increaseddramatically in infancy and most ofthe nutritional damage occurred by12 months of age2. This problematic
48-5936-47
Months
12-23 24-35
60
5040
OJ
OlellCOJ[:'OJ0...
20
100
3-5
6-11
The current focus on preventingmalnutrition is on children under twoyears of age. This is based on thepast analysis in terms of 'age groups'.An analysis in terms of both 'age groups'(Fig 2) as well as in terms of 'singlemonths' was undertaken. This wasimportant since in the 'age groups'analysis, the time intervals are notequal and, therefore, are likely to presenterroneous analysis of the situation.
As per the 'age group' analysis,it was observed that the maximumunderweight situation occurs at theage of 12 to 23 months. The 'singlemonth' analysis revealed that themaximum undernutrition, in fact, occurs in children at the age of eight to11 months and the plateau begins at 12months itself (Fig 3) and not at 24 months(Fig 2).
The above month-wise analysisemphasises that malnutrition sets earlierin life and accelerates during the second half of infancy at eightto 11 months.
diseases had the maximum contribution to wasting in children.
caregivers on appropriate feeding,timely seeking of health services suchas immunisation, diarrhoea and ARImanagement as well as for promotingappropriate care of women and children.
• The Reproductive Child Health (RCH)programme being implemented by theHealth and Family Ministry has animportant role in preventing malnutrition. Currently, this is the only national programme which reaches thecritical group of children below oneyear with various health services.Appropriate infant feeding practices,including promotion of correct hygienepractices, should be a high prioritycomponent of the RCH Programmefor reducing malnutrition. The implications of improved nutritional statusof children on reducing fertility rate aswell as infant and child morbidity andmortality needs to be well recognisedfor meeting the programme goals ofthe RCH programme.
• It is desirable to shift our programmeinterventions from a sectoral approach(ICDS) to a multi-sectoral communitybased approach for addressing theproblem of malnutrition. Counsellingmothers, caregivers and communitymembers (men and women) on healthand nutrition care of infants (including the importance of exclusive breastfeeding, appropriate complementaryfeeding, diarrhoea management,immunisation, etc) should be madean integral part of our ongoing development efforts for empowering womenthrough the Literacy Programme, theSelf-Help Group (SHG) Concept andPanchayat Raj Institutions (PRI). Suchintegration is possible if the nutritionalstatus (weight) of children is viewedbeyond 'feeding nutrition' and isadopted as a measure of development by planners and policy makers.
References
Dr Sheila C. Vir is Project Officer - Nutrition, at
UNICEF (Lucknow) and Prof A.K. Nigam is Director,
Institute of Applied Statistics and Development Studies,Lucknow, India.
3. Patrice, L., Engle, Menon, Purnimaand Haddad,Lawerence: Care and nutrition, concepts and measurements. International Food Policy Research Institute, Washington, DC, 1997.
1. Department of Women and Child Development,Uttar Pradesh. Nutritional Profile of Women andChildren in Uttar Pradesh, 1999.
2. WHO, BASICS and UNICEF. Nutrition essentials: a guide to health managers, 1999.
as well as providing appropriate onehour rest time and increased foodintake (additional one meal) duringpregnancy.
• The largest national programme withthe objective of preventing and controlling malnutrition is viewed to beICDS (Integrated Child DevelopmentServices). The 'Take Home Ration'(THR) scheme has been introducedrecently for provision of supplementary food on a weekly basis to selected children at seven months tothree years of age (only 28 childrenare covered in a population of 1,000,that is, 35 per cent of the total childpopulation of the given age group)along with pregnant and lactatingmothers. The 'contacts' with mothersand caregivers of infants during theweekly THR sessions could be explored for being effectively used forinterpersonal counselling to mothers/
60
50
QlOJ<1lC 40Ql 2Ql0... 30
2010
TABLE 4Risk Factors and their Loadings (Malnutrition)
Nutritional status of children isinfluenced by a number of developmental efforts - mother's literacy, water and sanitation services, etc. Theincidence of underweight in childrenless than one year, therefore, needsto be viewed as an important andmeasurable indicator of developmentby policy makers along with IMR andunder-five child mortality.
• There is a need to accord highestpriority to care and feeding children(breastfeeding and complementaryfeeding) below one year. Interventionmeasures, if delayed beyond this criticalperiod of infancy, may be too late foreffective prevention of malnutrition inchildren. In addition, care of womenalso needs to be addressed - delaying first conception to over 18 years