Nutrizione e metabolismo: due facce dello stesso problema Nutrition and metabolism: two sides of the same problem Stefano Fumagalli – SOD Cardiologia e Medicina Geriatrica, AOU Careggi e Università di Firenze
Transcript
Nutrizione e metabolismo: due facce dello stesso problemaNutrition and metabolism: two sides of the same problemStefano Fumagalli – SOD Cardiologia e Medicina Geriatrica, AOU Careggi e Università di Firenze
Potential biological pathways for effects of vitamin D on thecardiovascular system
Cardiovascular mortality among individuals on Selenium + CoQ10 versus individuals on placebo (a KM analysis of a rural elderly population)
Alehagen U, 2013
Regeneration of CoQ10 requires selenium in the form of the selenoprotein TrxR1, which contains the unique amino acid selenocysteine (SeC) in its active site
Study Mean Net Change (95% CI)
-10 300 10 20Favors Placebo Favors CoQ10
Pooled Mean Net Change (95% CI)(I2 = 67.5%; p<0.001)
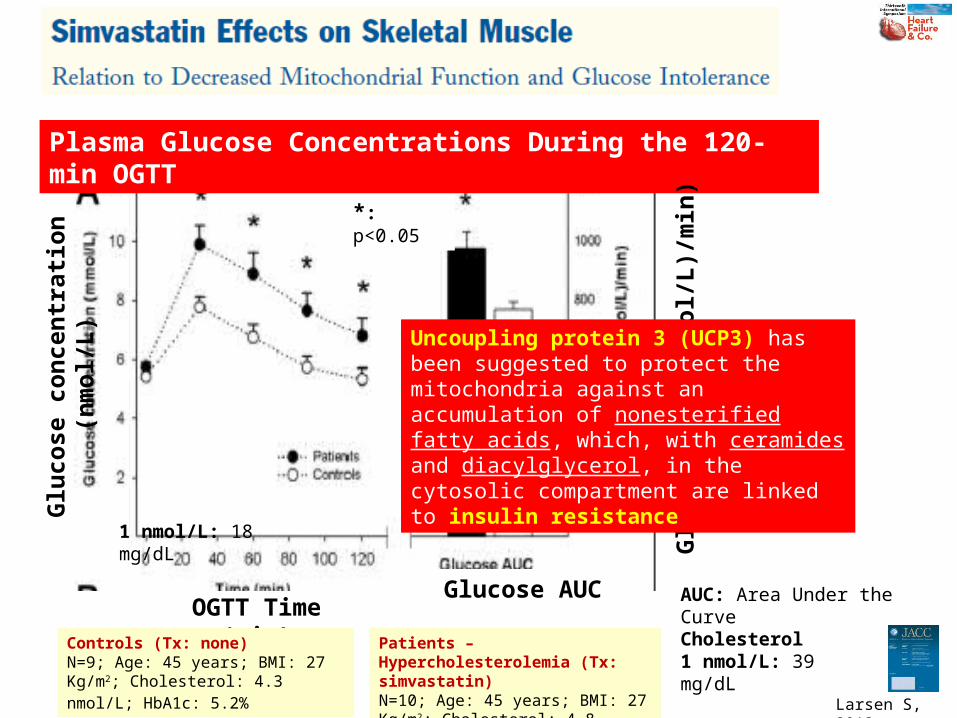
Uncoupling protein 3 (UCP3) has been suggested to protect the mitochondria against an accumulation of nonesterified fatty acids, which, with ceramides and diacylglycerol, in the cytosolic compartment are linked to insulin resistance
• All putative biomarkers should be examined as to whether they are simply associated with greater disease severity (“markers”) or, alternatively, play an important mechanistic role in the disease of interest (“mediators”)
• Coenzyme Q10 appears to be a marker, and generally only mediators make intuitive sense as targets for intervention
2010
HF has a multifactorial pathogenesis: peripheral circulatory insufficiency, autonomic imbalance, activation of RAAS, inflammation, oxidative stress, immune system activation, and insulin resistance are intertwined in a complex manner
The resulting metabolic abnormalities can be linked to long-term myocardial dysfunction
These metabolic processes have been shown to affect other organs (i.e. skeletal muscle, leading to fatigue and physical dysfunction)
Metabolic diseases such as anemia, diabetes mellitus, renal dysfunction, and cardiac cachexia greatly influence the prognosis of HF
Therefore, nutrition has recently been considered to be a new therapeutic target for HF Malnutrition, a lack of micronutrients, sodium restriction and fluid
management are considered to be critical factors in patients with HF, particularly the elderly or patients with severe HF
2013
Study Mean Net Change (95% CI)
-1.06 1.060
Favors CoQ10 Favors Placebo
Pooled Mean Net Change (95% CI)(I2 = 80.5%; p=NS)
-0.30(-0.66, 0.06)
D NYHA Class
Fotino AD, 2013
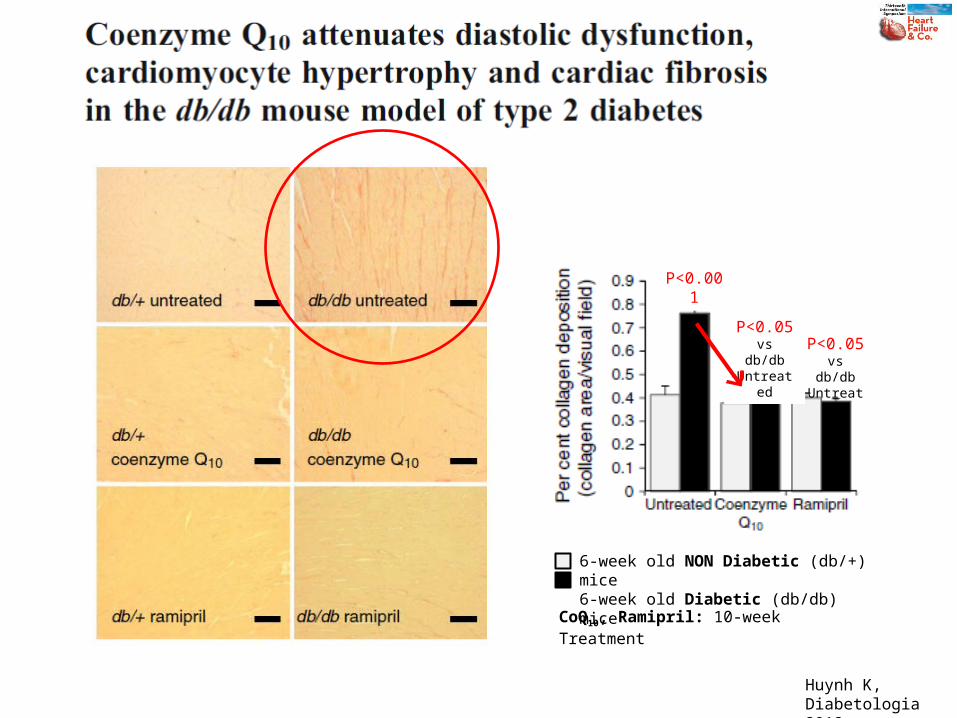
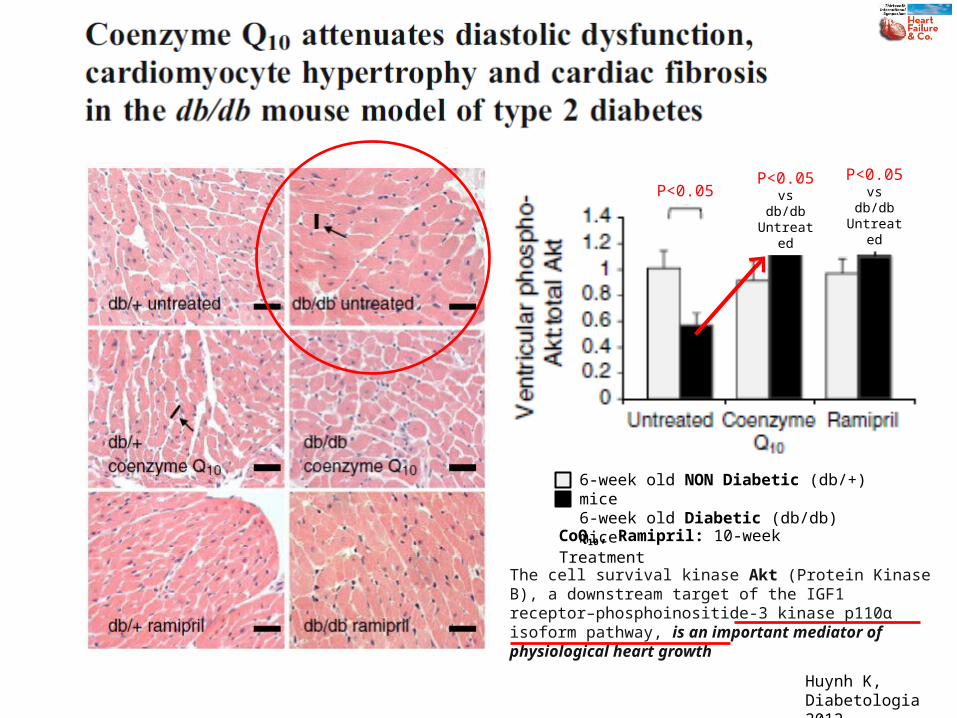
CoQ10, Ramipril: 10-week Treatment
6-week old NON Diabetic (db/+) mice6-week old Diabetic (db/db) mice
P<0.05P<0.05 vs db/db
Untreated
P<0.05 vs db/db
Untreated
Huynh K,Diabetologia 2012
The cell survival kinase Akt (Protein Kinase B), a downstream target of the IGF1 receptor–phosphoinositide-3 kinase p110α isoform pathway, is an important mediator of physiological heart growth