13
N.V. Nederlandse Gasunie buys, transports and sells gas andpromotes the safe, efficient and innovative consumption of thisenergy source. The company pursues its activities both in theNetherlands and abroad.N.V. Nederlandse Gasunie’s trading and transport activitiesare handled by two strictly separate business units. Buying andselling is the responsibility of Gasunie Trade & Supply, whichis a leading European gas supplier with a strong reservesposition. Gasunie Trade & Supply is also one of Europe’slargest providers of gas-related services.The technical management and maintenance of the pipelinenetwork, including safety and new construction work, are theresponsibility of Gasunie Technology & Assets, which alsoowns the transmission network.The criteria governing the operation and maintenance of thetransport network are agreed between Gasunie Technology &Assets and Gas Transport Services B.V., the national networkoperator. This independent subsidiary of N.V. NederlandseGasunie is responsible for implementing a number of statutorytasks relating to gas transport. The company providestransport services, manages and develops the national networkand fulfils public tasks relating to security of supply and the‘small fields policy’.
In 2005 the transport company, including GTS B.V., and thetrading arm of N.V. Nederlandse Gasunie will become two fullyseparate legal entities. This restructuring exercise took economiceffect on January 1, 2005; the target date for legal completionis July 1, 2005.
N.V. Nederlandse GasunieConcourslaan 17 (9727 KC)P.O. Box 19 9700 MA GroningenThe NetherlandsTelephone +31 50 5219111Fax +31 50 5211999E-mail: [email protected]: www.gasunie.nl
Gasunie Technology & Assets
Head OfficeConcourslaan 17 (9727 KC)P.O. Box 199700 MA GroningenThe NetherlandsTelephone +31 50 5219111Fax +31 50 5211999
Eastern DistrictZutphenseweg 51023 (7418 AG)P.O. Box 1627400 AD Deventer The NetherlandsTelephone +31 570 696911Fax +31 570 696411
Western DistrictCoenecoop 7 (2741 PG)P.O. Box 4442740 AK WaddinxveenThe NetherlandsTelephone +31 182 623333Fax +31 182 623399
2
Addresses
Gasunie Engineering & TechnologyEnergieweg 17 (9743 AN)P.O. Box 199700 MA GroningenThe NetherlandsTelephone +31 50 5219111Fax +31 50 5211946Internet: www.getgasunie.nl
Gasunie Trade & SupplyRozenburglaan 11 (9727 DL)P.O. Box 4779700 AL GroningenThe NetherlandsTelephone +31 50 3648648Fax +31 50 3648600
Gas Transport Services B.V.Concourslaan 17 (9727 KC)P.O. Box 1819700 AD GroningenThe NetherlandsTelephone +31 50 3626000Fax +31 50 3626100E-mail: [email protected]: www.gastransport.nl
3

IncorporatedApril 6, 1963
ManagementChief Executive OfficerIr. H.G. Dijkgraaf
Managing Director Gasunie Technology & AssetsM.P. KramerManaging Director Gasunie Trade & SupplyD.L. BensdorpManaging Director FinanceH.A.T. Chin SueBusiness Support Director E. Dam
ShareholdersEnergie Beheer Nederland B.V. 40%Esso Nederland B.V. 25%Shell Nederland B.V. 25%State of the Netherlands 10%
Participating interestsGasunie Engineering B.V. 100%EuroHub B.V. 100%Gas Transport Services B.V. 100%Gasunie BBL B.V. 100%C.V. Gasexpansie IJmond 50%EuroHub GmbH 33 %
4
Organization
13
EnvironmentN.V. Nederlandse Gasunie publishes an environmental annualreport. Environmental policy is given high priority at all times.Gasunie Trade & Supply operates the Environmental Plan forIndustry (MPI), an energy audit of a company’s energy utilizationand production processes aimed at saving gas and cuttingemissions. Gasunie Technology & Assets and GTS takes particularcare to minimize the environmental impact of its pipelineoperations. For the consumer market, Gasunie Engineering &Technology develops and improves appliances and applicationswith the object of maximizing efficiency, convenience, cost savingsand environmental protection.
5
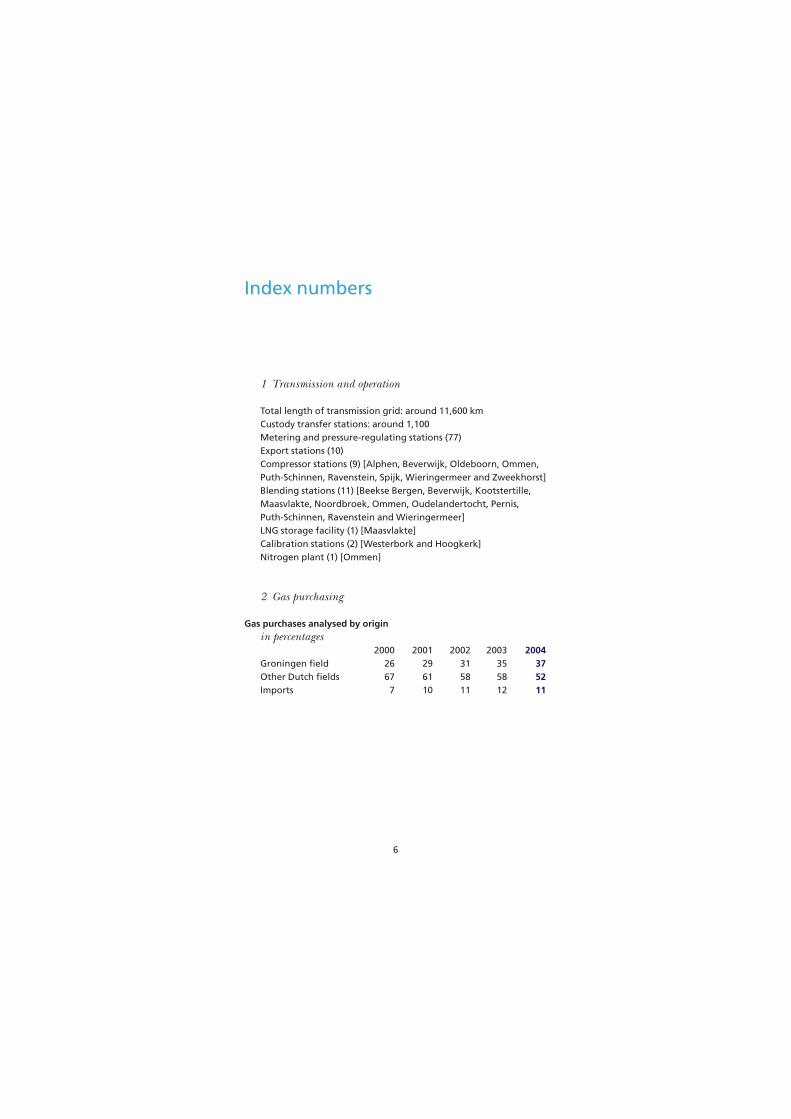
1 Transmission and operation
Total length of transmission grid: around 11,600 kmCustody transfer stations: around 1,100Metering and pressure-regulating stations (77)Export stations (10)Compressor stations (9) [Alphen, Beverwijk, Oldeboorn, Ommen, Puth-Schinnen, Ravenstein, Spijk, Wieringermeer and Zweekhorst]Blending stations (11) [Beekse Bergen, Beverwijk, Kootstertille,Maasvlakte, Noordbroek, Ommen, Oudelandertocht, Pernis, Puth-Schinnen, Ravenstein and Wieringermeer]LNG storage facility (1) [Maasvlakte]Calibration stations (2) [Westerbork and Hoogkerk]Nitrogen plant (1) [Ommen]
2 Gas purchasing
Gas purchases analysed by originin percentages
2000 2001 2002 2003 2004Groningen field 26 29 31 35 37Other Dutch fields 67 61 58 58 52Imports 7 10 11 12 11
6
Index numbers
7
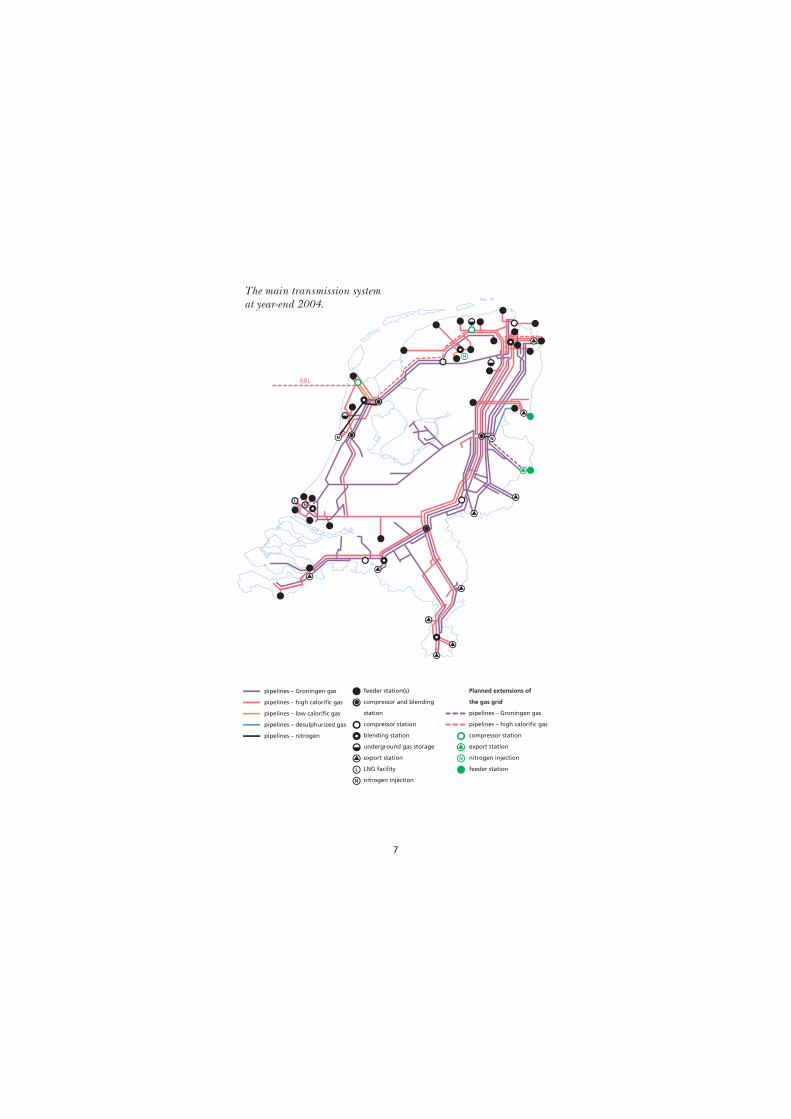
pipelines – Groningen gas
pipelines – high calorific gas
pipelines – low calorific gas
pipelines – desulphurized gas
pipelines – nitrogen
feeder station(s)
compressor and blending
station
compressor station
blending station
underground gas storage
export station
LNG facility
nitrogen injection
L
N
Planned extensions of
the gas grid
pipelines – Groningen gas
pipelines – high calorific gas
compressor station
export station
nitrogen injection
feeder station
N
N
BBL
N
N
LN
The main transmission system at year-end 2004.
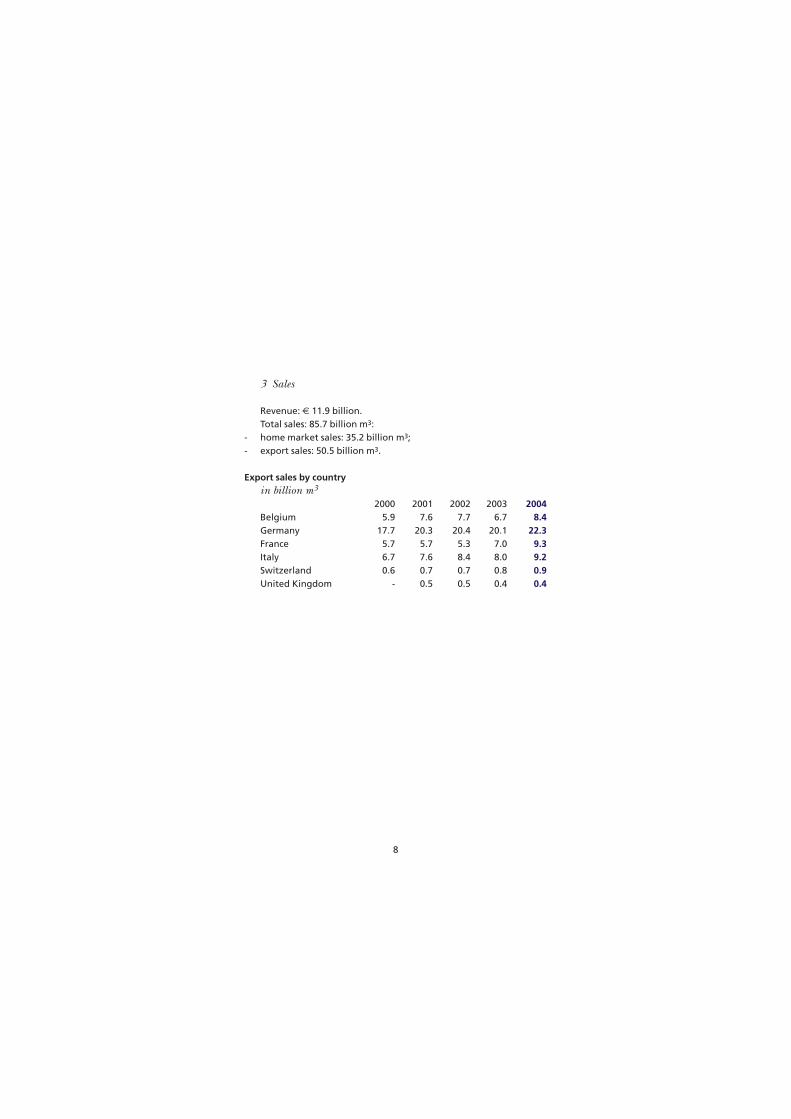
3 Sales
Revenue: € 11.9 billion.Total sales: 85.7 billion m3: home market sales: 35.2 billion m3;export sales: 50.5 billion m3.
Export sales by countryin billion m3
2000 2001 2002 2003 2004Belgium 5.9 7.6 7.7 6.7 8.4Germany 17.7 20.3 20.4 20.1 22.3France 5.7 5.7 5.3 7.0 9.3Italy 6.7 7.6 8.4 8.0 9.2Switzerland 0.6 0.7 0.7 0.8 0.9United Kingdom - 0.5 0.5 0.4 0.4
8
--
9
87
654
321
9
6
32
87
54
21
987
654
321
875
4
987
654
321
987
654
321
987
654
321
6
3
987
654
321
987
654
321
9
6
9
8
7
5
10
16
13
1110
181716
151413
121110
18
15
10
1716
151413
121110
181716
151413
121110
16
181716
151413
1110
181716
151413
121110
181716
151413
121110
18
15
12
181716
1413
181716
151413
121110
BA
EE FF
KK LL MM N
D
J
G
PO
R
SS
55°
54°
53°
52°
3° 4° 5°
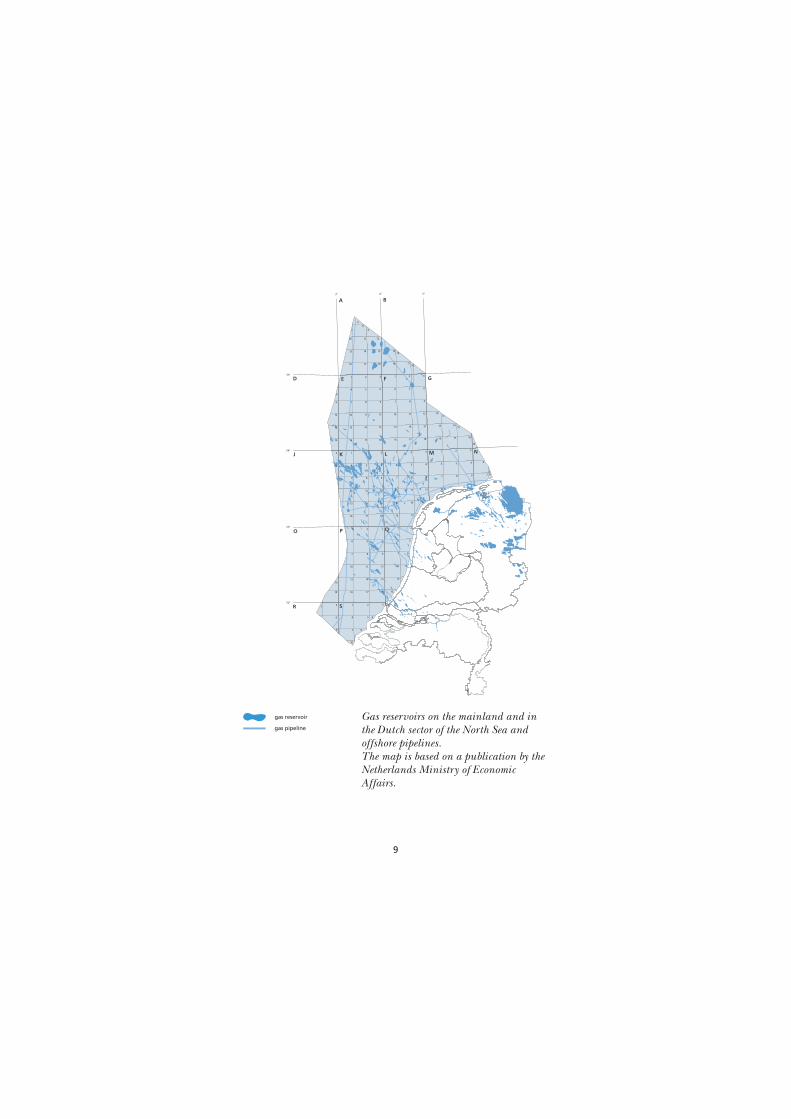
Gas reservoirs on the mainland and inthe Dutch sector of the North Sea andoffshore pipelines. The map is based on a publication by theNetherlands Ministry of EconomicAffairs.
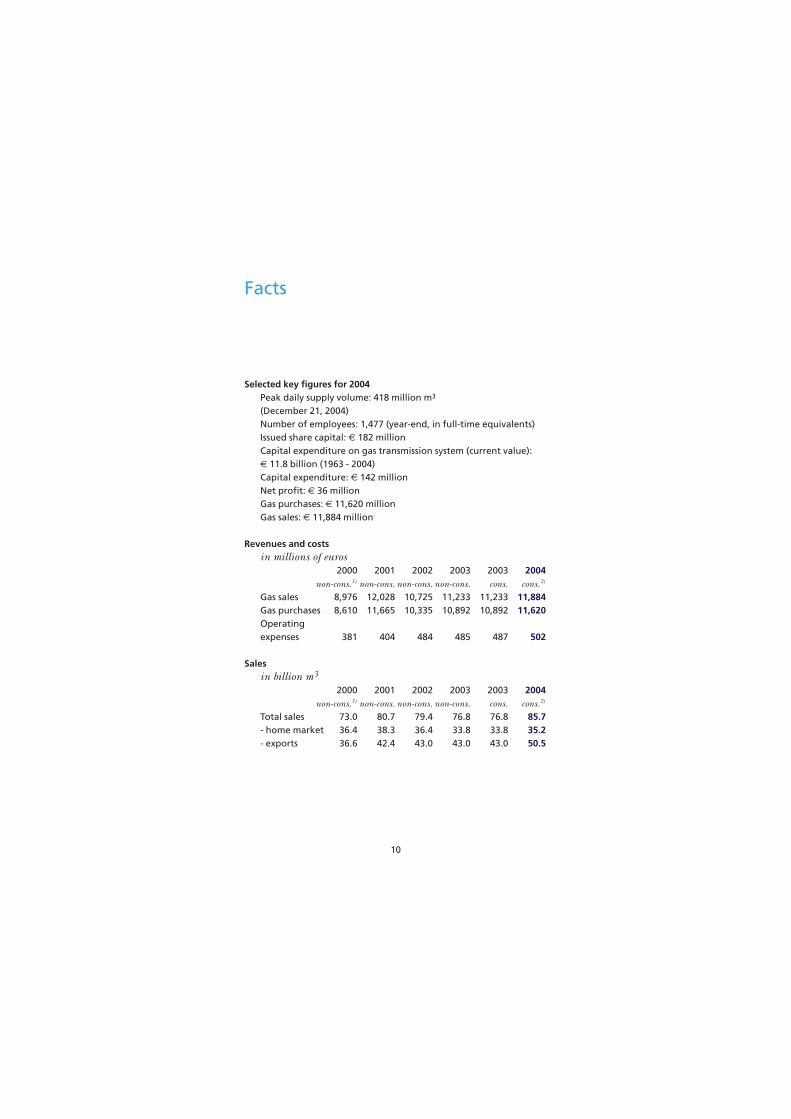
Selected key figures for 2004Peak daily supply volume: 418 million m3
(December 21, 2004)Number of employees: 1,477 (year-end, in full-time equivalents)Issued share capital: € 182 millionCapital expenditure on gas transmission system (current value):€ 11.8 billion (1963 - 2004)Capital expenditure: € 142 millionNet profit: € 36 millionGas purchases: € 11,620 millionGas sales: € 11,884 million
Revenues and costsin millions of euros
2000 2001 2002 2003 2003 2004non-cons.1) non-cons. non-cons. non-cons. cons. cons.2)
Gas sales 8,976 12,028 10,725 11,233 11,233 11,884Gas purchases 8,610 11,665 10,335 10,892 10,892 11,620Operatingexpenses 381 404 484 485 487 502
Salesin billion m3
2000 2001 2002 2003 2003 2004non-cons.1) non-cons. non-cons. non-cons. cons. cons.2)
Total sales 73.0 80.7 79.4 76.8 76.8 85.7- home market 36.4 38.3 36.4 33.8 33.8 35.2- exports 36.6 42.4 43.0 43.0 43.0 50.5
10
Facts
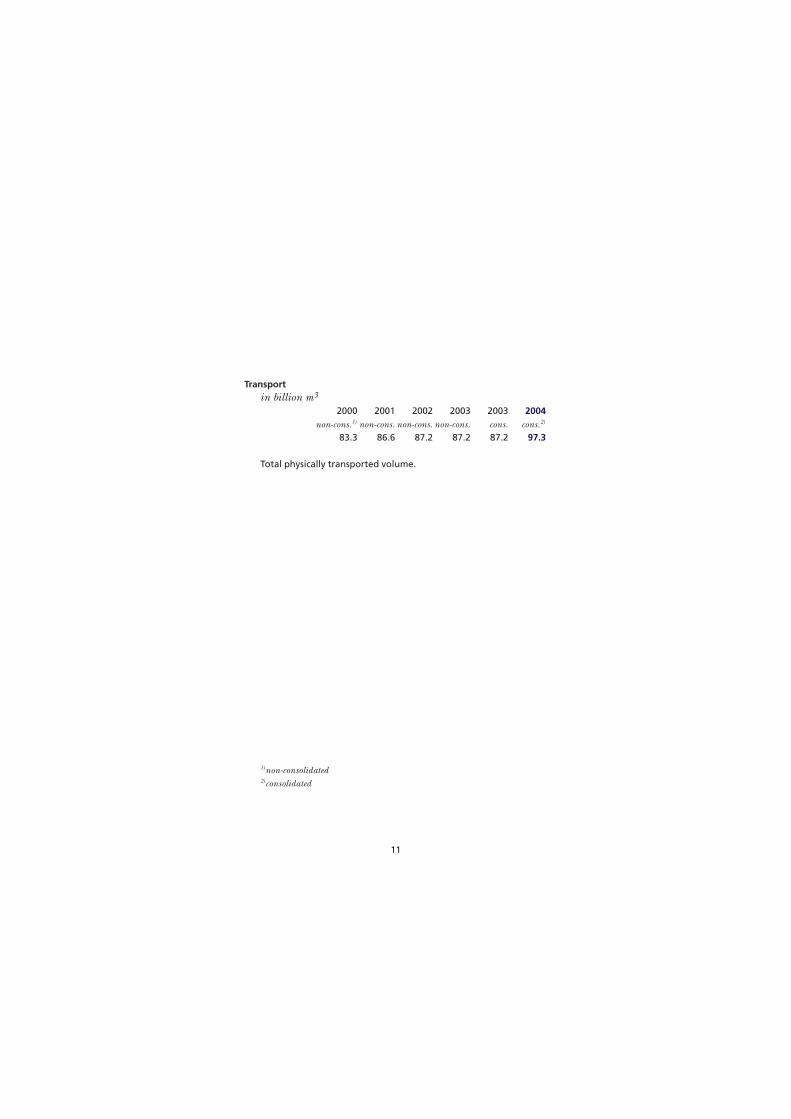
Transportin billion m3
2000 2001 2002 2003 2003 2004non-cons.1) non-cons. non-cons. non-cons. cons. cons.2)
83.3 86.6 87.2 87.2 87.2 97.3
Total physically transported volume.
1)non-consolidated2)consolidated
11
N.V. Nederlandse GasunieConcourslaan 17 (9727 KC)P.O. Box 199700 MA GroningenThe NetherlandsTelephone +31 50 5219111Fax +31 50 5211999E-mail: [email protected]: www.gasunie.nl
12
Information


![GasS&U Gasunie [Read-Only] - UNECE](https://static.documents.pub/doc/80x56/618126414bb4d755c61d84b3/gassampu-gasunie-read-only-unece.jpg)


