123
NVivo 11 WORKSHOP II HUI BIAN OFFICE FOR FACULTY EXCELLENCE 1

NVivo 11 WORKSHOP II
HUI BIAN
OFFICE FOR FACULTY EXCELLENCE
1

Contents of this workshop
Memo
Links
Autocoding
Classifications
Query
Maps
Reports
2
Sample project
We use sample project from
NVivo.
It is about Environmental
Change Down East.
3

Memo
“Memos are a type of
document that enable you
to record the ideas, insights,
interpretations or growing
understanding of the
material in your project.”
4
4

Memo
Create memos for sources—capturing any
issues, comments or insights that arise.
Create memos for nodes—describing the
significance of the node and the patterns
or ideas that emerge from the references.
Create 'unlinked' memos to store other
information about your project such as
research objectives or project progress.
5
5

Memo
We also can import memos into the NVivo.
Create a new memo inside NVivo:
Make sure Memo folder is open
Under Sources group > Create > Memo
6
6

Memo 7

Memo
Go to Home > under Editing group:
Insert > Insert Date/Time (Ctrl+Shift+T)
8
Memo
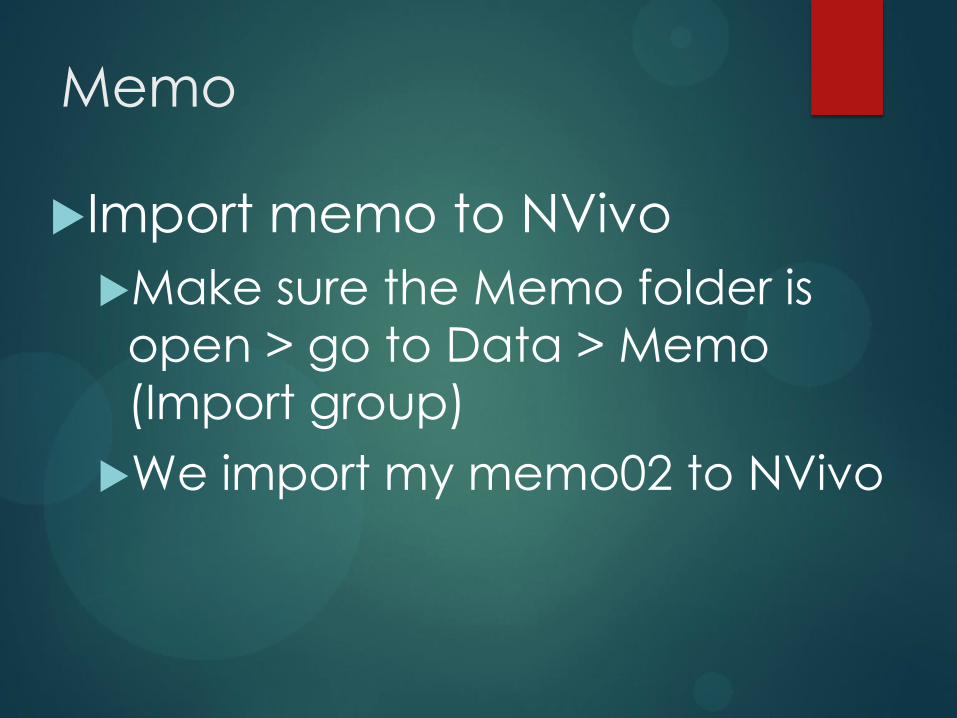
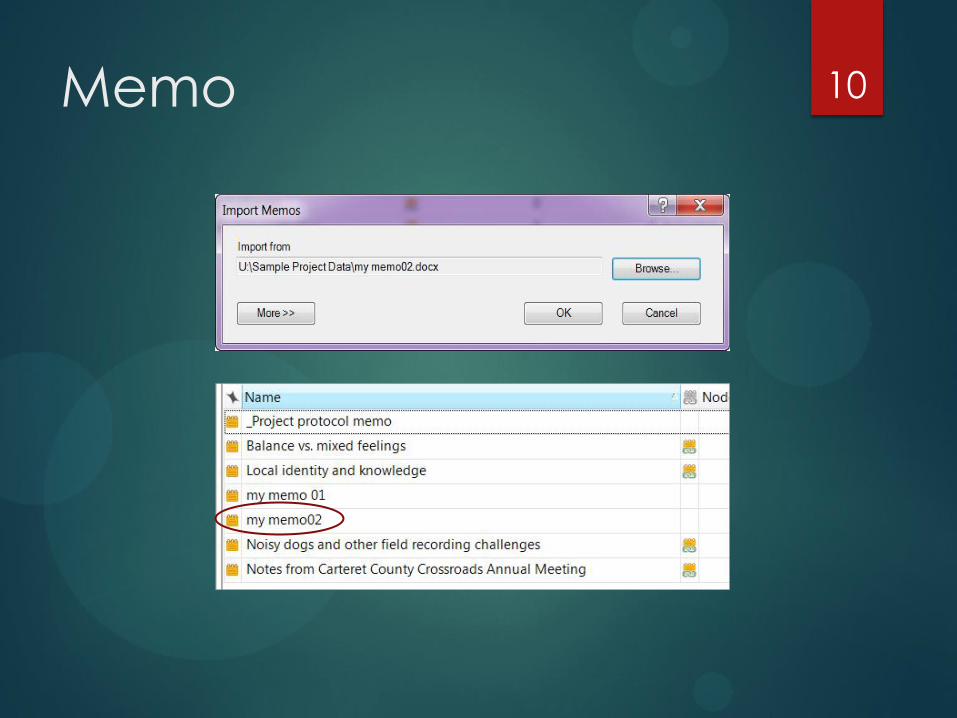
Import memo to NVivo
Make sure the Memo folder is
open > go to Data > Memo
(Import group)
We import my memo02 to NVivo
Memo 10

Links
Use See also links to draw
connections between items in your
project.
Use Hyperlinks to link to web pages
or files outside of your project.
Use Memo link to capture your
observations and insights.
11
11

See also links
We can link the content in
a source or node to
an entire project item
Part of another source
Another part of the same
source
12

See also links
See also links
13

See also link
Create a see also link between two
paragraphs within one source (use Dorothy
interview transcript).
Highlight one paragraph of Dorothy
interview transcript and Copy.
Then go to the paragraph you want to link
and Paste as See Also Link
The second paragraph should be
highlighted in pink.
14

See also links
We got this new window at the
bottom of the detail view
15

See also links
How open see also links
In the source, click the bottom see
also link.
Click Analyze > under Links group, >
See also links
16

See also links
Create another see also
link between one
paragraph in Dorothy
interview document and
one image called Marsh
inside Internals > Area and
Township > Marsh
17

See also links
Select content in Dorothy
Go to Analyze > in Links group,
click See Also Links > New See
Also Links
In the dialogue window, click
Select button to locate Marsh
image
18

See also links 19

Hyperlinks
Add hyperlinks in documents or
memos to link to webpages or
files outside of your project
Open source (Dorothy)
Select content
Right click > Links > Hyperlink >
New hyperlink
20
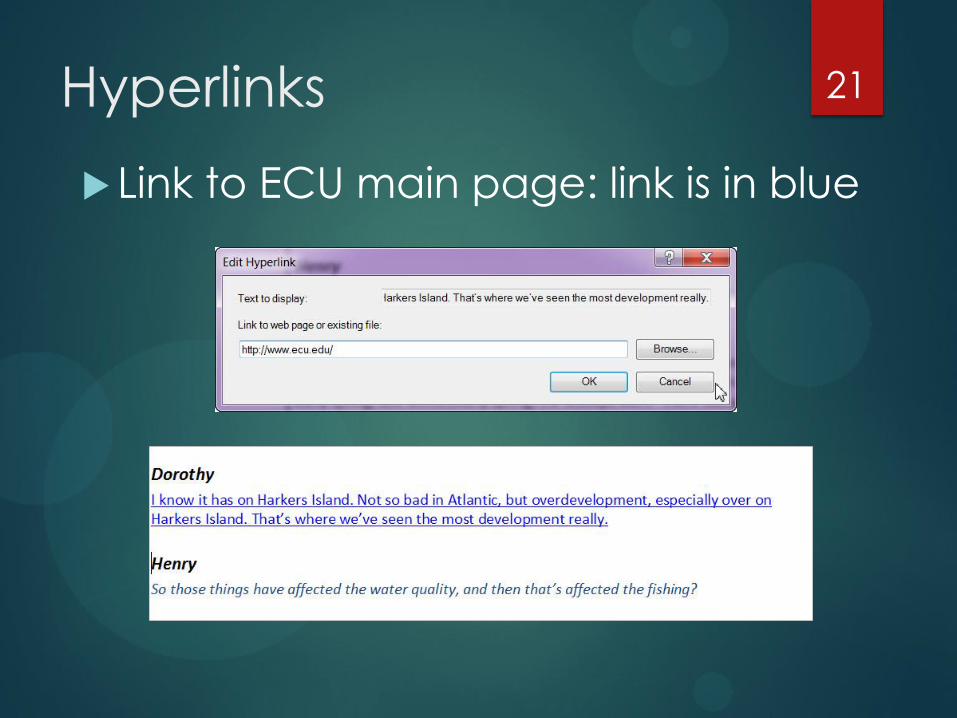
Hyperlinks
Link to ECU main page: link is in blue
21

Memo links
Memo link:
Let’s create a memo link between
part of sources and memo
Click any interview document and
highlight the sentences you want to
link to the memo.
Right click > Links > Memo Link > Link
to Existing Memo > Highlight the
memo file we want to link.
22
22

Memo links
Use Dorothy interview as an example:
link to my memo 01
23
23

Memo links
24
They are memo links
24

Memo link
Open linked memo
Highlight Dorothy, right click the memo link sign,
Memo link > Open Linked Memo. You can delete
memo link in the same way.
25

Annotations
To record comments, reminders or
observations about specific content in
a source or node.
Annotated content is highlighted in
blue and the text of the annotation is
displayed in the Annotations tab at the
bottom of the window
26

Annotations
Annotate text in document
Highlight text
Links > Annotation > New Annotation
27
Autocoding in documents
sources We autocode interview
questions
Create a folder inside Nodes
folder
Go to Sources and select the
interview transcripts
Go to Analyze > Autocode
28
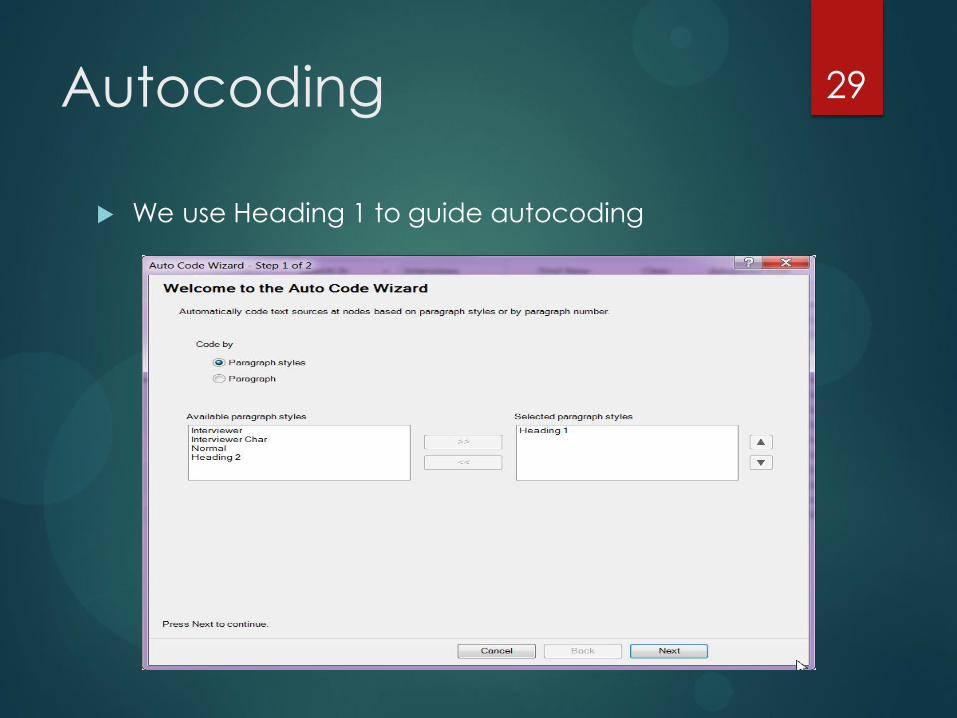
Autocoding
We use Heading 1 to guide autocoding
29

Autocoding
We are creating a new node called Interview questions
30

Autocoding
Under Nodes > autocoded
interview folder
31
Classification
“Classifications provide a way to
record descriptive information
about the sources, nodes and
relationships in your project.”
Source classifications
Case classifications
Relationship types
32
32
Classification
Source classifications: stores
bibliographical information about
sources.
Case classifications: help manage
demographic information such as
people and places.
33
33

Case Classifications
Case classifications
Make comparisons based on
demographic attributes of participants
(for example, gender or age).
Make comparisons based on attributes
of places, organizations or other entities
(for example, compare how issues are
handled in large and small schools).
34
34

Case Classifications
Before create case classifications,
we need to create cases (case
nodes) first.
Create a new folder called
Participants under Nodes, Cases.
Open Interview folder under
sources > Create > Under Items
group, click Create as Cases
35
Case Classifications
Create case classification: NVivo
provides two predefined
classifications:
Person and Organization.
We need to create a new case
classification called Participants
36
36

Case Classifications
Go to Create > Case Classification
37
37

Case Classifications
For a new classification, we
need to add attributes
Highlight Participants and
right click > New Attribute
(or Create > Attribute)
38
Case Classifications
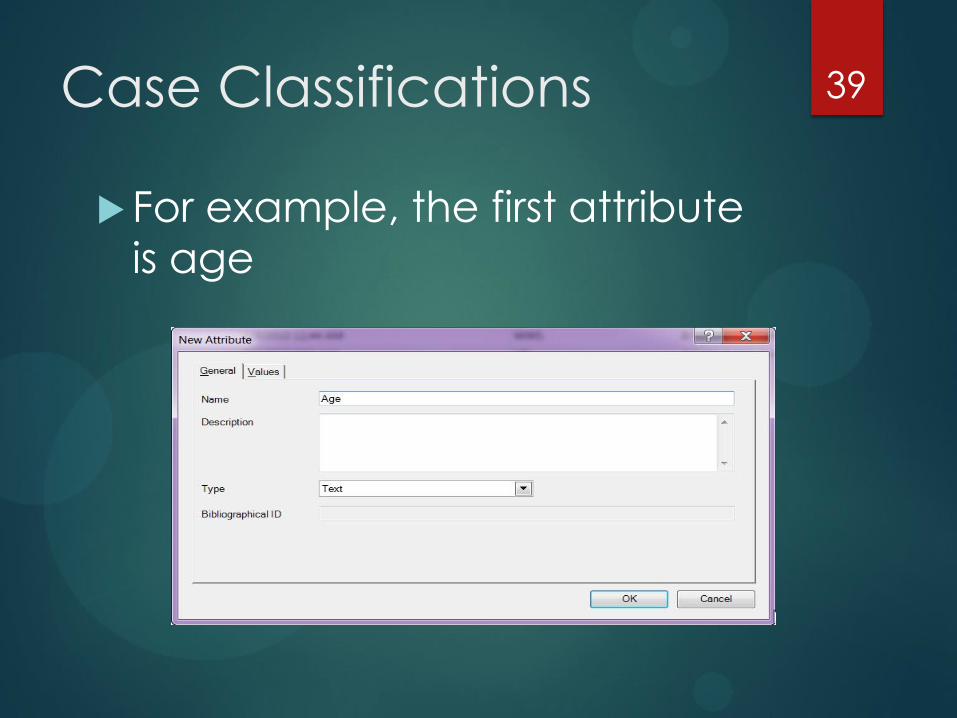
For example, the first attribute
is age
39
Case Classifications
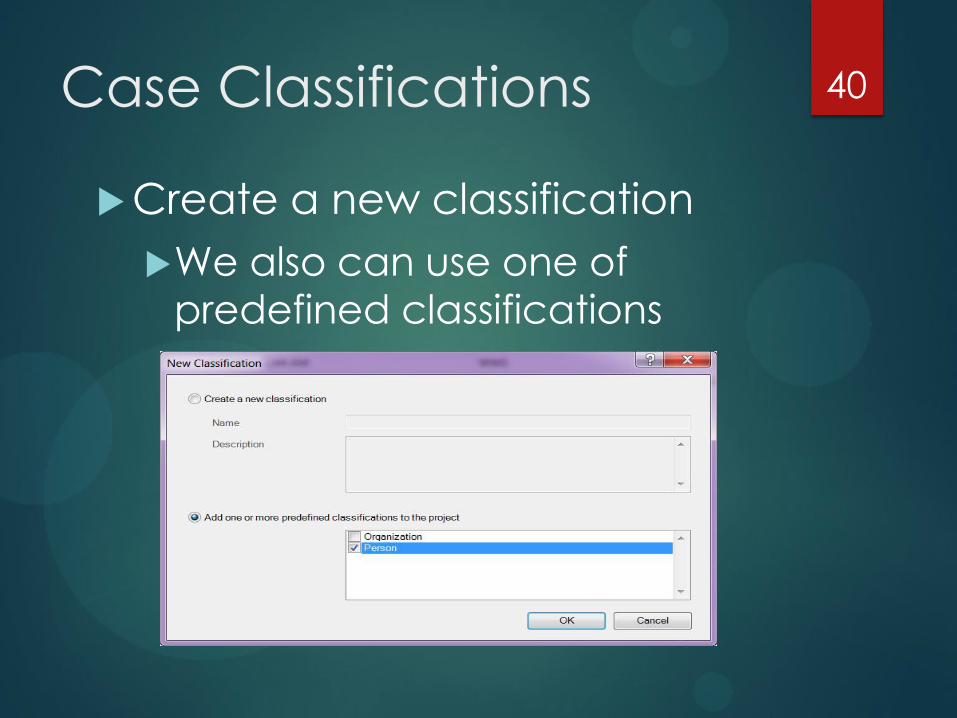
Create a new classification
We also can use one of
predefined classifications
40
Case Classifications
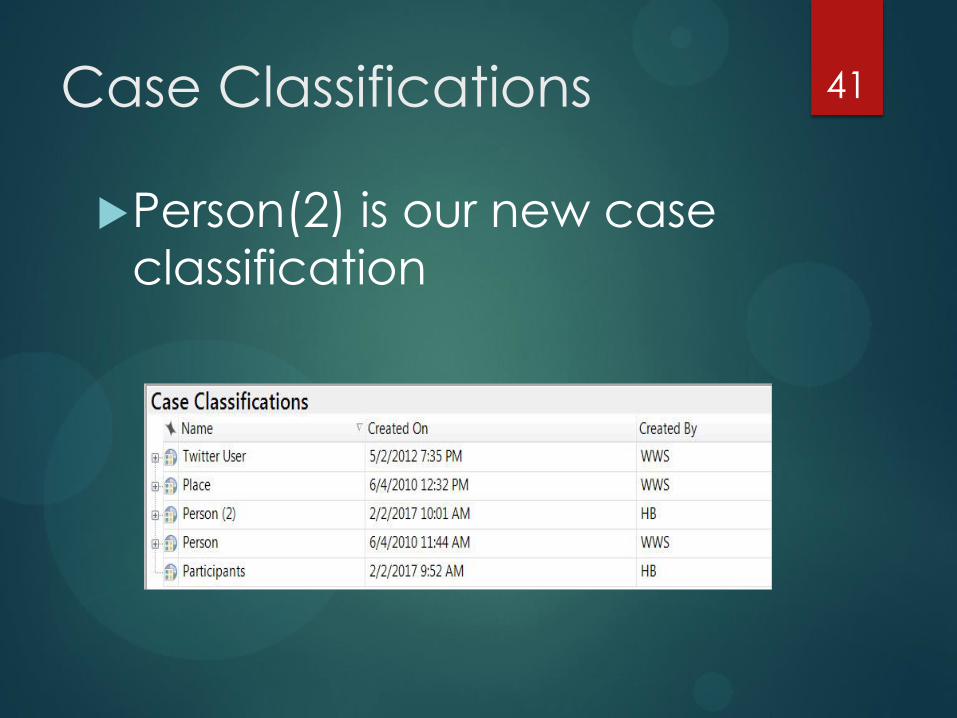
Person(2) is our new case
classification
41

Case Classifications
Under Classification > case
Classification you should see this:
42
42

Case Classifications
Change attributes
1. don’t want “Name”
attribute: highlight Name >
right click > delete
2. want to change “Sex”
attribute to Gender: highlight
Sex > right click > Attribute
properties
43
43

Case Classifications
Change attributes
3. add a new attribute
(commercial fishing):
highlight Person (2) > Create
> click Attribute (from
classifications group) > type
Commercial fishing
44
Case Classifications
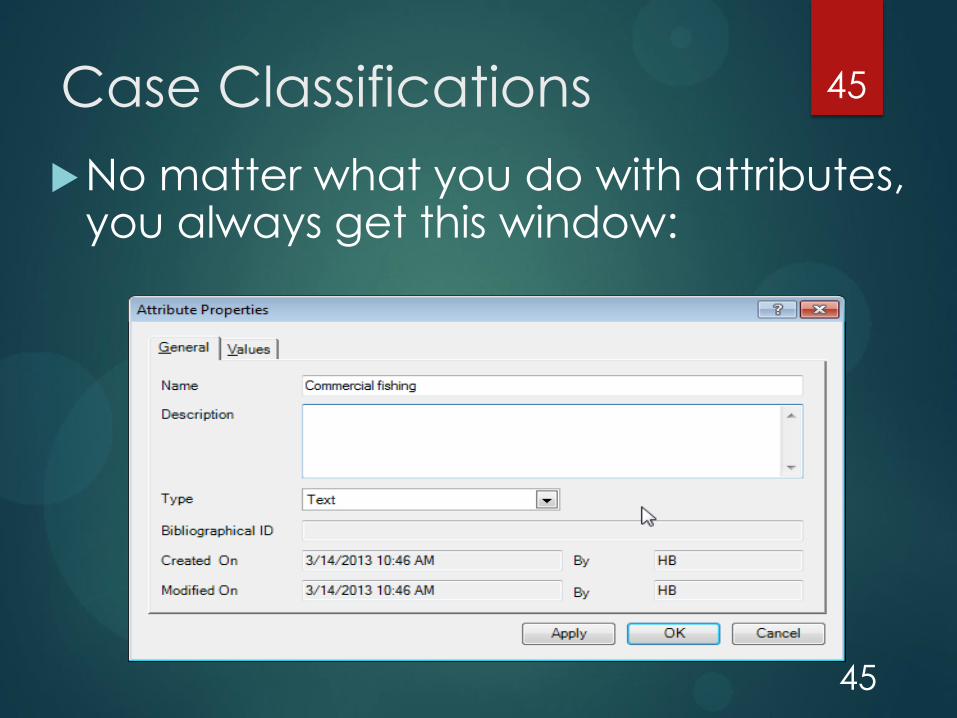
No matter what you do with attributes, you always get this window:
45
45

Case Classifications
Give values to each attribute
Double click each attribute, then
click Value tab (for example
giving values to Gender attribute
that has two types of values:
female and male)
Click Add > then type female
Click Add again > type male
46
46

Case Classifications
47
47

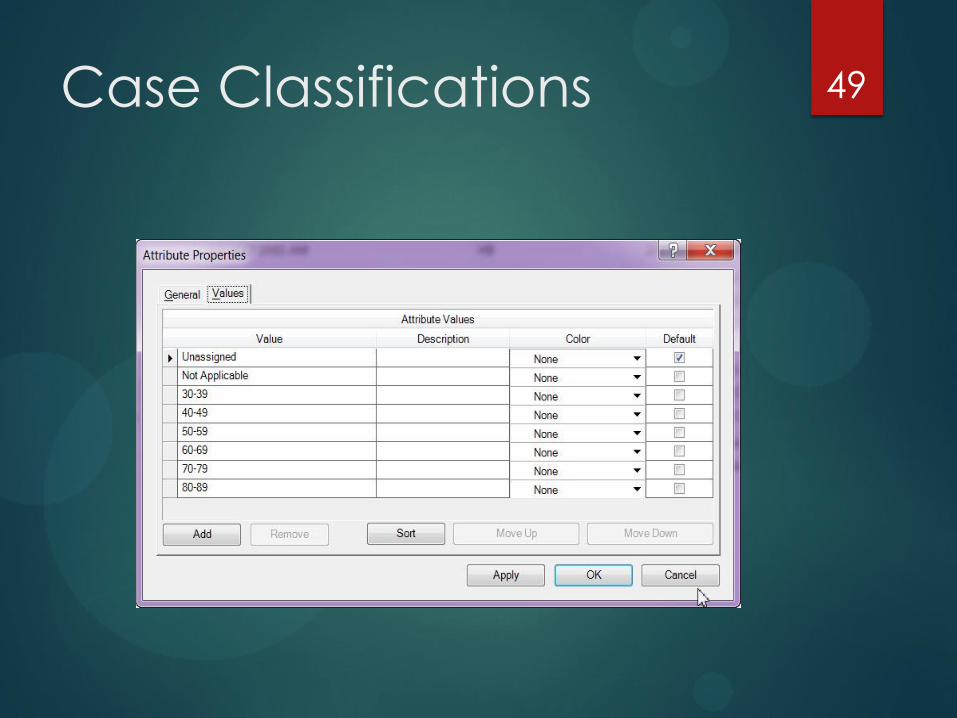
Case Classifications
Let’s add values to Age group,
Community, and Commercial
finishing attributes
Age group:
30-39; 40-49; 50-59; 60-69; 70-
79; 80-89
48
48
Case Classifications 49

Case Classifications
Assign classification to case nodes
Click Nodes > under Cases
folder, select People. Interview
Participants
Select any participant, right click
(or Explore > Case Classification
Sheet > Person(2))
Classification > Choose Person(2)
50
50

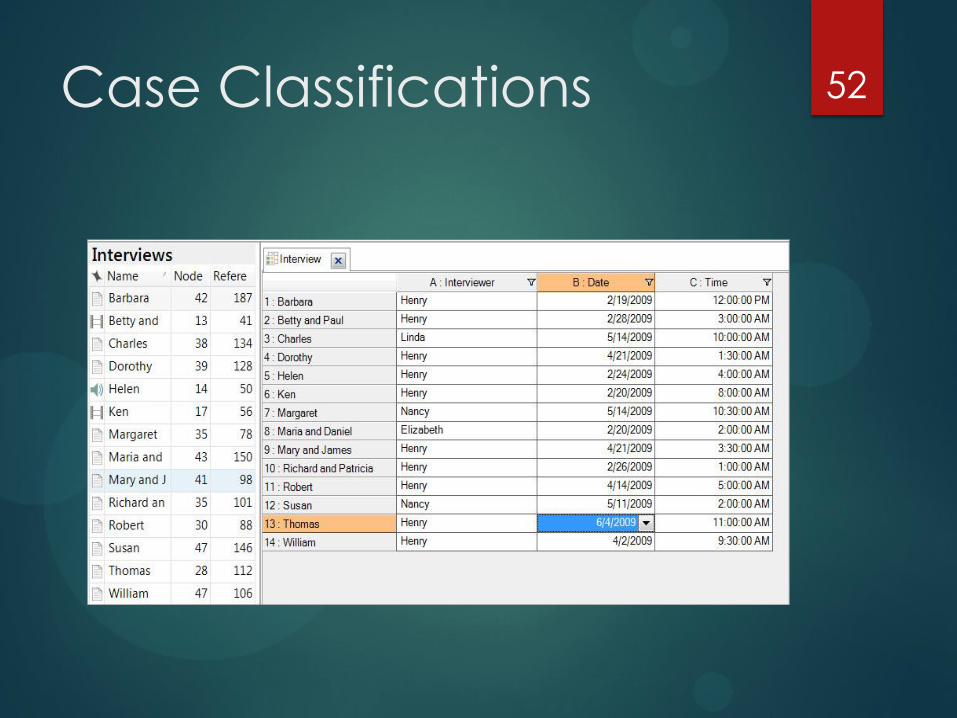
Case Classifications
Open Classification for case nodes
Select any case in People
Right click > Open Classification
Sheet
51
51
Case Classifications 52
Case classifications
Import case classification sheet to
NVivo (Recommended)
We use Excel to prepare case
classification
The name of the classification
must be in the first cell of the
worksheet.
53

Case classifications
Classification sheet (Excel file)
In the first cell is Subjects, a
classification name
54

Case classifications
First we go to Case nodes
Nodes > Cases > open
Participants folder > select all
case nodes
Go to DATA > Classification
Sheets
55

Case classifications 56

Case classifications 57
Select Case classification
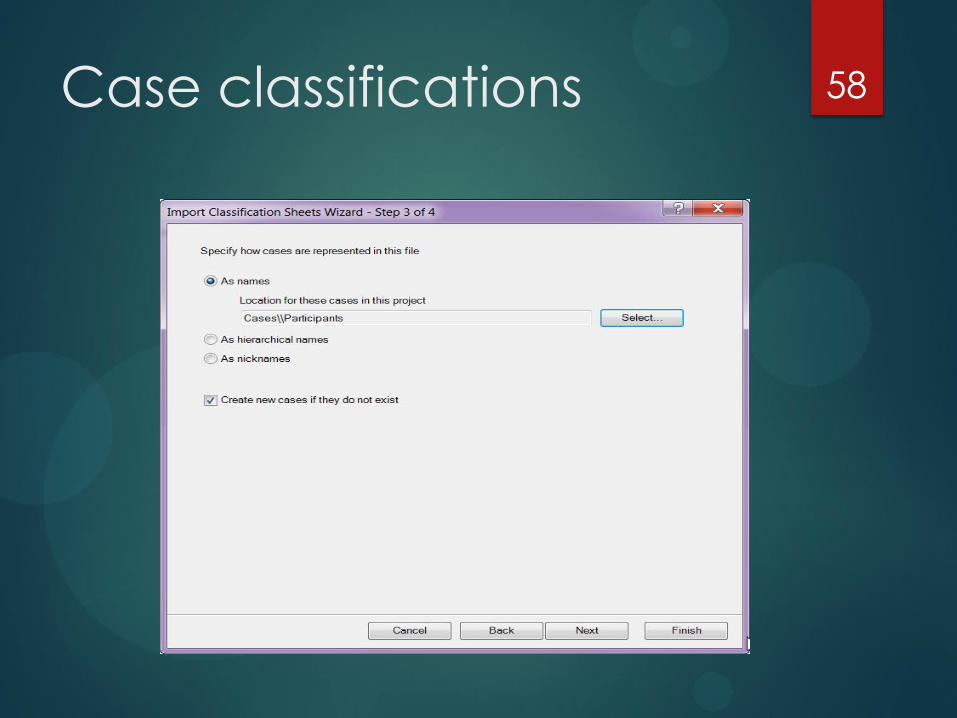
Case classifications 58
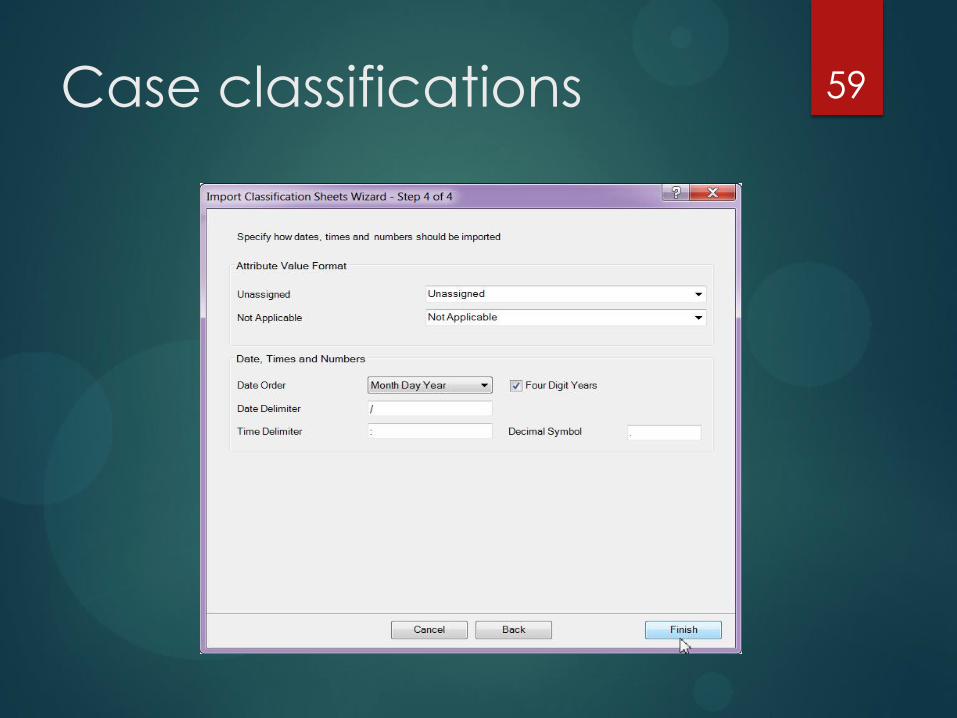
Case classifications 59
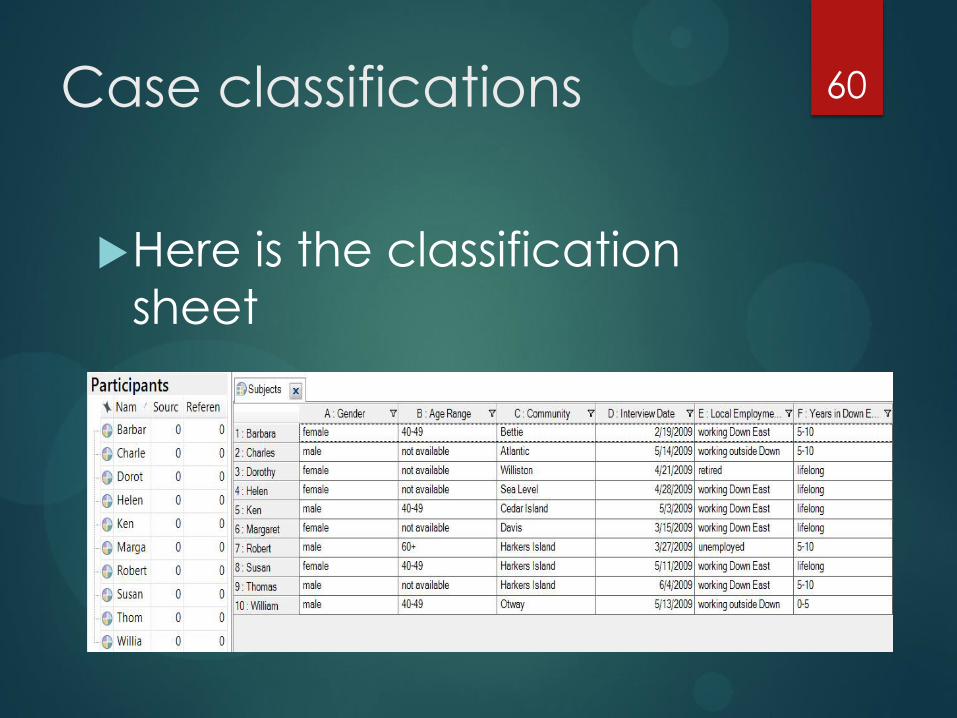
Case classifications
Here is the classification
sheet
60
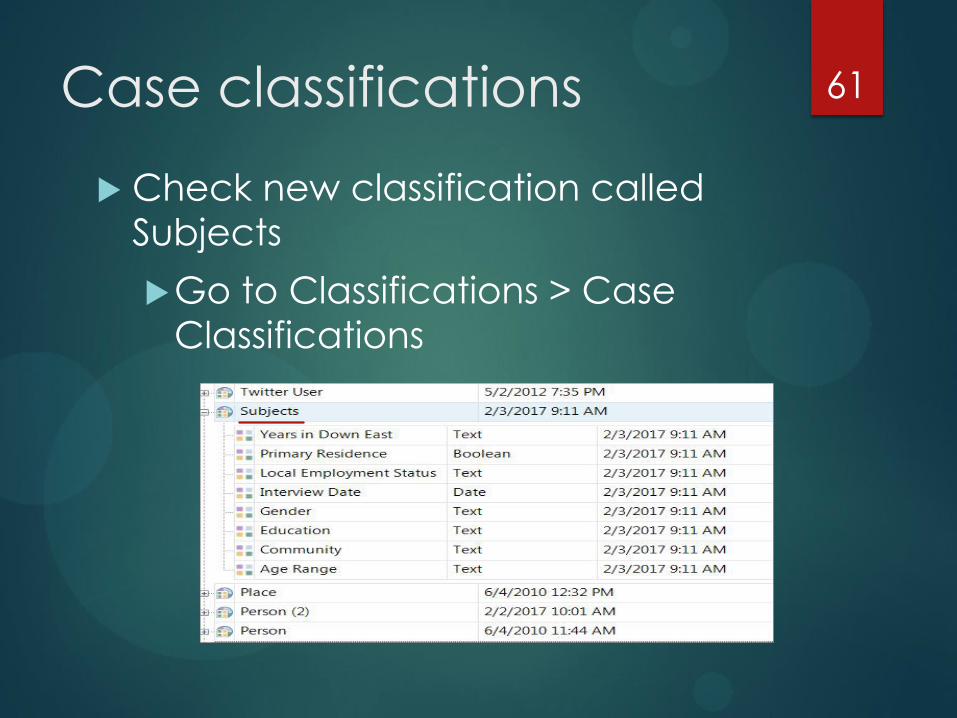
Case classifications
Check new classification called
Subjects
Go to Classifications > Case
Classifications
61

Matrix Coding Query
This query is used for exploring what
different demographic groups have
said about an experience, an attitude
or an issue
Compare terms used in different
contexts
Compare attitudes
62
62
Matrix Coding Query
For example: what difference
between females and males in
viewing fishing in down east?
63
63

Matrix Coding Query
Go to Query tab > Matrix Coding
Check the box in front of Add to project and
give a name for this query
64
64

Matrix Coding Query
Click Matrix Coding Criteria tab
Under Row tab > click Select > try to
locate case classification for gender >
Click Add to list
65
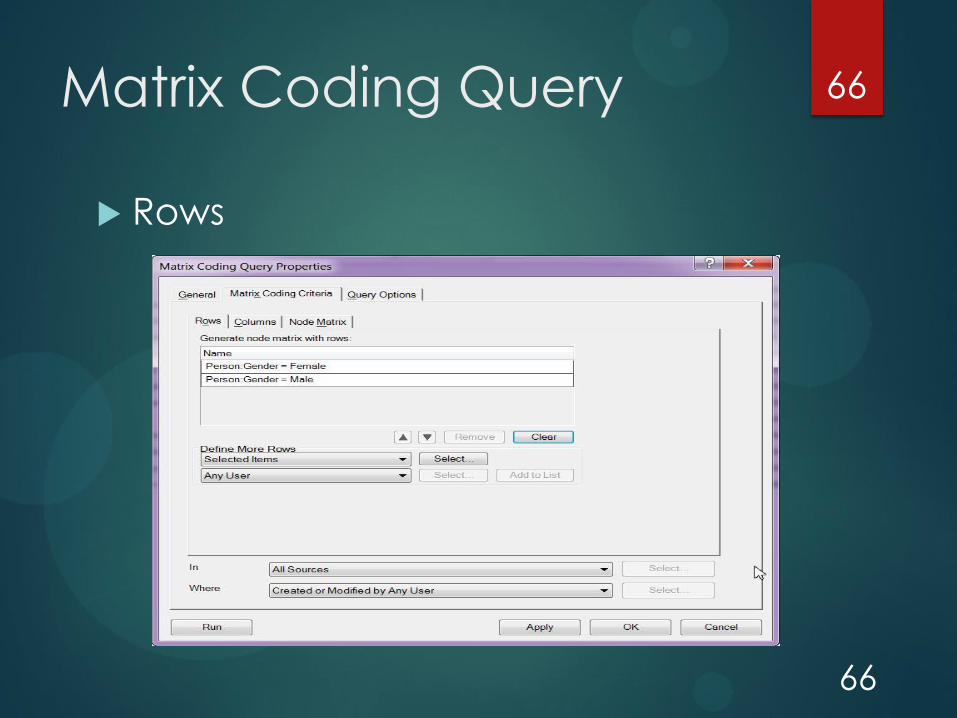
Matrix Coding Query
66
Rows
66

Matrix Coding Query 67
Click Column tab > Click Select > try to
locate Fishing node > Click Add to list
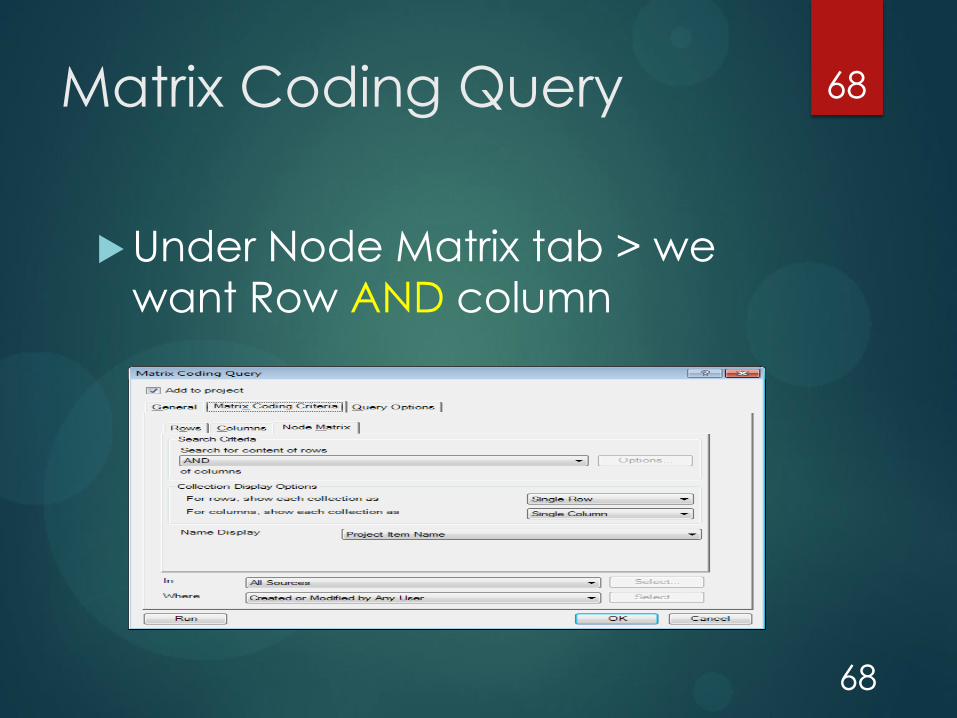
Matrix Coding Query
Under Node Matrix tab > we
want Row AND column
68
68

Matrix Coding Query
Under Query option > Under Results
> Create results as new node matrix
69
69

Matrix Coding Query
70
Results > Click Queries > Queries
folder
70

Matrix Coding Query
Matrix Coding Query results
71
The frequencies (67/91) represent the
number of references in Fishing node by
gender.
71

Matrix Coding Query
Results
Click Chart tab to get a
chart
72
72

Matrix Coding Query
Results: double click the reference
number by gender to take a look
at the content of Fishing node by
gender.
73
73

Coding Query
Coding query
Gather material coded at combinations of nodes.
Gather material from nodes with specific attribute values.
Search for content coded at multiple nodes and use operators to further refine the query.
Search for content that is NOT coded at a specific node.
74
74

Coding Query
Example: we want to
know how people
who did commercial
fishing thought about
Tourism and Natural
environment.
75
75

Coding Query
Coding Query
Query > Coding
We have two conditions: Commercial
fishing = Yes and focus on Tourism
node and Natural environment node
Click Plus sign
76
76

Coding Query
77
Choose Coded at Any Case Where
and Coded at Any Selected Node
77

Coding Query
78
78

Coding Query
Click Add to Project
Give a name for this coding query
79
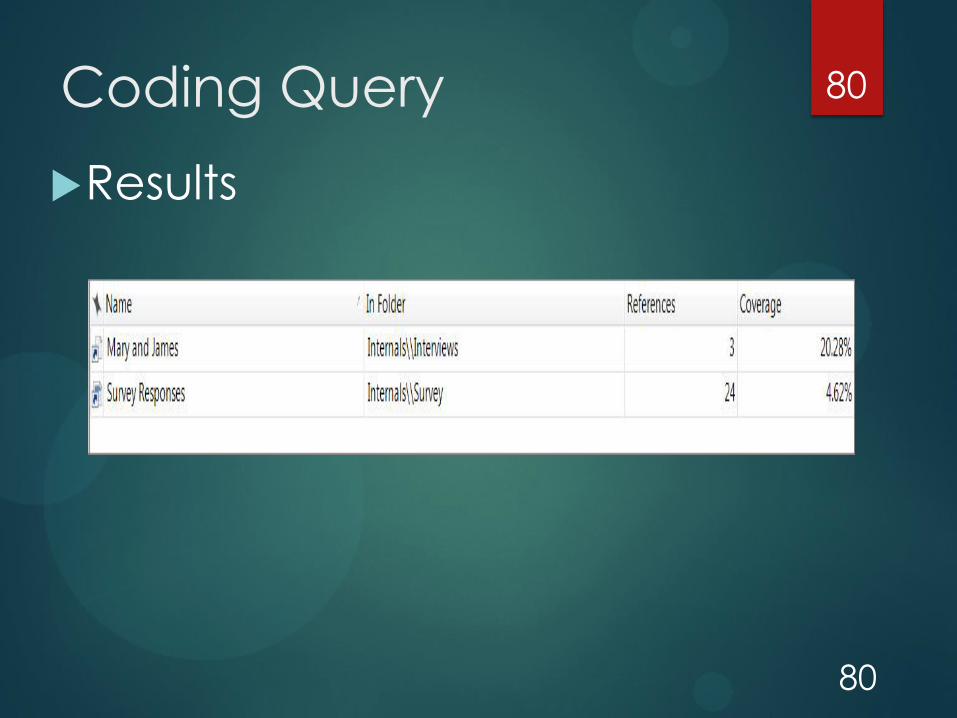
Coding Query
Results
80
80
Maps
Maps are tools for exploration and
visualization.
Maps can be used for both
analysis and presentation.
81
81
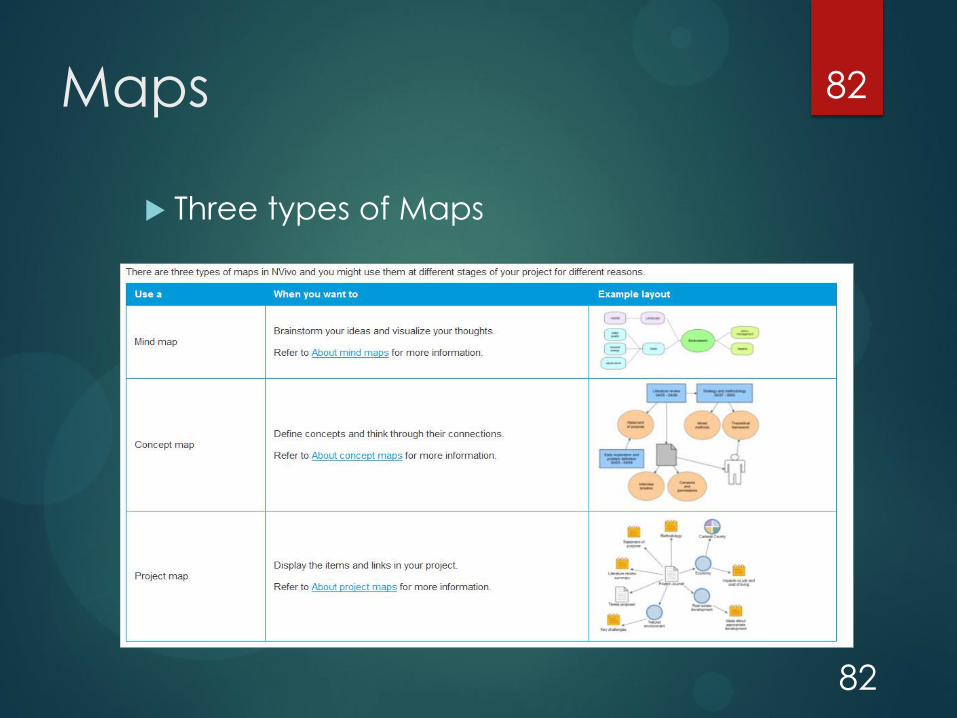
Maps
Three types of Maps
82
82
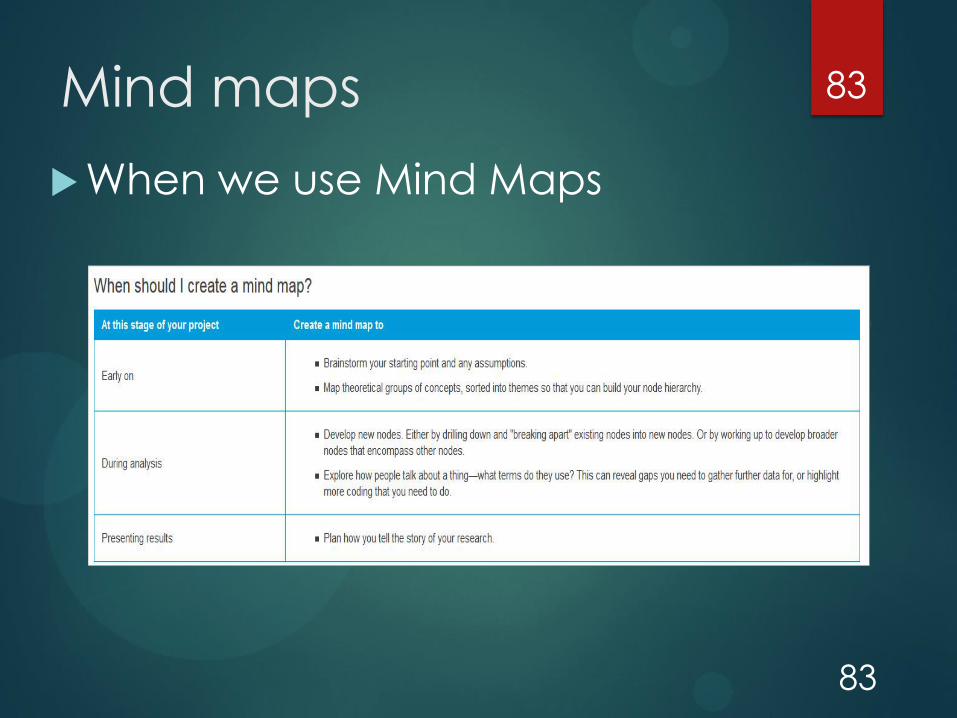
Mind maps
When we use Mind Maps
83
83

Mind maps
How people talked about your
Environment
84
Mind maps
Example: main ideas about
environment (Node)
Create a mind map
Go to Explore > Mind Map
Give a name for this Mind Map
Get a new tab called Mind Map Tools
85

Mind Maps
Click Sibling Idea to add ideas:
landscape, water, policy
management, impacts
Also click Child ideas to add
Habitat, water quality, renew
energy, and aquaculture
Based on the idea structure to
create node structure
86
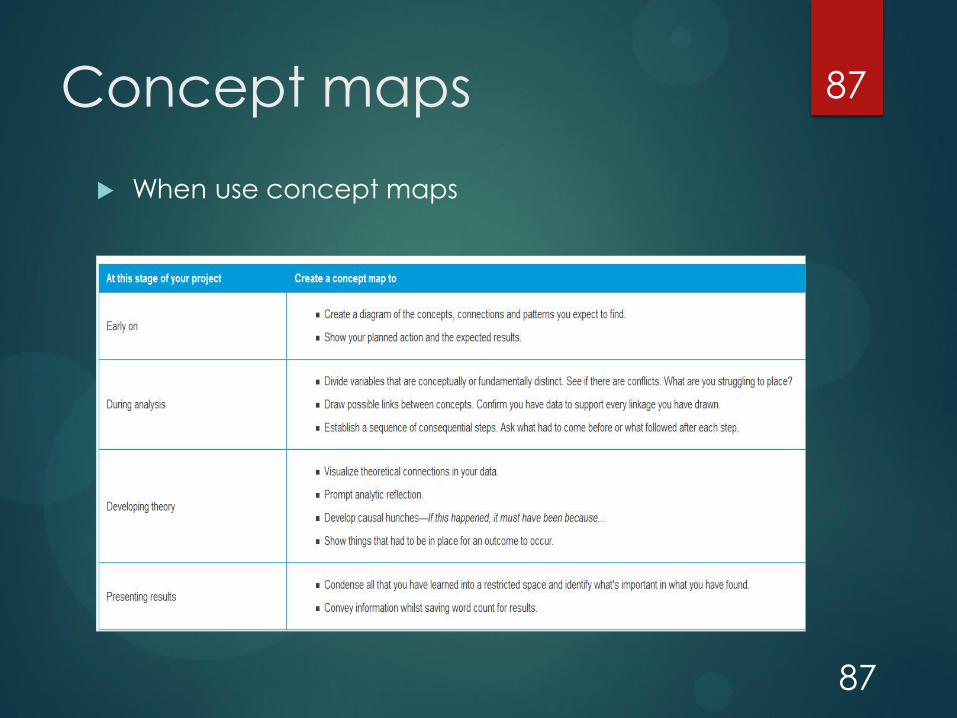
Concept maps
When use concept maps
87
87

Concept maps 88
Structure and relationships

Concept maps
We can use concept maps to
show a proposed theory
The components of this theory
include five nodes: Attitude,
Economy, Environment, Natural
environment, and Sense of
community down east
89

Concept maps
Create a new concept map
Explore > Concept map
90

Concept maps
We can drag five nodes in to the drawing area or
click Add Project Item from Concept Map Tools
91

Concept maps
Export map
Data > Items under Export
group
Item is the map called
Thoery
92

Project maps
93
When use Project maps
93

Project maps
94
94
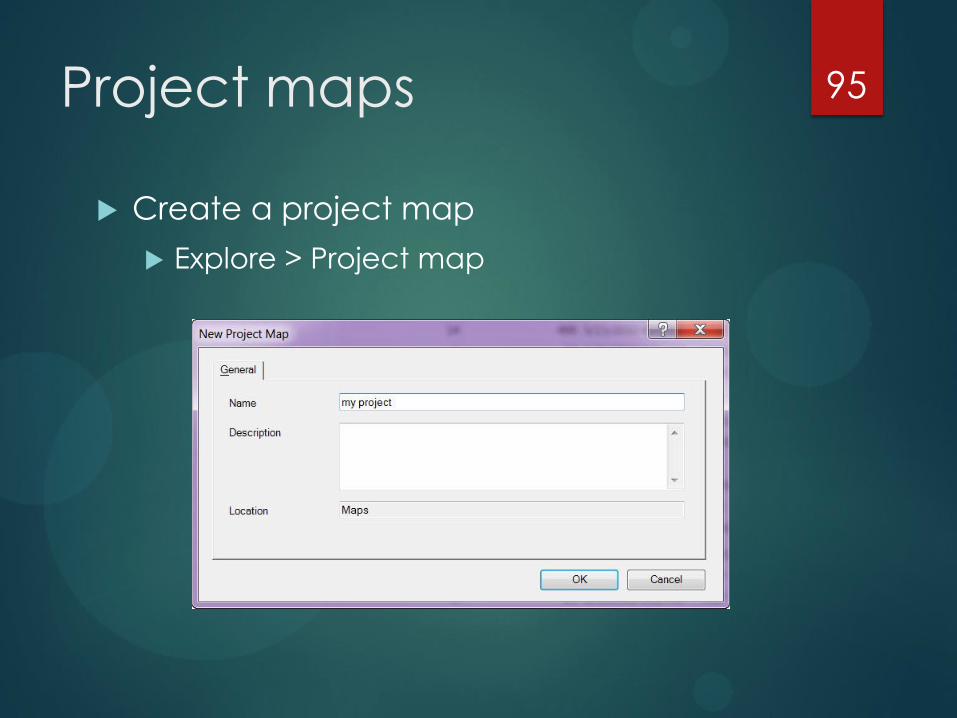
Project maps
Create a project map
Explore > Project map
95

Project maps
Drag project items to the drawing area
96

Charts
Charts for coding, use charts to display:
Coding for a source
Coding by attribute value for a source
Coding for a node
Coding by attribute value for a node
Coding by attribute value for multiple nodes
97

Charts
Example: Coding by attribute
value for a node, we want to
see Natural environment node
by gender
Go to Explore > Chart, choose
Chart Node Coding by
Attribute Value
98
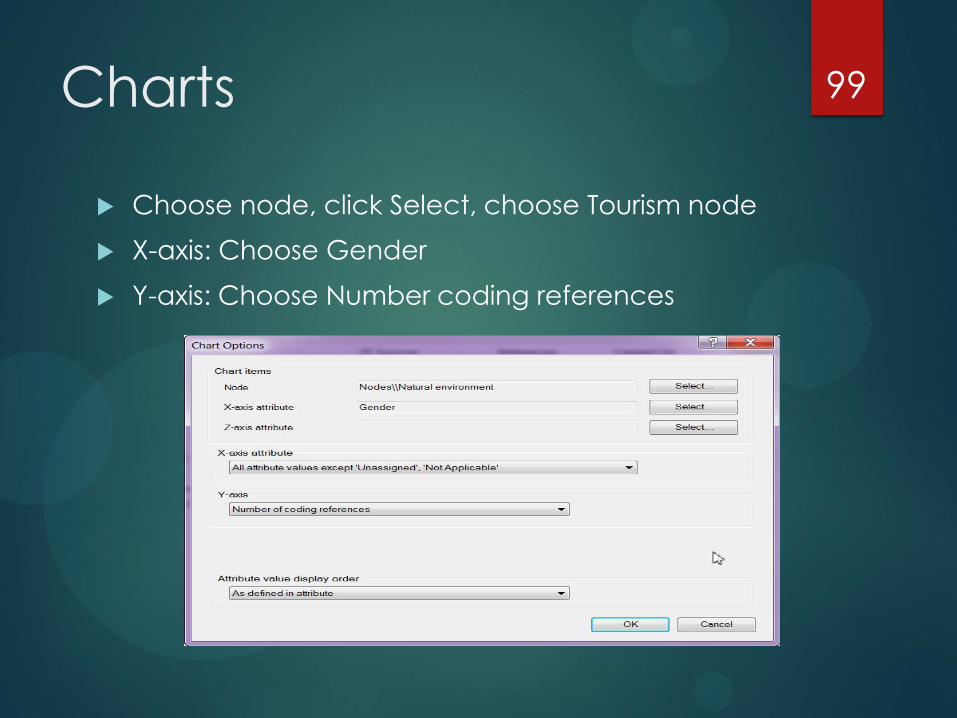
Charts
Choose node, click Select, choose Tourism node
X-axis: Choose Gender
Y-axis: Choose Number coding references
99

Charts 10
0
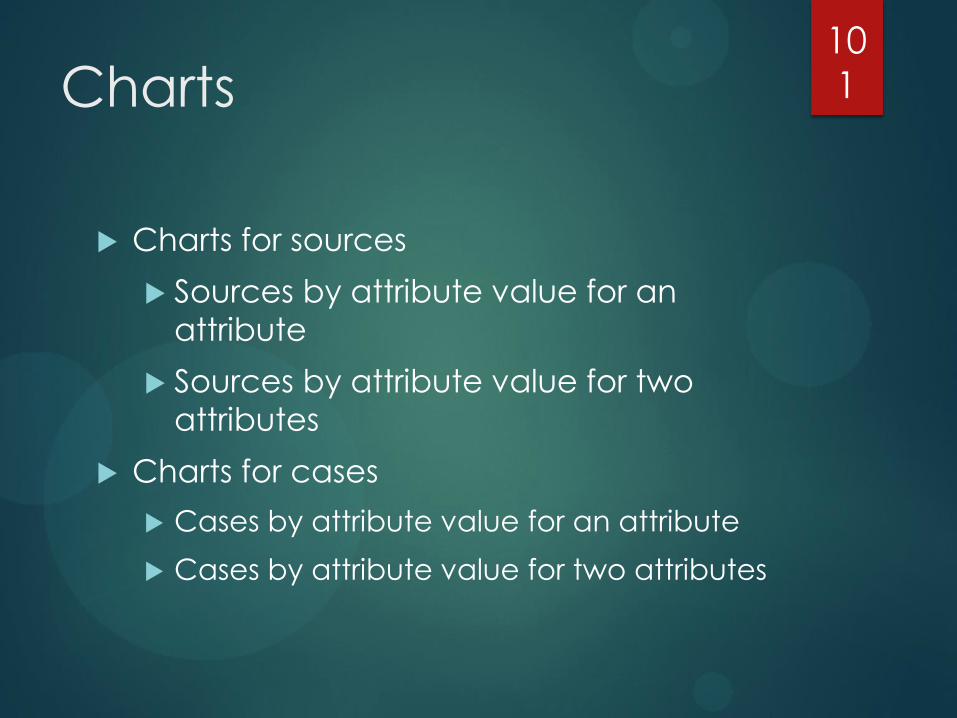
Charts
Charts for sources
Sources by attribute value for an
attribute
Sources by attribute value for two
attributes
Charts for cases
Cases by attribute value for an attribute
Cases by attribute value for two attributes
10
1
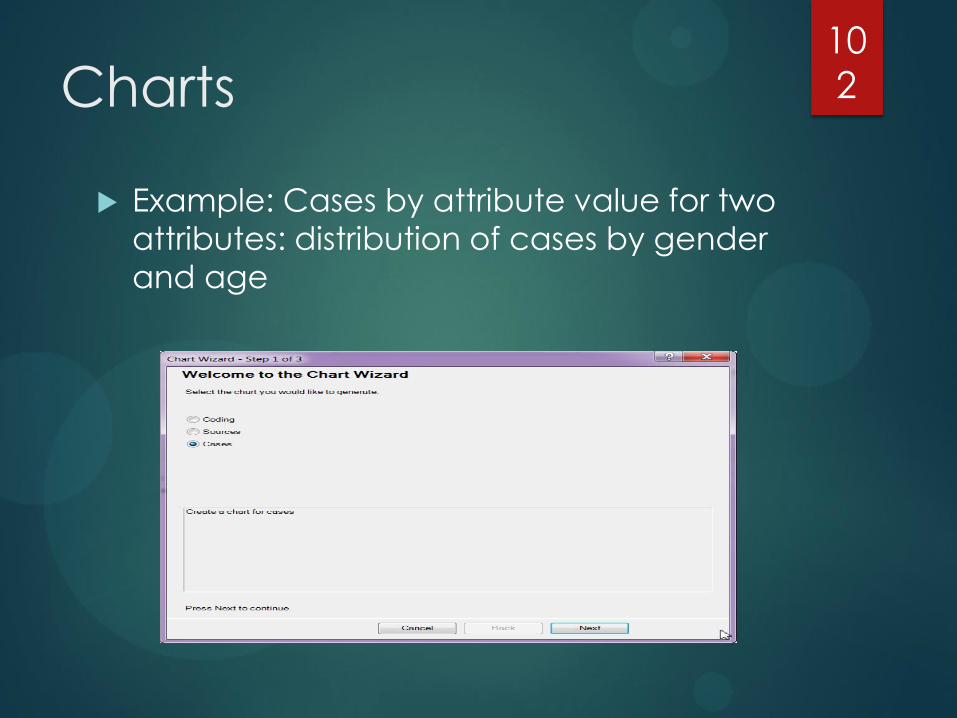
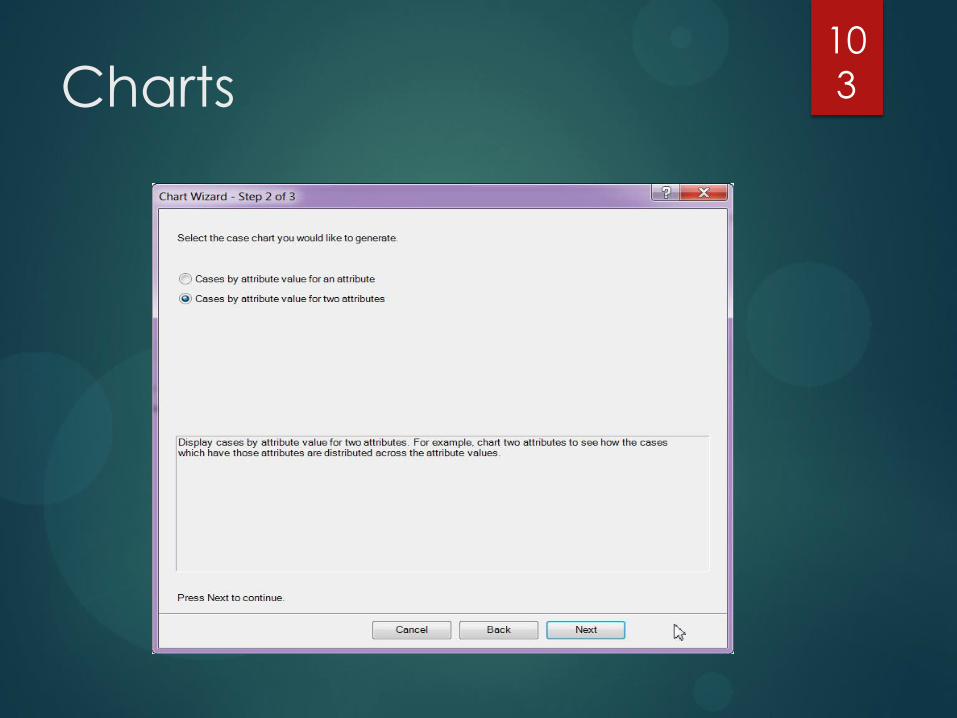
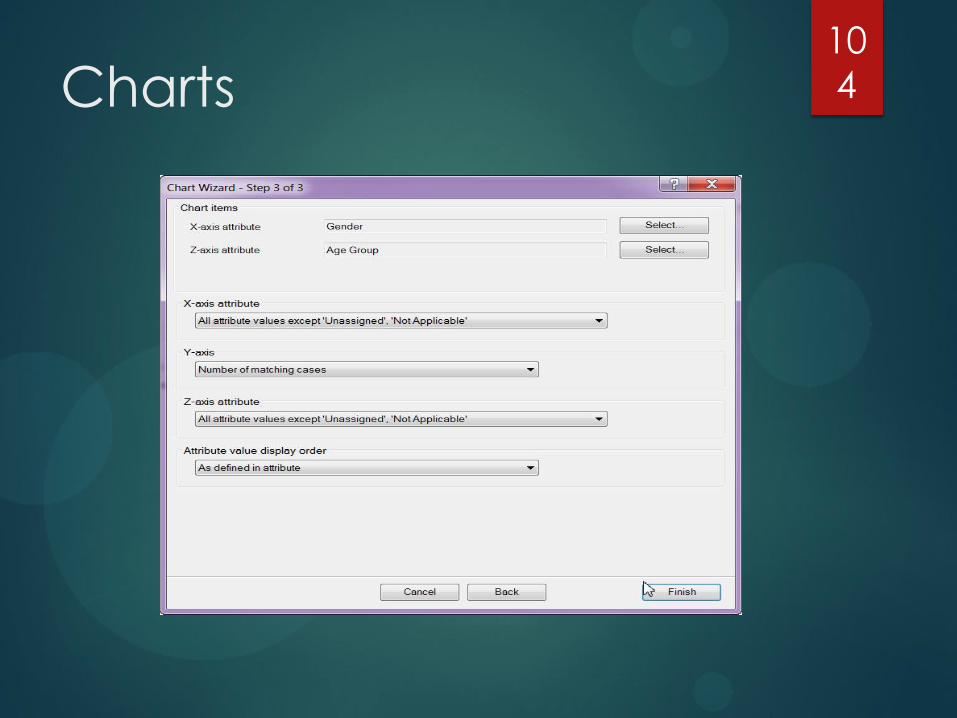
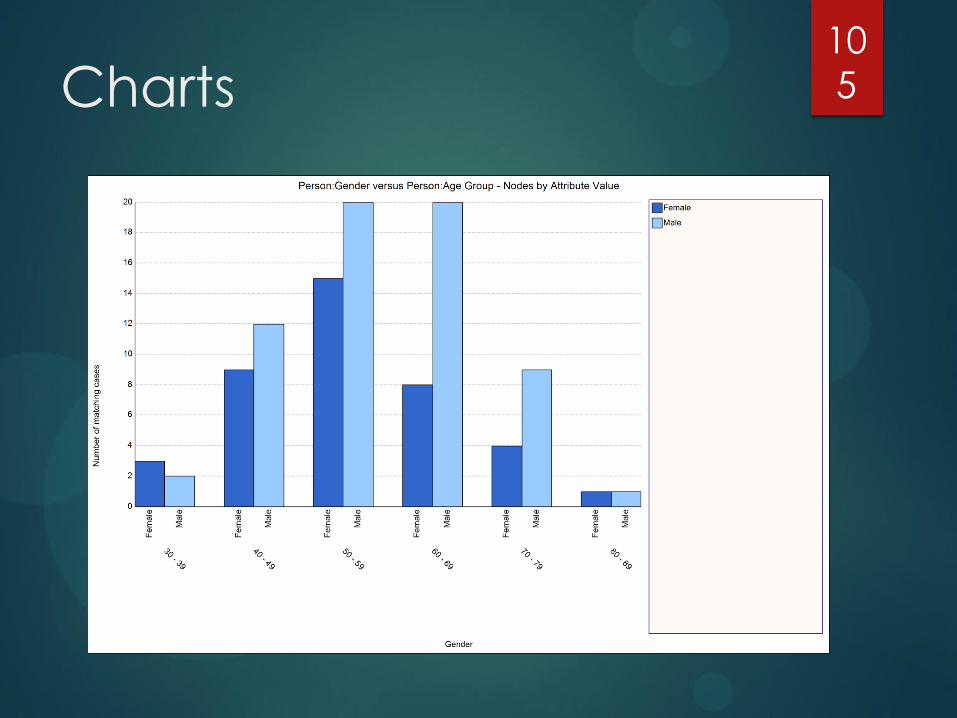
Charts
Example: Cases by attribute value for two
attributes: distribution of cases by gender
and age
10
2
Charts 10
3
Charts 10
4
Charts 10
5

Cluster analysis
“Cluster analysis diagrams
provide a graphical
representation of sources or
nodes to make it easy to see
similarities and differences. “
10
6

Cluster analysis
The similarities and differences
across sources.
The similarities and differences
across nodes.
The demographic spread of
survey respondents based on
attribute value.
10
7

Cluster analysis
Example: how similar is the
coding at negative
attitudes node and
economy node?
Go to Explore > Cluster Analysis
10
8
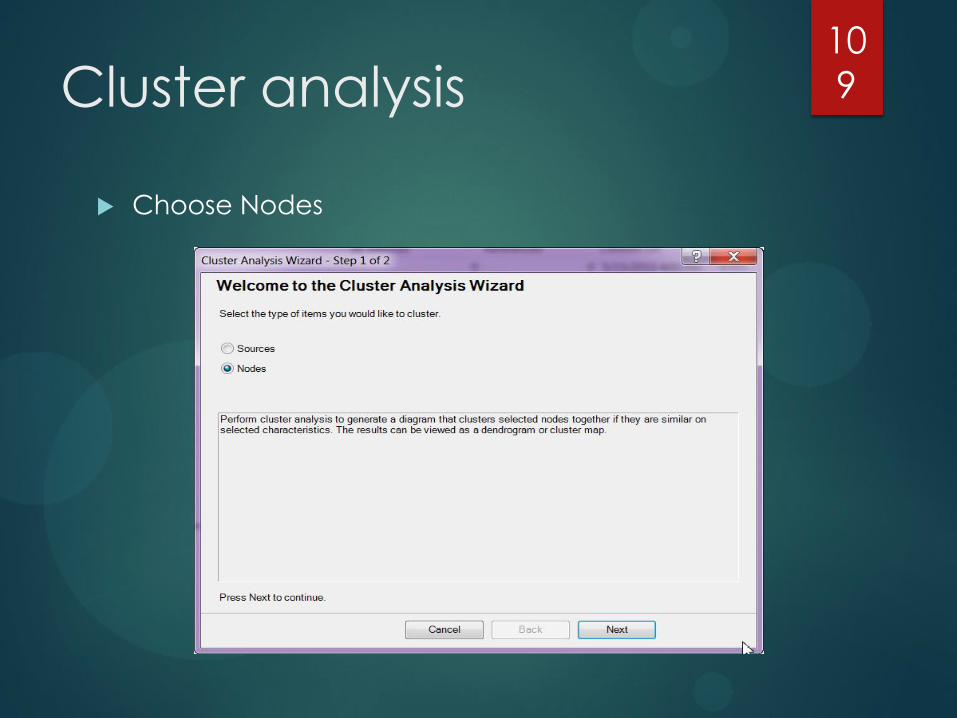
Cluster analysis
Choose Nodes
10
9

Cluster analysis
Select nodes
11
0

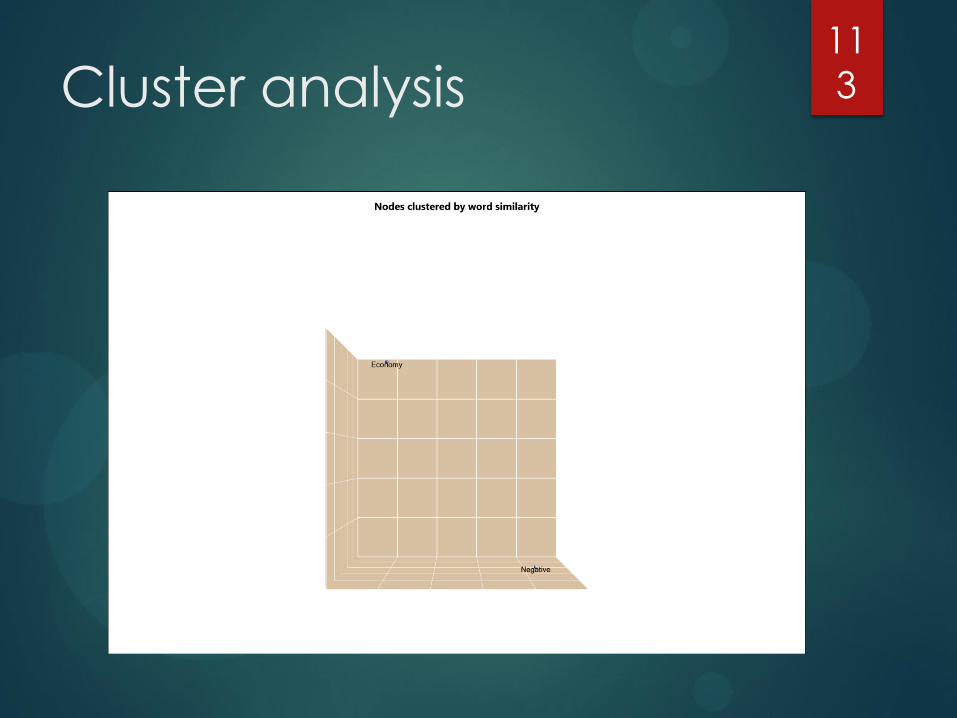
Cluster analysis
We want to look at the word similarity
11
1

Cluster analysis
We get Pearson r
11
2
Cluster analysis 11
3
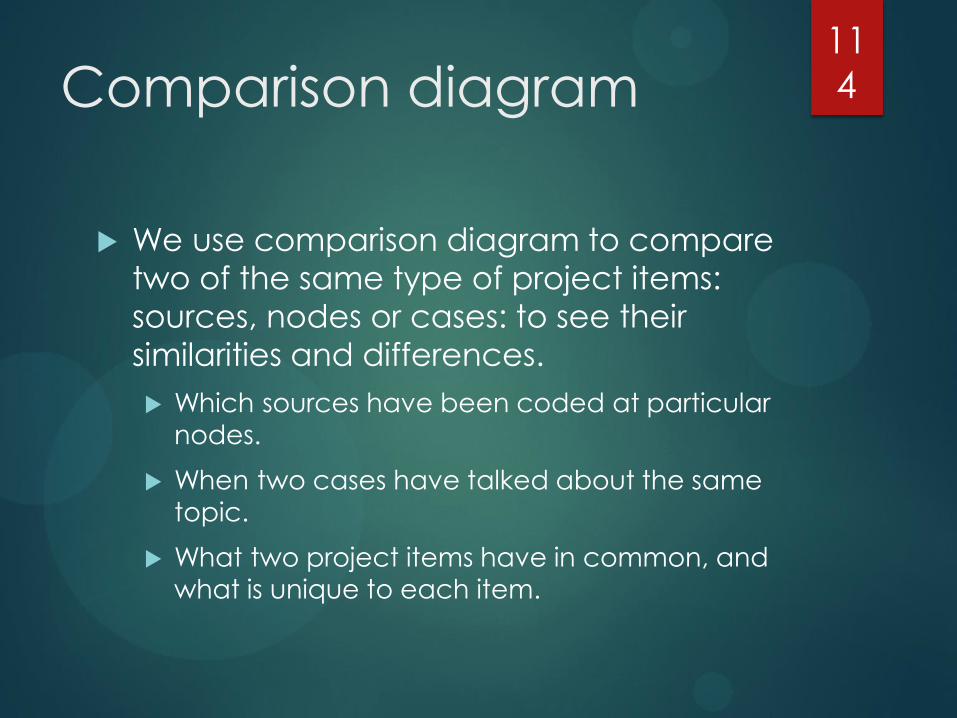
Comparison diagram
We use comparison diagram to compare
two of the same type of project items:
sources, nodes or cases: to see their
similarities and differences.
Which sources have been coded at particular
nodes.
When two cases have talked about the same
topic.
What two project items have in common, and
what is unique to each item.
11
4

Comparison diagram
Example: how Robert and Dorothy
talked about down east?
Go to Explore > Comparison
Diagram > Compare Cases
11
5
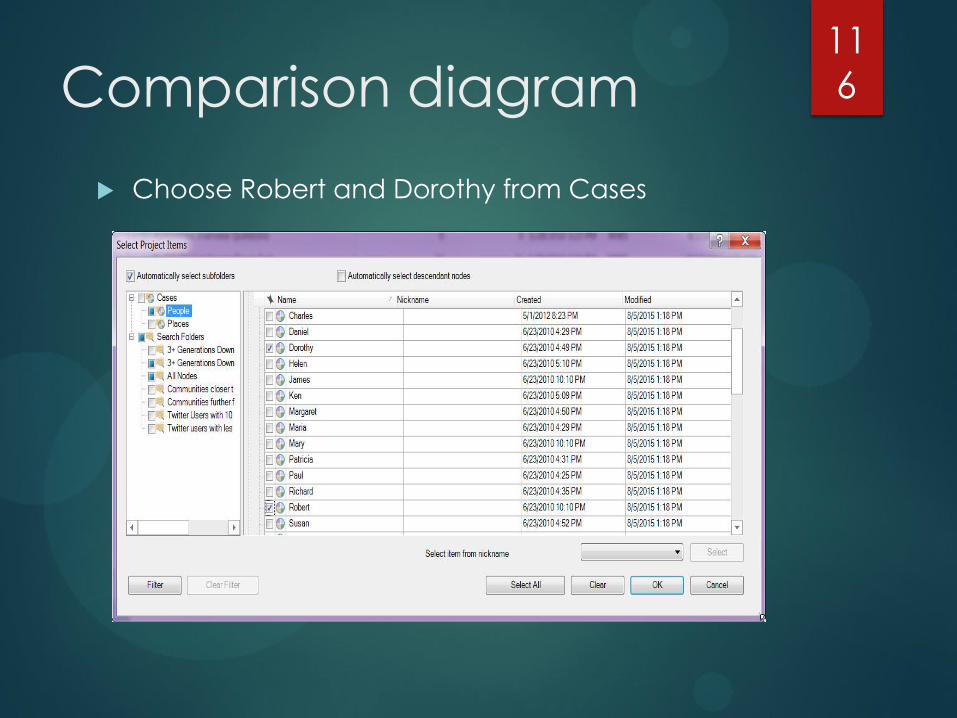
Comparison diagram
Choose Robert and Dorothy from Cases
11
6

Comparison diagram 11
7

Reports
Summary report, we want to run a Node
structure report for from NVivo predefined
reports.
Under reports folder, select a report you
want to run.
Select Node Structure Report
Double click the report or go Explore > Run
Report or right click, then select Run Report
118
11
8
Reports
Reports contain information
about your project that you
can view and print.
11
9

Reports
120
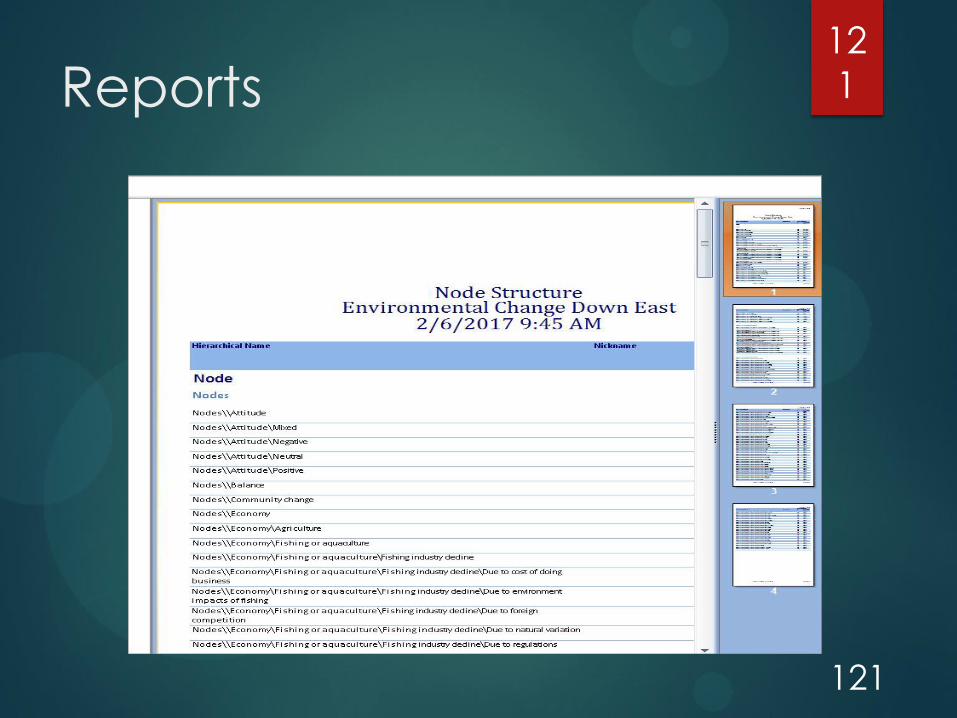
For example: we want to see the
summary of all nodes
12
0
Reports
121
12
1

Reports
Right click the result
window, choose Export
Report Results
It is a word document
122
12
2

123
12
3


