64
Page 1 of 64 NY State of Health: The Official Health Plan Marketplace 2016 Open Enrollment Report August 2016

Page 1 of 64
NY State of Health: The Official Health Plan Marketplace
2016 Open Enrollment Report August 2016
Page 2 of 64
Table of Contents Highlights .......................................................................................................................................... 4 Section 1: Introduction ....................................................................................................................... 8 Section 2: Individual Marketplace ..................................................................................................... 10
Essential Plan .......................................................................................................................................... 10
Income and Financial Assistance for Qualified Health Plan Enrollees .................................................... 12
Medicaid.................................................................................................................................................. 14
Child Health Plus ..................................................................................................................................... 14
Section 3: Marketplace Demographics .............................................................................................. 15 Insurance Status at Time of Application ................................................................................................. 15
Enrollment by Region .............................................................................................................................. 16
Enrollment by Age ................................................................................................................................... 17
Enrollment by Gender ............................................................................................................................. 17
Enrollment by Preferred Language ......................................................................................................... 18
Enrollment by Race and Ethnicity ........................................................................................................... 19
Section 4: Qualified Health Plan Enrollment ...................................................................................... 21 QHP Enrollment by Insurer ..................................................................................................................... 21
EP Enrollment by Insurer ........................................................................................................................ 23
QHP Enrollment by Metal Level .............................................................................................................. 23
Trends in Plan Selection .......................................................................................................................... 25
Stand Alone Dental Plan Enrollment by Insurer ..................................................................................... 26
Section 5: Application and Plan Selection Assistance ......................................................................... 28 Assistors .................................................................................................................................................. 28
Enrollment by Channel ............................................................................................................................ 28
Section 6: Website and Customer Service Center .............................................................................. 29 Section 7: Small Business Marketplace ............................................................................................. 31
Enrollment by Region .............................................................................................................................. 31
Enrollment by Insurer ............................................................................................................................. 32
Enrollment by Metal Level ...................................................................................................................... 33
SHOP Stand Alone Dental Plan Enrollment by Insurer ........................................................................... 33
Section 8: Appendices ...................................................................................................................... 35 Appendix A: Number and Distribution of Enrollees by County and Program ......................................... 35
Appendix B: Changes in County-Level Uninsured Rates, 2013 v. 2015 .................................................. 37

Page 3 of 64
Appendix C: Marketplace Program Participation by Insurer .................................................................. 38
Appendix D: QHP Enrollment by County and Plan .................................................................................. 39
Appendix E: EP Enrollment by County and Plan ..................................................................................... 50
Appendix F: SHOP Enrollment by County and Plan................................................................................. 57
Appendix G: Number of Calls Answered by Language ............................................................................ 64

Page 4 of 64
Highlights The NY State of Health Marketplace has successfully increased the affordability and accessibility of health insurance coverage in New York; enrolled more than 2.8 million New Yorkers into comprehensive, affordable coverage; and has driven the State’s uninsured rate to its lowest point in decades. More than 2.8 million people—about 15 percent of the State’s population—were enrolled in plans through the NY State of Health as of the end of the 2016 open enrollment period on January 31, 2016. That represents a net increase of nearly 700,000 since the second open enrollment period when 2.1 million people enrolled. New York has seen a significant, corresponding reduction in the number of uninsured. Since the Marketplace opened in 2013, the number of uninsured New Yorkers has declined by nearly 850,000. The rate of uninsured declined from 10 percent to 5 percent between 2013 and September 2015, according to data recently released by the Centers for Disease Control and Prevention.1 New York launched a new program, the Essential Plan, in 2016 for lower income individuals and families. The Essential Plan lowers premiums to $20 or less a month and provides comprehensive benefits with no annual deductibles, free preventive care, and low copayments. Like Medicaid and Child Health Plus (CHP), individuals eligible for the Essential Plan can enroll all year round. In 2016, individual premium rates for Qualified Health Plans (QHPs) continue to be nearly 50 percent lower on average than before the establishment of the NY State of Health.2 More than half of QHP enrollees are eligible for financial assistance to help further lower the cost of health plan premiums purchased through the Marketplace. This share is lower than the nearly three-fourths of QHP enrollees who were eligible for coverage with financial assistance in 2015 because many new and returning Marketplace enrollees in 2016 are now eligible for the Essential Plan instead of QHPs
1 CDC/NCHS, National Health Interview Survey, 2015, Family Core component. “Health Insurance Coverage: Early Release of Estimates From the National Health Interview Survey, January–September 2015” http://www.cdc.gov/nchs/data/nhis/earlyrelease/insur201602.pdf 2 New York State Department of Financial Services. “New York State Department of Financial Services Announces 2016 Health Insurance Premium Rates, Including Rates for NY State of Health” (July 2015). http://www.dfs.ny.gov/about/press/pr1507311.htm?_sm_au_=iHV1sq2D2tPSNfJr
NYSOH by the Numbers 2.8 million: The number of New Yorkers with health insurance coverage through NYSOH. 15%: The share of New Yorkers who are covered through NYSOH. 850,000: The reduction in uninsured New Yorkers since NYSOH opened. 13,205: The number of NYSOH enrollment experts helping consumers across the state. 1.8 million: The number of unique visitors to NYSOH’s website. 1.3 million: The number of calls answered by NYSOH customer service center, an average of 102,000 per week, during the 2016 OEP. 3.6 million: The number of times consumers used NYSOH’s anonymous shopping tool during the 2016 OEP. 24: The number of languages in which consumers can access NYSOH’s educational materials. 1.7 million: The number of educational materials distributed during the 2016 OEP. 1,400: The number of NYSOH community outreach events in 2015-2016.

Page 5 of 64
with financial assistance. In total, eighty-one percent of individuals enrolled in QHPs or the Essential Plan are eligible for coverage with financial assistance. In-person assistors continued to play an important role in enrolling New Yorkers into coverage. In 2016, there were more than 13,000 certified enrollment experts: 914 Navigators, 6,383 Certified Application Counselors, and 5,908 brokers. Of the individuals enrolled in the Marketplace as of the close of the 2016 open enrollment period, nearly three-fourths (74 percent) enrolled with the help of an assistor. These percentages include all types of assistors including navigators, certified application counselors and insurance agents and brokers. Seventeen percent of consumers enrolled without assistance through the Marketplace website. Finally, 9 percent of consumers enrolled over the phone with the assistance of the Marketplace Customer Service Center. Overall, the NYSOH website experienced very high volumes of website traffic, with 1.8 million unique visitors during the 2016 open enrollment period. Despite these volumes, the website has operated at or above expectations, with an average system response time of 2.4 seconds for each web page. The NY State of Health’s Customer Service Center supports the Marketplace in a variety of ways, including operating the Marketplace’s toll-free customer service helplines, assisting consumers in completing phone applications, performing back-end administrative and consumer support functions, and managing the Marketplace’s social media channels. During the three month 2016 open enrollment period, the Customer Service Center answered more than 1.3 million calls, with an average weekly call volume of 102,000 and a peak volume of over 112,000 calls in December during the final days individuals could sign-up for coverage. New Yorkers continue to have a broad choice of health plan options through the marketplace in every county of the state. Statewide, fifteen health insurers offer health plan coverage to individuals and eight health insurers also offer plans to small businesses; thirteen health insurers offer coverage to Essential Plan enrollees through the Marketplace, eighteen health insurers offer Medicaid and fifteen offer CHP coverage. Eleven health insurers participate in QHPs, Essential Plan, Medicaid, and CHP, which allows for continuity of coverage when family members are eligible for different programs and/or individuals’ program eligibility changes over time. Since its inception, the Marketplace has required insurers to offer a standard plan at each metal level (Platinum, Gold, Silver, and Bronze) in every county of its Marketplace service area. A strategy that has gained popularity among Marketplaces across the country, standard plans allow consumers to more easily compare plan options from insurer to insurer because they cover the same services and have the same cost-sharing at a given metal level regardless of insurer. Realizing that consumers may want additional choices, the Marketplace also permits insurers to offer “non-standard” plans that may cover additional services such as adult dental and vision care. Similar to 2015, the majority of Marketplace enrollees (63 percent) have enrolled in standard plans in 2016, and a consistent share of individuals (37 percent) opted in 2016 for non-standard plans that included coverage for additional benefits and/or a modified cost sharing design. NY State of Health continued to make available this year the plan preview, or anonymous shopping tool, which allows individuals to shop for a health plan and get a personalized premium estimate before starting an application. Over 3.6 million people used this tool during the third open enrollment period.

Page 6 of 64
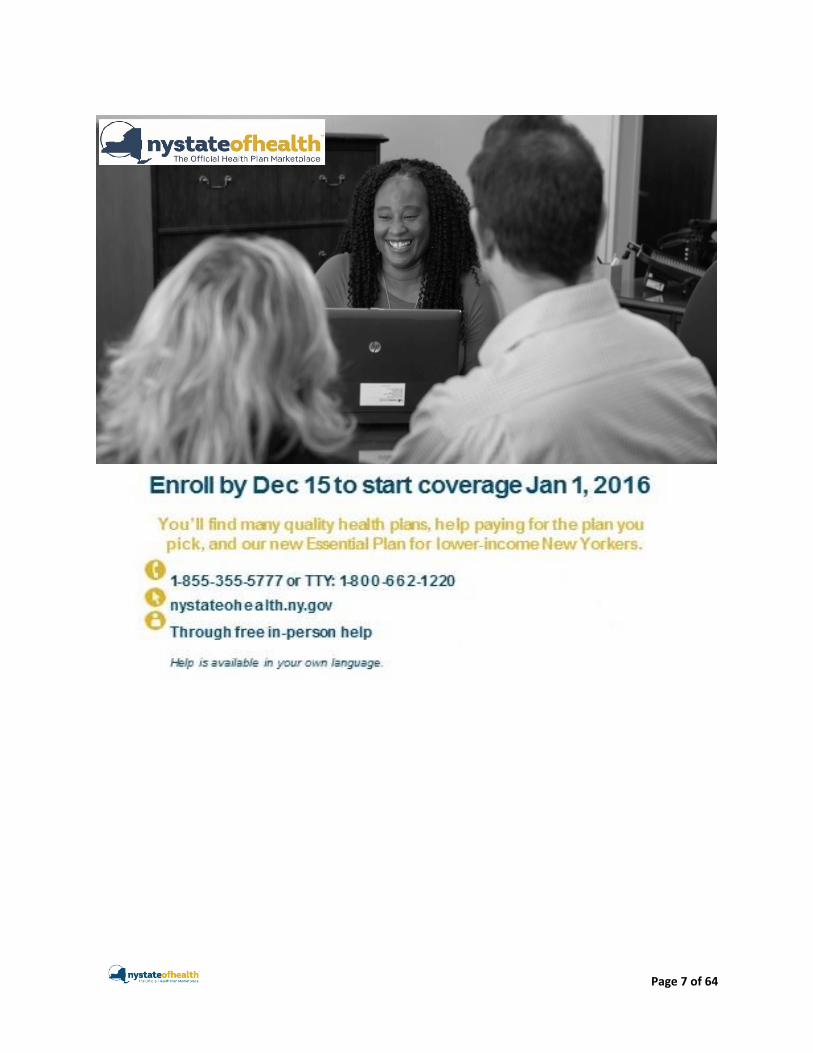
In 2016, NY State of Health further increased efforts to reach non-English speakers across the state. Consumer education materials are available in 24 languages (including English), including five additional languages that were not available last year. To help educate consumers, a video introducing the new Essential Plan (shown on the right) for lower income individuals and families was added to the series of brief informational videos on subjects such as young adult coverage, renewing coverage, the value of health insurance, and a Super Bowl-themed video that illustrated the costs of being uninsured. Videos in English and Spanish have been collectively viewed 1.4 million times. During the 2016 open enrollment period, NY State of Health also distributed over 1.7 million pieces of educational materials through various outreach efforts with community partners and at events. The Marketplace sponsored a comprehensive state-wide advertising campaign across TV, radio, print, digital, social media, and out-of-home media. In 2016, ads featured NY State of Health in-person assistors who shared their stories of how they help New Yorkers get affordable coverage. Another set of ads were created highlighting the theme of “You’d be surprised how easy it is to get a good, low-cost health plan”. Ads were run in English, Spanish, and Chinese and in an expanded number of ethnic community publications in order to reach a diverse range of eligible New Yorkers. The Marketplace also reached consumers through direct emails with important reminders about the steps needed to renew coverage and enrollment deadlines; to introduce the new Essential Plan to those who, based on information provided to NY State of Health, meet the income eligibility criteria; and to encourage individuals who started but did not yet complete an application to come back to the Marketplace to choose a health plan and enroll. During the 2016 open enrollment period, the Marketplace sent 2.4 million emails to consumers. In addition, NY State of Health representatives participated in over 1,400 events throughout the year to provide information and enrollment assistance to consumers at venues such as public libraries, pharmacies, fairs and festivals, grocery stores, and farmers markets. Lastly, a “Sign-Up NY” mall tour was launched on the weekend of November 20th and continued through the end of the open enrollment period at 8 different shopping center locations across the State. This tour included a partnership with Marvel™ superheroes as a fun way to attract consumers to the NY State of Health booth where they could learn about Marketplace coverage, ask questions of an in-person assistor, and enroll into coverage on site.
Page 7 of 64

Page 8 of 64
Section1: Introduction The NY State of Health Marketplace has successfully increased the affordability and accessibility of health insurance coverage in New York; enrolled more than 2.8 million New Yorkers into comprehensive, affordable coverage; and has driven the State’s uninsured rate to its lowest point in decades. More than 2.8 million people—about 15 percent of the state’s population—were enrolled in plans through the NY State of Health as of the end of the 2016 open enrollment period on January 31, 2016. That represents a net increase of nearly 700,000 since the second open enrollment period when 2.1 million people enrolled. New York has seen a significant, corresponding reduction in the number of uninsured. Since the Marketplace opened in 2013, the number of uninsured New Yorkers has declined by nearly 850,000. The rate of uninsured declined from 10 percent to 5 percent between 2013 and September 2015, according to data recently released by the Centers for Disease Control and Prevention (CDC).3 The same CDC release estimates that New York’s uninsured rate for children is 2.2 percent, as of September 2015. In addition, an analysis of 2014 Census data by Georgetown University’s Health Policy Institute found that New York has by far, the lowest rate of uninsured for Hispanic children (3.8 percent) among states with the largest overall populations of Hispanic children.4 New York launched a new program, the Essential Plan, in 2016 for lower income individuals and families. The Essential Plan lowers premiums to $20 or less a month and provides comprehensive benefits with no annual deductibles, free preventive care, and low copayments. Like Medicaid and Child Health Plus (CHP), individuals eligible for the Essential Plan can enroll all year round. As of January 31, 2016, nearly 98 percent of individuals determined to be eligible for the Essential Plan were enrolled in coverage, and combined with new and returning Qualified Health Plans (QHP) enrollees, the Marketplace continues to meet or exceed its enrollment goals. As an integrated insurance Marketplace, NY State of Health provides one-stop shopping, enabling New Yorkers to enroll in the full spectrum of health coverage: Medicaid and Child Health Plus (CHP), subsidized and unsubsidized private coverage through the Essential Plan and Qualified Health Plans (QHP), and private QHP health plans available to small employers and employees through the Small Business Marketplace. NY State of Health offers New Yorkers a choice of health plans in every county of the State in every program. Statewide, fifteen health insurers offer QHP coverage to individuals and eight health insurers also offer plans to small businesses, thirteen offer Essential Plan coverage, eighteen offer Medicaid, and fifteen offer CHP. Eleven insurers participate in all Marketplace programs: QHP, Essential Plan, Medicaid and CHP. The Essential Plan, New York’s brand-name for the Basic Health Plan, a state option under the Affordable Care Act, has provided New York’s Marketplace with a unique opportunity—offer consumers
3 CDC/NCHS, National Health Interview Survey, 2015, Family Core component. “Health Insurance Coverage: Early Release of Estimates From the National Health Interview Survey, January–September 2015” http://www.cdc.gov/nchs/data/nhis/earlyrelease/insur201602.pdf 4 Center for Children and Families, Georgetown University Health Policy Institute. “Historic Gains in Health Coverage for Hispanic Children in the Affordable Care Act’s First Year.” http://ccf.georgetown.edu/wp-content/uploads/2016/01/CCF-NCLR-Uninsured-Hispanic-Kids-Report-Final-Jan-14-2016.pdf

Page 9 of 64
the same or better benefits at a lower cost or no cost, and at the same time realize savings for state taxpayers. Starting on January 1, 2016, consumers who would have previously been eligible for a QHP were instead enrolled in the Essential Plan where they received the same benefits as they otherwise would have, but with no annual deductible, lower copayments and a premium of either $20 per person per month or nothing depending on their income. The average consumer will save over $1,100 a year compared with QHP coverage. At the same time, implementation of the Essential Plan allowed New York to enroll most lawfully present non-citizens with incomes at or below 138 percent of FPL who were previously enrolled in state-funded Medicaid into the Essential Plan with federal financial participation. The consumers receive the same type of benefits as they did under the state funded Medicaid program, but rather than receiving no federal funding, the state receives 95 percent of the federal tax and cost sharing credits that these individuals would have received had they enrolled in a QHP to provide coverage. This change results in an estimated state savings exceeding $1 billion for taxpayers in state fiscal year 2015-16 by leveraging federal subsidies for legally residing immigrants, who were previously 100 percent state funded. In 2016, individual premium rates for qualified health plans continue to be 50 percent lower on average than before the establishment of the NY State of Health.5 And, even with the implementation of the Essential Plan for lower income New Yorkers, more than half of qualified health plan enrollees are eligible for financial assistance to help further lower the cost of health plan premiums purchased through the Marketplace. In 2016, NY State of Health further increased efforts to reach non-English speakers across the state. Consumer education materials are available in 24 languages (including English), including five additional languages that were not available last year. To help educate consumers, a video introducing the new Essential Plan for lower income individuals and families was added to the series of informational videos on subjects such as young adult coverage, renewing coverage, the value of health insurance, and a Super Bowl-themed video that illustrated the costs of being uninsured. Videos in English and Spanish have been collectively viewed over 1.4 million times. During the 2016 open enrollment period, NY State of Health also distributed over 1.7 million pieces of educational materials through various outreach efforts with community partners and at events. These tools complemented the work of New York’s Customer Service Center and more than 13,000 certified enrollment experts, who are available to provide in-person assistance in communities across the State. This report provides detailed information about the consumers who enrolled in coverage through the NY State of Health’s Individual Marketplace and Small Business Marketplace through January 31, 2016, the close of the third open enrollment period. As an integrated Marketplace that includes QHPs, Essential Plan, Child Health Plus, and Medicaid, where appropriate, this report presents data for the Marketplace as a whole, as well as for specific programs. In several places, we compare data at the end of the 2016 open enrollment period to data at the end of the 2015 enrollment period.
5 New York State Department of Financial Services. “New York State Department of Financial Services Announces 2016 Health Insurance Premium Rates, Including Rates for NY State of Health” (July 2015). http://www.dfs.ny.gov/about/press/pr1507311.htm?_sm_au_=iHV1sq2D2tPSNfJr

Page 10 of 64
Section 2: Individual Marketplace As of January 31, 2016, 2,833,823 New Yorkers enrolled in coverage through the NY State of Health’s Individual Marketplace. This includes 271,964 people enrolled in Qualified Health Plans (QHP), with and without financial assistance, 379,559 in the Essential Plan (EP), 1,966,920 people enrolled in Medicaid, and 215,380 enrolled in Child Health Plus (CHP). This report offers a snapshot of these more than 2.8 million people who were enrolled as of January 31, 2016.
The Essential Plan Under the Affordable Care Act, States have the option of implementing a Basic Health Program (BHP) for lower-income populations. Two groups of individuals are eligible for the BHP. First, individuals under age 65 with household incomes of 0-138 percent of FPL who are lawfully present in the United States, but do not qualify for Federal Medicaid because they have been legal residents for less than five years. Second, individuals under age 65 with household incomes between 138 and 200 percent of the federal poverty level (FPL), who would have otherwise been eligible for a QHP with financial assistance. As of January 2016, New York is one of only two states nationwide to receive federal approval under the Affordable Care Act to offer a BHP. In New York, the BHP has been branded the Essential Plan (EP). EP offers qualified individuals and families a choice of plans from high-quality, private health insurers through the NY State of Health Marketplace. As part of the Marketplace 2016 Health Insurer Invitation, all licensed New York State health insurers were invited to apply for certification to offer the EP in 2016. Consistent with the QHP certification process, all insurers that met the EP certification requirements were certified to offer EP in 2016.6 All plans available under the EP cover essential health benefits, including inpatient and outpatient care, physician services, diagnostic services and prescription drugs among others, with no annual deductible and low out-of-pocket costs. Consumers with incomes at or below 150 percent of FPL ($17,655 for a household of one; $36,375 for a household of four) have no monthly premium. Those with slightly higher incomes at greater than 150 percent to 200 percent of FPL ($23,540 for a household of one; $48,500 for a household of four) have a low monthly premium of $20.
6 New York State of Health. “Invitation and Requirements for Insurer Certification and Recertification for Participation in 2016” (April 17, 2015). http://info.nystateofhealth.ny.gov/sites/default/files/2016%20Invitation%20to%20Participate%20in%20NYSOH.pdf
The Essential Plan by the Numbers 379,559: The number of New Yorkers enrolled in the Essential Plan (EP) as of January 2016. $20 or $0: The monthly cost of enrolling in the new EP. $1,100: The average amount enrollees save annually by being enrolled in EP instead of QHPs. 98%: The share of individuals determined eligible for EP who enroll in coverage.

Page 11 of 64
Figure 1: EP Enrollees, by income
FPL % Enrollees in EP
N = 379,559
≤138% 40%
>138- ≤150% 12%
>150 - ≤200% 47%
TOTAL 100%
As expected, the markedly lower premiums and cost sharing in EP relative to QHP – the average consumer saves over $1,100 compared with QHP coverage – has resulted in high enrollment levels. Indeed, the Marketplace has enrolled a higher share of enrollees with income 150-200 percent of FPL in 2016 compared to 2015 (see figure below). Furthermore, the enrollment rate among individuals determined to be eligible for EP is 98 percent compared with 58 and 91 percent for consumers determined eligible for QHP and CHP. (All individuals determined eligible for Medicaid are automatically covered by fee-for-service the month they receive their determination, effectively a 100 percent enrollment rate among individuals who are determined to be eligible).
Figure 2: Comparison of Marketplace Enrollment by Income, 2015-2016
New and Returning Enrollees 2016 Marketplace enrollment is composed of individuals who are new to the Marketplace in 2016, and individuals who were enrolled in coverage through the Marketplace at some point in 2014 or 2015 and return to the Marketplace in 2016, referred to as re-enrollees or returning enrollees. Across QHP, EP, and CHP, approximately 20 percent of enrollees are new to the Marketplace and 80 percent are returning enrollees. A smaller number of Medicaid enrollees (11 percent) are new to Marketplace in 2016. Starting in mid-October 2015 and ending in mid-November, renewal notices were sent electronically or by mail to QHP households that were enrolled in NY State of Health as of October 1, 2015. QHP enrollees whose program eligibility was unchanged from the previous year and who did not want to change their insurer in 2016, did not have to take any action to remain covered in 2016. Those QHP enrollees who were determined to be eligible for EP at renewal were enrolled into the EP plan offered
13%
48%
19%
11%
9%
2016 Total QHP + EP Enrollment
13%
41%23%
12%
11%
2015 QHP Enrollment w/ Financial Assistance
>138≤150%
>150 - ≤200%
>200 - ≤250%
>250 - ≤300%
>300 - ≤400%

Page 12 of 64
by their current health insurance company, if one was available. If their 2015 insurer did not offer the EP, consumers were asked to choose a new health insurer for their 2016 EP coverage. Enrollees were only required to take action to renew coverage if their household information or eligibility information could not be confirmed with State and Federal data sources, or if they wanted to make a change in their health plan or level of coverage. Medicaid and CHP enrollment is year-round, so renewal occurs throughout the year aligned with enrollees’ twelve month recertification date. Financial Assistance for QHP Enrollees More than half (54 percent) of QHP enrollees receive financial assistance to lower the cost of their coverage. This is a lower share than in past years because with the introduction of the Essential Plan in 2016, a portion of lower income New Yorkers who previously would have enrolled in a QHP with financial assistance were instead eligible for the EP. Enrollment in a QHP with financial assistance remained available for individuals who earn too much to be eligible for EP, but have a household income at or below 400 percent of FPL (approximately $47,080 for an individual and $97,000 for a family of 4), and do not have access to other affordable health insurance that meets minimum standards. This assistance is available in two forms:
1) Premium tax credits that reduce the cost of premiums for single adults earning less than $47,080 and for families of four earning less than $97,000; and/or
2) Cost-sharing reductions that lower co-payments, deductibles, and maximum out-of-pocket costs for single adults earning between $23,540 and $29,425, and for families of four earning between $48,500 and $60,525.
Adults with incomes above 400 percent of FPL, or who have access to other health insurance can still enroll in QHP coverage at full cost. Children in households with incomes above 400 percent of FPL can enroll in either a QHP or Child Health Plus at full premium. Among the fifty-four percent of people enrolled in QHPs through NY State of Health who are receiving financial assistance as of January 31, 2016, 27 percent are eligible for both premium tax credits and cost-sharing reductions and 27 percent are eligible only for premium tax credits. The remaining 46 percent of QHP enrollees are enrolled in Full Cost QHPs. As expected with the introduction of the EP, the composition of QHP enrollees has changed in 2016 relative to 2015. In 2015, 57 percent of enrollees were APTC+CSR, 17 percent were APTC only, and 26 percent were full-pay.
QHP Enrollment by the Numbers 271,964: The number of New Yorkers enrolled in Qualified Health Plans (QHP) as of January 2016. 20%: The share of QHP enrollees that were new to the Marketplace in 2016. 54%: The share of QHP enrollees who receive financial assistance. $170: The average monthly premium tax credit available to eligible QHP enrollees.

Page 13 of 64
Figure 3: Qualified Health Plan Enrollment by Financial Assistance Status
In 2016, the average monthly Advance Premium Tax Credit (APTC) available for those who qualified for financial assistance is $170 per month, down from $220 at the end of the previous open enrollment period. This reduction is again due to individuals with incomes between 138 and 200 percent of FPL being enrolled in EP instead of in QHPs with APTC as they were in 2014 and 2015. Together, the 147,406 New Yorkers enrolled in QHPs with financial assistance would access an estimated $300 million in annualized tax credits. QHP Enrollees by Income Eligibility for financial assistance available through the Marketplace is based on household income.7 Looking only at enrollees in subsidized QHPs, the distribution of enrollment is: nearly half (49 percent) have incomes below 250 percent of the Federal Poverty Level (FPL) making them eligible for both Advance Premium Tax Credits (APTC) and Cost Sharing Reductions (CSR), more than one fourth (27 percent) have household incomes between 250 and 300 percent of FPL, and the remaining 24 percent have incomes between 300 and 400 percent of FPL. Figure 4: Subsidized QHP Enrollees, by Income
FPL
Total Enrollees in QHP with Financial Assistance
(n= 147,406)
≤250% 49%
>250 - ≤300% 27%
>300 - ≤400% 24%
TOTAL 100%
7 The Marketplace collects income data only when applicants indicate that they would like to be considered for financial assistance. The income data, therefore, only represents individuals both applied and enrolled in subsidized QHPs and EP.
QHP with APTC + CSR, 27%
QHP with APTC only, 27%
Full Pay QHP, 46%
Total QHP Enrollment:
271,964

Page 14 of 64
Medicaid Through January 31, 2016, 1,966,920 individuals enrolled in Medicaid through NY State of Health. 8 This includes 1,743,805 enrollees who renewed 2015 coverage and 223,115 enrollees who are new to the Marketplace during the 2016 Open Enrollment Period.9 A lower share of Marketplace Medicaid enrollees are new to the Marketplace (11 percent) compared with QHP and EP enrollees. Through the Affordable Care Act, New York expanded Medicaid eligibility levels to 138 percent of FPL to all eligible adults. Since New York’s eligibility levels already largely met this new federal standard prior to the Affordable Care Act, this expansion affects single and childless adults whose eligibility had previously been set at less than or equal to 100 percent of FPL. Approximately nine percent of Medicaid enrollees are part of the expansion population, consistent with 2015. Child Health Plus Through January 31, 2016, 215,380 children enrolled in Child Health Plus (CHP) through the NY State of Health, including 46,479 enrollees (22 percent) who are new to the Marketplace during the 2016 Open Enrollment Period.10 Children up to age 19 in households with incomes up to 400 percent of FPL can enroll in subsidized insurance through CHP. CHP eligibility begins where Medicaid eligibility ends (223 percent of FPL for children under 1 and 154 percent of FPL for children over 1). There is no CHP premium for children in households with incomes below 160 percent of FPL, and a sliding scale premium for those in households with incomes between 160 and 400 percent of FPL. Households with incomes above 400 percent of FPL have the option to purchase CHP or QHP coverage at full premium. Ninety-six percent of children enrolled in CHP through the Marketplace are enrolled with no premium or sliding scale premiums, and 4 percent are enrolled with full premiums.
8 The data here reflect only Medicaid enrollment through the Marketplace. As of January 1, 2014, new applications for the MAGI Medicaid population were centralized through the Marketplace. Local District Social Services offices continue to renew Medicaid enrollees who previously enrolled outside the Marketplace and take new applications from non-MAGI populations. 9 The 223,115 new Medicaid enrollees may include some individuals who are not new to the Medicaid program, but are new to the Marketplace. 10 As of January 1, 2014, new applications for Child Health Plus were centralized through the Marketplace.

Page 15 of 64
Section 3: Marketplace Demographics Insurance Status at Time of Application At the end of the 2016 open enrollment period, ninety-two percent (92 percent) of those who enrolled through the Marketplace reported that they did not have health insurance at the time they applied.11 Medicaid, CHP, and EP enrollees were the most likely to report being uninsured, at 96 percent, 91 percent, and 95 percent respectively. Among QHP enrollees, 57 percent report being uninsured at the time of application.12 These data correspond with changes in the statewide uninsured rate, which is about half of what it was compared to before the Marketplace opened. Overall, compared to the end of the 2015 open enrollment period, a slightly higher share of consumers report not having insurance prior to enrollment though the Marketplace, 92 percent versus 89 percent. The share of enrollees who were uninsured at the time of application is higher for Medicaid and CHP enrollees at the end of the 2016 enrollment period compared to the end of the 2015 enrollment period, but lower for QHP. The lower uninsured rate among QHP enrollees in 2016 is likely due to individuals with incomes between 138 and 200 percent of FPL enrolling in EP instead of in QHPs with APTC as they were in 2014 and 2015, and because the overall pool of uninsured individuals statewide that QHPs draw enrollment from has declined since the Marketplace opened in 2013. Figure 5: Uninsured at Time of Application
Program Type % of Uninsured Enrollees
Medicaid 96%
CHP 91%
EP 95%
QHP* 57%
Total 92% *Does not include full-pay QHP enrollees that did not apply for financial assistance.
11 To assess eligibility for certain types of financial assistance, the Marketplace asks consumers if they are currently enrolled in coverage. In the application process, the Marketplace also determines if consumers are currently enrolled in public minimum essential coverage (MEC), such as Medicare. Consumers who were not enrolled in public MEC and report that they were uninsured at the time of application through the Marketplace are counted as uninsured. Consumers’ insurance status at the time of application is based on the first time they applied for coverage in the Marketplace 12 This QHP figure includes 77 percent of subsidized QHP enrollees who were uninsured at the time of application, as well as the 33 percent of full pay QHP enrollees that applied for but were determined ineligible for financial assistance, and were uninsured at the time of application.
NYSOH Demographics by the Numbers 92%: The share of Marketplace enrollees who report being uninsured at the time of application.
57%: The share of Marketplace enrollees who live in New York City.
61%: The share of Marketplace enrollees age 34 or younger.
20%: The share of Marketplace enrollees who indicated a language other than English as their preferred language.
15%: The share of marketplace enrollees who reported that they are Black/African American.
25%: The share of marketplace enrollees who reported that they are Hispanic.
100%: The share of NYS counties where the uninsured rate declined between 2013 and 2015.
Page 16 of 64
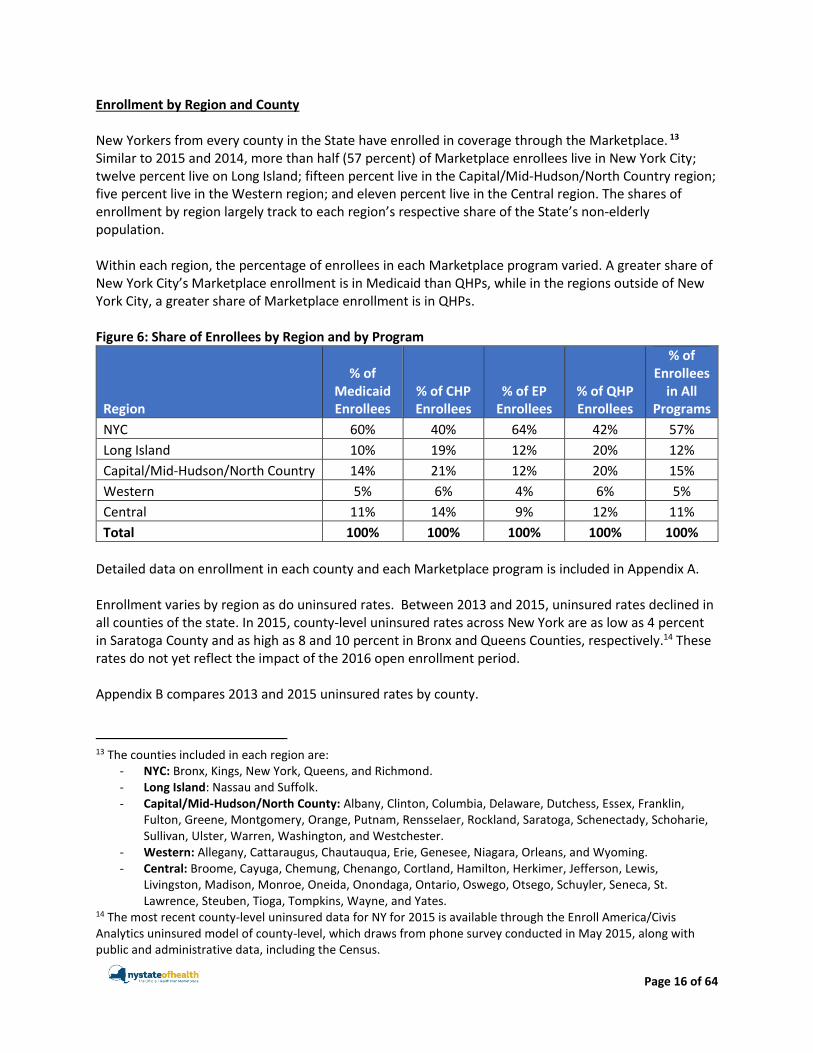
Enrollment by Region and County New Yorkers from every county in the State have enrolled in coverage through the Marketplace. 13 Similar to 2015 and 2014, more than half (57 percent) of Marketplace enrollees live in New York City; twelve percent live on Long Island; fifteen percent live in the Capital/Mid-Hudson/North Country region; five percent live in the Western region; and eleven percent live in the Central region. The shares of enrollment by region largely track to each region’s respective share of the State’s non-elderly population. Within each region, the percentage of enrollees in each Marketplace program varied. A greater share of New York City’s Marketplace enrollment is in Medicaid than QHPs, while in the regions outside of New York City, a greater share of Marketplace enrollment is in QHPs. Figure 6: Share of Enrollees by Region and by Program
Region
% of Medicaid Enrollees
% of CHP Enrollees
% of EP Enrollees
% of QHP Enrollees
% of Enrollees
in All Programs
NYC 60% 40% 64% 42% 57%
Long Island 10% 19% 12% 20% 12%
Capital/Mid-Hudson/North Country 14% 21% 12% 20% 15%
Western 5% 6% 4% 6% 5%
Central 11% 14% 9% 12% 11%
Total 100% 100% 100% 100% 100%
Detailed data on enrollment in each county and each Marketplace program is included in Appendix A. Enrollment varies by region as do uninsured rates. Between 2013 and 2015, uninsured rates declined in all counties of the state. In 2015, county-level uninsured rates across New York are as low as 4 percent in Saratoga County and as high as 8 and 10 percent in Bronx and Queens Counties, respectively.14 These rates do not yet reflect the impact of the 2016 open enrollment period. Appendix B compares 2013 and 2015 uninsured rates by county.
13 The counties included in each region are:
- NYC: Bronx, Kings, New York, Queens, and Richmond. - Long Island: Nassau and Suffolk. - Capital/Mid-Hudson/North County: Albany, Clinton, Columbia, Delaware, Dutchess, Essex, Franklin,
Fulton, Greene, Montgomery, Orange, Putnam, Rensselaer, Rockland, Saratoga, Schenectady, Schoharie, Sullivan, Ulster, Warren, Washington, and Westchester.
- Western: Allegany, Cattaraugus, Chautauqua, Erie, Genesee, Niagara, Orleans, and Wyoming. - Central: Broome, Cayuga, Chemung, Chenango, Cortland, Hamilton, Herkimer, Jefferson, Lewis,
Livingston, Madison, Monroe, Oneida, Onondaga, Ontario, Oswego, Otsego, Schuyler, Seneca, St. Lawrence, Steuben, Tioga, Tompkins, Wayne, and Yates.
14 The most recent county-level uninsured data for NY for 2015 is available through the Enroll America/Civis Analytics uninsured model of county-level, which draws from phone survey conducted in May 2015, along with public and administrative data, including the Census.

Page 17 of 64
Marketplace Enrollment by Age Figure 7 below shows the age distribution of enrollees in the Marketplace by program. The age distribution varies widely by program because of different eligibility rules. As of January 31, 2016, 31 percent of QHP enrollees are age 34 or younger, with 28 percent between the ages of 18 and 34. These shares are similar to 2015. EP enrollment is weighted toward young adults - 38 percent of EP enrollees are between age 34 or younger. Most children under age 18 who were not eligible for Medicaid, enrolled in Child Health Plus. This is not surprising since children under the age of 19 in families with incomes between 138 percent and 400 percent of FPL must be enrolled in CHP rather than in QHPs if they want to receive the subsidies for which they are eligible. In fact, only 4 percent of QHP enrollees are children. Figure 7: Marketplace Enrollment by Age
Age Medicaid CHP EP QHPs All Programs
<18 Years 29% 96% -- 4% 28%
18 - 25 Years 18% 4% 14% 8% 15%
26 - 34 Years 19% -- 24% 20% 18%
35 - 44 Years 13% -- 21% 17% 14%
45 - 54 Years 12% -- 22% 22% 14%
55 - 64 Years 9% -- 20% 28% 12%
≥65 Years 0% -- -- 1% <1%
Total 100% 100% 100% 100% 100%
Marketplace Enrollment by Gender Males and females each represent roughly half of enrollees across all programs. Females comprise a larger majority of enrollees than males in Medicaid, QHPs, and EP, while more males than females were enrolled in CHP. Within QHPs, females outnumber males in the subsidized program, but males are the small majority of enrollees in full pay QHPs. This data is consistent with previous open enrollment periods. Figure 8: Marketplace Enrollment by Gender
Gender Medicaid CHP EP All QHPs Total
Female 52% 48% 54% 50% 52%
Male 48% 52% 46% 50% 48%
Total 100% 100% 100% 100% 100%

Page 18 of 64
Marketplace Enrollment by Preferred Language Overall, 20 percent of Marketplace enrollees indicated a language other than English as their preferred language, compared to 18 percent in 2015.15 Across all programs, 14 percent (399,296) selected Spanish as their preferred language, 5 percent (143,439) selected Chinese, 1 percent (24,712) selected Russian, and 80 percent (2,256,745) of enrollees selected English. Compared to 2015, there was a slight increase in the share of enrollees who selected Spanish as their preferred language (from 13 to 14 percent), however, that represents an increase of nearly 130,000 people. Consumers enrolled in Medicaid, CHP, and EP were more likely to select a language other than English, compared to consumers in QHPs. Figure 9: Enrollment by Preferred Spoken Language
Preferred Spoken Language Medicaid CHP EP All QHPs All Programs
Chinese 5% 3% 10% 2% 5%
English 79% 81% 71% 95% 80%
French <1% <1% 0% <1% <1%
Haitian Creole <1% <1% 0% <1% <1%
Italian <1% <1% 0% <1% <1%
Korean N/A N/A N/A N/A N/A
Russian 1% 1% 2% <1% 1%
Spanish 15% 15% 16% 3% 14%
Total 100% 100% 100% 100% 100%
In 2016, the NY State of Health increased efforts to reach New Yorkers with limited English proficiency across the State. Select consumer education materials are available in 24 languages (including English), including five additional languages that were not available last year: Burmese, Karen, Somali, Swahili and Tigrinya. Materials continue to be available in: Chinese, French, Haitian Creole, Italian, Korean, Russian and Spanish, Arabic, Bengali, Hindi, Japanese, Nepali, Polish, Twi, Urdu, Vietnamese, Yiddish. The Marketplace continues to make available an interactive calendar of events, navigation tools, and new “How to” videos, which are all available in English and Spanish. Closed captioned videos are also available. Customer Service Representatives (CSRs) at the Customer Service Center are able to assist consumers in all languages. More than 200 bilingual CSRs speak 5 languages other than English (Spanish, Mandarin, Russian, Cantonese and Haitian Creole) and all CSRs assist consumers in other languages through the Language Line translation service. From November 1, 2015 through January 31, 2016, the Customer Service Center provided assistance to consumers in 94 languages including English. Detailed data on the number of calls answered in these languages can be found in Appendix G. On average, 20 percent of calls answered on a monthly basis are answered in a language other than English in 2016, compared to 14 percent in 2015. Of the 1.3 million calls answered during the 2016 open enrollment period, nearly
15 The Marketplace asks all account holders about their preferred spoken and written language. Data on preferred spoken language and preferred written language are virtually the same, thus this report presents data on preferred spoken language.

Page 19 of 64
200,000 were in Spanish, nearly 30,000 in Mandarin, over 16,000 in Russian, over 11,000 in Cantonese and nearly 11,000 in Haitian Creole. Additionally, navigators provide assistance in 38 languages, and brokers and Certified Application Counselors also provide assistance in languages other than English. Marketplace Enrollment by Race and Ethnicity16 Thirty-three (33 percent) of Marketplace enrollees reported that they are White, Non-Hispanic, 15 percent reported that they are Black/African American, 13 percent reported that they are Asian/Pacific Islander, and 6 percent reported their race as “other.”17 These shares are similar to 2015, though there was a slight decrease in the number who report to be White, non-Hispanic (36 to 33 percent). More than one-third of enrollees (34 percent) did not respond to the optional question about race, an increase of 3 percentage points compared to the end of the previous open enrollment period. Among enrollees who voluntarily reported their race, the percentage of White, Non-Hispanic enrollees is higher in QHPs and CHP, and lower in Medicaid and EP.
Figure 10: Marketplace Enrollees, by Race and Program
Additionally, twenty-five percent of Marketplace enrollees reported that they are Hispanic. While this is the same share that reported being Hispanic in 2015, it represents a nearly 200,000 increase in number
16 As part of the Marketplace application, consumers have the option of reporting information about their race and about Hispanic ethnicity. Consumers can select more than one race, resulting in totals of more than 100 percent. Responses to questions about race and ethnicity are optional and self-reported. A significant portion of applicants do not respond to these optional questions, limiting the Marketplace’s ability to have a comprehensive view of enrollees’ race and ethnicity. 17 All consumers who self-reported being Asian Indian, Chinese, Filipino, Guamanian or Chamorro, Japanese, Korean, Native Hawaiian, Other Asian, Other Pacific Islander, Samoan, or Vietnamese are counted as Asian/Pacific Islander. All consumers who self-reported being American Indian or reported a race not listed in the application are counted as “Other.”
0%
10%
20%
30%
40%
50%
60%
70%
Medicaid CHP EP All QHPs All Programs
White, Non-Hispanic Black/African American Asian/Pacific Islander
Other Did Not Report

Page 20 of 64
of enrollees who report being Hispanic. This percentage is higher among Medicaid enrollees (28 percent), CHP (25 percent) and EP (23 percent) than QHP enrollees (10 percent). Across all programs, 13 percent of enrollees chose not to respond to the question on Hispanic ethnicity, a slight increase from 12 percent at the end of the previous enrollment period.
Figure 11: Marketplace Enrollees, by Hispanic Ethnicity
Figure 12: Marketplace Enrollees, by Race and Ethnicity
Race Medicaid CHP EP All QHPs All Programs
White, Non-Hispanic 29% 43% 28% 62% 33%
Black/African American 17% 11% 12% 7% 15%
Asian/Pacific Islander 12% 10% 23% 10% 13%
Other 7% 5% 7% 4% 6%
Did Not Report 37% 35% 32% 20% 34%
Total 102% 103% 101% 102% 102%
Ethnicity Medicaid CHP EP All QHPs All Programs
Hispanic 28% 25% 23% 10% 25%
Non-Hispanic 58% 62% 66% 80% 61%
Did Not Respond 14% 13% 11% 10% 13%
Total 100% 100% 100% 100% 100%
0%
10%
20%
30%
40%
50%
60%
70%
80%
Medicaid CHP EP All QHPs All Programs
Hispanic Non-Hispanic Did Not Respond

Page 21 of 64
Section 4: Qualified Health Plan and Essential Plan Enrollment QHP Individual Marketplace Enrollment by Insurer Fifteen insurers offered individual QHP coverage through NY State of Health in 2016. While the number of insurer options available varies by county, ranging from 10 in New York City to 2 in Chemung, Schuyler, and Tompkins Counties, consumers in most counties have at least 4 health insurer options. In 2016, two health insurers, MetroPlus and CareConnect, each expanded the service areas in which QHP coverage is offered by one county. Each of the 15 insurers offering coverage through NY State of Health has enrolled members into QHPs. (Note that the table below shows insurers by their d/b/a, or “doing business as,” since they may differ depending on geographic region of the State). In 2016, Fidelis has the largest market share (26 percent) followed by Empire, Oscar, MetroPlus, and Healthfirst, which each have 10 percent of statewide enrollment. Figure 13: QHP Individual Marketplace Enrollment by Insurer
Insurer % of QHP Enrollment Insurer
% of QHP Enrollment
Fidelis Care 26% EmblemHealth 4%
Empire Blue Cross Blue Shield (Medical Downstate) 10% UnitedHealthcare 4%
Oscar 10% BlueCross BlueShield of Western New York 2%
MetroPlus Health Plan 10% Independent Health 2%
Healthfirst 10% CDPHP 1%
MVP Health Care 6% WellCare of New York <1%
CareConnect 5% BlueShield of Northeastern New York <1%
Excellus BlueCross BlueShield 5% Univera Healthcare <1%
Affinity Health Plan 5% Empire Blue Cross (Medical Upstate) <1%
Total 100%
Note: Excellus is the parent company of Univera Healthcare and HealthNow is the parent company of BlueCross BlueShield of Western NY and BlueShield of Northeastern NY.
Plan Selection by the Numbers
15: The number of insurers offering Qualified Health Plans (QHP).
14: The number of insurers offering Essential Plan (EP) coverage.
66%: The share of QHP enrollment held by the top five insurers.
77%: The share of EP enrollment held by the top five insurers.

Page 22 of 64
Five of the insurers with the highest statewide enrollment in 2016 also had among the highest enrollment in 2015: Fidelis, Healthfirst, Empire, MetroPlus, and MVP. However, between 2015 and 2016, Oscar’s share of statewide enrollment increased from 5 to 10 percent. Because the number of counties that each insurer participates in varies, ranging from five (MetroPlus) to 55 (Fidelis), we also examined enrollment share by insurer in their respective service areas. The table below displays each insurer’s enrollment as a percentage of the total enrollment in the counties in which it participates. Nine insurers have 14 percent or more of the QHP market share in their respective service areas, which reflects a significant distribution of enrollment across a large number of insurers. A comparison to the distribution at the end of the 2015 open enrollment period shows that six insurers have had an increase or decrease in total market share of five percentage points or more. Compared to 2014, four insurers—BCBS of Western NY, Independent Health, HealthFirst, and Oscar—have seen their Market shares by service area increase by 10 percent or more, while two insurers, MetroPlus and MVP Health Care, have seen theirs fall by more than 10 percent. Figure 14: QHP Individual Marketplace Enrollment by Insurer and by Service Area
Insurer April 15, 2014 February 28, 2015 January 31, 2016
Excellus BCBS 29% 28% 36%*
BCBS of Western NY 17% 20% 32%*
Independent Health 16% 13% 27%*
Fidelis Care 19% 20% 27%*
MetroPlus Health Plan 35% 18% 23%*
MVP Health Care 33% 20% 20%
Healthfirst 5% 17% 15%
Oscar 4% 7% 14%*
Empire BCBS 18% 13% 14%
CDPHP 7% 7% 10%
Empire Blue Cross 2% 2% 8%*
North Shore LIJ 4% 3% 7%
Affinity Health Plan 1% 7% 7%
Emblem Health 13% 7% 5%
United Healthcare 2% 3% 5%
BCBS of NE NY <1% 1% 4%
Wellcare** N/A <1% 1%
Univera Healthcare 4% 2% <1%
*Indicates a change in market share of five percentage points or more. QHP Individual Marketplace Enrollment by Insurer and by County A chart showing insurer participation by Marketplace programs is shown in Appendix C. Detailed data on 2016 Individual Marketplace enrollment by QHP insurer by county is shown in Appendix D.

Page 23 of 64
EP Enrollment by Insurer Thirteen insurers offered individual EP coverage in 2016. (Note that the table below shows insurers by their d/b/a, or “doing business as,” since they maydiffer depending on geographic region of the State). Eleven of these insurers also offered QHPs, promoting continuity of coverage for individuals who were enrolled in a QHP in 2015, but were determined eligible for EP when they renewed coverage for 2016. In addition, eleven insurers participate in Medicaid, CHP, EP, and QHPs, which allows for continuity when family members are eligible for different programs and/or individuals’ program eligibility changes over time. Figure 15: EP Enrollment by Insurer
Insurer % of EP Enrollees Insurer
% of EP Enrollees
Fidelis Care 23% Excellus BlueCross BlueShield 4%
Healthfirst 21% WellCare of New York 4%
UnitedHealthcare Community Plan 14% MVP Health Care 3%
MetroPlus Health Plan 10% Independent Health 1%
Empire Blue Cross Blue Shield HealthPlus 9% YourCare Health Plan 1%
Affinity Health Plan 5% Univera Healthcare <1%
EmblemHealth Essential Plan - HMO 4% Crystal Run Health Plan <1%
TOTAL 100%
Detailed data on 2016 EP insurer by county is shown in Appendix E. QHP Individual Marketplace Enrollment by Metal Level The Marketplace offers Qualified Health Plans at four different metal levels: Platinum, Gold, Silver and Bronze. Platinum level plans have, on average, the highest premiums but have lower out-of-pocket costs. Bronze level plans generally have the lowest premiums and higher out-of-pocket costs (e.g., deductible or copayment required when receiving services). Silver and Gold plans fall in the middle. Catastrophic plans are also available to adults below age 30, or adults with hardships. 18 Cost-sharing reductions are available to eligible individuals for Silver level plans purchased through the Marketplace. These cost-sharing subsidies reduce out-of-pocket costs, deductibles, and out-of-pocket maximums. American Indians and Alaska Natives are eligible for additional cost-sharing reductions at all metal levels. Compared to 2015, there are significantly fewer QHP enrollees who receive cost-sharing subsidies because individuals and families with incomes between 138 and 200 percent of FPL, are in EP in 2016 instead of in QHPs with APTC and cost sharing reductions, as they were in 2014 and 2015. The majority of QHP consumers who completed the enrollment process and were determined to be eligible for APTC with cost-sharing reductions chose Silver plans in which they can use cost-sharing
18 On December 19, 2013, the Centers for Medicare and Medicaid Services announced a hardship exemption for consumers with cancelled health insurance policies that allows them to enroll in a catastrophic health insurance plan directly through health plans. http://www.cms.gov/CCIIO/Resources/Regulations-and-Guidance/Downloads/cancellation-consumer-options-12-19-2013.pdf

Page 24 of 64
reductions. Overall, 80 percent of those who are eligible for cost-sharing reductions, enrolled in a Silver plan with that benefit. The remaining 20 percent enrolled in different metal levels. These trends are consistent with the 2015 open enrollment period, when overall, the same share of cost-sharing reduction eligible enrollees—80 percent—enrolled in these plans. As of January 31, 2016, 16 percent of enrollees are enrolled in Platinum plans, 14 percent are in Gold plans, 25 percent are in Silver plans without cost sharing reductions, 17 percent are in a Silver cost-sharing reduction plan, 26 percent are in Bronze plans, and 2 percent are in Catastrophic plans. A total of 287 consumers are enrolled in plans for American Indians or Alaska Natives with limited or no-cost sharing depending on their income and where they receive services. The addition of EP has notably changed the distribution of QHP enrollment by metal level, although, the combined enrollment in Silver plans (Full Pay and with cost sharing reductions) remains the most popular at 42 percent.19
Figure 16: QHP Individual Marketplace Enrollment by Metal Level
One of the differentiating features of the metal tiers is the amount of the annual deductible, which ranges from $3,500 for a standard Bronze plan to $0 for a standard Platinum plan.20 Twenty-seven percent of QHP enrollees are enrolled in standard or non-standard QHPs with low deductibles (defined for this purpose as $600 or less) or no deductible, which is lower than the 55 percent of QHP enrollees in these plans last year due to enrollees being transitioned to EP.21 When considering the nearly 400,000 individuals now enrolled in EP, where there is no deductible, the combined share of QHP and EP enrollees with a low or no deductible goes up to 69 percent.
19 Does not include approximately one percent of enrollees who remain in Silver CSR 1 and 2 plans because they are age 65 and over but not eligible for the EP and also not eligible for Medicare. 20 These deductible levels refer only to standard plans at the Platinum, Gold, Silver, and Bronze levels and do not include the HSA-Compliant Bronze non-standard plan or Catastrophic plan. 21 The standard Platinum plan has a deductible of $0. The standard Gold plan has a deductible of $600. American Indians/Alaska Natives with incomes ≤300% FPL can enroll in a QHP at any metal level with no cost sharing.
2%
26%
25%
14%
16%
<1%
17%
0% 5% 10% 15% 20% 25% 30% 35% 40% 45%
Catastrophic
Bronze
Silver
Gold
Platinum
American Indian/Alaska Native
Non-CSREnrollment
CSR Enrollment42%

Page 25 of 64
Trends in Plan Selection To gain a better understanding of what is driving plan selection, we looked at trends in enrollment in standard and non-standard plans, enrollment in plans with out-of-network benefits, and premium and deductible levels in the most popular plans in each county. Some trends are beginning to emerge. While most Marketplace enrollees are gravitating towards standard plan designs, non-standard plans with additional benefits, such as adult vision and dental, acupuncture, or limited number of physician visits not subject to the deductible and/or copayments are attracting enrollment. In addition, most consumers are enrolling in in-network plans even when out-of-network benefits are available. Standard vs. Non-Standard Plans To make it easier for consumers to compare QHPs, the Marketplace requires that insurers offer a “standard plan” at each metal level and in every county of its Marketplace service area. The standard plan includes the Essential Health Benefits and pre-defined cost-sharing, as well as any visit limits. Only the wellness benefit may be substituted by the insurer in standard plans, subject to Marketplace approval. To allow insurer innovation and greater consumer choice, while limiting the total number of plan choices, the Marketplace permits insurers to offer up to three “non-standard” plans at any metal level, in all or any part of its service area. Non-standard plans offered on the Marketplace, starting in 2015, were required to be meaningfully different from the standard plan. Non-standard QHPs are considered to be meaningfully different when additional benefits, beyond the Essential Health Benefits, are covered, or when the non-standard plan cost sharing difference from the standard plan allows consumers to easily identify the differences to determine which plan provides the highest value at the lowest cost to address their needs. Thirteen of the 15 individual Marketplace insurers elected to offer one or more non-Standard plans in 2016. Fidelis and EmblemHealth insurers offer only standard plans. As of January 31, 2016, 63 percent of consumers enrolled in standard QHP plans, and 37 percent enrolled in Non-standard QHPs, a decrease from last year when 39 percent enrolled in Non-standard QHPs. Non-standard plans with the highest enrollment were those that offered additional benefits beyond the Essential Health Benefits package, such as family or adult dental coverage, vision, limited number of physician sick visits not subject to the deductible or copayments, free telemedicine, or acupuncture. On the other hand, 55 percent of non-standard plans each have less than 500 enrollees, suggesting that the design of these plans have not been sufficiently differentiated to attract consumers. Out-of-Network Plans An “out-of-network” plan provides coverage for services delivered by health care providers that are not in the health insurer’s network without the need for a referral. Neither federal nor state rules require insurers to underwrite, or require Marketplaces to offer plans that include out-of-network benefits. The 2016 Plan Invitation required insurers that offer an out-of-network plan outside the Marketplace to offer an out-of-network plan on the Marketplace at the Silver and Platinum levels. This requirement applies to both the Individual Marketplace and the Small Business Marketplace and is intended to align the Marketplace with the State’s overall insurance market. Insurers that do not offer an out-of-network plan outside the Marketplace are strongly encouraged, but not required, to offer a QHP on the

Page 26 of 64
Marketplace with an out-of-network benefit. New York has strong consumer protections, including a law enacted in 2014 that allow health plan members to receive services from an out-of-network provider at the in-network cost sharing amount when their health plan does not have an appropriate in-network provider, as determined by an independent reviewer. During the 2016 open enrollment period, the Individual Marketplace offered QHPs with out-of-network coverage in 20 counties of the State clustered in the western most counties and in the Capital District. In these 20 counties, 23 percent of QHP enrollees selected plans with an out-of-network benefit. QHPs with an out-of-network benefit were, on average, 16 percent more expensive than in-network plans. In some areas, higher metal level plans with out-of-network benefits can be as much as 40 percent more costly. Plan Cost To gain a better understanding of the role of cost – both monthly premium costs and annual deductibles – on which plans consumers select, we examined Silver plan enrollment in each county at the end of the 2016 open enrollment period. We found that in approximately 90 percent of the State’s counties, the most popular Silver plan (i.e., the Silver plan that consumers most often selected) had a premium that ranked in the bottom third in price. In addition, in all but 7 counties, the most popular Silver plan has lower deductibles – that is, it is equal to or less than the deductible in the lowest cost Silver plan and equal to or less than standard plan deductibles. These trends support the notion that QHP enrollees are likely selecting a plan based on factors including, but not limited to premium cost. Cost-sharing and other plan features including network, may also be influencing how consumers select a plan that meets their needs. Stand Alone Dental Plan Individual Marketplace Enrollment by Insurer Eleven insurers offer stand-alone dental plans (SADP) through the Marketplace. Consumers who purchase a QHP that does not include “embedded” dental coverage may purchase a SADP with pediatric and/or family coverage. Through January 31, 2016, 22,107 consumers enrolled in a SADP; 8 percent of all QHP enrollees, similar to 2015. In 2016, Delta Dental started offering its three SADPs in all 62 counties of the state, likely explaining why Delta Dental saw the most significant growth in SADP market share from 12 percent in 2015 to 30 percent in 2016.

Page 27 of 64
Figure 17: Individual Marketplace Stand Alone Dental Plan Enrollment by Insurer
Stand Alone Dental Plan
% of SADP Enrollment (n = 22,107)
Delta Dental of New York, Inc. 30%
Healthplex Insurance Company, Inc. 17%
Guardian 16%
Empire Blue Cross Blue Shield (Dental Downstate) 15%
Dentcare Delivery Systems Inc. 8%
Solstice Health Insurance Company 7%
BlueCross BlueShield of Western New York 3%
Dentegra Insurance Company of New England 2%
BlueShield of Northeastern New York 1%
Empire Blue Cross (Dental Upstate) 1%
EmblemHealth <1%
TOTAL 100%
Page 28 of 64
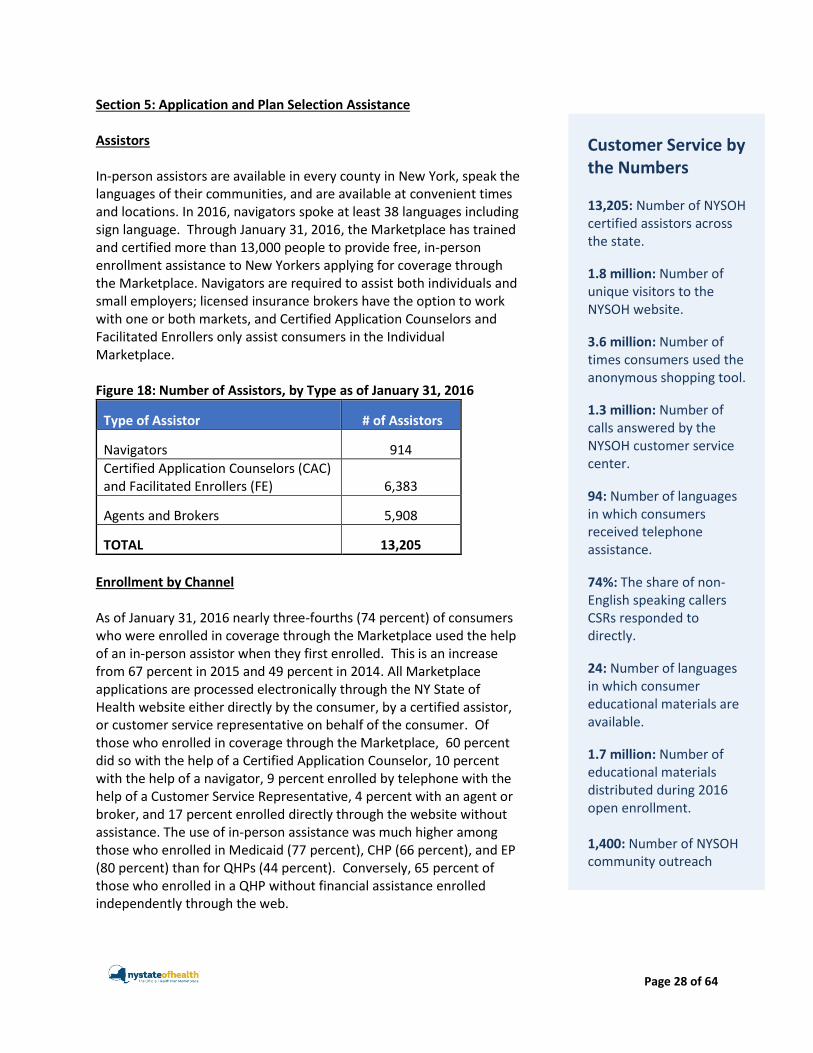
Section 5: Application and Plan Selection Assistance Assistors In-person assistors are available in every county in New York, speak the languages of their communities, and are available at convenient times and locations. In 2016, navigators spoke at least 38 languages including sign language. Through January 31, 2016, the Marketplace has trained and certified more than 13,000 people to provide free, in-person enrollment assistance to New Yorkers applying for coverage through the Marketplace. Navigators are required to assist both individuals and small employers; licensed insurance brokers have the option to work with one or both markets, and Certified Application Counselors and Facilitated Enrollers only assist consumers in the Individual Marketplace. Figure 18: Number of Assistors, by Type as of January 31, 2016
Type of Assistor # of Assistors
Navigators 914
Certified Application Counselors (CAC) and Facilitated Enrollers (FE) 6,383
Agents and Brokers 5,908
TOTAL 13,205
Enrollment by Channel As of January 31, 2016 nearly three-fourths (74 percent) of consumers who were enrolled in coverage through the Marketplace used the help of an in-person assistor when they first enrolled. This is an increase from 67 percent in 2015 and 49 percent in 2014. All Marketplace applications are processed electronically through the NY State of Health website either directly by the consumer, by a certified assistor, or customer service representative on behalf of the consumer. Of those who enrolled in coverage through the Marketplace, 60 percent did so with the help of a Certified Application Counselor, 10 percent with the help of a navigator, 9 percent enrolled by telephone with the help of a Customer Service Representative, 4 percent with an agent or broker, and 17 percent enrolled directly through the website without assistance. The use of in-person assistance was much higher among those who enrolled in Medicaid (77 percent), CHP (66 percent), and EP (80 percent) than for QHPs (44 percent). Conversely, 65 percent of those who enrolled in a QHP without financial assistance enrolled independently through the web.
Customer Service by the Numbers 13,205: Number of NYSOH certified assistors across the state.
1.8 million: Number of unique visitors to the NYSOH website.
3.6 million: Number of times consumers used the anonymous shopping tool.
1.3 million: Number of calls answered by the NYSOH customer service center.
94: Number of languages in which consumers received telephone assistance.
74%: The share of non-English speaking callers CSRs responded to directly.
24: Number of languages in which consumer educational materials are available.
1.7 million: Number of educational materials distributed during 2016 open enrollment. 1,400: Number of NYSOH community outreach events in 2015-2016.

Page 29 of 64
Figure 19: Enrollment by Channel
Channel Medicaid CHP EP All QHPs All Programs
Agents and Brokers 1% 5% 5% 17% 4%
CAC and FE 65% 54% 65% 18% 60%
Navigator 10% 11% 9% 9% 10%
Phone 9% 12% 7% 11% 9%
Website with no assistor 14% 17% 13% 45% 17%
TOTAL 100% 100% 100% 100% 100%
Section 6: Website and Customer Service Center Website Between November 1, 2015 and January 31, 2016, over 1.8 million (1,802,242) unique visitors viewed 96,673,943 web pages. Website traffic increased throughout the open enrollment period. The website operated at or above expectations, with an average system response time of 2.4 seconds for each web page. Traffic to the website peaked at nearly 15,000 concurrent users per hour, on December 14, 2015, leading up to the deadline to enroll in coverage that begins on January 1, 2016. As of January 31, 2016, there had been 72,907 sessions, where users accessed the Spanish Language version of the Marketplace’s website. Customer Service Center The Customer Service Center supports the Marketplace in a variety of ways, including operating the Marketplace’s toll-free customer service helplines, assisting consumers in completing phone applications, performing back-end administrative and consumer support functions, and managing the Marketplace’s social media channels. The Customer Service Center is open Monday through Friday from 8am to 8pm and on Saturday from 9am to 1pm with expanded days and hours during the peak of open enrollment. Telephone and Application Assistance The Customer Service Center answers consumer inquiries across all Marketplace programs, Medicaid, CHP, QHPs and the Essential Plan. Customer Service Representatives (CSRs) assist consumers in completing new and renewal phone applications both from start to finish, as well as completing applications that were started through other channels. During the 2016 open enrollment period (November 1, 2015 to January 31, 2016), the Customer Service Center answered 1,329,643 calls. The number of calls answered by Customer Service Center peaked at nearly 112,000 calls per week in December during the final days individuals could sign-up for coverage that started on January 1, 2016. On average, the Customer Service Center answered nearly 102,000 calls per week throughout the open enrollment period. The average time to complete an application by phone varies depending upon whether or not the individual is seeking to apply for financial assistance. For those applying for financial assistance, the application takes an average of 45 minutes to complete compared with about 20 minutes for those not

Page 30 of 64
applying for financial assistance. Renewal application calls take up to 20 minutes. Calls to respond to general inquiries and questions are shorter, lasting 13.4 minutes on average.
More than 200 CSRs speak English and one of the following 5 languages: Spanish, Mandarin, Russian,
Cantonese and Haitian Creole, and these CSRs directly responded to 74 percent of non-English speaking
callers. The remaining non-English speaking callers received assistance through three-way calls with an
outside interpreter service. During the 2016 open enrollment period, CSRs responded to 266,724 non-
English calls, about 20 percent of all calls, up from 14 percent of all calls in 2015. These non-English calls
comprised 93 different languages. Detailed data on the number of calls answered in these languages
can be found in Appendix F.
Finally, CSRs answer consumer inquiries related to IRS Forms 1095-A and 1095-B that are issued by the
NY State of Health and Department of Health. These are important tax documents issued to consumers
who were enrolled in QHPs, Medicaid, or CHP. Weekly call volume specific to IRS Forms 1095-A and
1095-B peaked at over 12,000 calls answered during the week of February 8.
Document Processing The Customer Service Center processes verification documents when required to complete an application. Although only a small percentage of applicants are required to submit documents in order to receive an eligibility determination, the number of documents that must be processed is sizable given that the Marketplace services 2.8 million consumers. Documents are related to income, citizenship and/or immigration status, and other eligibility factors. On average, Maximus processed nearly 2,600 documents per day, taking an average of 4 days per document.
Figure 20: NYSOH Customer Service Center Calls Answered by Week, 11/1/15 – 1/31/16
-
20,000
40,000
60,000
80,000
100,000
120,000
140,000
160,000

Page 31 of 64
Social Media From November 1, 2015, through January 31, 2016, the social media team responded to nearly 1,000 comments across social media channels. Many consumers post to NY State of Health social media pages with questions about eligibility rules, covered benefits, deadlines, and how to seek additional assistance. The marketplace also uses social media to share reminders about key dates and to promote events where Marketplace representatives will be in the community. Information is posted in both English and Spanish. Social media activity peaked in December when the team received more than 380 comments, and more than 290 comments were posted in the month of November. More than 24,227 individuals are following the Marketplace on its social media channels, including 16,845 fans on Facebook and 6,233 followers on Twitter. Facebook followers increased by nearly 26 percent between November 1, 2015, and January 31, 2016, while Twitter followers increased by approximately 20 percent during the same period. Section 7: Small Business Marketplace Small businesses with 100 or fewer employees can enroll in the Small Business Marketplace (SBM) throughout the year. The SBM enables employers to offer multiple insurers and QHPs to employees, allows employers to define coverage tiers and contribution levels, and is the only place for small businesses that qualify to receive the small business tax credits available under the federal law. As of January 31, 2016, 3,217 small businesses offered insurance to their employees through the SBM. On average, employers purchasing through the SBM contribute 72 percent towards the cost of the employee’s coverage. Sixty-four percent offer coverage to the dependents of their employees, compared to 62 percent at the end of the 2015 open enrollment period. As anticipated by early projections, the average enrolled small business has 3 employees. More than 13,000 employees and their dependents (13,224) have enrolled in coverage through the SBM. The employee choice model continues to be popular among enrolled employers. Of the employers that enrolled in the Small Business Marketplace, 74 percent offer 2 or more QHPs to their employees while about a quarter (26 percent) opt to offer only one QHP to their employees. Employers that offered two or more QHPs could offer multiple QHPs offered by a single insurer and/or across insurers. Small businesses throughout the State have enrolled through the SBM. New York City accounts for 35 percent of employers enrolled in the SBM and 20 percent of enrollees; Long Island accounts for 9 percent of employers and 7 percent of enrollees; the Capital/Mid-Hudson/North County region accounts for 21 percent of employers and 17 percent of enrollees; the Western region accounts for 14 percent of
Small Business Marketplace by the Numbers 13,224: The number of employees and dependents enrolled in the Small Business Marketplace (SBM) as of January 2016. 3,217: The number of employers offering coverage on the SBM. 8: The number of insurers offering coverage on the SBM. 72%: The average share employer contribution towards premiums. 64%: The share of employers offering dependent coverage. 74%: The share of employers offering two or more health plans to their employees.

Page 32 of 64
employers and 19 percent of enrollees and the Central New York region accounts for 21 percent of employers and 37 percent of enrollees. Figure 21: Small Business Marketplace Enrollment by Region, by Employer Location, and Employee/Dependent Location
Region % of Enrolled Employers by Region
% of Enrolled Employees and dependents by Region
NYC 35% 20%
Long Island 9% 7%
Capital/Mid-Hudson/North Country 21% 17%
Western 14% 19%
Central 21% 37%
Total 100% 100%
Enrollment by SBM Insurer Each of the eight insurers offering small employer coverage through NY State of Health enrolled members into their QHPs through January 31, 2016. (Note that the table below shows insurers by their d/b/a or “doing business as” name since these names differ depending on geographic region in the State). Three insurers enrolled 60 percent of the SBM enrollees: Excellus BlueCross BlueShield (35 percent), MVP (14 percent), and CareConnect (12 percent). Excellus BlueCross Blue Shield’s saw the largest increase in statewide market share increasing from 27 to 35 percent from 2015 to 2016.
Figure 22: SHOP Enrollment by Insurer
Insurer
% of SHOP Enrollees N =13,224
Excellus BlueCross BlueShield 35%
MVP Health Plan 14%
CareConnect 12%
EmblemHealth 11%
Independent Health 8%
MetroPlus Health Plan 7%
BlueCross BlueShield of Western New York 6%
CDPHP 5%
BlueShield of Northeastern New York 1%
Univera Healthcare 1%
TOTAL 100% Note: Excellus is the parent company of Univera Healthcare and HealthNow is the parent company of BlueCross BlueShield of Western NY and BlueShield of Northeastern NY.
While there are eight insurers offering QHPs through the SBM, the number of insurers participating in each county varies. QHP insurers participate in a different number of counties across the State based upon their respective service areas. Participation by county ranges from 5 (MetroPlus) to 48 (MVP Health Plan). Detailed data on SBM enrollment by QHP insurer by county is shown in Appendix F.

Page 33 of 64
SBM Enrollment by Metal Level The Marketplace offers QHPs at four metal levels: Platinum, Gold, Silver, and Bronze. Catastrophic plans are not available in the Small Business Marketplace. Twenty-eight percent of SBM enrollees are enrolled in Platinum plans, 28 percent are enrolled in Gold plans, 25 percent are enrolled in Silver plans, and 19 percent of enrollees are enrolled in Bronze plans. More than half (56 percent) of Small Business Marketplace enrollees are in plans with low or no deductibles (Platinum and Gold plans).
Figure 23: SHOP Enrollment by Metal Level
Stand Alone Dental Plan Small Business Marketplace Enrollment by Insurer Nine insurers offer stand-alone dental plans (SADP) through the Small Business Marketplace. If an employer makes SADPs available, employees and their dependents who purchase a QHP that does not include dental coverage may purchase a SADP. Through January 31, 2016, 2,189 employees and their dependents (17 percent of SBM enrollees) enrolled in a SADP. SADP enrollment has remained relatively steady compared to 2015. Many other enrollees received dental benefits through their QHP. SADP Insurer market share has remained relatively consistent between 2015 and 2016.
19%
25%
28%
28%
0% 5% 10% 15% 20% 25% 30%
Bronze
Silver
Gold
Platinum

Page 34 of 64
Figure 24: SHOP Enrollment in Stand Alone Dental Plans by Insurer
Stand Alone Dental Plan Insurer
% of Enrollees (n = 2,189)
Guardian 43%
Delta Dental of New York, Inc. 22%
MetLife 13%
Healthplex Insurance Company, Inc. 9%
Solstice Health Insurance Company 5%
Dentcare Delivery Systems Inc. 5%
BlueCross BlueShield of Western New York 2%
BlueShield of Northeastern New York 1%
Dentegra Insurance Company of New England 1%
TOTAL 100%

Page 35 of 64
Section 10: Appendices
APPENDIX A: NUMBER AND DISTRIBUTION OF ENROLLEES BY COUNTY AND PROGRAM
Number of Enrollees, By Program and County
County Medicaid CHP EP All QHPs All Programs
Albany 20,722 2,833 3,053 2,794 29,402
Allegany 3,382 338 490 441 4,651
Bronx 264,244 12,761 42,383 8,544 327,932
Broome 12,136 1,693 1,967 1,963 17,759
Cattaraugus 6,335 687 788 928 8,738
Cayuga 5,494 894 862 859 8,109
Chautauqua 9,189 1,085 1,432 1,612 13,318
Chemung 7,238 547 834 838 9,457
Chenango 4,317 458 562 534 5,871
Clinton 4,998 905 901 847 7,651
Columbia 4,576 689 796 1,242 7,303
Cortland 3,167 516 569 465 4,717
Delaware 3,798 349 393 499 5,039
Dutchess 19,803 3,539 2,757 5,110 31,209
Erie 62,224 6,676 8,708 9,458 87,066
Essex 2,574 460 423 507 3,964
Franklin 3,974 422 526 468 5,390
Fulton 5,029 696 654 566 6,945
Genesee 4,120 654 657 720 6,151
Greene 3,700 554 579 633 5,466
Hamilton 313 48 84 87 532
Herkimer 5,016 852 760 704 7,332
Jefferson 7,925 1,014 1,207 971 11,117
Kings 374,634 30,673 79,365 38,506 523,178
Lewis 2,197 414 426 361 3,398
Livingston 3,287 537 554 648 5,026
Madison 3,907 624 726 678 5,935
Monroe 49,248 6,891 8,317 8,686 73,142
Montgomery 4,698 626 536 449 6,309
Nassau 80,807 17,590 20,292 25,557 144,246
New York 142,197 6,792 25,630 30,894 205,513
Niagara 14,914 1,823 2,141 2,277 21,155
Oneida 15,963 2,379 2,537 2,014 22,893
Onondaga 33,211 4,249 4,696 4,262 46,418
Ontario 6,776 1,339 1,187 1,504 10,806
Orange 28,932 5,617 4,304 4,560 43,413
Orleans 3,146 467 469 499 4,581

Page 36 of 64
Oswego 9,490 1,349 1,246 1,062 13,147
Otsego 4,546 634 715 704 6,599
Putnam 5,244 1,133 845 2,270 9,492
Queens 352,025 31,272 87,992 31,428 502,717
Rensselaer 10,132 1,635 1,260 1,506 14,533
Richmond 42,688 4,125 6,677 5,467 58,957
Rockland 28,965 7,152 5,069 5,209 46,395
Saratoga 10,774 2,481 1,913 3,011 18,179
Schenectady 14,729 1,879 1,967 1,512 20,087
Schoharie 2,047 292 296 399 3,034
Schuyler 1,495 197 269 264 2,225
Seneca 2,219 361 386 345 3,311
St. Lawrence 7,301 1,040 1,094 842 10,277
Steuben 8,337 926 1,107 1,057 11,427
Suffolk 113,189 23,846 24,223 28,839 190,097
Sullivan 8,152 941 1,050 907 11,050
Tioga 3,965 466 528 609 5,568
Tompkins 4,969 827 983 1,351 8,130
Ulster 14,231 2,538 2,609 2,856 22,234
Warren 4,806 787 884 957 7,434
Washington 5,928 1,017 804 956 8,705
Wayne 7,349 1,406 1,220 1,403 11,378
Westchester 70,985 9,565 12,967 16,291 109,808
Wyoming 3,092 529 535 677 4,833
Yates 2,071 291 355 357 3,074
TOTAL 1,966,920 215,380 379,559 271,964 2,833,823

Page 37 of 64
Appendix B: Changes in County-Level Uninsured Rates, 2013 vs. 2015
2013 Uninsured Rate by County
2015 Uninsured Rate by County
Map Key
Uninsured rate is
greater than 10%
Uninsured rate is
greater than or
equal to 7% and
less than or equal
to 10%
Uninsured rate is
less than 7%
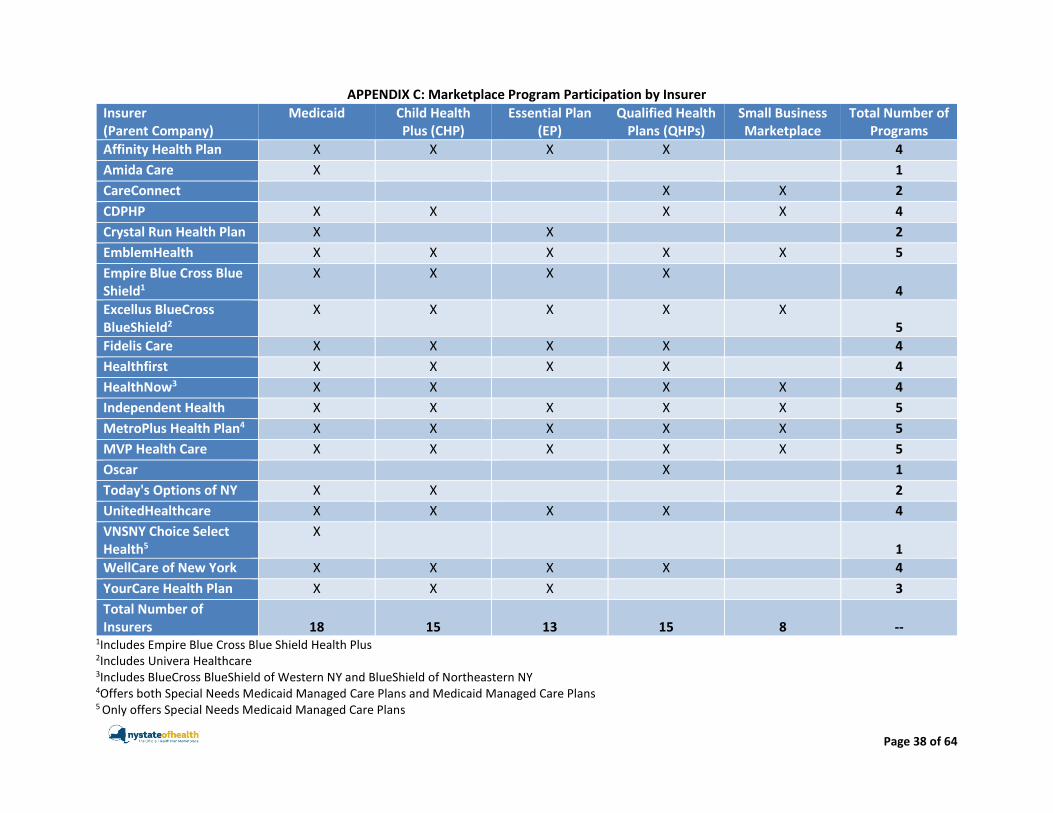
Page 38 of 64
APPENDIX C: Marketplace Program Participation by Insurer
Insurer (Parent Company)
Medicaid Child Health Plus (CHP)
Essential Plan (EP)
Qualified Health Plans (QHPs)
Small Business Marketplace
Total Number of Programs
Affinity Health Plan X X X X 4
Amida Care X 1
CareConnect X X 2
CDPHP X X X X 4
Crystal Run Health Plan X X 2
EmblemHealth X X X X X 5
Empire Blue Cross Blue Shield1
X X X X 4
Excellus BlueCross BlueShield2
X X X X X 5
Fidelis Care X X X X 4
Healthfirst X X X X 4
HealthNow3 X X X X 4
Independent Health X X X X X 5
MetroPlus Health Plan4 X X X X X 5
MVP Health Care X X X X X 5
Oscar X 1
Today's Options of NY X X 2
UnitedHealthcare X X X X 4
VNSNY Choice Select Health5
X 1
WellCare of New York X X X X 4
YourCare Health Plan X X X 3
Total Number of Insurers
18
15
13
15
8
--
1Includes Empire Blue Cross Blue Shield Health Plus 2Includes Univera Healthcare 3Includes BlueCross BlueShield of Western NY and BlueShield of Northeastern NY 4Offers both Special Needs Medicaid Managed Care Plans and Medicaid Managed Care Plans 5 Only offers Special Needs Medicaid Managed Care Plans
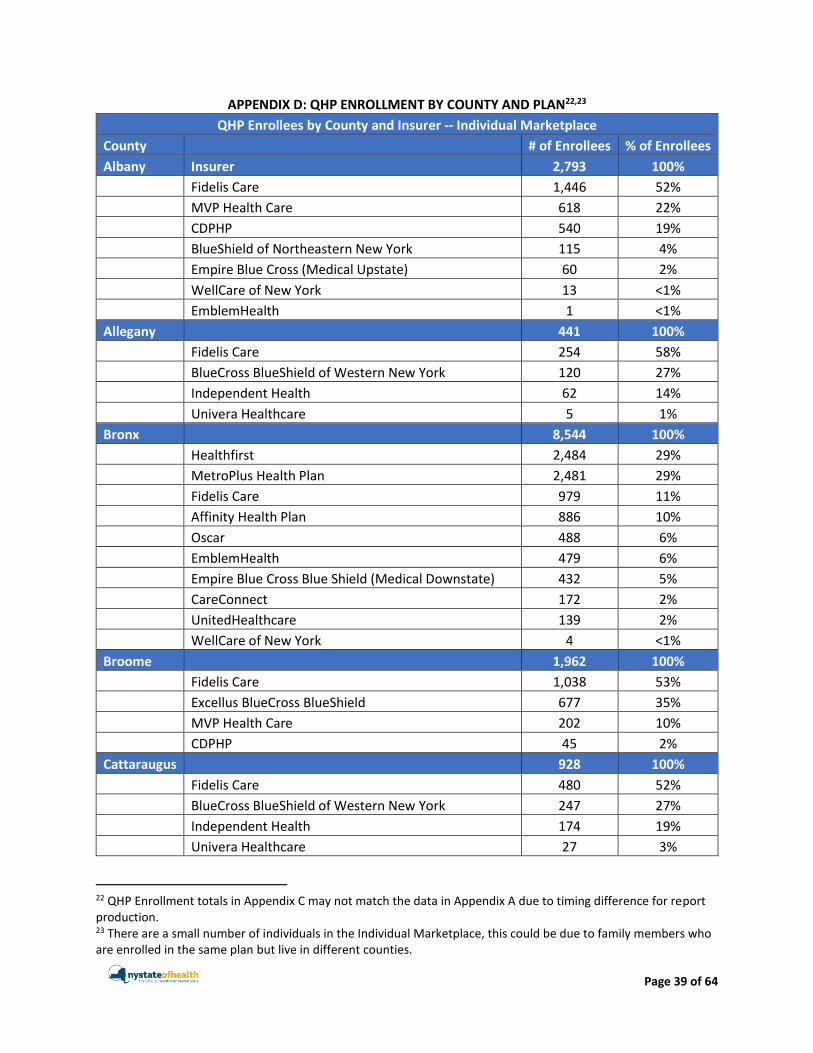
Page 39 of 64
APPENDIX D: QHP ENROLLMENT BY COUNTY AND PLAN22,23
QHP Enrollees by County and Insurer -- Individual Marketplace
County # of Enrollees % of Enrollees
Albany Insurer 2,793 100%
Fidelis Care 1,446 52%
MVP Health Care 618 22%
CDPHP 540 19%
BlueShield of Northeastern New York 115 4%
Empire Blue Cross (Medical Upstate) 60 2%
WellCare of New York 13 <1%
EmblemHealth 1 <1%
Allegany 441 100%
Fidelis Care 254 58%
BlueCross BlueShield of Western New York 120 27%
Independent Health 62 14%
Univera Healthcare 5 1%
Bronx 8,544 100%
Healthfirst 2,484 29%
MetroPlus Health Plan 2,481 29%
Fidelis Care 979 11%
Affinity Health Plan 886 10%
Oscar 488 6%
EmblemHealth 479 6%
Empire Blue Cross Blue Shield (Medical Downstate) 432 5%
CareConnect 172 2%
UnitedHealthcare 139 2%
WellCare of New York 4 <1%
Broome 1,962 100%
Fidelis Care 1,038 53%
Excellus BlueCross BlueShield 677 35%
MVP Health Care 202 10%
CDPHP 45 2%
Cattaraugus 928 100%
Fidelis Care 480 52%
BlueCross BlueShield of Western New York 247 27%
Independent Health 174 19%
Univera Healthcare 27 3%
22 QHP Enrollment totals in Appendix C may not match the data in Appendix A due to timing difference for report production. 23 There are a small number of individuals in the Individual Marketplace, this could be due to family members who are enrolled in the same plan but live in different counties.

Page 40 of 64
Cayuga 859 100%
Fidelis Care 558 65%
Excellus BlueCross BlueShield 227 26%
MVP Health Care 74 9%
Chautauqua 1,612 100%
Fidelis Care 810 50%
BlueCross BlueShield of Western New York 381 24%
Independent Health 372 23%
Univera Healthcare 49 3%
Chemung 838 100%
Fidelis Care 562 67%
Excellus BlueCross BlueShield 276 33%
Chenango 534 100%
Fidelis Care 284 53%
MVP Health Care 154 29%
Excellus BlueCross BlueShield 83 16%
CDPHP 13 2%
Clinton 847 100%
MVP Health Care 535 63%
Excellus BlueCross BlueShield 241 28%
BlueShield of Northeastern New York 70 8%
Empire Blue Cross (Medical Upstate) 1 <1%
Columbia 1,241 100%
Fidelis Care 681 55%
MVP Health Care 275 22%
CDPHP 206 17%
Empire Blue Cross Blue Shield (Medical Downstate) 46 4%
BlueShield of Northeastern New York 30 2%
EmblemHealth 3 <1%
Cortland 465 100%
Fidelis Care 315 68%
Excellus BlueCross BlueShield 127 27%
MVP Health Care 23 5%
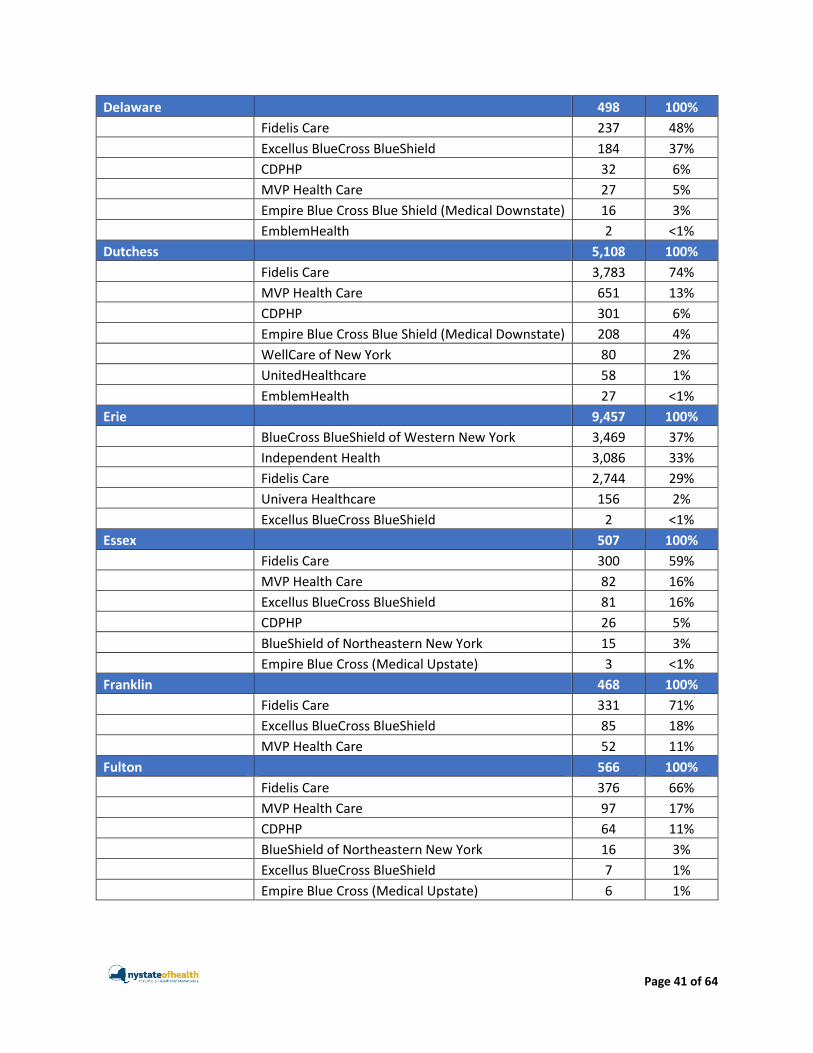
Page 41 of 64
Delaware 498 100%
Fidelis Care 237 48%
Excellus BlueCross BlueShield 184 37%
CDPHP 32 6%
MVP Health Care 27 5%
Empire Blue Cross Blue Shield (Medical Downstate) 16 3%
EmblemHealth 2 <1%
Dutchess 5,108 100%
Fidelis Care 3,783 74%
MVP Health Care 651 13%
CDPHP 301 6%
Empire Blue Cross Blue Shield (Medical Downstate) 208 4%
WellCare of New York 80 2%
UnitedHealthcare 58 1%
EmblemHealth 27 <1%
Erie 9,457 100%
BlueCross BlueShield of Western New York 3,469 37%
Independent Health 3,086 33%
Fidelis Care 2,744 29%
Univera Healthcare 156 2%
Excellus BlueCross BlueShield 2 <1%
Essex 507 100%
Fidelis Care 300 59%
MVP Health Care 82 16%
Excellus BlueCross BlueShield 81 16%
CDPHP 26 5%
BlueShield of Northeastern New York 15 3%
Empire Blue Cross (Medical Upstate) 3 <1%
Franklin 468 100%
Fidelis Care 331 71%
Excellus BlueCross BlueShield 85 18%
MVP Health Care 52 11%
Fulton 566 100%
Fidelis Care 376 66%
MVP Health Care 97 17%
CDPHP 64 11%
BlueShield of Northeastern New York 16 3%
Excellus BlueCross BlueShield 7 1%
Empire Blue Cross (Medical Upstate) 6 1%

Page 42 of 64
Genesee 720 100%
Fidelis Care 329 46%
MVP Health Care 144 20%
Independent Health 129 18%
BlueCross BlueShield of Western New York 114 16%
Univera Healthcare 4 <1%
Greene 633 100%
Fidelis Care 342 54%
MVP Health Care 164 26%
CDPHP 80 13%
Empire Blue Cross Blue Shield (Medical Downstate) 40 6%
BlueShield of Northeastern New York 7 1%
Hamilton 87 100%
Fidelis Care 63 72%
MVP Health Care 13 15%
Excellus BlueCross BlueShield 8 9%
CDPHP 3 3%
Herkimer 703 100%
MVP Health Care 335 48%
Excellus BlueCross BlueShield 317 45%
CDPHP 51 7%
Jefferson 971 100%
Fidelis Care 575 59%
Excellus BlueCross BlueShield 218 22%
MVP Health Care 178 18%
Kings 38,506 100%
MetroPlus Health Plan 9,567 25%
Healthfirst 6,724 17%
Oscar 6,723 17%
Fidelis Care 6,571 17%
Empire Blue Cross Blue Shield (Medical Downstate) 3,397 9%
EmblemHealth 1,913 5%
Affinity Health Plan 1,539 4%
UnitedHealthcare 1,526 4%
CareConnect 524 1%
WellCare of New York 22 <1%
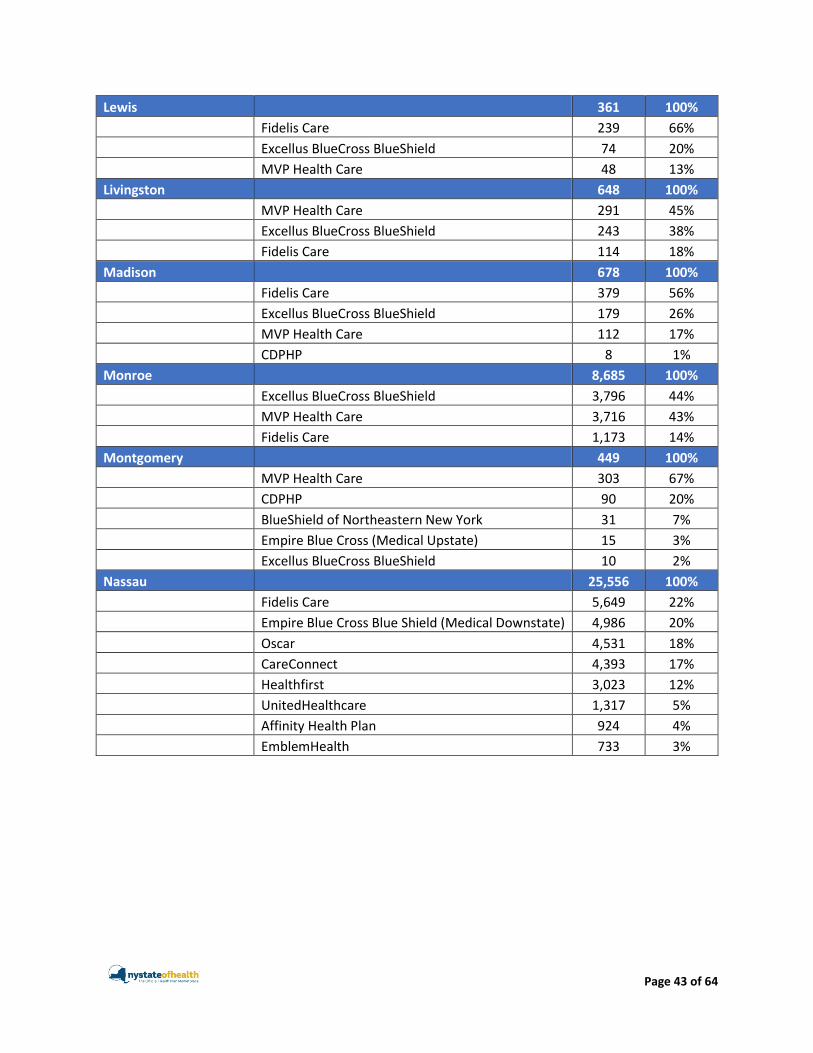
Page 43 of 64
Lewis 361 100%
Fidelis Care 239 66%
Excellus BlueCross BlueShield 74 20%
MVP Health Care 48 13%
Livingston 648 100%
MVP Health Care 291 45%
Excellus BlueCross BlueShield 243 38%
Fidelis Care 114 18%
Madison 678 100%
Fidelis Care 379 56%
Excellus BlueCross BlueShield 179 26%
MVP Health Care 112 17%
CDPHP 8 1%
Monroe 8,685 100%
Excellus BlueCross BlueShield 3,796 44%
MVP Health Care 3,716 43%
Fidelis Care 1,173 14%
Montgomery 449 100%
MVP Health Care 303 67%
CDPHP 90 20%
BlueShield of Northeastern New York 31 7%
Empire Blue Cross (Medical Upstate) 15 3%
Excellus BlueCross BlueShield 10 2%
Nassau 25,556 100%
Fidelis Care 5,649 22%
Empire Blue Cross Blue Shield (Medical Downstate) 4,986 20%
Oscar 4,531 18%
CareConnect 4,393 17%
Healthfirst 3,023 12%
UnitedHealthcare 1,317 5%
Affinity Health Plan 924 4%
EmblemHealth 733 3%

Page 44 of 64
New York 30,887 100%
Oscar 6,634 21%
MetroPlus Health Plan 5,818 19%
Empire Blue Cross Blue Shield (Medical Downstate) 4,579 15%
Healthfirst 4,405 14%
UnitedHealthcare 3,244 11%
Fidelis Care 2,710 9%
EmblemHealth 1,968 6%
Affinity Health Plan 1,192 4%
CareConnect 331 1%
WellCare of New York 6 <1%
Niagara 2,277 100%
Fidelis Care 878 39%
BlueCross BlueShield of Western New York 796 35%
Independent Health 590 26%
Univera Healthcare 13 <1%
Oneida 2,014 100%
Fidelis Care 1,292 64%
MVP Health Care 395 20%
Excellus BlueCross BlueShield 297 15%
CDPHP 30 1%
Onondaga 4,260 100%
Fidelis Care 2,084 49%
Excellus BlueCross BlueShield 1,866 44%
MVP Health Care 310 7%
Ontario 1,504 100%
MVP Health Care 680 45%
Excellus BlueCross BlueShield 652 43%
Fidelis Care 172 11%
Orange 4,560 100%
Affinity Health Plan 1,853 41%
Fidelis Care 1,643 36%
MVP Health Care 461 10%
Empire Blue Cross Blue Shield (Medical Downstate) 288 6%
UnitedHealthcare 120 3%
EmblemHealth 81 2%
CDPHP 68 1%
WellCare of New York 46 1%

Page 45 of 64
Orleans 499 100%
Fidelis Care 249 50%
MVP Health Care 112 22%
BlueCross BlueShield of Western New York 101 20%
Independent Health 31 6%
Univera Healthcare 6 1%
Oswego 1,062 100%
Fidelis Care 719 68%
Excellus BlueCross BlueShield 197 19%
MVP Health Care 146 14%
Otsego 704 100%
Excellus BlueCross BlueShield 373 53%
MVP Health Care 230 33%
CDPHP 101 14%
Putnam 2,270 100%
Fidelis Care 1,850 81%
MVP Health Care 187 8%
Empire Blue Cross Blue Shield (Medical Downstate) 156 7%
UnitedHealthcare 56 2%
EmblemHealth 21 <1%
Queens 31,428 100%
MetroPlus Health Plan 7,821 25%
Healthfirst 5,775 18%
Fidelis Care 5,500 18%
Oscar 2,831 9%
Empire Blue Cross Blue Shield (Medical Downstate) 2,560 8%
EmblemHealth 2,321 7%
CareConnect 2,279 7%
Affinity Health Plan 1,554 5%
UnitedHealthcare 742 2%
WellCare of New York 45 <1%

Page 46 of 64
Rensselaer 1,505 100%
Fidelis Care 822 55%
MVP Health Care 314 21%
CDPHP 281 19%
BlueShield of Northeastern New York 49 3%
Empire Blue Cross (Medical Upstate) 32 2%
WellCare of New York 7 <1%
Richmond 5,467 100%
Fidelis Care 1,569 29%
Healthfirst 811 15%
EmblemHealth 800 15%
Empire Blue Cross Blue Shield (Medical Downstate) 724 13%
MetroPlus Health Plan 470 9%
Oscar 378 7%
CareConnect 264 5%
Affinity Health Plan 228 4%
UnitedHealthcare 223 4%
Rockland 5,209 100%
Fidelis Care 2,116 41%
Affinity Health Plan 825 16%
Empire Blue Cross Blue Shield (Medical Downstate) 721 14%
MVP Health Care 508 10%
EmblemHealth 405 8%
Oscar 383 7%
UnitedHealthcare 226 4%
WellCare of New York 25 <1%
Saratoga 3,010 100%
Fidelis Care 1,607 53%
MVP Health Care 787 26%
CDPHP 437 15%
BlueShield of Northeastern New York 136 5%
Empire Blue Cross (Medical Upstate) 43 1%
Schenectady 1,512 100%
Fidelis Care 827 55%
MVP Health Care 416 28%
CDPHP 225 15%
BlueShield of Northeastern New York 25 2%
Empire Blue Cross (Medical Upstate) 19 1%

Page 47 of 64
Schoharie 399 100%
MVP Health Care 243 61%
CDPHP 141 35%
Empire Blue Cross (Medical Upstate) 15 4%
Schuyler 264 100%
Fidelis Care 196 74%
Excellus BlueCross BlueShield 68 26%
Seneca 345 100%
MVP Health Care 157 46%
Excellus BlueCross BlueShield 136 39%
Fidelis Care 52 15%
St. Lawrence 842 100%
Fidelis Care 494 59%
Excellus BlueCross BlueShield 189 22%
MVP Health Care 159 19%
Steuben 1,057 100%
Fidelis Care 793 75%
Excellus BlueCross BlueShield 249 24%
MVP Health Care 15 1%
Suffolk 28,837 100%
Fidelis Care 7,290 25%
Empire Blue Cross Blue Shield (Medical Downstate) 6,513 23%
Oscar 4,625 16%
CareConnect 3,476 12%
Healthfirst 2,806 10%
Affinity Health Plan 1,439 5%
EmblemHealth 1,438 5%
UnitedHealthcare 1,250 4%
Sullivan 907 100%
Fidelis Care 669 74%
MVP Health Care 144 16%
Empire Blue Cross Blue Shield (Medical Downstate) 65 7%
UnitedHealthcare 22 2%
EmblemHealth 7 <1%
Tioga 609 100%
Fidelis Care 393 65%
Excellus BlueCross BlueShield 180 30%
MVP Health Care 27 4%
CDPHP 9 1%

Page 48 of 64
Tompkins 1,349 100%
Excellus BlueCross BlueShield 1,096 81%
MVP Health Care 253 19%
Ulster 2,854 100%
MVP Health Care 1,182 41%
WellCare of New York 752 26%
CDPHP 572 20%
Empire Blue Cross Blue Shield (Medical Downstate) 231 8%
UnitedHealthcare 63 2%
EmblemHealth 52 2%
BlueShield of Northeastern New York 2 <1%
Warren 957 100%
Fidelis Care 639 67%
MVP Health Care 208 22%
CDPHP 72 8%
BlueShield of Northeastern New York 18 2%
Empire Blue Cross (Medical Upstate) 18 2%
EmblemHealth 2 <1%
Washington 956 100%
Fidelis Care 622 65%
MVP Health Care 211 22%
CDPHP 80 8%
BlueShield of Northeastern New York 29 3%
Empire Blue Cross (Medical Upstate) 14 1%
Wayne 1,403 100%
MVP Health Care 692 49%
Excellus BlueCross BlueShield 522 37%
Fidelis Care 189 13%
Westchester 16,290 100%
Fidelis Care 3,938 24%
Empire Blue Cross Blue Shield (Medical Downstate) 3,265 20%
Affinity Health Plan 2,326 14%
CareConnect 2,248 14%
Oscar 1,425 9%
EmblemHealth 1,371 8%
MVP Health Care 894 5%
UnitedHealthcare 823 5%

Page 49 of 64
Wyoming 676 100%
Fidelis Care 284 42%
BlueCross BlueShield of Western New York 158 23%
MVP Health Care 130 19%
Independent Health 97 14%
Univera Healthcare 7 1%
Yates 357 100%
Excellus BlueCross BlueShield 166 46%
MVP Health Care 124 35%
Fidelis Care 67 19%
<1%
Unknown 29 100%
GRAND TOTAL 271,964 100%

Page 50 of 64
APPENDIX E: ESSENTIAL PLAN ENROLLMENT BY COUNTY AND INSURER
EP Enrollees by County and Insurer -- Individual Marketplace
County # of Enrollees % of Enrollees
Albany Insurer 3,053 100%
Fidelis Care 1,381 45%
MVP Health Care 728 24%
Unitedhealthcare Community Plan 534 17%
WellCare of New York 410 13%
Allegany 490 100%
Fidelis Care 219 45%
YourCare Health Plan 208 42%
Univera Healthcare 63 13%
Bronx 42,383 100%
Healthfirst 15,077 36%
MetroPlus Health Plan 8,211 19%
Fidelis Care 6,024 14%
Unitedhealthcare Community Plan 3,269 8%
Affinity Health Plan 3,199 8%
WellCare of New York 2,992 7%
Empire Blue Cross Blue Shield HealthPlus 2,738 6%
EmblemHealth Essential Plan - HMO 873 2%
Broome 1,967 100%
Excellus BlueCross BlueShield 811 41%
Unitedhealthcare Community Plan 590 30%
Fidelis Care 566 29%
Cattaraugus 788 100%
Fidelis Care 408 52%
YourCare Health Plan 290 37%
Univera Healthcare 90 11%
Cayuga 862 100%
Fidelis Care 359 42%
Excellus BlueCross BlueShield 281 33%
Unitedhealthcare Community Plan 222 26%
Chautauqua 1,432 100%
Fidelis Care 821 57%
Unitedhealthcare Community Plan 253 18%
YourCare Health Plan 188 13%
Univera Healthcare 170 12%
Chemung 834 100%
Excellus BlueCross BlueShield 508 61%
Unitedhealthcare Community Plan 326 39%

Page 51 of 64
Chenango 562 100%
Fidelis Care 274 49%
Excellus BlueCross BlueShield 145 26%
Unitedhealthcare Community Plan 143 25%
Clinton 901 100%
Excellus BlueCross BlueShield 511 57%
Unitedhealthcare Community Plan 390 43%
Columbia 796 100%
Fidelis Care 576 72%
Unitedhealthcare Community Plan 220 28%
Cortland 569 100%
Fidelis Care 343 60%
Excellus BlueCross BlueShield 226 40%
Delaware 393 100%
Fidelis Care 279 71%
Excellus BlueCross BlueShield 114 29%
Dutchess 2,757 100%
MVP Health Care 1,305 47%
Unitedhealthcare Community Plan 765 28%
WellCare of New York 687 25%
Erie 8,708 100%
Independent Health 3,363 39%
Fidelis Care 2,525 29%
YourCare Health Plan 1,225 14%
Unitedhealthcare Community Plan 1,168 13%
Univera Healthcare 427 5%
Essex 423 100%
Fidelis Care 170 40%
Excellus BlueCross BlueShield 157 37%
Unitedhealthcare Community Plan 96 23%
Franklin 526 100%
Fidelis Care 278 53%
Excellus BlueCross BlueShield 248 47%
Fulton 654 100%
Fidelis Care 472 72%
Unitedhealthcare Community Plan 110 17%
Excellus BlueCross BlueShield 72 11%
Genesee 657 100%
Fidelis Care 271 41%
MVP Health Care 177 27%
Unitedhealthcare Community Plan 158 24%

Page 52 of 64
Univera Healthcare 51 8%
Greene 579 100%
Fidelis Care 387 67%
Unitedhealthcare Community Plan 192 33%
Hamilton 84 100%
Fidelis Care 60 71%
Excellus BlueCross BlueShield 24 29%
Herkimer 760 100%
Fidelis Care 417 55%
Excellus BlueCross BlueShield 343 45%
Jefferson 1,207 100%
Unitedhealthcare Community Plan 579 48%
Excellus BlueCross BlueShield 298 25%
Fidelis Care 234 19%
MVP Health Care 96 8%
Kings 79,365 100%
Healthfirst 21,944 28%
Fidelis Care 18,299 23%
MetroPlus Health Plan 12,360 16%
Unitedhealthcare Community Plan 10,100 13%
Empire Blue Cross Blue Shield HealthPlus 9,189 12%
WellCare of New York 2,842 4%
Affinity Health Plan 2,540 3%
EmblemHealth Essential Plan - HMO 2,091 3%
Lewis 426 100%
Fidelis Care 168 39%
Excellus BlueCross BlueShield 133 31%
Unitedhealthcare Community Plan 125 29%
Livingston 554 100%
Excellus BlueCross BlueShield 180 32%
MVP Health Care 167 30%
Unitedhealthcare Community Plan 115 21%
Fidelis Care 92
Madison 726 100%
Fidelis Care 318 44%
Excellus BlueCross BlueShield 221 30%
Unitedhealthcare Community Plan 187 26%
Monroe 8,317 100%
Excellus BlueCross BlueShield 3,811 46%
Unitedhealthcare Community Plan 1,830 22%
MVP Health Care 1,716 21%

Page 53 of 64
Fidelis Care 960
Montgomery 536 100%
Fidelis Care 427 80%
Excellus BlueCross BlueShield 109 20%
Nassau 20,292 100%
Healthfirst 4,620 23%
Unitedhealthcare Community Plan 4,403 22%
Fidelis Care 4,291 21%
Empire Blue Cross Blue Shield HealthPlus 4,072 20%
EmblemHealth Essential Plan - HMO 1,474 7%
Affinity Health Plan 1,432 7%
New York 25,630 100%
Healthfirst 8,673 34%
Fidelis Care 4,292 17%
MetroPlus Health Plan 3,402 13%
Empire Blue Cross Blue Shield HealthPlus 3,216 13%
Unitedhealthcare Community Plan 1,954 8%
Affinity Health Plan 1,738 7%
WellCare of New York 1,185 5%
EmblemHealth Essential Plan - HMO 1,170 5%
Niagara 2,141 100%
Fidelis Care 848 40%
Independent Health 669 31%
Unitedhealthcare Community Plan 555 26%
Univera Healthcare 69 3%
Oneida 2,537 100%
Fidelis Care 1,266 50%
Excellus BlueCross BlueShield 724 29%
Unitedhealthcare Community Plan 547 22%
Onondaga 4,696 100%
Excellus BlueCross BlueShield 1,936 41%
Unitedhealthcare Community Plan 1,528 33%
Fidelis Care 1,232 26%
Ontario 1,187 100%
Excellus BlueCross BlueShield 587 49%
MVP Health Care 252 21%
Unitedhealthcare Community Plan 252 21%
Fidelis Care 96 8%
Orange 4,304 100%
Fidelis Care 1,318 31%
Affinity Health Plan 1,140 26%
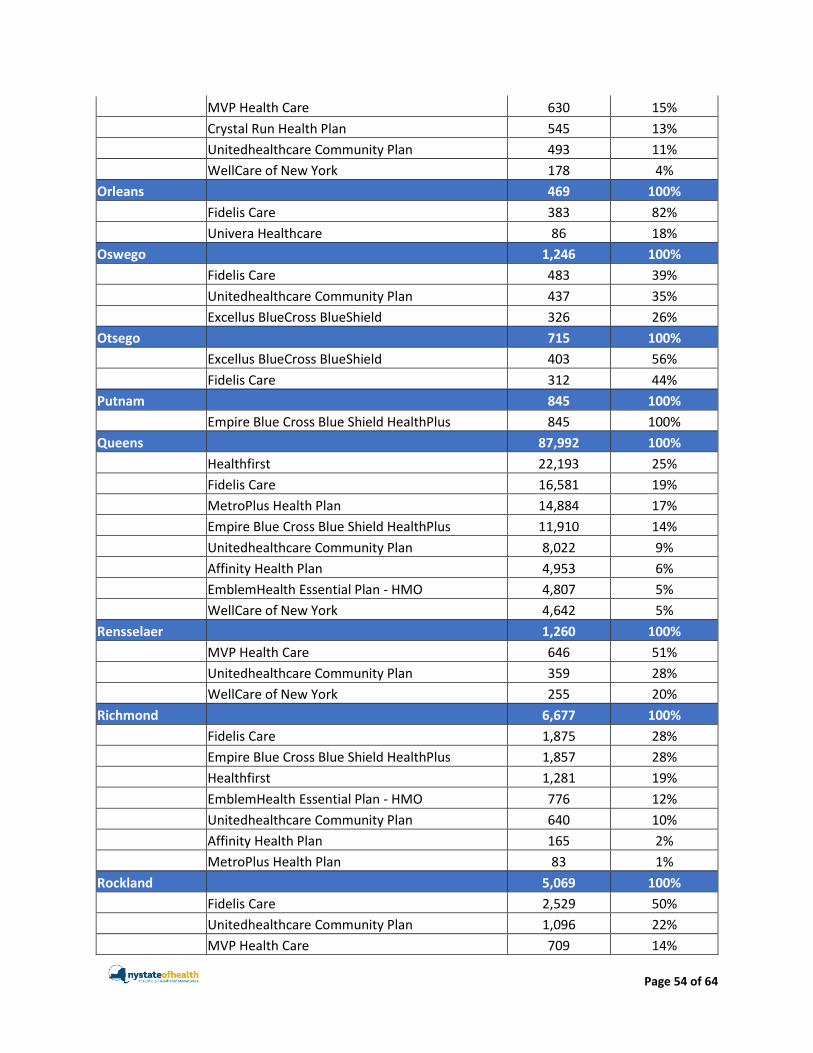
Page 54 of 64
MVP Health Care 630 15%
Crystal Run Health Plan 545 13%
Unitedhealthcare Community Plan 493 11%
WellCare of New York 178 4%
Orleans 469 100%
Fidelis Care 383 82%
Univera Healthcare 86 18%
Oswego 1,246 100%
Fidelis Care 483 39%
Unitedhealthcare Community Plan 437 35%
Excellus BlueCross BlueShield 326 26%
Otsego 715 100%
Excellus BlueCross BlueShield 403 56%
Fidelis Care 312 44%
Putnam 845 100%
Empire Blue Cross Blue Shield HealthPlus 845 100%
Queens 87,992 100%
Healthfirst 22,193 25%
Fidelis Care 16,581 19%
MetroPlus Health Plan 14,884 17%
Empire Blue Cross Blue Shield HealthPlus 11,910 14%
Unitedhealthcare Community Plan 8,022 9%
Affinity Health Plan 4,953 6%
EmblemHealth Essential Plan - HMO 4,807 5%
WellCare of New York 4,642 5%
Rensselaer 1,260 100%
MVP Health Care 646 51%
Unitedhealthcare Community Plan 359 28%
WellCare of New York 255 20%
Richmond 6,677 100%
Fidelis Care 1,875 28%
Empire Blue Cross Blue Shield HealthPlus 1,857 28%
Healthfirst 1,281 19%
EmblemHealth Essential Plan - HMO 776 12%
Unitedhealthcare Community Plan 640 10%
Affinity Health Plan 165 2%
MetroPlus Health Plan 83 1%
Rockland 5,069 100%
Fidelis Care 2,529 50%
Unitedhealthcare Community Plan 1,096 22%
MVP Health Care 709 14%

Page 55 of 64
Affinity Health Plan 508 10%
WellCare of New York 227 4%
Saratoga 1,913 100%
Fidelis Care 1,168 61%
MVP Health Care 745 39%
Schenectady 1,967 100%
Fidelis Care 1,337 68%
MVP Health Care 630 32%
Schoharie 296 100%
Fidelis Care 296 100%
Schuyler 269 100%
Fidelis Care 154 57%
Excellus BlueCross BlueShield 115 43%
Seneca 386 100%
Excellus BlueCross BlueShield 205 53%
Unitedhealthcare Community Plan 122 32%
Fidelis Care 59 15%
St. Lawrence 1,094 100%
Excellus BlueCross BlueShield 390 36%
Unitedhealthcare Community Plan 366 33%
Fidelis Care 338 31%
Steuben 1,107 100%
Fidelis Care 648 59%
Excellus BlueCross BlueShield 459 41%
Suffolk 24,223 100%
Unitedhealthcare Community Plan 7,434 31%
Fidelis Care 5,755 24%
Healthfirst 5,678 23%
EmblemHealth Essential Plan - HMO 2,771 11%
Affinity Health Plan 2,585 11%
Sullivan 1,050 100%
Fidelis Care 417 40%
MVP Health Care 403 38%
Crystal Run Health Plan 230 22%
Tioga 528 100%
Fidelis Care 242 46%
Excellus BlueCross BlueShield 162 31%
Unitedhealthcare Community Plan 124 23%
Tompkins 983 100%
Excellus BlueCross BlueShield 983 100%
Ulster 2,609 100%
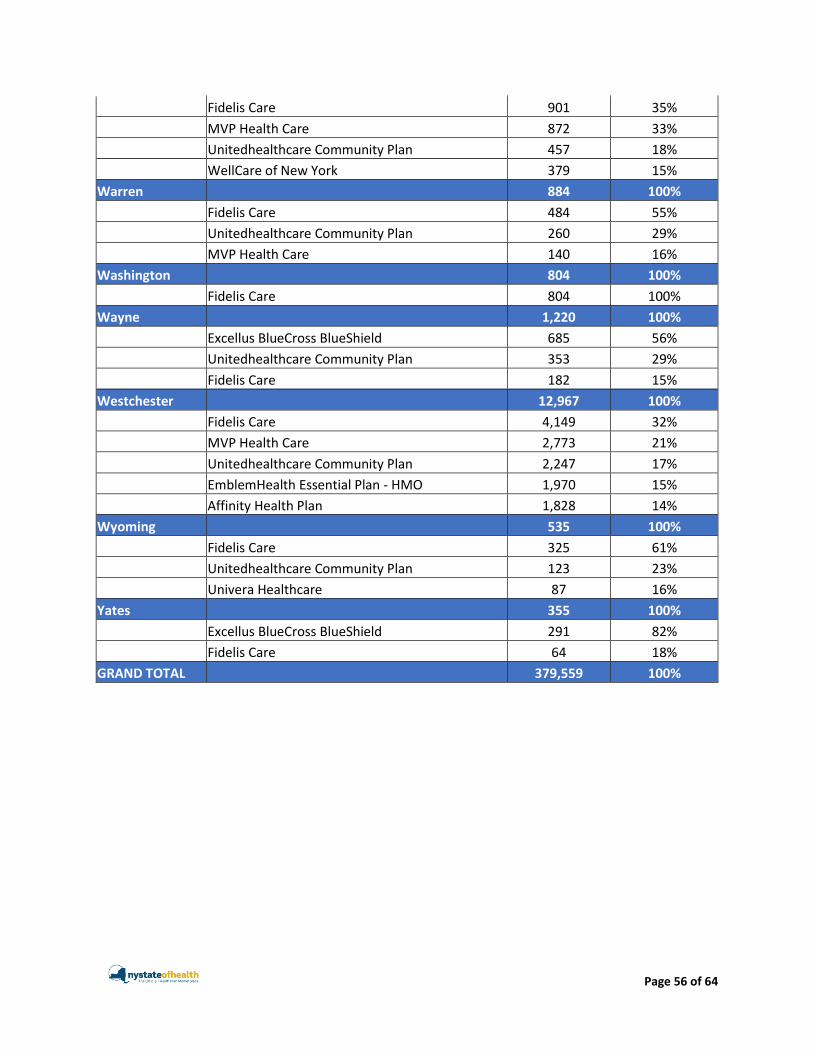
Page 56 of 64
Fidelis Care 901 35%
MVP Health Care 872 33%
Unitedhealthcare Community Plan 457 18%
WellCare of New York 379 15%
Warren 884 100%
Fidelis Care 484 55%
Unitedhealthcare Community Plan 260 29%
MVP Health Care 140 16%
Washington 804 100%
Fidelis Care 804 100%
Wayne 1,220 100%
Excellus BlueCross BlueShield 685 56%
Unitedhealthcare Community Plan 353 29%
Fidelis Care 182 15%
Westchester 12,967 100%
Fidelis Care 4,149 32%
MVP Health Care 2,773 21%
Unitedhealthcare Community Plan 2,247 17%
EmblemHealth Essential Plan - HMO 1,970 15%
Affinity Health Plan 1,828 14%
Wyoming 535 100%
Fidelis Care 325 61%
Unitedhealthcare Community Plan 123 23%
Univera Healthcare 87 16%
Yates 355 100%
Excellus BlueCross BlueShield 291 82%
Fidelis Care 64 18%
GRAND TOTAL 379,559 100%

Page 57 of 64
APPENDIX F: SHOP ENROLLMENT BY COUNTY AND INSURER – SMALL BUSINESS MARKETPLACE24
SHOP Enrollees by County and Insurer -- Small Business Marketplace
County # of Enrollees % of Enrollees
Albany Insurer 255 100%
CDPHP 148 58%
MVP Health Care 85 33%
BlueShield of Northeastern New York 17 7%
CareConnect 4 2%
Excellus BlueCross BlueShield 1 <1%
Allegany 17 100%
BlueCross BlueShield of Western New York 10 59%
Independent Health 7 41%
Bronx 140 100%
EmblemHealth 80 57%
CareConnect 42 30%
MetroPlus Health Plan 18 13%
Broome 268 100%
Excellus BlueCross BlueShield 267 >99%
CDPHP 1 <1%
Cattaraugus 88 100%
Independent Health 59 67%
BlueCross BlueShield of Western New York 26 30%
Univera Healthcare 3 3%
Cayuga 102 100%
Excellus BlueCross BlueShield 101 99%
MVP Health Care 1 <1%
Chautauqua 349 100%
BlueCross BlueShield of Western New York 141 40%
Independent Health 125 36%
Univera Healthcare 83 24%
Chemung 79 100%
Excellus BlueCross BlueShield 79 100%
Chenango 79 100%
Excellus BlueCross BlueShield 51 65%
MVP Health Care 20 25%
CDPHP 8 10%
Clinton 102 100%
24 There are a small number of individuals in the Small Business Marketplace who are enrolled in plans outside of the plan’s service area. In the Small Business Marketplace, plans are offered in the county of the employer’s primary address and the employees address. If a family selects a health plan in the Small Business Marketplace and has a dependent living in a different county, that dependent could be enrolled in a plan not available in his/her county.

Page 58 of 64
Excellus BlueCross BlueShield 90 88%
MVP Health Care 12 12%
Columbia 58 100%
CDPHP 23 40%
MVP Health Care 21 36%
BlueShield of Northeastern New York 14 24%
Cortland 62 100%
Excellus BlueCross BlueShield 61 98%
MVP Health Care 1 2%
Delaware 56 100%
Excellus BlueCross BlueShield 50 89%
CDPHP 5 9%
MVP Health Care 1 2%
Dutchess 205 100%
MVP Health Care 122 60%
CDPHP 79 39%
CareConnect 2 <1%
EmblemHealth 2 <1%
Erie 1,276 100%
Independent Health 729 57%
BlueCross BlueShield of Western New York 498 39%
Excellus BlueCross BlueShield 25 2%
Univera Healthcare 15 1%
MVP Health Care 6 <1%
CDPHP 3 <1%
Essex 34 100%
Excellus BlueCross BlueShield 18 53%
CDPHP 8 24%
MVP Health Care 8 24%
Franklin 49 100%
Excellus BlueCross BlueShield 48 98%
MVP Health Care 1 2%
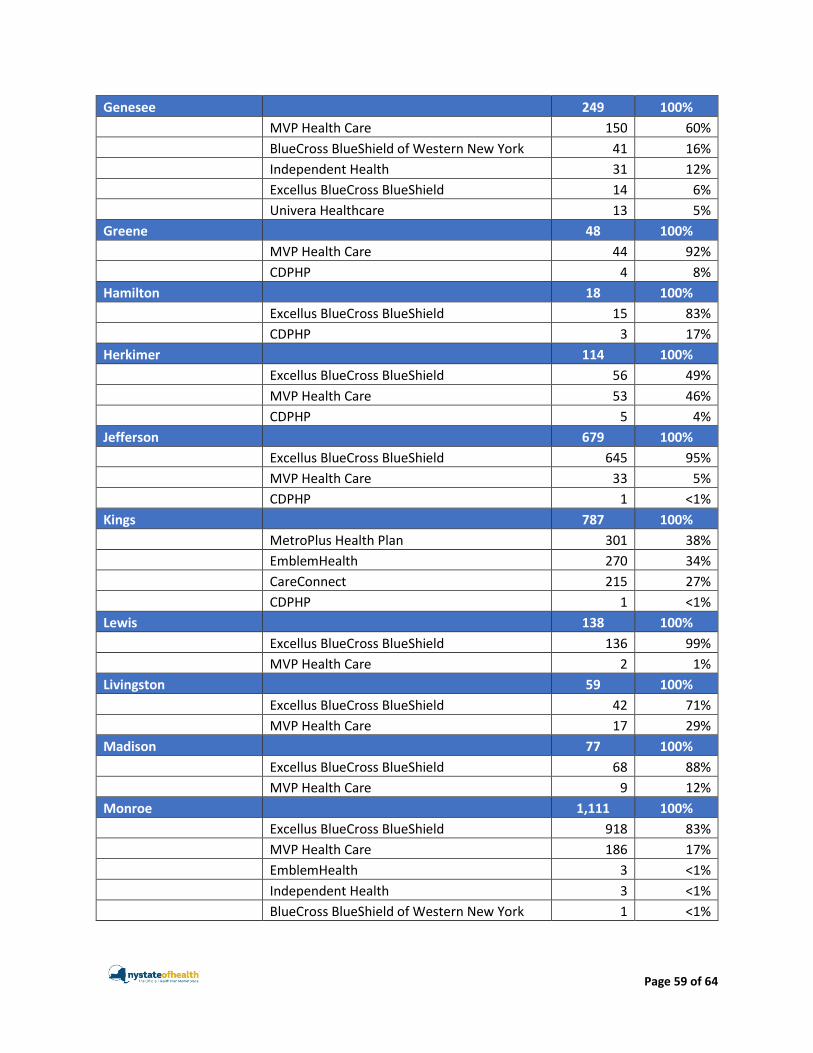
Page 59 of 64
Genesee 249 100%
MVP Health Care 150 60%
BlueCross BlueShield of Western New York 41 16%
Independent Health 31 12%
Excellus BlueCross BlueShield 14 6%
Univera Healthcare 13 5%
Greene 48 100%
MVP Health Care 44 92%
CDPHP 4 8%
Hamilton 18 100%
Excellus BlueCross BlueShield 15 83%
CDPHP 3 17%
Herkimer 114 100%
Excellus BlueCross BlueShield 56 49%
MVP Health Care 53 46%
CDPHP 5 4%
Jefferson 679 100%
Excellus BlueCross BlueShield 645 95%
MVP Health Care 33 5%
CDPHP 1 <1%
Kings 787 100%
MetroPlus Health Plan 301 38%
EmblemHealth 270 34%
CareConnect 215 27%
CDPHP 1 <1%
Lewis 138 100%
Excellus BlueCross BlueShield 136 99%
MVP Health Care 2 1%
Livingston 59 100%
Excellus BlueCross BlueShield 42 71%
MVP Health Care 17 29%
Madison 77 100%
Excellus BlueCross BlueShield 68 88%
MVP Health Care 9 12%
Monroe 1,111 100%
Excellus BlueCross BlueShield 918 83%
MVP Health Care 186 17%
EmblemHealth 3 <1%
Independent Health 3 <1%
BlueCross BlueShield of Western New York 1 <1%

Page 60 of 64
Montgomery 27 100%
BlueShield of Northeastern New York 10 37%
CDPHP 9 33%
MVP Health Care 8 30%
Nassau 518 100%
CareConnect 396 76%
EmblemHealth 102 20%
MetroPlus Health Plan 11 2%
MVP Health Care 8 2%
CDPHP 1 <1%
New York 1,281 100%
MetroPlus Health Plan 533 42%
EmblemHealth 513 40%
CareConnect 217 17%
MVP Health Care 12 <1%
CDPHP 6 <1%
Niagara 152 100%
Independent Health 111 73%
BlueCross BlueShield of Western New York 37 24%
Univera Healthcare 4 3%
Oneida 214 100%
Excellus BlueCross BlueShield 119 56%
MVP Health Care 95 44%
Onondaga 834 100%
Excellus BlueCross BlueShield 831 100%
MVP Health Care 3 <1%
Ontario 110 100%
Excellus BlueCross BlueShield 88 80%
MVP Health Care 22 20%
Orange 105 100%
MVP Health Care 81 77%
CDPHP 21 20%
EmblemHealth 3 3%
Orleans 132 100%
MVP Health Care 110 83%
Independent Health 14 11%
Excellus BlueCross BlueShield 8 6%

Page 61 of 64
Oswego 92 100%
Excellus BlueCross BlueShield 69 75%
MVP Health Care 23 25%
Otsego 60 100%
Excellus BlueCross BlueShield 30 50%
MVP Health Care 16 27%
CDPHP 12 20%
EmblemHealth 2 3%
Putnam 54 100%
MVP Health Care 53 98%
CDPHP 1 2%
Queens 462 100%
CareConnect 180 39%
EmblemHealth 180 39%
MetroPlus Health Plan 99 21%
MVP Health Care 2 <1%
CDPHP 1 <1%
Rensselaer 120 100%
CDPHP 63 53%
MVP Health Care 30 25%
BlueShield of Northeastern New York 27 23%
Richmond 39 100%
CareConnect 22 56%
EmblemHealth 16 41%
MetroPlus Health Plan 1 3%
Rockland 99 100%
EmblemHealth 67 68%
MVP Health Care 32 32%
Saratoga 148 100%
CDPHP 63 43%
MVP Health Care 51 34%
BlueShield of Northeastern New York 34 23%
Schenectady 42 100%
CDPHP 21 50%
BlueShield of Northeastern New York 13 31%
MVP Health Care 8 19%
Schoharie 8 100%
CDPHP 4 50%
BlueCross BlueShield of Western New York 2 25%
MVP Health Care 2 25%
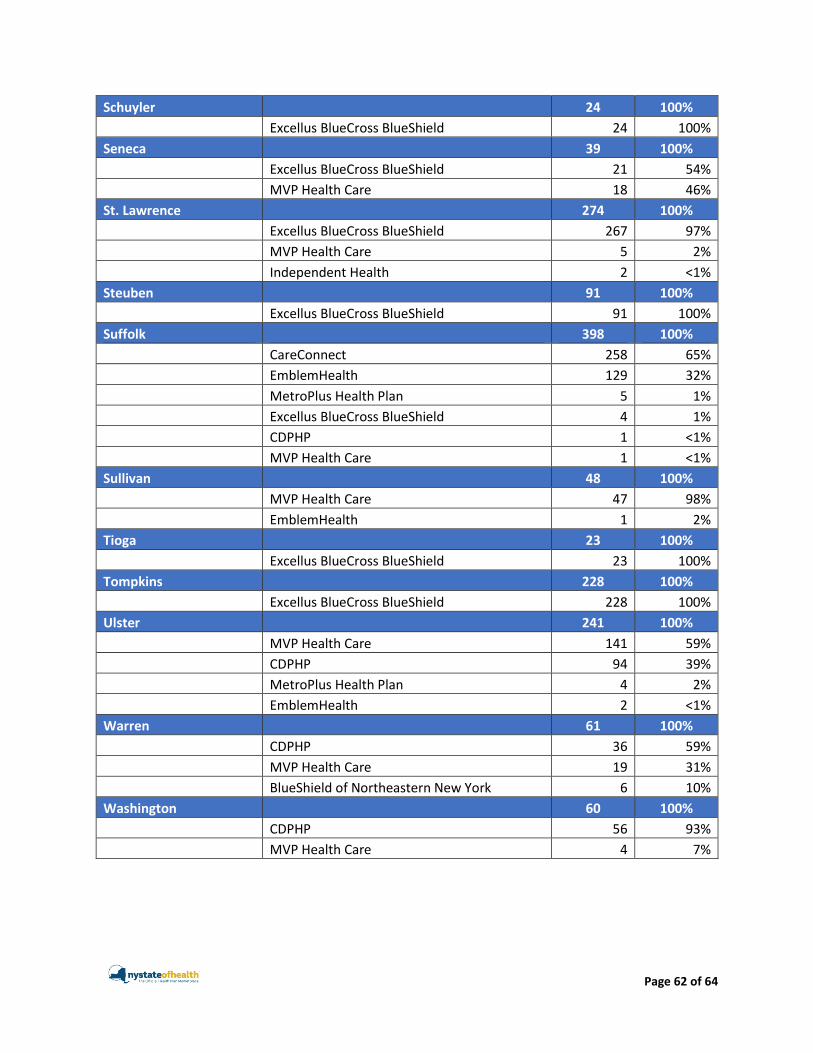
Page 62 of 64
Schuyler 24 100%
Excellus BlueCross BlueShield 24 100%
Seneca 39 100%
Excellus BlueCross BlueShield 21 54%
MVP Health Care 18 46%
St. Lawrence 274 100%
Excellus BlueCross BlueShield 267 97%
MVP Health Care 5 2%
Independent Health 2 <1%
Steuben 91 100%
Excellus BlueCross BlueShield 91 100%
Suffolk 398 100%
CareConnect 258 65%
EmblemHealth 129 32%
MetroPlus Health Plan 5 1%
Excellus BlueCross BlueShield 4 1%
CDPHP 1 <1%
MVP Health Care 1 <1%
Sullivan 48 100%
MVP Health Care 47 98%
EmblemHealth 1 2%
Tioga 23 100%
Excellus BlueCross BlueShield 23 100%
Tompkins 228 100%
Excellus BlueCross BlueShield 228 100%
Ulster 241 100%
MVP Health Care 141 59%
CDPHP 94 39%
MetroPlus Health Plan 4 2%
EmblemHealth 2 <1%
Warren 61 100%
CDPHP 36 59%
MVP Health Care 19 31%
BlueShield of Northeastern New York 6 10%
Washington 60 100%
CDPHP 56 93%
MVP Health Care 4 7%

Page 63 of 64
Wayne 82 100%
Excellus BlueCross BlueShield 81 99%
MVP Health Care 1 1%
Westchester 369 100%
CareConnect 219 59%
EmblemHealth 83 22%
MVP Health Care 51 14%
CDPHP 13 4%
MetroPlus Health Plan 3 <1%
Wyoming 287 100%
MVP Health Care 245 85%
BlueCross BlueShield of Western New York 28 10%
Independent Health 14 5%
Yates 3 100%
Excellus BlueCross BlueShield 3 100%
GRAND TOTAL 13,224 100%

Page 64 of 64
Appendix G: Numbers of Calls Answered by Language
Language Calls Answered
# of Calls % of Calls
English 1,062,939 80%
Spanish 192,155 14%
Mandarin 28,794 2%
Russian 16,038 1%
Cantonese 11,507 1%
Haitian Creole 10,829 1%
Other 7,381 <1%
TOTAL Calls Answered 1,329,643 100%
Language # of Calls Language # of Calls Language # of Calls
Bengali 1,512 Ukrainian 25 Tigrinya 5
Arabic 1,039 Hungarian 23 Bulgarian 4
Korean 818 Romanian 23 Ilocano 4
French 417 Yiddish 18 Krio 4
Polish 379 Tamil 17 Lingala 4
Hindi 378 Amharic 16 Macedonian 4
Urdu 324 Fula 16 Sinhalese 4
Albanian 257 Karenni 16 Yoruba 4
Nepali 245 Mandinka 16 Malay 3
Vietnamese 231 Georgian 14 Sorani 3
Burmese 143 Pashto 14 Taiwanese 3
Punjabi 143 Laotian 13 Chuukese 2
Italian 137 Bambara 12 Hakka-Chinese 2
Japanese 118 Dari 12 Kinyarwanda 2
Portuguese 117 Swahili 12 Azerbaijani 1
Karen 100 Armenian 9 Czech 1
Turkish 94 Chin 9 German 1
Farsi 65 Mongolian 9 Hmong 1
Greek 58 Serbian 9 Khana 1
Bosnian 46 Igbo 8 Krahn 1
Akan 43 Slovak 8 Kunama 1
Hebrew 39 Telugu 8 Luganda 1
Fuzhou 37 Soninke 7 Maay 1
Tagalog 36 Toishanese 7 Mam 1
Malayalam 35 Wolof 7 Marathi 1
Somali 33 Cambodian 6 Marshallese 1
Uzbek 33 Croatian 6 Navajo 1
Thai 31 Fukienese 6 Oromo 1
Gujarati 29 Indonesian 6
Tibetan 25 Moroccan Arabic 5
TOTAL 7,381


