New York, NY Updated as of October 22, 2007 NYC DEP Bureau of Customer Services (BCS) Best Practices Customer Service Model Design Project Report January 2007 - October 2007 This document is confidential and is intended solely for the use and information of the client to whom it is addressed.
Transcript
New York, NYUpdated as of October 22, 2007
NYC DEP Bureau of Customer Services (BCS) Best Practices Customer Service Model Design Project Report
January 2007 - October 2007
This document is confidential and is intended solely for the use and information of the client to whom it is addressed.
2 2
Table of Contents
BCS Project Overview
Customer Service
Revenue Collection
Systems and Technology
Organizational Design and Next Steps
P. 3 – 9
P. 10 – 47
P. 48 – 78
P. 79 – 96
P. 97 - 111
3 3
Introduction
The Bureau of Customer Service (BCS) plays a vital role as the interface between DEP and the city’s 826,000 account holders, whose payments support the entire water and wastewater enterprise. Historically, this relationship has been plagued by poor access to customer service assistance, an inability to resolve disputes promptly, high numbers of estimated bills and lack of adequate enforcement techniques. As a result, DEP’s collection rate has been below that of other large cities, and a large accounts receivable balance has accumulated over the years.
Within the last 18 months, DEP launched a complete overhaul of BCS operations, beginning with immediate customer service improvements, such as extending hours for the telephone call center and dramatically reducing the average customer wait time. DEP also laid the planning and procurement groundwork needed for longer-term projects, such as the City’s conversion to automated meter reading (AMR) – a system that will provide more accurate and comprehensive usage information to DEP customers and dramatically reduce the need for estimated bills.
BCS transformation will continue with the analysis and recommendations contained in this report by Booz Allen Hamilton, some of which are currently being implemented (e.g., Payment Incentive Program, service termination and high-volume outbound calling pilots, and internal standard operating procedures development, among others). DEP engaged Booz Allen in January 2007 to conduct an extensive analysis of current BCS operations, systems and processes compared to the best practices of other large water utilities. The most ambitious and intensive component of this work was to analyze issues and barriers to timely resolution of billing disputes and revenue collection.
Project Overview
CustomerService
Revenue Collection
Organizational Design andNext Steps
Systems andTechnology
4 4
Introduction (cont.)
This report is divided into four sections: Customer Service, Revenue Collection, Systems and Technology, and Future Organization and Next Steps. Each section contains an overview of relevant issues, analysis, key observations and specific recommendations. The report will serve as a tool for DEP managers, shaping the transformation of every major operating and customer service system used by the bureau.
In conducting this study, Booz Allen observed many opportunities within BCS to build on a dedicated staff and changes already underway. One example is DEP’s automatic meter reading (AMR) system. DEP began piloting AMR this summer and will start installing the system this fall to continue transforming the customer service experience. AMR will improve both the accuracy of data collected and the ways in which that account information – from water consumption to utility charges – is provided to the customer.
Booz Allen also noted several areas that need to be completely redesigned. One such area is collections strategies. BCS does not currently have available enforcement tools that are standard in other parts of the country and correlate directly to a much higher collection rate.
Project Overview
CustomerService
Revenue Collection
Organizational Design andNext Steps
Systems andTechnology
5 5
The Bureau of Customer Services (BCS) is one of 10 bureaus and offices within the Department of Environmental Protection
The Department of Environmental Protection’s (DEP) mission is to promote public health, by providing clean water, managing the effects of storm water and removing wastewater safely. DEP also provides stewardship of other critical environmental issues, such as air, noise and hazardous waste
Sources: New York City Department of Environmental Protection Website (http://www.ci.nyc.ny.us/html/dep/home.html), Strategic BCS Workplan (2007)
Commissioner
First Deputy Commissioner
Bureau of Env.Planning
& Analysis
Bureau ofEngineering,
Design &Construction
Bureau of Water Supply
Bureau of Water& Sewer Operations
Bureau ofWastewater Treatment
Bureau ofCustomer Service
Office ofInformation Technology
Chief ofStaff
Office of Environmental
Health and Safety
Office of GeneralCounsel
Bureau of Communications &Intergovernmental
Affairs
Bureau of Environmental
Compliance
DEP Bureaus and Offices
Project Overview
CustomerService
Revenue Collection
Organizational Design andNext Steps
Systems andTechnology
6 6
BCS is transforming its vision, strategy and day-to-day operations using a Best Practices Customer Service Model
Project Overview
CustomerService
Revenue Collection
Organizational Design andNext Steps
Systems andTechnology
BCS is transforming into a customer-focused organization that uses state of the art technology and business practices to accurately and clearly bill and collect from 826,000 water and sewer account holders
Objectives:– World-class customer service– Efficient collection of revenue– Effective promotion of water conservation
Reflected in this report is significant analysis that will allow DEP to:– Correct outdated account information – Settle outstanding account balances – Begin supplying better information to customers
This effort will include the introduction of a new billing system and culminate in the installation of AMR within the next few years – both of which are critical to improving BCS infrastructure and providing good customer service
7 7
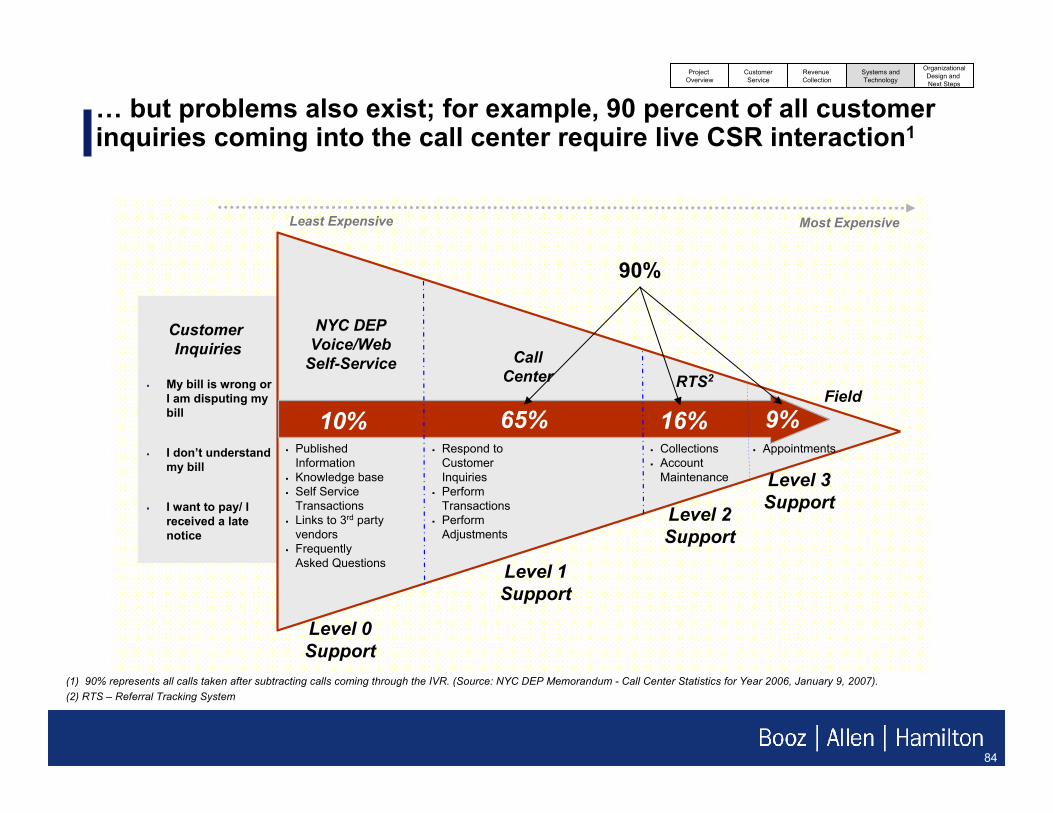
Already, BCS has achieved significant customer service milestones and increased customer access
The BCS Call Center, which handles 85 percent of customer inquiries, has been significantly overhauled– Already, there has been more than a 95 percent reduction in average call wait time
(currently at nine seconds)– Call Center hours extended– Staff reorganized and retrained
There has also been a 41 percent reduction in response time for written correspondence
BCS has launched successful collection program pilots
BCS is coordinating across multiple city agencies to verify existing data and acquire missing data
Project Overview
CustomerService
Revenue Collection
Organizational Design andNext Steps
Systems andTechnology
8 8
As part of transformation, BCS is implementing several customer-focused initiatives, such as a self-service Web site, AMR, a new billing system and more
Project Overview
CustomerService
Revenue Collection
Organizational Design andNext Steps
Systems andTechnology
FY 2008 FY 2009 FY 2010 FY 2011FY 2007TODAY
FY 2006
Engaged Booz Allen to Help Build a
Best Practices
Model
Revamped DEP
Web Site Access
and Tools
AMR Implementation
New Billing
System and
Revised Bill
Implementation of Stringent Enforcement
Options
AMR Pilot
Launch
Launched Outreach Sessions
Launched Billing Spike Notifications
Improved Customer Contact
Information
Implementation of Customer-
Focused Organization
Work Order Automated
Tracking and Routing System
9 9
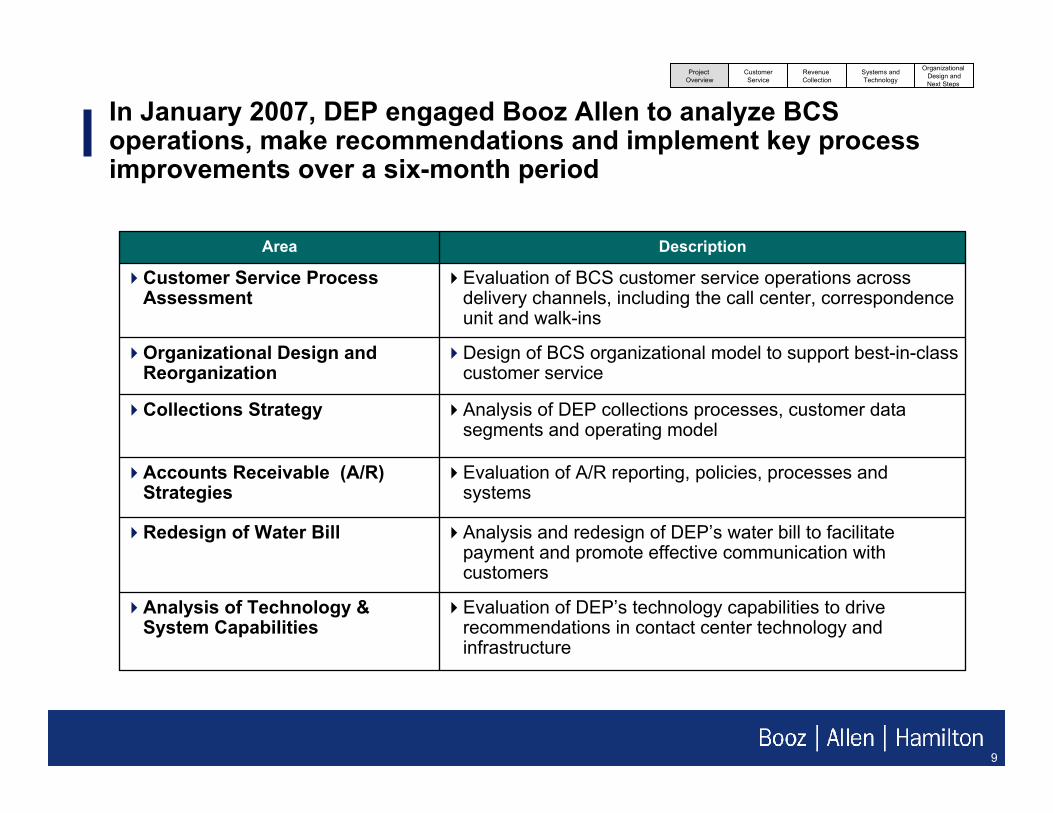
In January 2007, DEP engaged Booz Allen to analyze BCS operations, make recommendations and implement key process improvements over a six-month period
Project Overview
CustomerService
Revenue Collection
Organizational Design andNext Steps
Systems andTechnology
Evaluation of BCS customer service operations across delivery channels, including the call center, correspondence unit and walk-ins
Customer Service Process Assessment
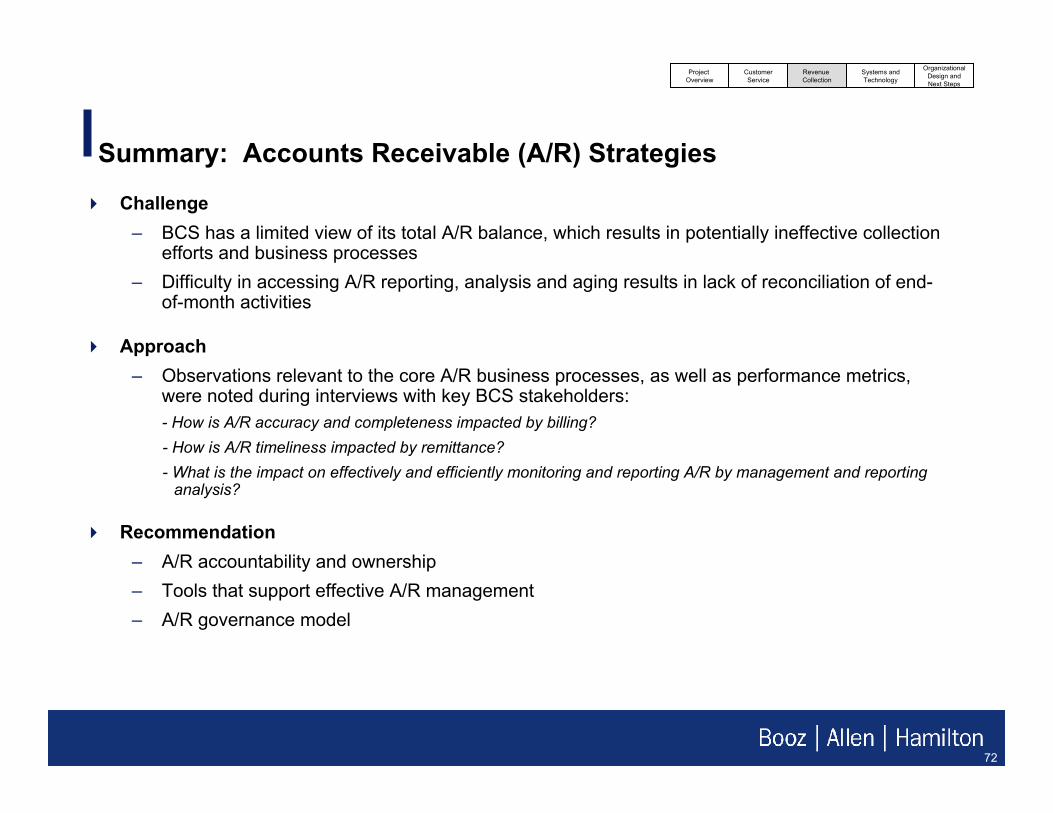
Evaluation of A/R reporting, policies, processes and systems
Accounts Receivable (A/R) Strategies
Evaluation of DEP’s technology capabilities to drive recommendations in contact center technology and infrastructure
Analysis of Technology & System Capabilities
Analysis and redesign of DEP’s water bill to facilitate payment and promote effective communication with customers
Redesign of Water Bill
Analysis of DEP collections processes, customer data segments and operating model
Collections Strategy
Description
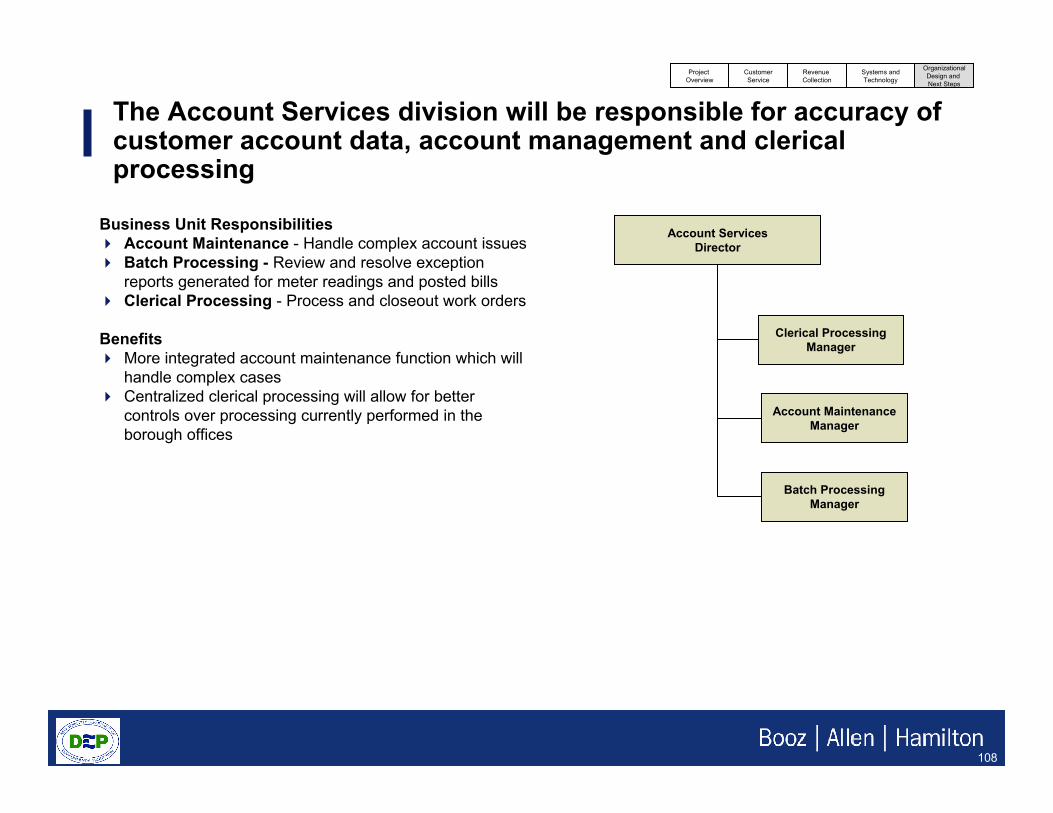
Design of BCS organizational model to support best-in-class customer service
Organizational Design and Reorganization
Area
10 10
Section 1: Customer Service
11 11
Customer Service is the cornerstone of BCS transformation; improving it will be key to creating a more effective organization
By building on the work already underway as well as the recommendations in this report, BCS can be more effective in deploying customer relationship management. BCS can improve customer communication and all of the channels that support it. BCS customer communications channels include the telephone (in-person assistance and recorded messages); borough-based, customer assistance walk-in centers; the Web and annual/quarterly bills currently sent via mail. Customers rely on these delivery channels to proactively receive information from DEP and resolve service and billing issues.
All of these channels have been or are currently being redesigned, as are the information systems that will allow DEP to make customer communication more effective. The foundation of this effort is AMR. AMR will help DEP obtain and provide more accurate information to customers. Since AMR is already underway, all new systems will be made compatible with it. For example, within the next few years, DEP will launch a new Customer Information System, which will provide more flexibility, including proactive communications with customers who might have billing issues. Together, these systems will allow DEP to introduce a new bill for customers and later, move from quarterly to monthly billing. Monthly billing will be more convenient for customers (e.g., household or business budgeting purposes) and help highlight discrepancies or issues before they become major problems.
Improving the quality and scope of BCS information systems and customer data will enhance and streamline service channels, maximize the efficiency of billing resolution, and encourage increased customer payment and responsiveness. Improved customer channels will also create a stronger understanding of the relationship between water/sewer bills and effective delivery of water/sewer services.
Project Overview
CustomerService
Revenue Collection
Organizational Design andNext Steps
Systems andTechnology
12 12
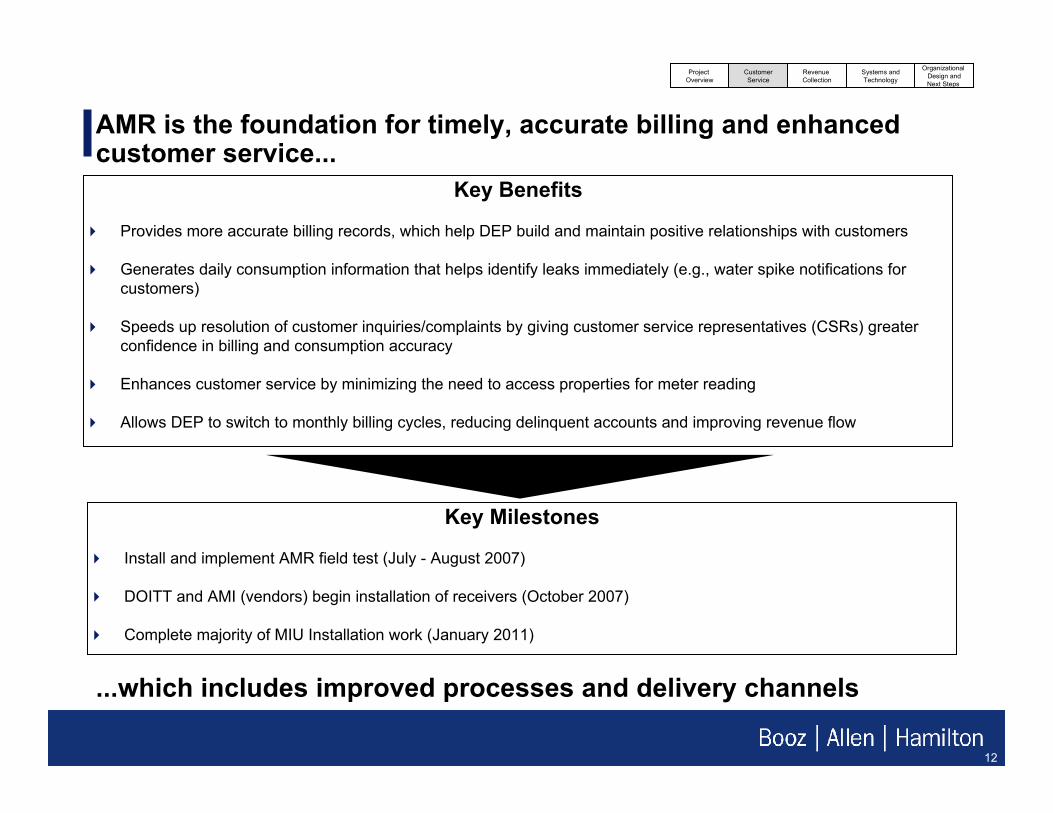
AMR is the foundation for timely, accurate billing and enhanced customer service...
Key Benefits
Provides more accurate billing records, which help DEP build and maintain positive relationships with customers
Generates daily consumption information that helps identify leaks immediately (e.g., water spike notifications for customers)
Speeds up resolution of customer inquiries/complaints by giving customer service representatives (CSRs) greater confidence in billing and consumption accuracy
Enhances customer service by minimizing the need to access properties for meter reading
Allows DEP to switch to monthly billing cycles, reducing delinquent accounts and improving revenue flow
Key Milestones
Install and implement AMR field test (July - August 2007)
DOITT and AMI (vendors) begin installation of receivers (October 2007)
Complete majority of MIU Installation work (January 2011)
Project Overview
CustomerService
Revenue Collection
Organizational Design andNext Steps
Systems andTechnology
...which includes improved processes and delivery channels
13 13
Summary: Customer Service Process Assessment ImprovementChallenges
– Formal mechanisms and integrated planning—to align strategic vision, resource allocation and system development—do not exist
– Operational processes are not fully documented and accessible to BCS staff. Policies and procedures are subject to interpretation and executed inconsistently by customer service representatives (CSR) and other staff, depending on location or business unit
– BCS’ current training program does not address CSRs’ professional development, which makes it difficult for CSRs to meet customers’ changing needs
– BCS does not consistently track and measure key performance indicators
Approach– The Operation Process Assessment and Improvement task identified challenge areas for DEP to tackle to
improve customer service across all delivery channels– Focus: What tactical and strategic measures can be implemented in the short- and long-term, to improve BCS
operational processes?
Recommendations– Develop a strategic vision that is aligned to BCS’ mission and direction, and builds the foundation for a
customer-focused organization– Optimize internal processes for business unit support and prioritization in daily operations, including clearly
defined roles and responsibilities for all staffing levels, workforce management tools and methodology, IT, operations and change management governance processes, and training
– Integrate quality assurance measures that are aligned to BCS customer service goals
Project Overview
CustomerService
Revenue Collection
Organizational Design andNext Steps
Systems andTechnology
14 14
To align BCS operations with superior customer service models, Booz Allen performed Operational Process Assessment and Improvement (OPAI)
Reviewed existing processes and operations, and identified systemic weaknesses
Established a vision for BCS that is consistent with industry best practices and the DEP mission
Recommended specific changes or process adjustments to help BCS achieve its vision in both the short and long term
Project Overview
CustomerService
Revenue Collection
Organizational Design andNext Steps
Systems andTechnology
15 15
As part of OPAI, Booz Allen comprehensively analyzed existing BCS operations and processes
Reviewed BCS operations and current service delivery model– Documentation to understand existing BCS operations for all service delivery channels; e.g., call
center, correspondence, Web site/email and walk-in borough offices– Existing customer service programs—such as quality assurance, training, workforce management
and performance management—for each service delivery channel– Current service delivery model across all channels, including the overall BCS strategic vision and
performance metrics
Conducted process review and overall assessment of as-is BCS human resources and staffing– Workforce management models such as call center staffing levels and staffing methodology – Knowledge management system and process for training and information dissemination– Training/career development program (e.g., initial new hire training/orientation, employee
development and ongoing training, quality assurance integration/modular approach)
Documented DEP processes, methods and procedures for customer handling– Skills-based routing and workflow within various customer-facing business units– Operational process mapping across all service delivery channels– Quality assurance and quality control programs – Training integration and feedback mechanisms
Project Overview
CustomerService
Revenue Collection
Organizational Design andNext Steps
Systems andTechnology
16 16
For example, Booz Allen assessed anticipated future needs and drivers to identify opportunities and operational recommendations for improving each delivery channel
Call CenterCall Center
Changes in Rates and New ProgramsChanges in Rates
and New Programs
Process Redesign to
Increase Coordination & Collaboration
Process Redesign to
Increase Coordination & Collaboration
Greater Internal Performance
Metrics Required for
Customer Handling
Greater Internal Performance
Metrics Required for
Customer Handling
Documented and
Disseminated Standard Operating
Procedures
Documented and
Disseminated Standard Operating
Procedures
Areas of Opportunity
Future Scenario Drivers
Delivery Channels Examined
Process Improvements
to Reduce Workload
Process Improvements
to Reduce Workload
Web based/ Email
Web based/ Email
Further Automation of Processes
Further Automation of Processes
Community NeedsCommunity Needs
BoroughWalk InCenter
BoroughWalk InCenter
CollectionsCollections
Timing of Commitments
and Obligations
Timing of Commitments
and Obligations
Facilitation to Achieve
Organizational Excellence
Goals
Facilitation to Achieve
Organizational Excellence
Goals
CorrespondenceCorrespondence
Customer-Facing Impact Internal Optimization
Project Overview
CustomerService
Revenue Collection
Organizational Design andNext Steps
Systems andTechnology
17 17
OPAI followed a specific framework to focus on customer-centric delivery channels and service
1. StrategyA clear vision, strategy and commitment to making excellent customer service, aligned with the organization’s values
3. Process, Methods & ProceduresStreamlined processes that facilitate the delivery of customer service
4. TechnologySystems and IT tools that
provide information access tailored to customer needs
2. Human CapitalHuman resources are
appropriately organized, skilled, motivated and empowered to deliver
quality customer service
Customer
Technology– Data– Applications– Technology
Infrastructure – Performance
Management
Processes– Activities and
Tasks– Sequence– Rules– Targets and
Outputs
Human Capital– Organization
Structure and Design
– Human Capital Management
Workforce PlanningLeadershipTraining and DevelopmentReward SystemsDiversityRecruiting
Strategy– Customer
Profiling and Segmentation
– Industry and Market Analysis
– Benchmarking and Best Practices
Project Overview
CustomerService
Revenue Collection
Organizational Design andNext Steps
Systems andTechnology
18 18
The goal of this task was to develop an integrated customer services organization that could help DEP prepare for upcoming challenges
A key element of this preparation is the vision that BCS will meet or exceed customer expectations as measured by:– A high degree of first contact resolution by a knowledgeable and well-trained,
front-line staff member– An enhanced dispute resolution process that makes it “easier to do business with DEP”
and enables efficient collection of past-due revenue– Standardized inquiry resolution process across all service delivery channels– Efficient utilization of staff by appropriately applying skills-based workflows– Service level- and key performance indicator-driven performance measurement
This vision requires comprehensive changes to three key components1 within the BCS approach:– Strategy– Process– Human capital
Project Overview
CustomerService
Revenue Collection
Organizational Design andNext Steps
Systems andTechnology
(1) Technology (component four) is covered in the Systems and Technology section of this report.
19 19
Through OPAI, Booz Allen identified several challenge areas thatsignificantly impact customer service across all delivery channels
Performance Metrics
Strategic Vision
Delivery Channels
Training
Roles and Responsibilities
Knowledge Management
Staffing and Planning
Quality Monitoring
Reporting
Customer Self-Help
Skills-Based Routing and Work Flow
Operational Process Mapping
Strategy
Human Capital
Process, Methods & Procedures
Re-engineering or enhancing key supporting processes
can yield improvements for several components across
BCS business units
*In depth technology assessment was provided in the Task 3 work stream. High level organizational design is addressed in the Task 1 work stream.
1. Strategy
A clear vision, strategy and commitment to making excellent member service, aligned with member values, the company standard
3. Process, Methods & Procedures
Streamlined processes that facilitate the delivery of quality member service
4. Technology *
Tools that provide information access tailored to member
needs
2. Human Capital
Human resources are appropriately organized,
skilled, motivated and empowered to deliver
quality member service
Cultureshift
Customer
Ability to change
The OPAI assessment of key BCS components
Project Overview
CustomerService
Revenue Collection
Organizational Design andNext Steps
Systems andTechnology
20 20
BCS transformation can be enhanced by realigning operational processes for strategy, human capital, and process, methods and procedures
Strategy
Human Capital
Process, Methods & Procedures
Key actionable areas for growth include:Standard operating procedures that are uniform, clearly understood, documented, disseminated and accessible
Enhanced customer self-help that enables customer self service and promotes call avoidance through intelligent call routing and scripting (IVR), as well as corresponding Web site enhancements
Quality monitoring program to ensure a closed feedback loop
Training program for new hires and ongoing staff development
Workforce management process that accurately predicts staffing needs
Defined roles and responsibilities for staff, supervisors and managers, including integrated quality assurance procedures
Performance metrics to benchmark success
Management reporting dashboard to give supervisors a “quick glance” overview of BCS activity
Standard Operating Procedures,Process Mapping, and
Knowledge Management
StrategicVision
Customer Facing Impact
Internal Optimization
Management Reporting
21 21
Among business units, no clear consensus on DEP strategic vision, utilization of service delivery channels and performance metricsexists
BCS’ organizational structure, operational processes and performance metrics are not aligned to ensure optimal service delivery to the customer – Communication across delivery channels is limited; BCS
business units operate in silo structure– Browser Applications (BAPPS) tool was developed by
OIT to provide single system for customer handling and billing; however, inconsistencies in interpretation, process and training result from lack of synchronization across units
– Formal mechanism for integrated resource allocation and system development planning does not exist
BCS does not have an established, strategic and effectively communicated vision for delivery of comprehensive customer service
No clear consensus on which metrics are important to defining BCS’ customer service strategy– Established metrics for successful review and
assessment of department performance are not internally publicized and consistent
Summary of Key Findings
Delivery Channels
Strategic Vision
Performance Metrics
Project Overview
CustomerService
Revenue Collection
Organizational Design andNext Steps
Systems andTechnology
Strategy
22 22
Workforce and knowledge management processes and procedures are ad hoc, lacking comprehensive definition or utilization
Workforce management is manually performed by staff– Management does not utilize forecasting and scheduling
technology – CSR schedule adherence, compliance and occupancy is not
formally tracked– Established, proactive plan for CSR recruitment, attrition and hiring
is not currently in place resulting in subsequent negative impact on staffing pipeline
Knowledge management practices to institutionalize staff best practices and standardize knowledge are limited– Customer handling procedures are not consistent across delivery
channels, or even within delivery channels– Utilization of current documentation management program
(WebEx) for tracking customer correspondence varies– Availability of templates and reference documentation through the
Document Management System (DMS) is very limited. There is a current initiative to increase the number of available templates; however, a formal process for identifying and addressing template needs has not been established
– Standardized call scripts are not available for CSR use
Summary of Key Findings
Staffing & Planning
KnowledgeManagement
Project Overview
CustomerService
Revenue Collection
Organizational Design andNext Steps
Systems andTechnology
Human Capital
23 23
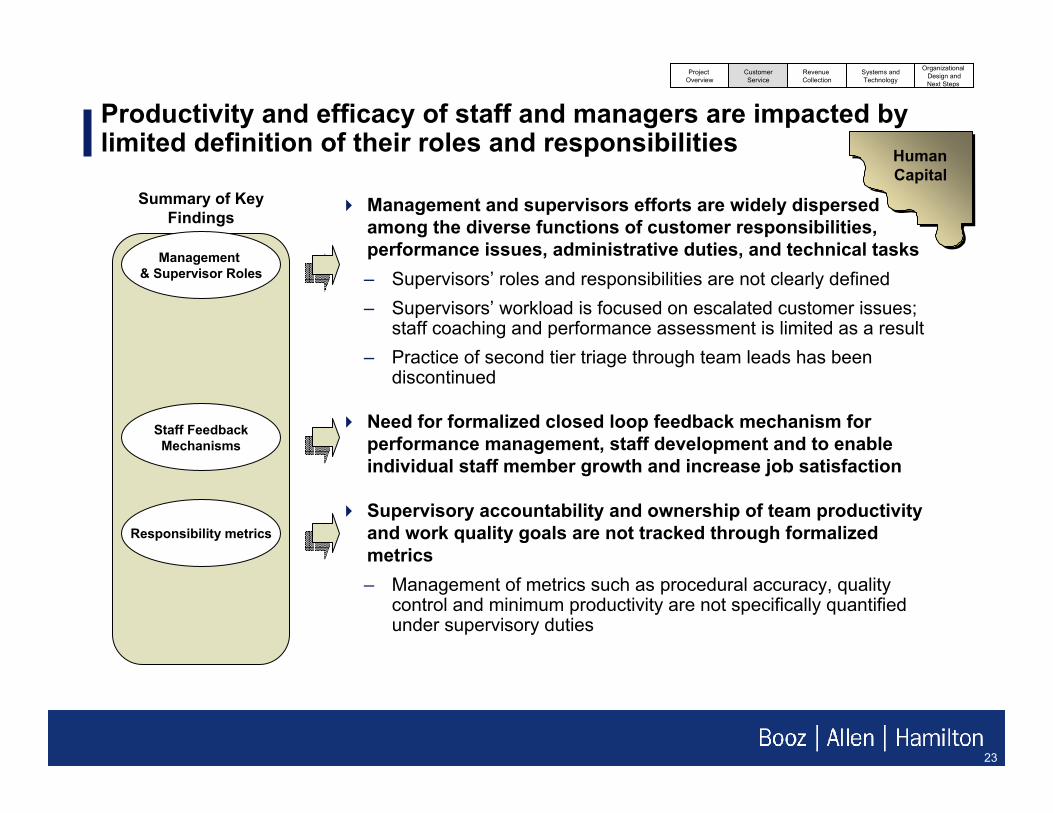
Productivity and efficacy of staff and managers are impacted by limited definition of their roles and responsibilities
Management and supervisors efforts are widely dispersed among the diverse functions of customer responsibilities, performance issues, administrative duties, and technical tasks– Supervisors’ roles and responsibilities are not clearly defined– Supervisors’ workload is focused on escalated customer issues;
staff coaching and performance assessment is limited as a result– Practice of second tier triage through team leads has been
discontinued
Need for formalized closed loop feedback mechanism for performance management, staff development and to enable individual staff member growth and increase job satisfaction
Supervisory accountability and ownership of team productivity and work quality goals are not tracked through formalized metrics– Management of metrics such as procedural accuracy, quality
control and minimum productivity are not specifically quantifiedunder supervisory duties
Summary of Key Findings
Management & Supervisor Roles
Responsibility metrics
Staff FeedbackMechanisms
Project Overview
CustomerService
Revenue Collection
Organizational Design andNext Steps
Systems andTechnology
Human Capital
24 24
Ongoing and new hire training does not address employee development or provide an effective feedback loop across BCS
New hire training consists of both classroom and experiential modules– Standard curriculum, training and timelines do not exist for
new hires
Ongoing training opportunities for staff are limited– Continuous training modules for staff, supervisors and new
managers have not been established– Changes to processes and technology are not formally
disseminated to staff through training modules
Pathway for career development is undefined – Hierarchy for career progression, including staff and supervisors’
roles and responsibilities, is not established in or between business units
– Defined metrics for training success, such as formal mechanisms to assess competency levels, are not established
Issues identified in quality assurance (QA) review are not formally integrated into the training process– Issues identified by QA as systemic are addressed with staff on
an individual, rather than team, bureau and/or department level
Summary of Key Findings
New HireTraining
Ongoing Training
Metrics for Training/Career Success
Integration of Training/Quality Assurance
Project Overview
CustomerService
Revenue Collection
Organizational Design andNext Steps
Systems andTechnology
Human Capital
25 25
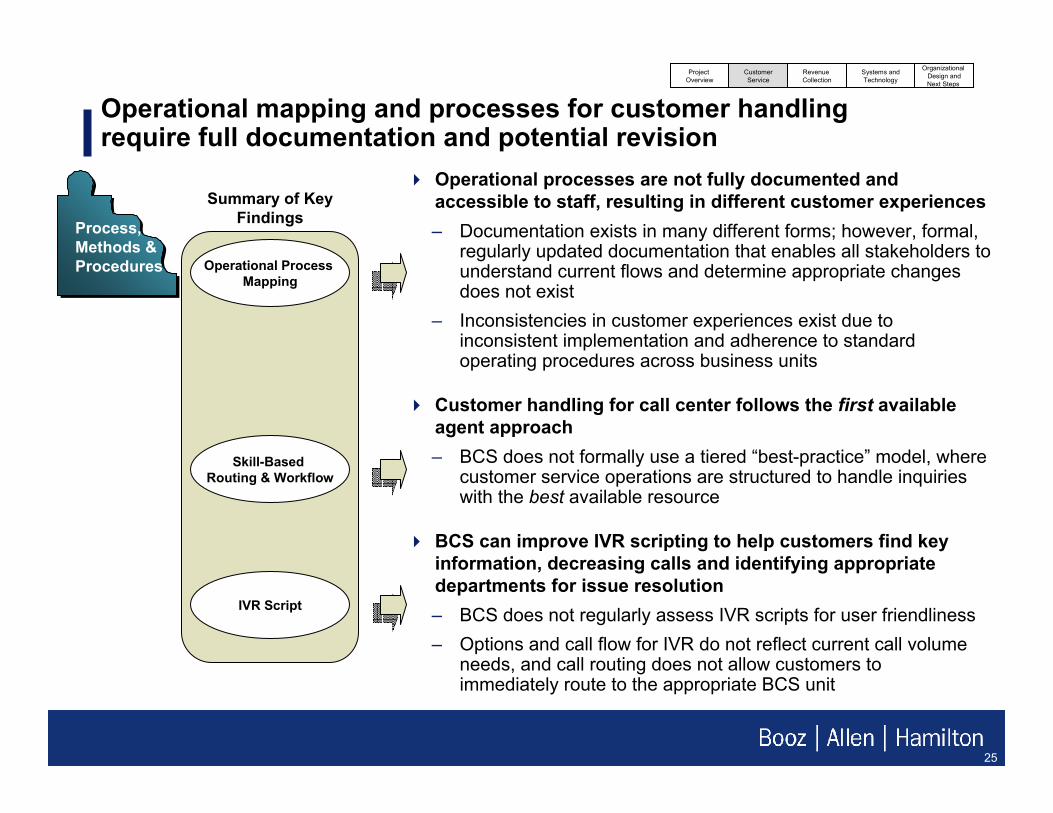
Operational mapping and processes for customer handling require full documentation and potential revision
Operational processes are not fully documented and accessible to staff, resulting in different customer experiences– Documentation exists in many different forms; however, formal,
regularly updated documentation that enables all stakeholders tounderstand current flows and determine appropriate changes does not exist
– Inconsistencies in customer experiences exist due to inconsistent implementation and adherence to standard operating procedures across business units
Customer handling for call center follows the first available agent approach– BCS does not formally use a tiered “best-practice” model, where
customer service operations are structured to handle inquiries with the best available resource
BCS can improve IVR scripting to help customers find key information, decreasing calls and identifying appropriate departments for issue resolution– BCS does not regularly assess IVR scripts for user friendliness– Options and call flow for IVR do not reflect current call volume
needs, and call routing does not allow customers to immediately route to the appropriate BCS unit
Summary of Key Findings
Operational Process Mapping
Skill-Based Routing & Workflow
IVR Script
Project Overview
CustomerService
Revenue Collection
Organizational Design andNext Steps
Systems andTechnology
Process, Methods & Procedures
26 26
Integration of quality assurance measures and programs across business units is limited
Quality assurance (QA), training and performance metrics programs are not aligned to address BCS goals – QA is performed on a department-to-department basis; a
comprehensive program that incorporates QA, training and performance measurement could improve customer service at DEP
– Auditing manual transactions is limited to the QA team, which has limited staff resources for comprehensive review, impacting accuracy; supervisors are not integrated into the QA/billing adjustment audit process
Quality monitoring is not administered on a regular basis, due largely to diverse management duties and under-staffing– Call monitoring must be conducted on a consistent basis,
which includes the same number of monitoring events for each CSR
– Supervisor call monitoring has been discontinued– Customer satisfaction levels and answer accuracy are not
currently tracked– Customer operations and field operations have limited
quality control programs or measurements for answer accuracy in place
Summary of Key Findings
Quality AssuranceIntegration
Customer ServiceQuality Monitoring
Project Overview
CustomerService
Revenue Collection
Organizational Design andNext Steps
Systems andTechnology
Process, Methods & Procedures
27 27
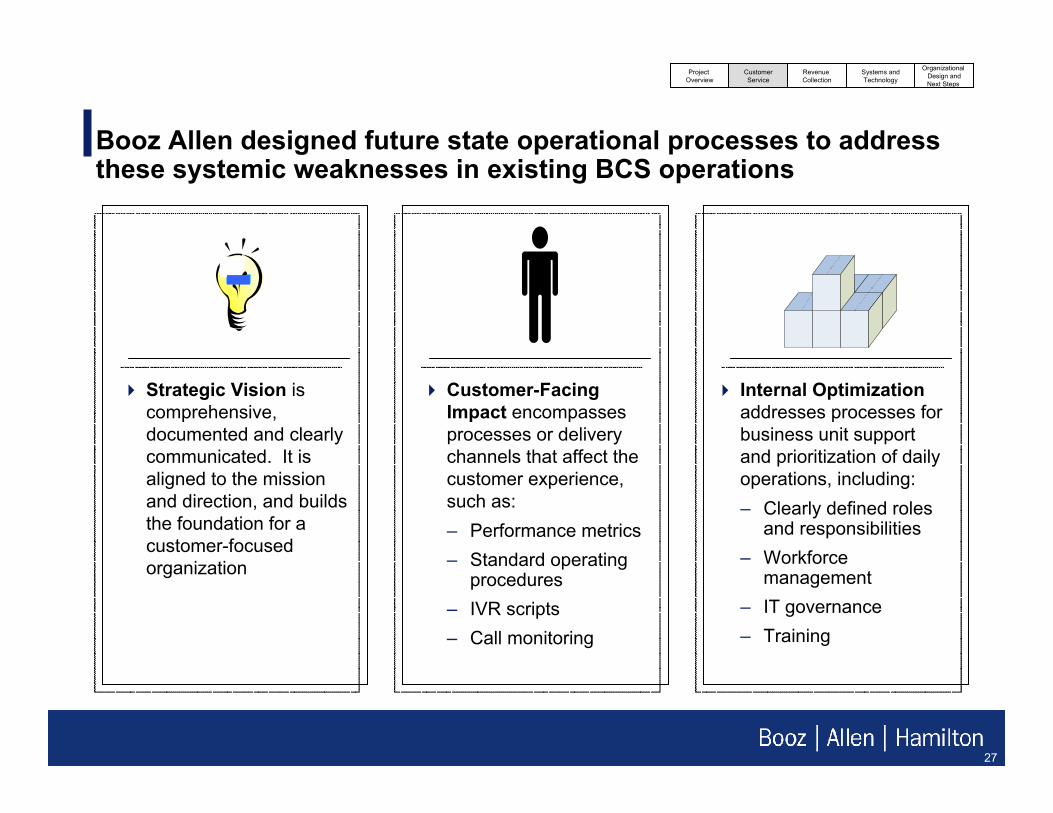
Booz Allen designed future state operational processes to address these systemic weaknesses in existing BCS operations
Customer-Facing Impact encompasses processes or delivery channels that affect the customer experience, such as:– Performance metrics– Standard operating
procedures– IVR scripts– Call monitoring
Internal Optimization addresses processes for business unit support and prioritization of daily operations, including:– Clearly defined roles
and responsibilities– Workforce
management– IT governance– Training
Strategic Vision is comprehensive, documented and clearly communicated. It is aligned to the mission and direction, and builds the foundation for a customer-focused organization
Project Overview
CustomerService
Revenue Collection
Organizational Design andNext Steps
Systems andTechnology
28 28
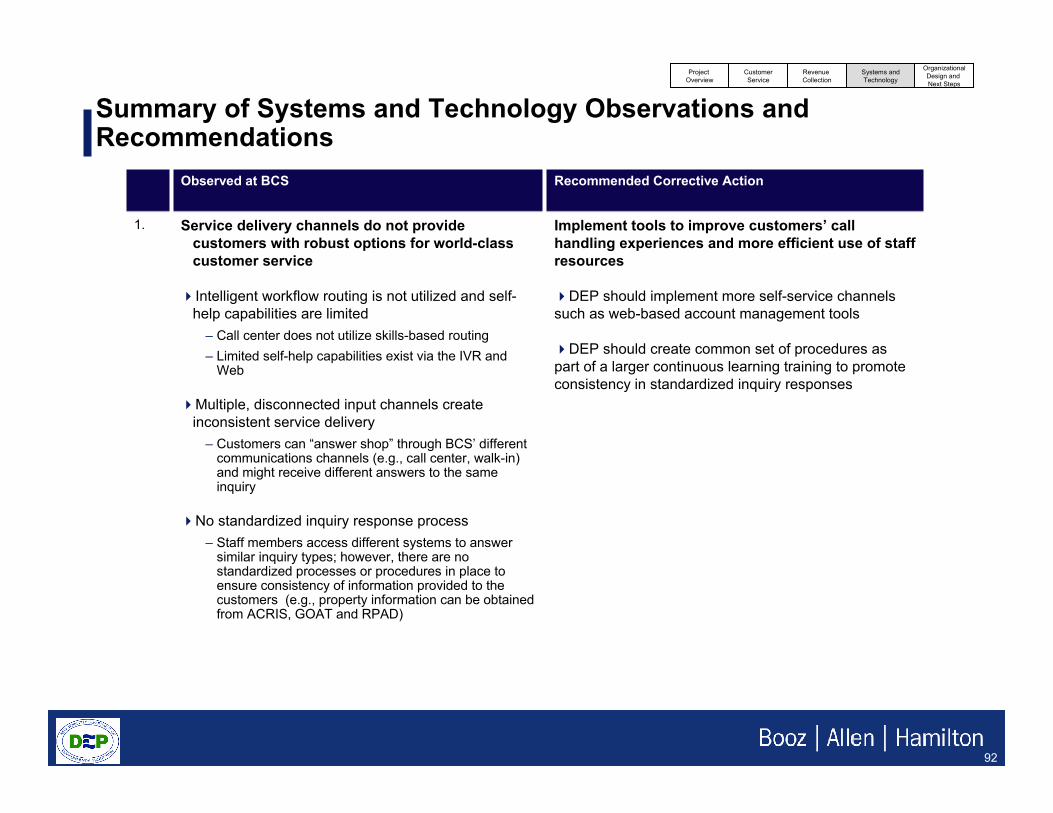
Summary of OPAI Observations and Recommendations
Develop a comprehensive, documented and clearly communicated vision, mission and strategic direction that builds the foundation for a customer-focused organization
BCS does not have an established, strategic and effectively communicated vision for delivering comprehensive customer service
1.
Assess organizational needs, establish agreed upon performance metrics and develop a management reporting dashboard. Institute a high-frequency, comprehensive management reporting dashboard for senior management. Include drill-down capabilities that provide actionable information, enabling effective supervision and real-time reaction by managers.
No clear consensus exists on which metrics are important to defining BCS’ customer service strategy. Established metrics for performance review and assessment are not internally publicized and consistent. Reporting tools currently available are not effectively employed, structured or utilized to sufficientlyenable management decision making. BCS managers employ a labor-intensive process to create usable reports; systemic data reconciliation issues have been cited across all business units.BCS lacks a comprehensive management reporting dashboard for senior management and appropriate drill-down capabilities that provide actionable information
3.
Address strategic needs by optimally aligning, assessing and integrating business units to support the interdependencies between the customer service front-line and analysis business units, thus enabling organizational units to best serve the customer. Implement procedures and policies to support the interdependencies between collections, account maintenance, management analysis, QA and training, and customer service front-line organizations (e.g., customer operations, field operations), thus enabling the overall strategic alignment of the organizational units to best serve the customer
Recommended Corrective Action
BCS’ organizational structure, operational processes and performance metrics are not aligned to ensure optimal service delivery to the customer. Communication across delivery channels is limited; BCS business units operate in silostructure. The Browser Applications (BAPPS) tool was developed by OIT to provide a single system for customer handling and billing. However, inconsistencies in interpretation, process and training result from lack of synchronization across units. Formal mechanism for integrated resource allocation and system development planning does not exist
2.
Observed at BCS
Project Overview
CustomerService
Revenue Collection
Organizational Design andNext Steps
Systems andTechnology
29 29
Summary of OPAI Observations and Recommendations (cont.)
Establish knowledge management practices and enhanced protocol for developing institutional knowledge. Create a separate business unit under the Future State Task 1 organizational design to handle the holistic assessment and improvement of staff customer handling. Centralize M&P, QA and training into one unit to ensure that QA issues and detailed, vetted M&P processes are incorporated into training modules for BCS staff
Knowledge management practices to institutionalize staff best practices and standardize knowledge are limited. Customer handling procedures are not consistent across or withindelivery channels. Utilization of current documentation management program (WebEx) for tracking customer correspondence varies. Availability of templates and reference documentation through the Document Management System (DMS) is very limited. There is a current initiative to increase the number of available templates; however, a formal process for identifying and addressing template needs has not been established. Standardized call scripts are not available for CSRuse
5.
Institute systematic and procedural improvements to current workforce management methodology. Review, assess and redesign workforce management procedures to provide a more accurate staffing model. Develop integrated staffing models across all service delivery channels to align with future-state transformation and increases in issue volume, based on BCS initiatives. Assess, identify and facilitate the implementationprocess for formalized CSR schedule adherence, compliance and occupancy. Establish a formal, proactive plan for CSR recruitment, attrition and hiring within the parameters of NYC hiring protocol, to streamline the staffing pipeline
Recommended Corrective Action
Workforce management is manually performed by staff. Management does not utilize forecasting and scheduling technology. CSR schedule adherence, compliance and occupancy is not formally tracked. An established, proactive plan for CSR recruitment, attrition and hiring is not currently in place, resulting in a negative impact on the staffing pipeline
4.
Observed at BCS
Project Overview
CustomerService
Revenue Collection
Organizational Design andNext Steps
Systems andTechnology
30 30
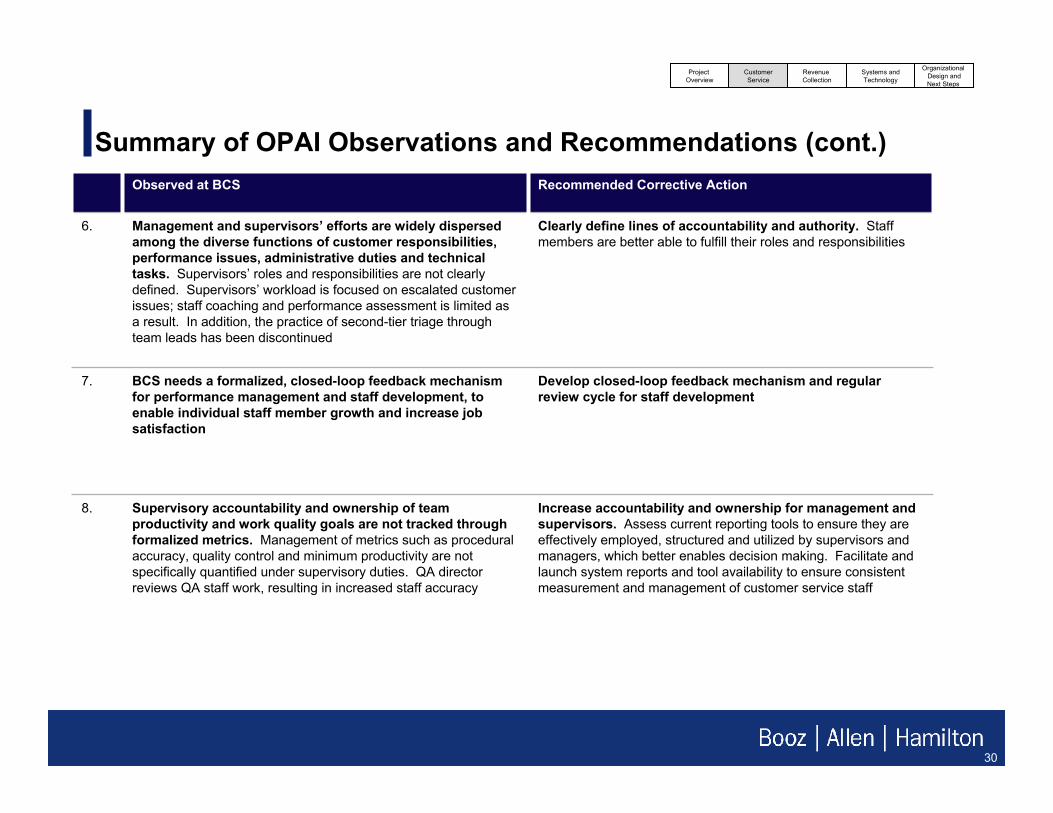
Summary of OPAI Observations and Recommendations (cont.)
Clearly define lines of accountability and authority. Staff members are better able to fulfill their roles and responsibilities
Management and supervisors’ efforts are widely dispersed among the diverse functions of customer responsibilities, performance issues, administrative duties and technical tasks. Supervisors’ roles and responsibilities are not clearly defined. Supervisors’ workload is focused on escalated customer issues; staff coaching and performance assessment is limited as a result. In addition, the practice of second-tier triage through team leads has been discontinued
6.
Develop closed-loop feedback mechanism and regular review cycle for staff development
BCS needs a formalized, closed-loop feedback mechanism for performance management and staff development, to enable individual staff member growth and increase job satisfaction
7.
Increase accountability and ownership for management and supervisors. Assess current reporting tools to ensure they are effectively employed, structured and utilized by supervisors andmanagers, which better enables decision making. Facilitate and launch system reports and tool availability to ensure consistentmeasurement and management of customer service staff
Supervisory accountability and ownership of team productivity and work quality goals are not tracked through formalized metrics. Management of metrics such as procedural accuracy, quality control and minimum productivity are not specifically quantified under supervisory duties. QA director reviews QA staff work, resulting in increased staff accuracy
8.
Recommended Corrective Action Observed at BCS
Project Overview
CustomerService
Revenue Collection
Organizational Design andNext Steps
Systems andTechnology
31 31
Summary of OPAI Observations and Recommendations (cont.)
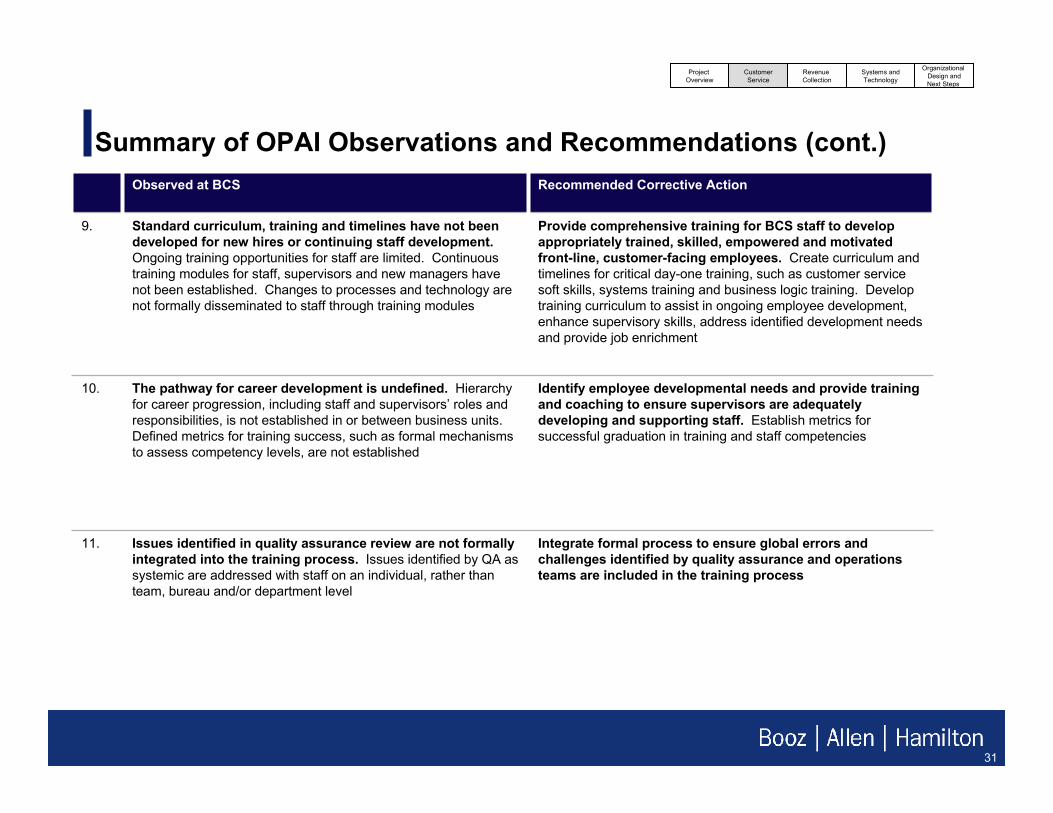
Identify employee developmental needs and provide training and coaching to ensure supervisors are adequately developing and supporting staff. Establish metrics for successful graduation in training and staff competencies
The pathway for career development is undefined. Hierarchy for career progression, including staff and supervisors’ roles and responsibilities, is not established in or between business units. Defined metrics for training success, such as formal mechanisms to assess competency levels, are not established
10.
Provide comprehensive training for BCS staff to develop appropriately trained, skilled, empowered and motivated front-line, customer-facing employees. Create curriculum and timelines for critical day-one training, such as customer service soft skills, systems training and business logic training. Develop training curriculum to assist in ongoing employee development, enhance supervisory skills, address identified development needsand provide job enrichment
Standard curriculum, training and timelines have not been developed for new hires or continuing staff development. Ongoing training opportunities for staff are limited. Continuous training modules for staff, supervisors and new managers have not been established. Changes to processes and technology are not formally disseminated to staff through training modules
9.
Integrate formal process to ensure global errors and challenges identified by quality assurance and operations teams are included in the training process
Issues identified in quality assurance review are not formally integrated into the training process. Issues identified by QA as systemic are addressed with staff on an individual, rather than team, bureau and/or department level
11.
Recommended Corrective Action Observed at BCS
Project Overview
CustomerService
Revenue Collection
Organizational Design andNext Steps
Systems andTechnology
32 32
Summary of OPAI Observations and Recommendations (cont.)
Establish a tiered model to handle each inquiry with the best available resource. Implement a tiered customer service approach that effectively utilizes the skills and knowledge of senior CSRs and technology to transfer customers to tier 2 in real-time, minimizing the number of RTS referrals
Call center customer handling follows a first available agent approach
13.
Assess and redesign the IVR script to enable customer self-service. Improve IVR scripting to help customers find relevant information, decreasing calls and identifying appropriate departments for issue resolution. Institute regular BCS assessment of IVR scripting to proactively design the IVR to respond to customer inquiries. Realign options and call flow for IVR to reflect current call volume needs. Enable customer to utilize IVR call routing to immediately route to appropriate BCSunits
IVR scripting could be improved to help customers find relevant information, decreasing calls and identifying appropriate departments for issue resolution. BCS does not regularly assess the IVR script for user-friendliness. Options and call flow for IVR do not reflect current call volume needs, and call routing does not enable customers to immediately route to appropriate BCS units
14.
Assess gaps and inconsistencies in business units’ policies and procedures, and provide a framework for consistent policies and procedures, for business units from the central office. Compare current practices to industry best practices, and recommend standards that are applicable nationwide
Recommended Corrective Action
Operational processes are not fully documented and accessible to BCS staff, resulting in significant variances in the customer experience. Documentation exists in many different forms. Formal documentation that is updated on a regular basis allows all stakeholders to understand the current flows and form the basis for determining appropriate changes. The customer experience varies due to inconsistent implementation and adherence to standard operating procedures across business units
12.
Observed at BCS
Project Overview
CustomerService
Revenue Collection
Organizational Design andNext Steps
Systems andTechnology
33 33
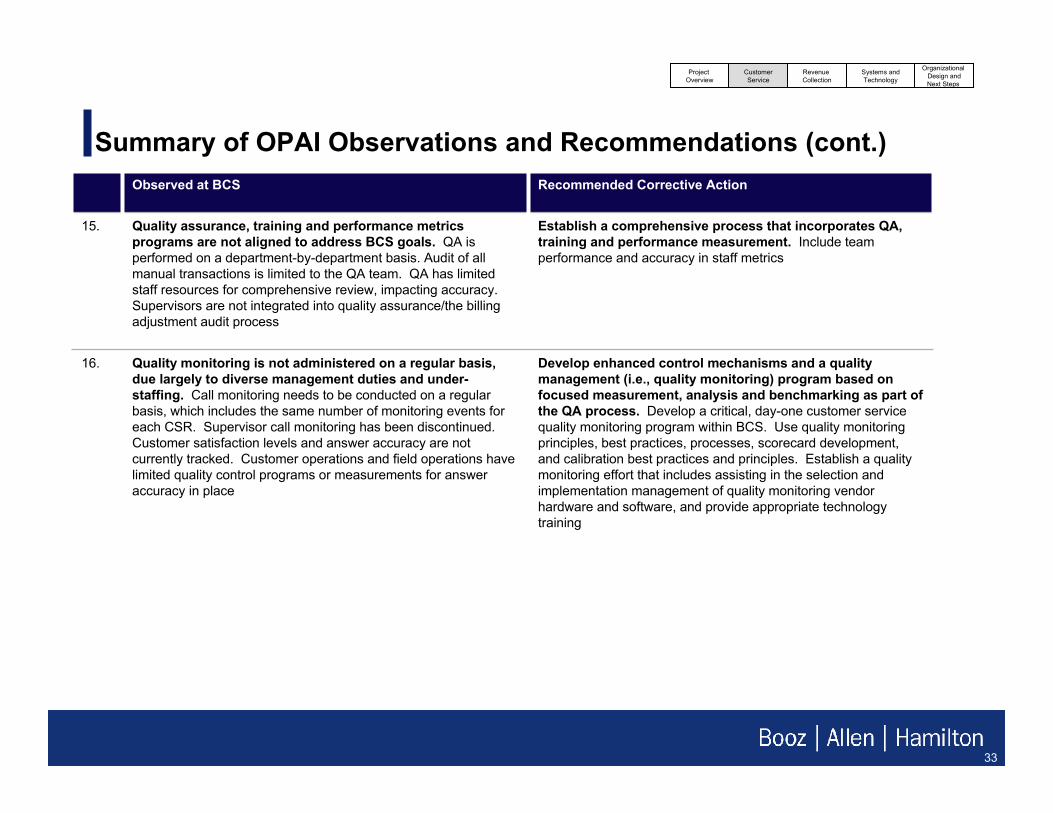
Summary of OPAI Observations and Recommendations (cont.)
Develop enhanced control mechanisms and a quality management (i.e., quality monitoring) program based on focused measurement, analysis and benchmarking as part of the QA process. Develop a critical, day-one customer service quality monitoring program within BCS. Use quality monitoring principles, best practices, processes, scorecard development, and calibration best practices and principles. Establish a quality monitoring effort that includes assisting in the selection and implementation management of quality monitoring vendor hardware and software, and provide appropriate technology training
Quality monitoring is not administered on a regular basis, due largely to diverse management duties and under-staffing. Call monitoring needs to be conducted on a regular basis, which includes the same number of monitoring events for each CSR. Supervisor call monitoring has been discontinued. Customer satisfaction levels and answer accuracy are not currently tracked. Customer operations and field operations have limited quality control programs or measurements for answer accuracy in place
16.
Establish a comprehensive process that incorporates QA, training and performance measurement. Include team performance and accuracy in staff metrics
Recommended Corrective Action
Quality assurance, training and performance metrics programs are not aligned to address BCS goals. QA is performed on a department-by-department basis. Audit of all manual transactions is limited to the QA team. QA has limited staff resources for comprehensive review, impacting accuracy. Supervisors are not integrated into quality assurance/the billing adjustment audit process
15.
Observed at BCS
Project Overview
CustomerService
Revenue Collection
Organizational Design andNext Steps
Systems andTechnology
34 34
Summary: Water Bill Redesign
Challenge– DEP’s water bill has not been updated in more than 10 years, potentially making it difficult for
customers to understand the relationship between water/sewer bills and effective delivery of water/sewer services
– The current bill is also difficult for some customers to understand due to small text size, complexity of information presented and lack of definition within key areas of the bill
Approach– The water bill redesign focused on two key questions:
• How can DEP’s water bill be redesigned to better communicate key information to the widest range of customers?
• What other opportunities can be leveraged to support BCS’ goal of water conservation and communicate programs and policies to customers?
Recommendation– Water bill redesign recommendations covered:
- Changes to bill design and content- Options for bill generation and production- Opportunities for integrating bill messaging with other DEP communications
Project Overview
CustomerService
Revenue Collection
Organizational Design andNext Steps
Systems andTechnology
35 35
Existing water bill effectiveness was evaluated using discussions with customers and key stakeholders, as well as best practices research
Communications: DEP’s water bill provides opportunities to share important information, such as water conservation strategies
Presentation of Billing Information: Billing information is not clearly communicated to customers
Overall Design / Layout: The layout and aesthetics of the bill are not user-friendly and do not effectively communicate key information
Key Observation Categories
General Metered Bill
Front
Reverse
Project Overview
CustomerService
Revenue Collection
Organizational Design andNext Steps
Systems andTechnology
36 36
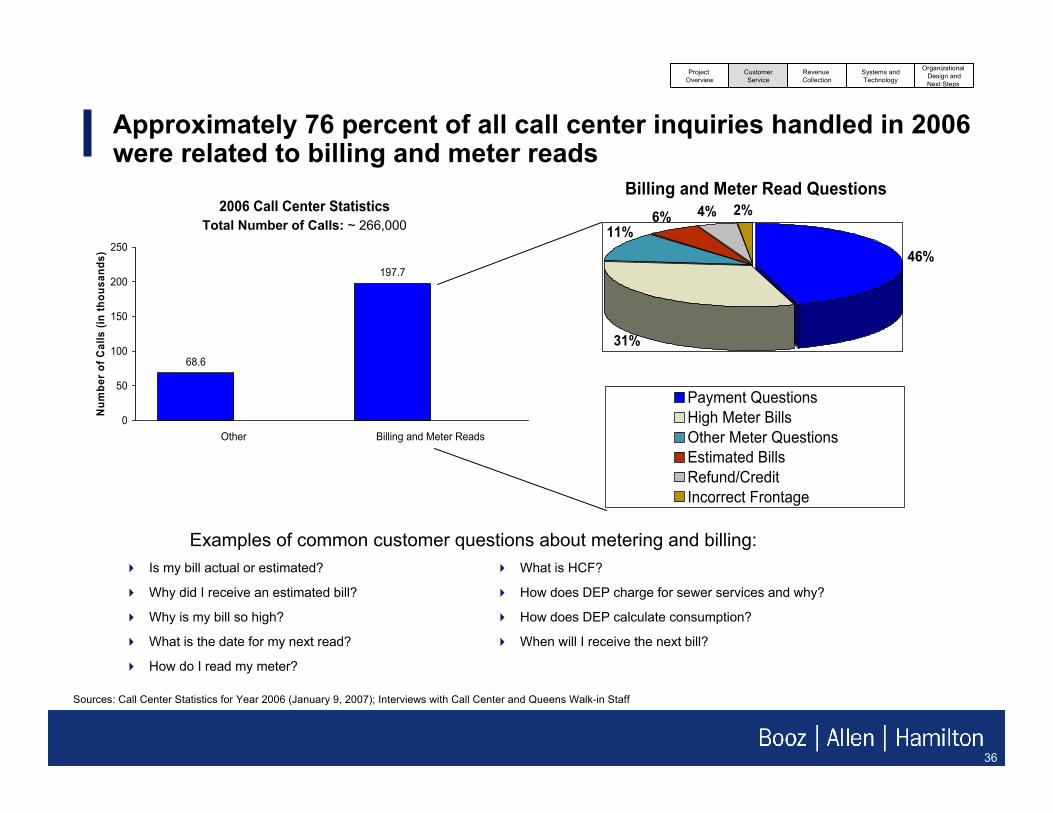
Approximately 76 percent of all call center inquiries handled in 2006 were related to billing and meter reads
How do I read my meter?
What is the date for my next read?
Why is my bill so high?
Why did I receive an estimated bill?
Is my bill actual or estimated?
When will I receive the next bill?
How does DEP calculate consumption?
How does DEP charge for sewer services and why?
What is HCF?
Billing and Meter Read Questions
46%
4% 2%
31%
6%11%
Payment QuestionsHigh Meter BillsOther Meter QuestionsEstimated BillsRefund/CreditIncorrect Frontage
Sources: Call Center Statistics for Year 2006 (January 9, 2007); Interviews with Call Center and Queens Walk-in Staff
Examples of common customer questions about metering and billing:
2006 Call Center Statistics
68.6
197.7
0
50
100
150
200
250
Other Billing and Meter Reads
Num
ber o
f Cal
ls (i
n th
ousa
nds)
Total Number of Calls: ~ 266,000
Project Overview
CustomerService
Revenue Collection
Organizational Design andNext Steps
Systems andTechnology
37 37
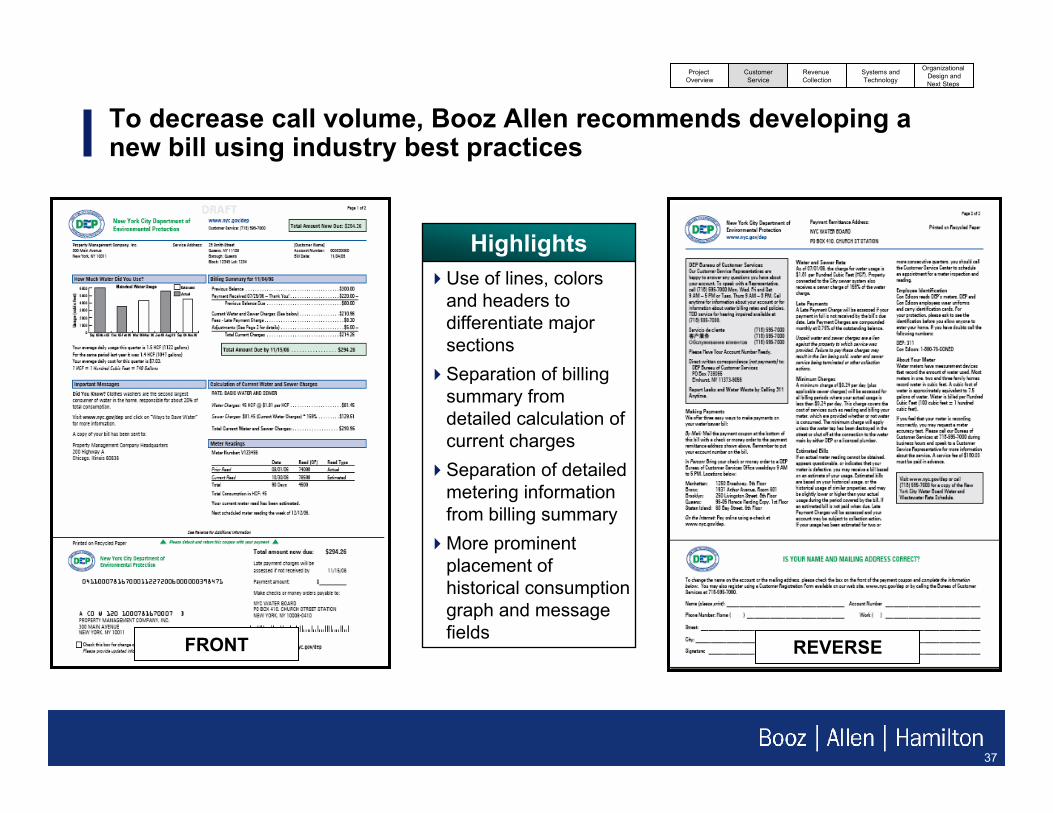
To decrease call volume, Booz Allen recommends developing a new bill using industry best practices
Use of lines, colors and headers to differentiate major sectionsSeparation of billing summary from detailed calculation of current chargesSeparation of detailed metering information from billing summaryMore prominent placement of historical consumption graph and message fields
Highlights
FRONT REVERSE
Project Overview
CustomerService
Revenue Collection
Organizational Design andNext Steps
Systems andTechnology
38 38
The header is the first point of focus for the customer and an opportunity to summarize key information
Placing the pay stub at the bottom of the bill allows DEP to create a header for the water/sewer bill
The header includes two key components: account information, and balance due – The service address is now easily located at the top of the page– DEP’s Web site address is more prominently displayed on the bill
Project Overview
CustomerService
Revenue Collection
Organizational Design andNext Steps
Systems andTechnology
39 39
The historical water consumption graph could play an important role in water conservation
The graphical display for quarterly bills groups data by quarter, which is easier to comprehend
Color-coding distinguishes between estimated and actual consumption
In addition to average daily usage and cost, the narrative describes average daily usage for the same period last year
This graph does not currently appear on an adjusted bill, and adjusted consumption values are not reflected in later bills; BCS should revisit business rules associated with the consumption graph and investigate options for improving data accuracy
Project Overview
CustomerService
Revenue Collection
Organizational Design andNext Steps
Systems andTechnology
40 40
The billing summary provides a user-friendly overview of a customer’s charges
The billing summary provides a roll-up of all charges, including water and sewer, fees, and adjustments
Fees are represented as individual line items; BCS should revisit the labels currently assigned to fees in CIS to make them user-friendly for customers
Detailed information on adjustments is rolled over to a second page
Project Overview
CustomerService
Revenue Collection
Organizational Design andNext Steps
Systems andTechnology
41 41
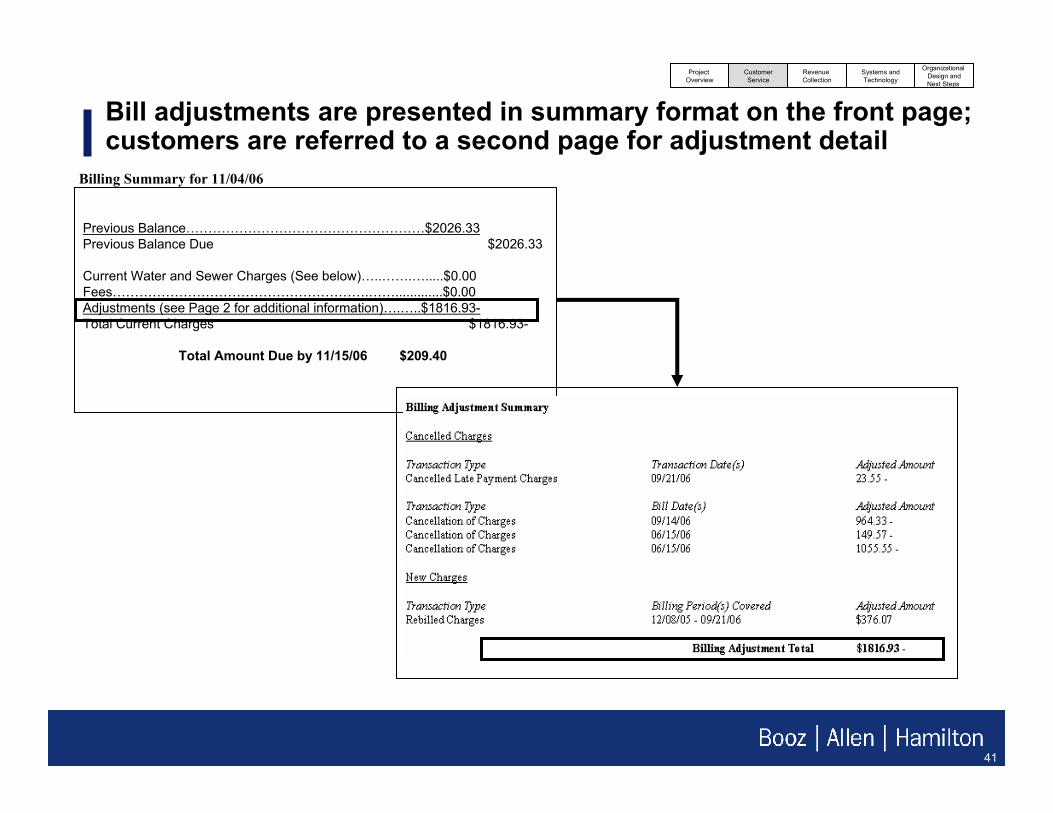
Previous Balance………………………………………………$2026.33Previous Balance Due $2026.33
Current Water and Sewer Charges (See below)…..…….….....$0.00Fees………………………………………………….…….............$0.00Adjustments (see Page 2 for additional information)….…..$1816.93-Total Current Charges $1816.93-
Total Amount Due by 11/15/06 $209.40
Bill adjustments are presented in summary format on the front page; customers are referred to a second page for adjustment detail
Billing Summary for 11/04/06
Project Overview
CustomerService
Revenue Collection
Organizational Design andNext Steps
Systems andTechnology
42 42
Important messages are given a distinct section on the bill to draw attention to key information
Water conservation tips could be varied from quarter to quarter and targeted by customer segment
Messages from various locations on the current bill could be pulled into this section to make the bill more readable
Details on payment agreements could be included in this section where applicable
Daily average usage statistics have been moved to the metering section
Project Overview
CustomerService
Revenue Collection
Organizational Design andNext Steps
Systems andTechnology
43 43
The calculation of water and sewer charges section clearly breaks down the formula used to calculate current charges
Water charges are calculated by showing consumption and the cost per unit of water consumed
Sewer charges are calculated by showing water charges and the percentage of water charges used in determining sewer charges
Multiple rates could be shown using several subsections
Calculations could be broken out into two lines when rate changes have been applied or when there are multiple meters for a given rate
Project Overview
CustomerService
Revenue Collection
Organizational Design andNext Steps
Systems andTechnology
44 44
The meter readings section pulls all metering information into a separate area of the bill
Meter information is presented in a structured, tabular format to help customers see consumption calculations more easily
An indicator of whether the previous consumption was actual or estimated should be added
A message directly adjacent to the meter information notifies customers of an estimated current read
Project Overview
CustomerService
Revenue Collection
Organizational Design andNext Steps
Systems andTechnology
45 45
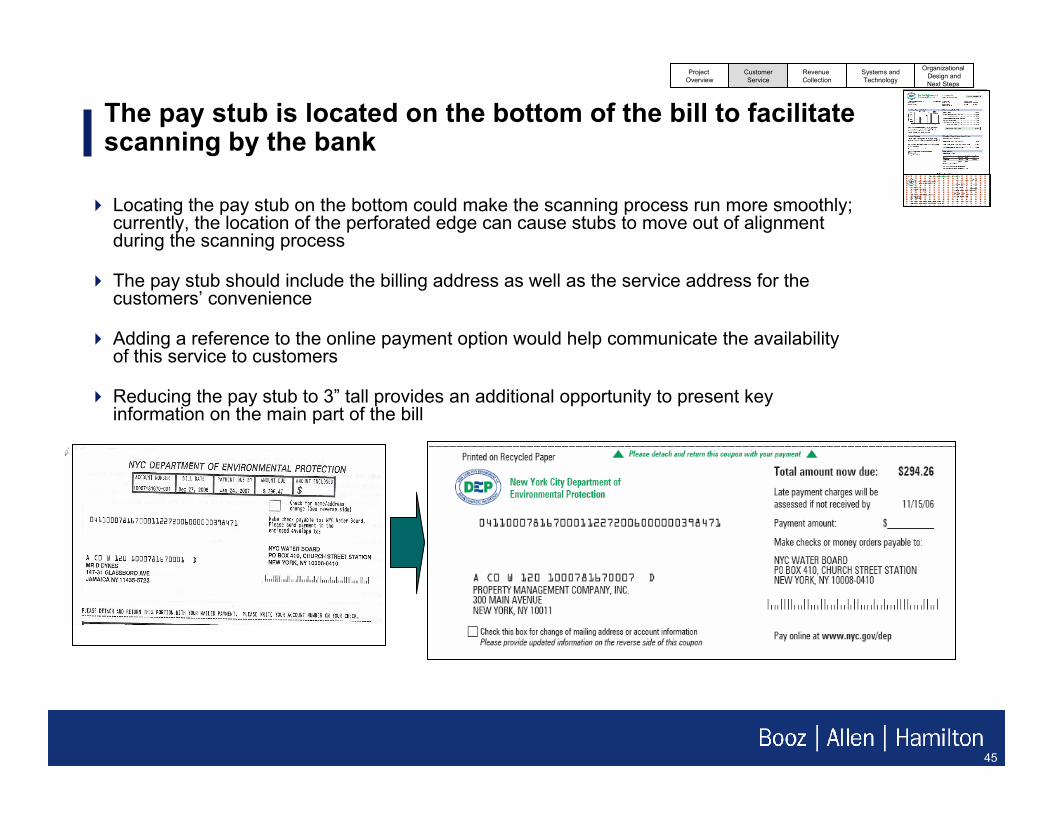
The pay stub is located on the bottom of the bill to facilitate scanning by the bank
Locating the pay stub on the bottom could make the scanning process run more smoothly; currently, the location of the perforated edge can cause stubs to move out of alignment during the scanning process
The pay stub should include the billing address as well as the service address for the customers’ convenience
Adding a reference to the online payment option would help communicate the availability of this service to customers
Reducing the pay stub to 3” tall provides an additional opportunity to present key information on the main part of the bill
Project Overview
CustomerService
Revenue Collection
Organizational Design andNext Steps
Systems andTechnology
46 46
The reverse side of the bill gives BCS an opportunity to providefurther details on payment options, metering, etc.
The payment remittance address has been added to inform customers about where to send payments even if pay stubs have been removed
All customer service information is consolidated in one location, including alternate languages
Payment information from the regular insert, “Paying your Water and Sewer Bill,” has been incorporated into the reverse of the bill
Information on how to read a water meter has been incorporated from DEP’s Web site
DEP should work with the Department of Finance on integrating processes for updating customer information. In the future, this section could be replaced with an explanation of how to update account information (e.g., on the DOF
Web site)
Project Overview
CustomerService
Revenue Collection
Organizational Design andNext Steps
Systems andTechnology
47 47
Summary of Bill Redesign Observations and Recommendations
Clearly represent the calculation of water charges by showing consumption and the cost per unit of water consumed. Include a billing summary that provides a roll-up of all charges, including water and sewer, fees, and adjustments. Revisit the labels currently assigned to the fees in CIS to make them user-friendly for customers. Detailed information on adjustments should be rolled over to a second page
Billing information is not clearly communicated to customers. For example, total current charges are not calculated separately from carryover charges from previous bills. In addition, fees and charges often appear without clear labels. For example, a denial of access fee will appear as “Fee.” A final read charge will appear on the bill as “g-off.” Finally, bill adjustment information is a direct reflection of the account adjustments made in CIS, which can be confusing to customers
2.
Use bill messages to target specific customer groups or communicate broader information on programs and services.Standardize communications materials and any other written and verbal correspondence with respect to message and tone. Formulate messages to reflect BCS’priorities.Identify one primary communications liaison who is responsible for reviewing and coordinating all communications materials
DEP’s water bill provides opportunities to share important information, such as water conservation strategies. For example, the water bill is not currently integrated into a comprehensive communications strategy. Bill messages do not promote opportunities for water conservation / savings by customers. In addition, there is no one function within BCS that has ownership over billing inserts, bill messages, and billing information on DEP’sWeb site, which limits its branding program (for example, the bill design does not include design elements found in other DEP products)
3.
Use lines, colors and headers to differentiate major sections of the bill. Separate the billing summary from detailed calculation of current charges, and from detailed metering information. Provide a more prominent placement for historical consumption graph and message fields
Recommended Corrective Action
Bill layout and aesthetics are not user-friendly and do not effectively communicate key information. The bill is difficult to read due to the narrow typeface, small font and cluttered appearance. The bill does not include headers and section breaks, and there is no clear hierarchy of information to emphasize the most important data elements
1.
Observed at BCS
Project Overview
CustomerService
Revenue Collection
Organizational Design andNext Steps
Systems andTechnology
48 48
Section 2: Revenue Collection
49 49
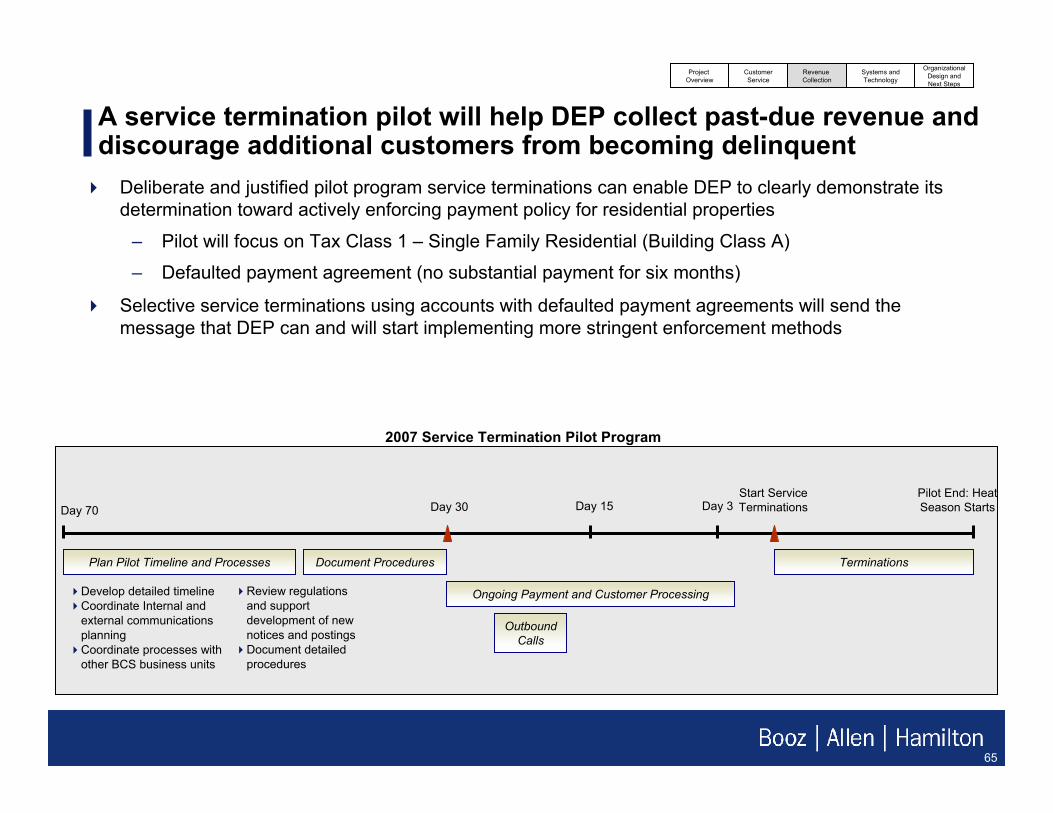
BCS Revenue Collection encompasses two focus areas: recovering past-due revenue and preventing more accounts from becoming past due
BCS revenue collection issues can be divided into two related, but distinct categories: collecting past-due revenue that in February 2007 totaled approximately $590 million; and creating new accounts receivable systems and reporting mechanisms to improve overall revenue collection and prevent additional accounts from becoming past due.
For these two areas, Booz Allen developed new customer segmentations to enable creation of policies and procedures that better reflect customer needs, rather than conforming to standard government categories, such as tax class. Booz Allen also built an analytical model to gauge DEP’sability to recover debt of varying ages and identify effective debt collections strategies.
Additionally, Booz Allen analyzed other large cities’ water utility collections strategies and enforcement tools and identified the best options for New York City, including stand alone lien sales, service termination and high-volume outbound calling.
Project Overview
CustomerService
Revenue Collection
OrganizationalDesign andNext Steps
Systems andTechnology
50 50
Summary: Collections Strategy
Challenge– Since the introduction of metered service, DEP’s past-due balances have exceeded industry
standard levels in amount and age, for a number of reasons (e.g., chronic estimated meter reads, lack of effective enforcement, systems tools, difficulty in resolving customer disputes)
– DEP has limited collections strategies to be effective in its revenue recovery activities
Approach– Collections strategy was framed using two key questions:
- How should DEP address the current $589.6 million1 in outstanding debt, and what actions should DEP take to reduce that debt?
- What long-term policies and procedures should DEP adjust to prevent future delinquencies?
- Customer segmentation- Analysis of age distribution of A/R- Treatment options- Implementation roadmaps and timelines
Project Overview
CustomerService
Revenue Collection
OrganizationalDesign andNext Steps
Systems andTechnology
51 51
Segment 1
Identify Customer Segmentation, Treatment Options and A/R Distribution
Build and Apply Collection Model to Determine Ability-to-Collect for Each Customer Segment
Segment Customers
1 2 3
Using a three-step approach, Booz Allen developed an overall collections strategy
1 2 3 4 5
$
Potential Financial Impact of New Collections Strategy
Develop Collections Model
Perform Financial Impact Analysis for Each Treatment Stream and Rate of Recovery Perspectives
Analyze FinancialImpact
Segment 2
Segment 3
Segment 4
Segment 5
Segment 6
Segment 7
Segment 8
Segment 9
Segment 10
Segment 11
Segment 12
Segment 13
Segment 14
Dunning Notice Outbound Calling Lien Sale Service Termination Baseline ResultsEffectiveness Rating Score
(Range 1 - 10) 1.9 1.2 2.2 0.0 5.3
Definition of Supporting Data % of customers in this customer category that
posted a payment within 60 days of receiving a
Dunning Notice (CIS Data 2/20/07)
% of Outbound Calls That Resulted in Payment in Full or PA (Extrapolated
from DEP Collections calling campaign results,
see assumptions)
% A/R Successfully Collected From 2006 Lien Sales or Payments in Full Before the Sale vs. Total
A/R Eligible for Lien Sales(Tax Class 1, 2006
results)
DEP is authorized to perform S.T. for this
customer category, but currently does not. No
statistical data available.
Number of Successes 6,171 37 $ 2,171,273 n/a Total Number of Attempts 31,767 311 $ 9,940,618 * n/a
Rate of Success 19% 12% 22% 0.0%
Residential: Small Family (Tax Class 1)
Statistical Support Data For Effectiveness Scores:
* 9.9M represents the total A/R from "eligible" accounts, meaning accounts that received the 60-day Lien Sale Notice sent by DOF. These accounts met both the DOF's >3 yrs. property tax delinquency requirement for tax class 1 properties and DEP internal criteria for lien sales
Current Treatment Options Used By DEP
Baseline Model Score
Project Overview
CustomerService
Revenue Collection
OrganizationalDesign andNext Steps
Systems andTechnology
52 52
Deconstructing DEP’s current tax classes served as a key first step to understanding potential collections strategies
DEP has full authority to sell liens on Tax Class 4 properties, but is not a realistic treatment for government and other special or nonprofit properties
DEP has full authority to sell liens on Tax Class 4 properties without DOF property tax requirements
DEP has full authority to sell liens on Tax Class 4 properties without DOF property tax requirements
Lien sale eligibility requirement matches that for Tax Class 2 (>1 yr delinquency in property taxes), but is not a realistic treatment for utility properties
Eligibility for lien sale for (most) Tax Class 2 properties requires >1 year of delinquency in property taxes at DOF, with no loop hole2 given to the customer to stop the process
Eligibility for lien sale for Tax Class 1 properties requires >3years of delinquency in property taxes at DOF and includes a loop hole whereby customers can stop the lien sale process by paying property taxes
Tax Class Eligibility and Enforcement Definition
Tools readily exist to enforce customer payment
Service TerminationStand Alone Liens
Tax Class 4 Commercial
4
Liens readily exist to enforce customer payment, but service termination may not be feasible
No Service TerminationStand Alone Liens
Tax Class 4 Residential (Lofts/Apt-Overs)
5
Alternative treatment streams are required to collect on customers
No Service Termination or Stand Alone Liens
Tax Class 1Residential
1
Focus on maintaining customer relationship to drive revenue collection
No Service Termination or Liens
Tax Class 4 Special/Gov’t
6
Focus on maintaining customer relationship to drive revenue collection
No Service Termination or Stand Alone Liens
Tax Class 3Utilities
3
Alternative treatment streams are required to collect on customers
No Service Termination or Stand Alone Liens
Tax Class 2Residential
2
Existing Enforcement1
Impact to DEP Ability to Collect
Tax Class
(1) DEP is authorized to perform Service Terminations across all segments. In this column, comments on Service Terminations reflect current DEP practices (operational vs. authorized)(2) Verified during discussion with Helen Rhodes on 4/5/2007
Project Overview
CustomerService
Revenue Collection
OrganizationalDesign andNext Steps
Systems andTechnology
53 53
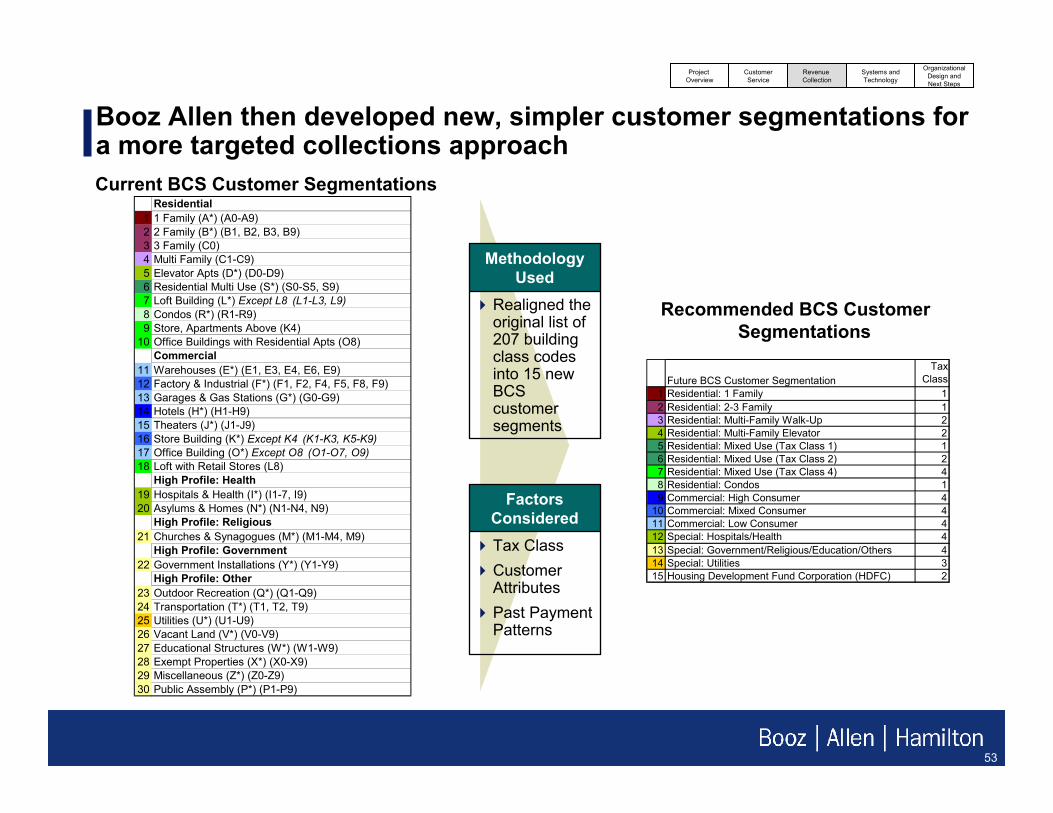
Booz Allen then developed new, simpler customer segmentations for a more targeted collections approachCurrent BCS Customer Segmentations
Recommended BCS Customer Segmentations
Tax ClassCustomer AttributesPast Payment Patterns
Factors Considered
Realigned the original list of 207 building class codes into 15 new BCS customer segments
Methodology Used
Residential1 1 Family (A*) (A0-A9)2 2 Family (B*) (B1, B2, B3, B9)3 3 Family (C0)4 Multi Family (C1-C9)5 Elevator Apts (D*) (D0-D9)6 Residential Multi Use (S*) (S0-S5, S9)7 Loft Building (L*) Except L8 (L1-L3, L9)8 Condos (R*) (R1-R9)9 Store, Apartments Above (K4)
10 Office Buildings with Residential Apts (O8)Commercial
11 Warehouses (E*) (E1, E3, E4, E6, E9)12 Factory & Industrial (F*) (F1, F2, F4, F5, F8, F9)13 Garages & Gas Stations (G*) (G0-G9)14 Hotels (H*) (H1-H9)15 Theaters (J*) (J1-J9)16 Store Building (K*) Except K4 (K1-K3, K5-K9)17 Office Building (O*) Except O8 (O1-O7, O9)18 Loft with Retail Stores (L8)
High Profile: Health19 Hospitals & Health (I*) (I1-7, I9)20 Asylums & Homes (N*) (N1-N4, N9)
High Profile: Religious21 Churches & Synagogues (M*) (M1-M4, M9)
High Profile: Government22 Government Installations (Y*) (Y1-Y9)
Class1 Residential: 1 Family 12 Residential: 2-3 Family 13 Residential: Multi-Family Walk-Up 24 Residential: Multi-Family Elevator 25 Residential: Mixed Use (Tax Class 1) 16 Residential: Mixed Use (Tax Class 2) 27 Residential: Mixed Use (Tax Class 4) 48 Residential: Condos 19 Commercial: High Consumer 4
1 2 3 4 Residential 4 Commercial 4 Special Residential: 1 Family $ 81,716,764 Residential: 2-3 Family $ 135,198,186 Residential: Multi-Family Walk-up 100,417,657$ Residential: Multi-Family Elevator 56,283,734$ Residential: Mixed-Use (Tax Class 1) $ 30,036,639 Residential: Mixed-Use (Tax Class 2) 27,001,495$ Residential: Mixed Use (Tax Class 4) 4,533,061$ Residential: Condos $ 25,551,472 Commercial: High Consumers 2,993,167$ Commercial: Mixed Consumers 31,211,448$ Commercial: Low Consumers 16,945,522$ Special: Hospitals/Health 18,191,528$ Special: Govt/Relig/Educ/Other 26,038,277$ Special: Utilities 3,145,342$ Housing Development Fund Corporation $ 174,249 29,694,721$ 138$ 507,773$ Sub Totals 272,677,309$ 213,397,606$ 3,145,342$ 4,533,061$ 51,150,275$ 44,737,578$
Total A/R: 589,641,172$
Tax Class GroupBuilding Class Category
Using the revised segmentation, Booz Allen examined A/R balances1
across tax classes2 to generate detailed insight for the collections strategy
(1) 2/20/2007 CIS data extract was used in this analysis (2) Building category “4 Residential” includes lofts and apartment-overs Data extract as of February 20, 2007Data extract as of February 20, 2007
TotalResidential$460.7 MM
TotalCommercial$51.1 MM
Total Special$47.4 MMTotal HDFCs$30.4 MM
2
Project Overview
CustomerService
Revenue Collection
OrganizationalDesign andNext Steps
Systems andTechnology
55 55
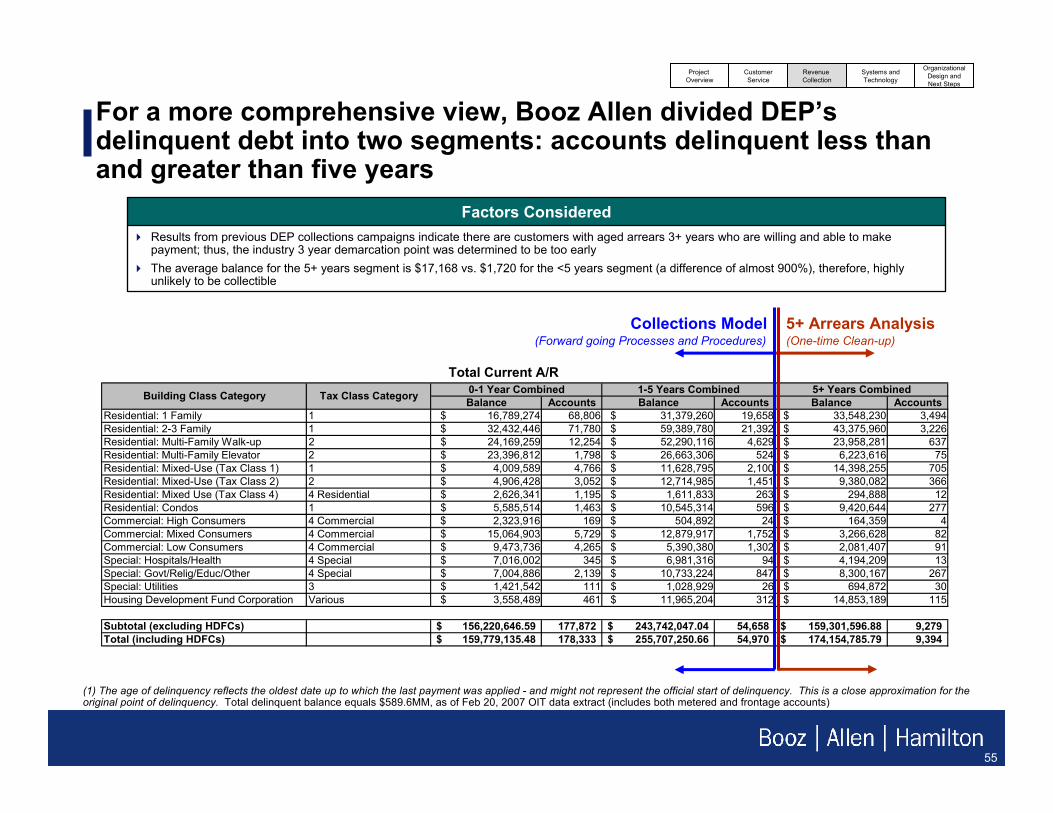
For a more comprehensive view, Booz Allen divided DEP’sdelinquent debt into two segments: accounts delinquent less thanand greater than five years
(1) The age of delinquency reflects the oldest date up to which the last payment was applied - and might not represent the official start of delinquency. This is a close approximation for the original point of delinquency. Total delinquent balance equals $589.6MM, as of Feb 20, 2007 OIT data extract (includes both metered and frontage accounts)
Results from previous DEP collections campaigns indicate there are customers with aged arrears 3+ years who are willing and able to make payment; thus, the industry 3 year demarcation point was determined to be too early The average balance for the 5+ years segment is $17,168 vs. $1,720 for the <5 years segment (a difference of almost 900%), therefore, highly unlikely to be collectible
0-1 Year Combined 1-5 Years CombinedBuilding Class Category Tax Class Category 5+ Years Combined
Collections Model 5+ Arrears Analysis(Forward going Processes and Procedures) (One-time Clean-up)
Project Overview
CustomerService
Revenue Collection
OrganizationalDesign andNext Steps
Systems andTechnology
Total Current A/R
56 56
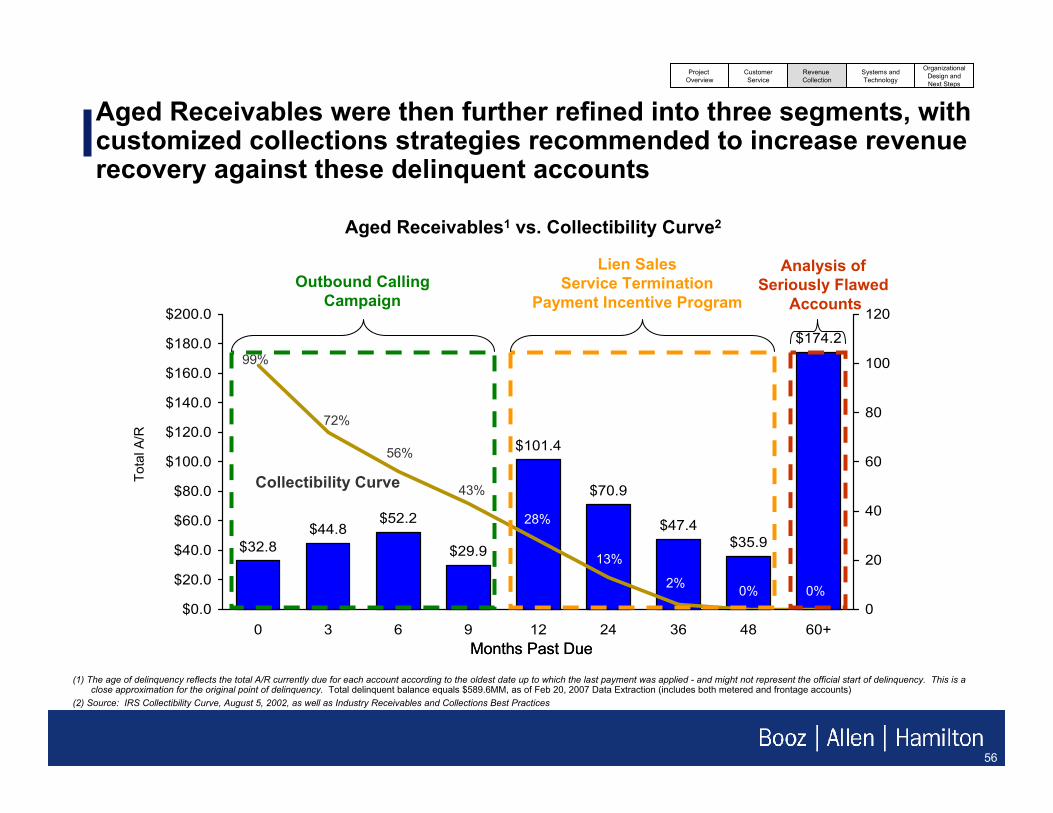
(1) The age of delinquency reflects the total A/R currently due for each account according to the oldest date up to which the last payment was applied - and might not represent the official start of delinquency. This is a close approximation for the original point of delinquency. Total delinquent balance equals $589.6MM, as of Feb 20, 2007 Data Extraction (includes both metered and frontage accounts)
(2) Source: IRS Collectibility Curve, August 5, 2002, as well as Industry Receivables and Collections Best Practices
Months Past Due
Aged Receivables1 vs. Collectibility Curve2
Aged Receivables were then further refined into three segments, with customized collections strategies recommended to increase revenue recovery against these delinquent accounts
Project Overview
CustomerService
Revenue Collection
OrganizationalDesign andNext Steps
Systems andTechnology
$32.8$44.8
$52.2
$29.9
$101.4
$70.9
$47.4$35.9
$174.2
$0.0
$20.0
$40.0
$60.0
$80.0
$100.0
$120.0
$140.0
$160.0
$180.0
$200.0
0 3 6 9 12 24 36 48 60+0
20
40
60
80
100
120
Months Past Due
Collectibility Curve
99%
72%
56%
43%
Outbound CallingCampaign
Lien SalesService Termination
Payment Incentive Program
Analysis of Seriously Flawed
Accounts
28%
13%
2% 0% 0%
Tota
l A/R
57 57
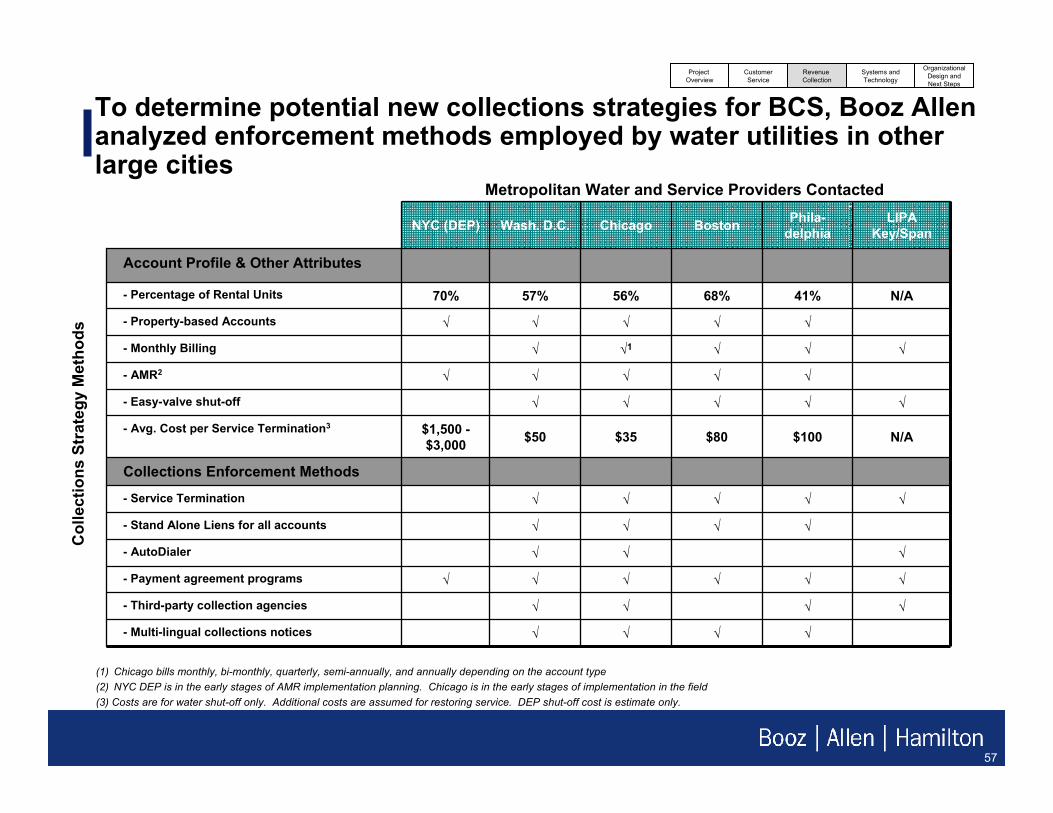
To determine potential new collections strategies for BCS, Booz Allen analyzed enforcement methods employed by water utilities in other large cities
Col
lect
ions
Str
ateg
y M
etho
ds
Metropolitan Water and Service Providers Contacted
√√√√√- Property-based Accounts
N/A41%68%56%57%70%- Percentage of Rental Units
√√√- AutoDialer
√√√√- Multi-lingual collections notices
√√√√- Third-party collection agencies
√√√√√√- Payment agreement programs
√√√√- Stand Alone Liens for all accounts
√√√√√- Service Termination
Collections Enforcement Methods
N/A$100$80$35$50$1,500 -$3,000
- Avg. Cost per Service Termination3
√√√√√- Easy-valve shut-off
√√√√√- AMR2
√√√√1√- Monthly Billing
LIPA Key/Span
Phila-delphiaBostonChicagoWash. D.C.
Account Profile & Other Attributes
NYC (DEP)
(1) Chicago bills monthly, bi-monthly, quarterly, semi-annually, and annually depending on the account type(2) NYC DEP is in the early stages of AMR implementation planning. Chicago is in the early stages of implementation in the field(3) Costs are for water shut-off only. Additional costs are assumed for restoring service. DEP shut-off cost is estimate only.
Project Overview
CustomerService
Revenue Collection
OrganizationalDesign andNext Steps
Systems andTechnology
58 58
Booz Allen then further narrowed the collections strategies, andbased on New York City’s unique environment, recommended several for further research and potential implementation in the near term
Implement a "tiered customer service model" in which outbound calling is reserved exclusively for high risk delinquent accounts and managed systematically by collections reps that are specialists in those customer segments
Implement a tool that automatically calls customers in delinquency and leaves a soft reminder message that a balance is due, while also providing an option to connect to DEP staff when customer answers2
Customize notices to address different customer segments and attributes, and to describe the specific penalties and timelines for non-payment that apply to that segment
EnhanceDunning Notice1
Begin strategic service terminations as a collections strategy, where feasibleEnhanceService Terminations1
A one-time Payment Incentive Program (PIP) would allow DEP to collect delinquent receivables from a large number of residential property owners that are willing to pay past utility charges, with removal of Late Payment Charges (LPC). This treatment option would be offered to customers before more stringent enforcement options would be deployed (service termination, lien sales)
New
Payment Incentive Program1
(Structured Compromise)
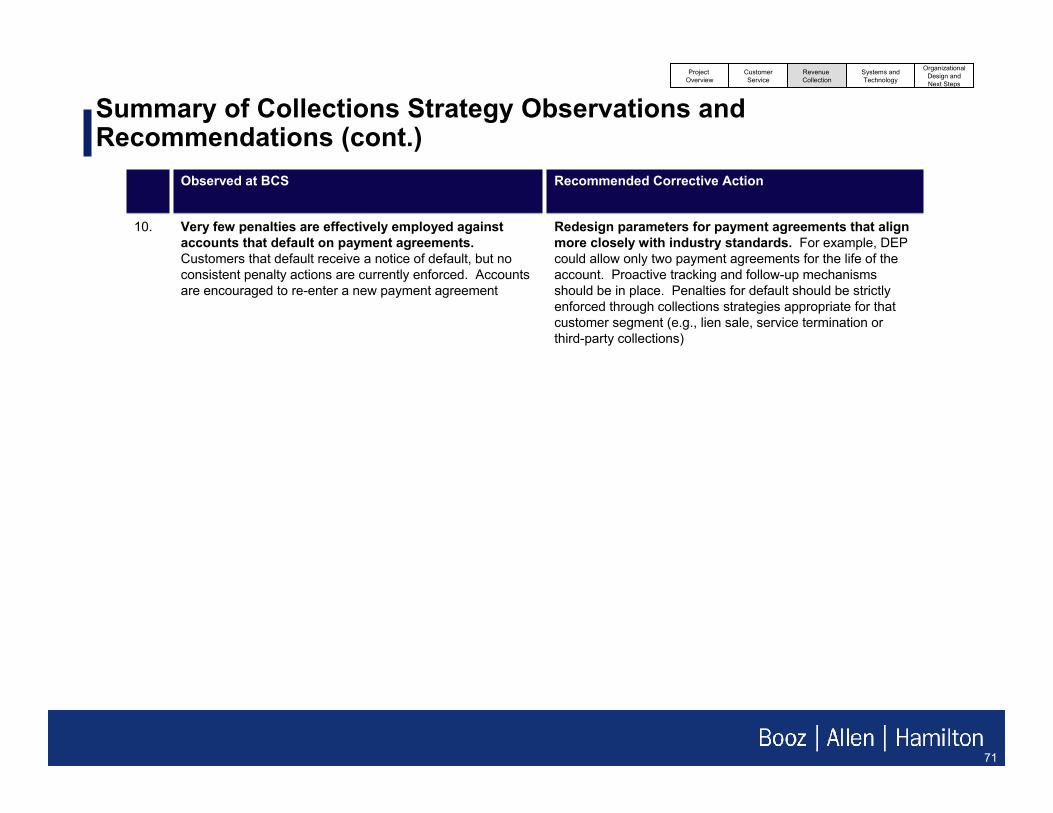
Introduce legislation to grant DEP authority to pursue stand alone lien sales across all Tax Classes (i.e., lien authority independent of Department of Finance requirement of delinquent property taxes)
Expand and Enhance
Stand Alone Lien Sale
Status DescriptionCollections
Enforcement Methods
Recommended Collections
Methods
(1) Implementation underway(2) Currently this treatment option is being implemented through DOITT’s 311 outsourced services to leverage cost and speed factors
Project Overview
CustomerService
Revenue Collection
OrganizationalDesign andNext Steps
Systems andTechnology
59 59
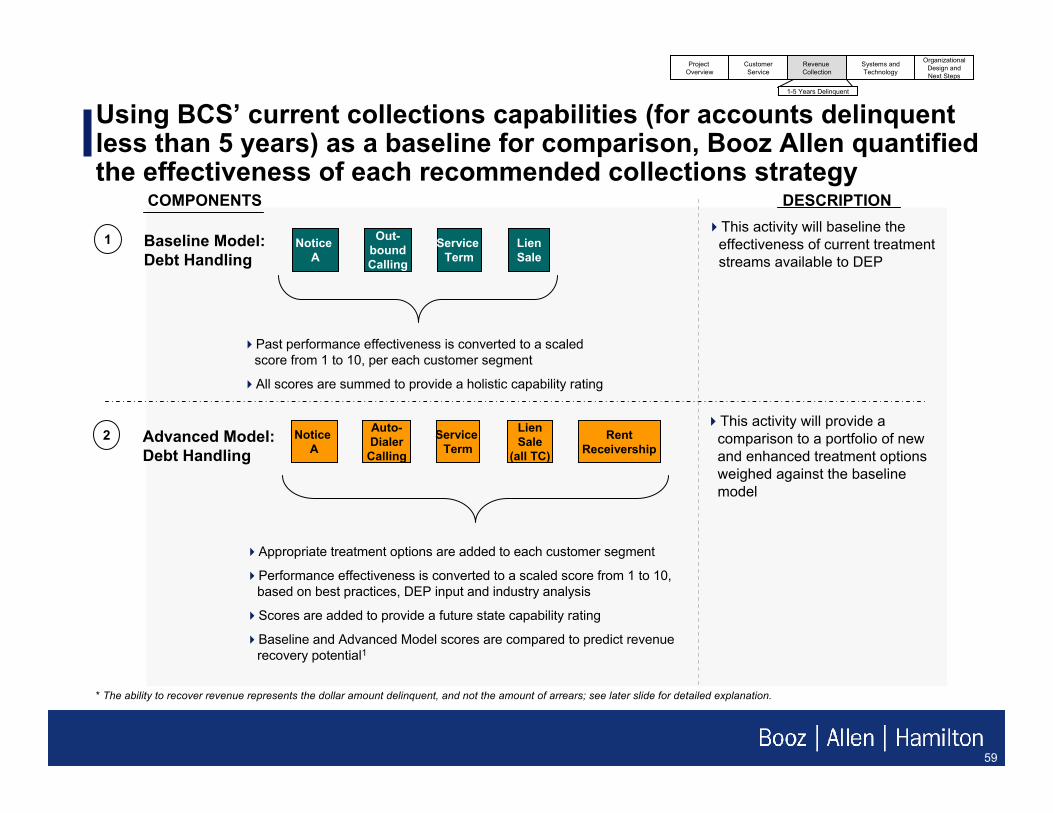
Notice A
Out-boundCalling
Lien Sale
Using BCS’ current collections capabilities (for accounts delinquent less than 5 years) as a baseline for comparison, Booz Allen quantified the effectiveness of each recommended collections strategy
Service Term
Baseline Model: Debt Handling
1
Advanced Model: Debt Handling
2 Notice A
Auto-Dialer
Calling
Lien Sale
(all TC)
Service Term
Rent Receivership
COMPONENTS DESCRIPTIONThis activity will baseline the effectiveness of current treatment streams available to DEP
This activity will provide a comparison to a portfolio of new and enhanced treatment options weighed against the baseline model
Past performance effectiveness is converted to a scaled score from 1 to 10, per each customer segment
All scores are summed to provide a holistic capability rating
Appropriate treatment options are added to each customer segment
Performance effectiveness is converted to a scaled score from 1 to 10, based on best practices, DEP input and industry analysis
Scores are added to provide a future state capability rating
Baseline and Advanced Model scores are compared to predict revenue recovery potential1
* The ability to recover revenue represents the dollar amount delinquent, and not the amount of arrears; see later slide for detailed explanation.
(HDFC's not included in model) 119,100,000 $ 210,422,343 $ 102,429,363 $ 31,587,729 $ 34,314,854 $ 2,353,851 $ 1,530,209 $ 24,820,285 $ 13,386,052 49% 15% 16% 1% 1% 12% 6%
$ 133,273,368 (Estimated Range)
3) We estimate that stand alone lien policy implementation for Tax Class 1 & 2 properties could yield increases in collections that range from $102.4MM to $133.3MM, with the highest estimated amount based on the increase in the number of Tax Class 4 liens sold one year after the 2001 stand alone lien policy change (333% increase in the number of BBL's sold). For additional details, see the Advanced Model assumptions for Tax Class 1 and 2 customer categories
1) The collections model applies to all delinquent A/R aged under 5 years based on the 2/20/2007 OIT A/R data extraction file, not including HDFC's2) The Estimated $ Increase from Impact of the Model ($210.4MM) is not meant to be an annual figure, but one that may be realized over the next few years, depending on the implementation timelines of enhancements and new treatment options.
Estimated $ Value of Increased Collections Attributed to Each Enhanced or New Treatment Option1
Assumptions for Collections Model Summary (Debt < 5 Years)
Collections strategies such as stand alone lien sales, a PaymentIncentive Program, service termination and high-volume outbound calling could help DEP recover 25 - 35 percent in past-due A/R
4) $210.4MM represents the debt from the Collections Model analysis, i.e., debt that is less than 5 years old
Analysis indicates that the effectiveness of Stand Alone Lien authority extended across all Tax Classes will represent approximately 49 percent of the total projected increases in collections
Based on the experience of other water utilities and reengineered processes, this version of the model depicts a 33% recovery rate.
Project Overview
CustomerService
Revenue Collection
OrganizationalDesign andNext Steps
Systems andTechnology
1-5 Years Delinquent
61 61
We conducted a detailed analysis of approximately 8,000 accountsthat have been delinquent more than 5 years
Indicators as to whether there may be issues with the billing history
Billing History
Customer’s payment history –indicators of a current relationship with the customer
Payment History
Indicators as to whether there may be issues with the owner name, address, etc. that could be preventing the owner from receiving the bill
Account Information
The age and size of A/R on the accounts, for each building class category
A/R Distribution
DescriptionTopic of Analysis
Are the delinquent customers in this study population making payments against their outstanding balance?
What are the characteristics of the customers who are not paying?
How do DEP payment rates compare with DOF payment rates?
How old are the outstanding charges on the accounts that have open charges 5 or more years of age?
How is the delinquent A/R distributed among building class categories?
What is the magnitude of the A/R balances among this population, and how much of the A/R is comprised of LPC?
How much of the A/R on the books is more than 5 years old how much is more recent?
What portion of these charges have already been subject to Collections actions?
Key Questions
Project Overview
CustomerService
Revenue Collection
OrganizationalDesign andNext Steps
Systems andTechnology
5+ Years Delinquent
62 62
Building Class Category Accounts Total AR AR > 5 Years Old AR < 5 Years OldResidential: 1 Family 2980 $ 27,145,422 $ 9,064,211 18,081,212$
Residential: 2-3 Family 3107 $ 43,882,073 $ 14,142,641 29,739,432$
Although these accounts have been delinquent for at least five years, almost 70% of the charges were posted from 2003-2007
93
44
0
20
40
60
80
100
120
140
A/R (Millions)
Charges Posted Before 2003Charges Posted 2003-2007$93 M = 68%
$136 M
* This analysis focused on the 8,200 accounts in the Residential and Commercial building class categories. This excludes the “Special” building classes, such as government and religious properties, and HDFCs, because BCS has a process in place for dealing with these accounts on an individual basis. In addition, a few categories of accounts that are known to be mis-categorized are excluded. Finally, these data are from September 13, 2007. For all of these reasons, the total amount shown here differs from the $175 million on Slide 55.
Project Overview
CustomerService
Revenue Collection
OrganizationalDesign andNext Steps
Systems andTechnology
5+ Years Delinquent
Charges posted before 2003
Charges posted 2003 - 2007
63 63
Date of Last DOF Payment
8213759640111898Total
289327658631112003 - 2007
4083379120828561995 - 2002
123710401075931No Payment on Record
Total2003 - 20061996 - 20021979 - 1995No Payment on
RecordDate of Last DEP
Payment
Date of Last DOF Payment
8213759640111898Total
289327658631112003 - 2007
4083379120828561995 - 2002
123710401075931No Payment on Record
Total2003 - 20061996 - 20021979 - 1995No Payment on
RecordDate of Last DEP
Payment
An analysis of payment history over the last 10+ years indicates that customers who are not paying DEP are paying property taxes and other city charges
Tota
l A/R
# of
Acc
ount
s
84% (1040 out of 1237) of the customers with no DEP payment on record have paid DOF between 2003 –2006. The A/R associated with these accounts is
nearly $24 m.
The remaining 197 accounts, comprising $6.5 m in A/R, likely have major issues with the account data
or are no longer valid properties.
93% (3791 out of 4098) of customers whose last payments were between 1995 – 2002 have paid DOF
between 2003 – 2006.
The remaining 292 accounts, comprising $4.8m in A/R, may have problems with account data that
could be repaired through a cross-check with DOF.
DOF payment rates may be higher because many tax bills are paid by mortgage service companies; however, the discrepancies (particularly among DEP customers with little to no payments on record) may in some cases be due to inconsistencies in account data.
Notes:(1) Based on data extract on 09/13/07(2) Excludes HDFCs, A4s, block 99999, lot 9999, “Special” Building
Classes (3) DEP payment records available through 1995
$30,402,750$23,921,821$4,059,277$1,942,713$478,939No Payment on Record
Total2003 - 20061996 - 20021979 - 1995No Payment on
RecordDate of Last DEP
Payment
Project Overview
CustomerService
Revenue Collection
OrganizationalDesign andNext Steps
Systems andTechnology
5+ Years Delinquent
64 64
The re-engineered lien sale process incorporates multiple account review batches to efficiently process larger volumes of accounts for collections and the annual lien sale
Account Review and Pre-Lien Sale Process
Current Lien Sale Process
Q1July
Q2October
Q3January
Q4April JulyFebruary
May 15th
Lien Sale
Account Review (Batch 1)
July
Account Review (Batch 2) Pre-Lien Sale Process
Re-Engineered Future Lien Sale Process – Ideal Year (pending legislation)May 15th
Lien Sale
Reviewed accounts dropped into Collections queue until lien
sale
New list of accounts for
review
New list of accounts for
review
Candidate list for lien sale
Other Collections treatment options may occur simultaneously
Q1July
Q2October
Q3January
Q4April
Project Overview
CustomerService
Revenue Collection
OrganizationalDesign andNext Steps
Systems andTechnology
65 65
A service termination pilot will help DEP collect past-due revenue and discourage additional customers from becoming delinquent
Deliberate and justified pilot program service terminations can enable DEP to clearly demonstrate its determination toward actively enforcing payment policy for residential properties
– Pilot will focus on Tax Class 1 – Single Family Residential (Building Class A)
– Defaulted payment agreement (no substantial payment for six months)
Selective service terminations using accounts with defaulted payment agreements will send the message that DEP can and will start implementing more stringent enforcement methods
Project Overview
CustomerService
Revenue Collection
OrganizationalDesign andNext Steps
Systems andTechnology
Pilot End: Heat Season Starts
2007 Service Termination Pilot Program
Plan Pilot Timeline and Processes
Day 70 Day 30
Develop detailed timelineCoordinate Internal and external communications planning Coordinate processes with other BCS business units
Start Service Terminations
Review regulations and support development of new notices and postingsDocument detailed procedures
Day 15
Document Procedures
Day 3
Ongoing Payment and Customer Processing
Outbound Calls
Terminations
66 66
Leveraging Department of Information Technology and Telecommunications’ 311 call center will allow DEP to implement a cost-effective, high-volume outbound calling campaign
Project Overview
CustomerService
Revenue Collection
OrganizationalDesign andNext Steps
Systems andTechnology
Enables DEP to directly contact customers and provide an immediate mechanism for customers to speak with a trained Collections Department agent– 311 Call Center capacity up to 48,000 calls per day– Option to transfer to a collections CSR during the recording
Permits less costly, widespread, early-stage delinquency treatment against customer segments with generally lower accounts receivable balances– Outbound calls for past-due accounts less than one year old (8,600 accounts)– Also includes potential PIP candidates that have not responded to DEP notices
about the program
Prevents the need for employing vendor staff, conducting vendor training, or sharing sensitive DEP account data with a third party
67 67
The consolidated multi-year plan shows how all treatment options should be rolled out to support a comprehensive collections strategy
How should DEP address the current outstanding debt, and what actions should DEP take to reduce it?
What should DEP do long-term to adjust policies/procedures, to prevent future delinquencies?
(1) The proposed Road Map for the High Volume Outbound Calling treatment option (Auto Dialer) represents the timeline for implementation by DEP. By leveraging DOITT’s 311 infrastructure, timeline for outsourcing this treatment option is shortened to two months for a pilot program
68 68
Summary of Collections Strategy Observations and Recommendations
Work with the A/R strategies recommended, including a new A/R individual to launch an Early Detection Program. Automating management reporting of new delinquencies from the first day of delinquency will allow DEP to strategically recover delinquent debt as early as possible through the use of an AutoDialer, reminder notices, etc. For additional details, see specific, customized (early stage delinquency) collections strategy recommendations by customer segment
Industry research supports the concept that the probability of collecting on delinquent accounts decreases as age of delinquency increases. Currently, DEP does not have a process in place to manage this program. Opportunities exist to work with OIT to begin identifying and managing accounts from first day of delinquency
2.
Use detailed, customer-level aging reports to perform more granular customer segmentation analysis and profiling. The recommended, new A/R individual and the collections department must work in partnership to better understand DEP’s customer profiles and related behavior patterns and/or trending. This information could help BCS promote better customer service delivery, earlier recovery of delinquent debt and more effectively organized business unit staffing
Detailed customer segmentation and profiling is not currently being done at DEP (either within the collections department or within other business units such as account maintenance or call center). Opportunities exist to better understand DEP customers and their behavior and/or trending
3.
Use detailed, customer-level aging reports to track customers by aging categories from time of delinquency. DEP will then be able to more effectively implement collections strategies. DEP will also be able to perform trending analysis and predict customer behavior by having management data on amount of time into delinquent status (see A/R strategies recommendations for aging report requirements), versus having customer account information from five years ago, four years ago, etc.
Recommended Corrective Action
DEP currently lacks the infrastructure to support visibility of A/R from the point of delinquency.Delinquent balances are reported as a snapshot in time; e.g., outstanding balances as of 30 days ago, 60 days ago, 90 days ago, up to five or more years ago. The current collections aging approach impedes DEP’s ability to understand customer behavior from time of delinquency and begin proactive, early delinquency detection programs
1.
Observed at BCS
Project Overview
CustomerService
Revenue Collection
OrganizationalDesign andNext Steps
Systems andTechnology
69 69
Summary of Collections Strategy Observations and Recommendations (cont.)
Assess relationship and policies between BCS customer-facing business units and DEP mail services regarding outgoing bills, notices and phone calls with delivery failures due to incorrect address or phone information. Assess opportunities to improve customer relationships by proactively correcting customer contact information via a centralized, ongoing effort within BCS
Discussions with various DEP stakeholders illustrate a disconnect between mail services and other BCS business units regarding monitoring and corrective action for incorrect/obsolete customer contact information. Returned outgoing mail or unsuccessful phone calls to customers have little visibility, and the impact is neither measured nor controlled
5.
Conduct a thorough exercise in data cleanup on the CIS billing system. Data cleansing efforts will increase accuracy of bills sent to customers, improving DEP's ability to quickly and accurately address complaints directed by customers, other city agencies, the media, etc. This effort includes the purging all test accounts from the production environment, ensuring accurate billing history on remaining accounts and maintaining billing accuracy going forward
Billing errors, account maintenance challenges (e.g., chronically estimated meter charges) and test account data negatively impact collections activity and reporting. Currently, collections staff must contend with poor account billing history. Delinquency reporting is also potentially skewed by test accounts in the CIS production environment
6.
Work with OIT to implement detailed, centralized and comprehensive management reporting on the success rates of each collections strategy (e.g., payment received within x days of AutoDialer voicemail message). Industry practices indicate that success-rate reporting will help DEP periodically modify its collections strategies to maximize effectiveness and lower overall collection costs
Recommended Corrective Action
A comprehensive, centralized reporting tool/mechanism for tracking metrics on all applied collections strategies is not currently available. The success rates of collections activities are currently tracked manually by campaign. In some cases, reporting on strategy success rates is manually and independently tracked by separate borough offices
4.
Observed at BCS
Project Overview
CustomerService
Revenue Collection
OrganizationalDesign andNext Steps
Systems andTechnology
70 70
Develop, implement and train collections staff in standardized operating procedures. Adherence to policies and procedures can result in consistent service and increased confidence in the accuracy of DEP's information
Standardized operating procedures (SOPs) or checklists are not followed consistently by collections staff
9.
Work with OIT to preserve historical data on age of delinquency after billing adjustments. In conjunction with the new aging reports recommended above, this modification will increase DEP's ability to accurately monitor and track customer payment patterns and trends over time
Billing adjustments in CIS lead to a loss of historical age of delinquency data for an account. For example, if an account undergoes a billing adjustment where charges are verified (e.g., in preparation for a lien sale), CIS no longer shows how long the account has been delinquent, eliminating DEP’s ability to track behaviors, payment patterns and trends across customer accounts
7.
Work with OIT to determine a minimum threshold level for bills to be sent (e.g., no bills sent for balances under $5 or $10). This threshold will help DEP redirect the costs of collection toward larger balances
Recommended Corrective Action
Currently, customers can receive bills for very small, residual balances. For example, without a minimal threshold level set for mailing bills from CIS, customers can receive bills for charges that are less than the cost of one stamp. From a collections standpoint, the value of extremely small unpaid balances might be offset by the costs of the collections effort
8.
Observed at BCS
Summary of Collections Strategy Observations and Recommendations (cont.)
Project Overview
CustomerService
Revenue Collection
OrganizationalDesign andNext Steps
Systems andTechnology
71 71
Redesign parameters for payment agreements that align more closely with industry standards. For example, DEP could allow only two payment agreements for the life of the account. Proactive tracking and follow-up mechanisms should be in place. Penalties for default should be strictly enforced through collections strategies appropriate for that customer segment (e.g., lien sale, service termination or third-party collections)
Very few penalties are effectively employed against accounts that default on payment agreements. Customers that default receive a notice of default, but no consistent penalty actions are currently enforced. Accounts are encouraged to re-enter a new payment agreement
10.
Recommended Corrective Action Observed at BCS
Summary of Collections Strategy Observations and Recommendations (cont.)
Project Overview
CustomerService
Revenue Collection
OrganizationalDesign andNext Steps
Systems andTechnology
72 72
Summary: Accounts Receivable (A/R) Strategies
Challenge– BCS has a limited view of its total A/R balance, which results in potentially ineffective collection
efforts and business processes– Difficulty in accessing A/R reporting, analysis and aging results in lack of reconciliation of end-
of-month activities
Approach– Observations relevant to the core A/R business processes, as well as performance metrics,
were noted during interviews with key BCS stakeholders:- How is A/R accuracy and completeness impacted by billing?- How is A/R timeliness impacted by remittance?- What is the impact on effectively and efficiently monitoring and reporting A/R by management and reporting
analysis?
Recommendation– A/R accountability and ownership– Tools that support effective A/R management– A/R governance model
Project Overview
CustomerService
Revenue Collection
OrganizationalDesign andNext Steps
Systems andTechnology
73 73
In addition to pursuing collections strategies and programmatic changes, BCS must improve its underlying ability to effectively manage A/R…
Initial
AD HOCRelatively unstable business process
environment
Best Undefined, manual processes and activitiesActivities may be completed by unskilled staff not appropriate for the functionSignificant error correctionMultiple financial and accounting systems with no integration with other related financial functions (e.g., Procurement, Accounts Receivable, Accounts Payable)Lack of internal control structure
Capability Level
Capability Description
Capability Attributes
Intuitive
INSTINCTIVE / VAGUEProcess established and
repeating; Needs improved documentation of
processes and roles and responsibilities
Managed
DEFINED / MANAGEDPolices, processes and standards defined and
institutionalized;Process and roles and
responsibilitiesdocumented and accountability
established
Optimizing
CONTINUOUS IMPROVEMENT
Continuously improving business processes and controls enterprise-wide;“Chain of accountability”
sustained
BCS Current State
Best Standardized, defined and communicated processes existInternal control structure is documented and polices and procedures are followedDocumented and communicated roles and responsibilities with trained staffAutomated financial and accounting systems are used to process payments and record transactions to the General Ledger, although there is still manual data entryErrors are detected, not prevented
Best practices are widely implemented (e.g., electronic invoice receipt, invoice and document imaging, electronic billing/invoicing)Robust financial reporting Consistent and regular process monitoring and correctionA fully integrated financial and accounting system is used, driven by business needs and processes (e.g., Enterprise Resource Planning (ERP))Internal control structure enables errors to be prevented and corrective action taken to resolve problemsPerformance measurement activities are embedded
Established processes, although some may be disparateUse of automated and manual accounting systems with reliance on moderate manual interventionActivities are performed by skilled staff appropriate for the functionRedundant checks made to detect errorsMultiple financial and accounting systems with limited integration with other related financial functions Limited internal control structure with some policies and procedures documented
Project Overview
CustomerService
Revenue Collection
OrganizationalDesign andNext Steps
Systems andTechnology
74 74
…and transition through recommended organizational changes to a desired future state, where A/R is effectively managed
Orderly A/R customer balances
Robust A/R reporting and
analysis
Recurring and timely A/R
reconciliationFUTURE STATE
Manageable Accounts Receivable Portfolio
OUTCOMEEfficient business processes
Informed decision making and planningTargeted and prioritized collection efforts
Reduced opportunities for fraud, waste and abuseReliable A/R balance
Reduced customer dissatisfaction and
fewer over-aged accounts
Project Overview
CustomerService
Revenue Collection
OrganizationalDesign andNext Steps
Systems andTechnology
TRIGGER
Customer understands the billCustomer has confidence in the accuracy of the billAggressive action taken against delinquency
Fewer estimated billsFewer erroneous billing adjustmentsReduction in late payment charges
Ongoing, detailed analysis of customer A/R balances by customer type, segment, and ageAutomated production of monthly aging schedules / reports
Monthly A/R reconciliations are performed at the summary and detailed customer levelAging reports reconcile to general ledger activity reports
75 75
Establish an authoritative, accountable A/R position within BCS
BCS should designate one individual with an accounting background (CPA preferred) who would be responsible for managing A/R on a daily basis. Suggested responsibilities for this individual include:
–Perform monthly A/R reconciliations (also consider performing revenue reconciliations)–Work in conjunction with OIT to develop, produce and analyze A/R aging schedules / reports on a monthly basis–Develop monthly A/R management reports, and distribute and communicate results to key BCS stakeholders (also consider developing revenue reports and shifting the A/R reporting currently performed by the New York City Water Board to this individual’s area of responsibility) –Work in conjunction with the billing, remittance, refunds, correspondence and collections departments to develop and implement performance measures, update and implement key internal controls, report results, and address issues within these business units that impact A/R (consider aligning the collections department within this individual’s area of responsibility)
Accountability for and ownership of A/R
There is no central management of A/R within BCS. As a result, responsibility for improving processes and remediating issues that affect A/R is dispersed throughout the organization
BCS efforts are primarily focused on collections efforts to reduce the high A/R balance without including key, day-to-day, A/R management activities that assist in the development of guided collections strategies and ensure the reliability and accuracy of the A/R balance
1.
Recommended Corrective Action Observed at BCS
Summary of A/R Observations and Recommendations
Project Overview
CustomerService
Revenue Collection
OrganizationalDesign andNext Steps
Systems andTechnology
76 76
Establish an authoritative, accountable A/R position within BCS (cont.)
–Lead stakeholder planning and decision making for A/R management strategies, and work in partnership with the collections department to develop strategic plans and performance targets for continued efforts to reduce the A/R balance–Work with the New York City Water Board and the Water Finance Authority on an annual basis to develop the annual revenue plan, set revenue performance targets, and determine annual financial statement presentation figures applicable to A/R such as allowance for doubtful accounts and bad debt reserve–Act as the primary BCS point of contact during annual external audits for A/R and work with the external auditors throughout the year to address recommendations
Accountability for and ownership of A/R (cont.)1.
Recommended Corrective Action Observed at BCS
Summary of A/R Observations and Recommendations (cont.)
Project Overview
CustomerService
Revenue Collection
OrganizationalDesign andNext Steps
Systems andTechnology
77 77
Replace CIS with an Enterprise Resource Planning (ERP) application
BCS should strongly consider converting to an ERP application. This ERP application would include an accounts receivable module and be fully integrated and compatible with other modules such as billing and the general ledger
With an ERP application, BCS could realize all of the benefits an ERP system offers and be able to more effectively and efficiently manage A/R. With an ERP system, BCS could:
–Easily generate a suite of standard reports such as aging, days sales outstanding and cash collected versus target–Automatically generate aging reports and categorize receivables individually by age –Enable users to easily gather information from a few number of screens to perform required operations and make adjustments
Customer Information System (CIS) capability to effectively manage A/R
CIS does not have the full suite of capabilities to effectively and efficiently manage A/R
CIS’ current functionality limits BCS’ ability to employ many update-to-date, automated mechanisms for payment processing, billing and collections
2.
Recommended Corrective Action Observed at BCS
Summary of A/R Observations and Recommendations (cont.)
Project Overview
CustomerService
Revenue Collection
OrganizationalDesign andNext Steps
Systems andTechnology
78 78
Replace CIS with an Enterprise Resource Planning (ERP) application (cont.)
–Process direct debits to a customer’s bank account–Flag accounts based on a delinquency condition or bounced check –Independently support the collections process through automated prioritization of accounts for collection action or automated generation of collection letters–Categorize complaints with a reason code, and type or prioritize complaints based on pre-established criteria–Automatically adjust small balance discrepancies
Customer Information System (CIS) capability to effectively manage A/R (cont.)
2.
Recommended Corrective Action Observed at BCS
Summary of A/R Observations and Recommendations (cont.)
Project Overview
CustomerService
Revenue Collection
OrganizationalDesign andNext Steps
Systems andTechnology
79 79
Section 3: Systems and Technology
80 80
Systems and Technology provide supporting tools and infrastructure, enabling DEP to serve its customers more efficiently
Systems and Technology are essential not only to BCS’ back-office functions, but also to its ability to transform into a more customer-focused organization. In addition to the key systems already referenced in the customer service section (CIS and AMR), Booz Allen recommends redesigning the telephone interactive voice response (IVR) system and using new and different technology-based systems to improve management, metrics and quality assurance.
This section approaches BCS customer service delivery channels as an integrated system. Effective use of these channels will enable BCS to provide extensive, accurate and frequent information to the customer to reduce confusion and the need for additional phone calls or written correspondence. New and redesigned systems will increase BCS’ organizational efficiency and significantly enhance the implementation, oversight and management of the other recommendations contained in this report.
Project Overview
CustomerService
Revenue Collection
OrganizationalDesign and Next Steps
Systems andTechnology
81 81
Summary: Systems and Technologies Assessment
Challenge– Limited service delivery channel tools do not allow BCS to deliver world-class customer service– Systems and technology tools for customer service representatives do not allow for efficient and effective
customer handling
Approach– Observations relevant to the core BCS systems and technologies were noted during interviews with key BCS
stakeholders:- How does BCS effectively leverage its service delivery channels?- How has BCS aligned its technology and system applications to deliver on its mission and goals, and how
does technology fit into the needs of meeting current and future BCS customers’ expectations? - What are the tools and processes that BCS uses to communicate needs and requirements to OIT?
Recommendation– Systems and technologies recommendations covered:
- Service delivery channels supported by technology infrastructure- Telephony technology and customer management systems- IT governance structure
Project Overview
CustomerService
Revenue Collection
OrganizationalDesign and Next Steps
Systems andTechnology
82 82
As part of this analysis, Booz Allen completed a detailed technology assessment, which revealed existing, effective processes as well as areas for improvement
Performed a high-level review of BCS operations– Reviewed supporting documentation to understand existing NYC DEP Customer Care operations
for all customer service delivery channels, including Call Center, Correspondence, Website and Walk-in channels
– Reviewed existing customer service programs, including Quality Assurance, Training, Workforce Management and Performance Management in use for each customer service delivery channel
Conducted technology assessment– Reviewed, identified and documented issues concerning BCS Customer Care tools and
technologies, including:CSR Desktop Application, Knowledge Management Systems and other tools used by CSRsTelephony Systems: IVR (Interactive Voice Response) and ACD (Automatic Call Distributor)Performance Optimization Systems: Quality Monitoring, Training, and Workforce Management
– Initiated development of short-, medium- and long-term technology optimization recommendations for BCS across all customer care service delivery channels based on the current state assessment, BCS requirements and industry best practices
Initiated development of technology alternatives, recommendations for improvement and high-level implementation roadmap
Project Overview
CustomerService
Revenue Collection
OrganizationalDesign and Next Steps
Systems andTechnology
83 83
BCS exhibited industry practices in several areas, including staff and supervisor/management tools…Observed BCS Industry PracticesStaff Tools– The BCS IT team has provided users with a convenient way to access BCS applications from a central location
utilizing single sign on via BAPPS. BAPPS is an intranet system that contains a number of browser based applications and serves as a single point of access to BCS systems, external applications, links to external websites, and other useful information
– BCS created an intranet document management library (DMS) for internal use, which contains general information, procedures, policies and templates for staff. Updates to content, including the addition of supplemental documents, is currently required. Upon completion of these updates, staff will be able to centrally access BCS documents
Supervisor/Management Tools – Call center statistics are reported on a regular basis and management works towards (and is achieving) an average
speed of answer (ASA) of under 40 seconds1
– Options to Pay from the Interactive Voice Response Unit (IVR) and the DEP Web site are currently in development to provide customers with convenient bill payment alternatives; this will enhance revenue collection and increase customer satisfaction
– The Office of Information Technology (OIT) developed the System Enhancement (SE) application, to enable the Business Units and OIT to communicate the needs and business requirements of IT-related projects, prioritize requests, share information and track progress of existing IT programs. Process to utilize the SE application has yet to be established
– Call center hours of operations have been extended on Tuesday and Thursday evenings, and the BCS Call Center is open on Saturday, providing customers with an option to contact BCS outside of normal business hours
(1) ASA of 40 seconds statistic is being achieved during Q1, 2007. Annual ASA for 2006 is documented at 4 minutes 26 seconds.
Project Overview
CustomerService
Revenue Collection
OrganizationalDesign and Next Steps
Systems andTechnology
84 84
… but problems also exist; for example, 90 percent of all customer inquiries coming into the call center require live CSR interaction1
Customer Inquiries Call
Center
16%10% 65% 9%Published InformationKnowledge baseSelf Service TransactionsLinks to 3rd party vendorsFrequently Asked Questions
NYC DEP Voice/Web
Self-Service RTS2My bill is wrong or
I am disputing my bill
I don’t understand my bill
I want to pay/ I received a late notice
Field
Level 0Support
Level 1Support
Level 2Support
Level 3Support
Least Expensive Most Expensive
Respond to Customer Inquiries Perform TransactionsPerform Adjustments
CollectionsAccount Maintenance
Appointments
90%
(1) 90% represents all calls taken after subtracting calls coming through the IVR. (Source: NYC DEP Memorandum - Call Center Statistics for Year 2006, January 9, 2007).(2) RTS – Referral Tracking System
Project Overview
CustomerService
Revenue Collection
OrganizationalDesign and Next Steps
Systems andTechnology
85 85
Highlights of the current state analysis were framed around several key questions
How does BCS effectively leverage its service delivery channels?
How has BCS aligned its technology and system applications to deliver on its mission and goals, and how does technology fit into the needs of meeting current and future DEP customers’ expectations?
What are the IT governance-related tools and processes that BCS uses to communicate needs and requirements to OIT?
1
2
3
Project Overview
CustomerService
Revenue Collection
OrganizationalDesign and Next Steps
Systems andTechnology
86 86
BCS service delivery channels are comprised of specific technology elements and processes
How does BCS leverage its service delivery model/channels?
• Processes vary by delivery channel
• Lack of standardization often leads to inconsistent and/or incomplete information provided to customers
• Process documentation and SOPs are available on DMS
• Technology is easily manipulated to over-ride certain information requirements
• Problem resolution is not customer defined, it is based on internal BCS requirements
• Many workflow hand-offs• Exception handling procedures are not
well defined
1
Service Delivery Models/Channels
Processes
Features Elements Description
• BCS Call Center • Mail/Correspondence unit• Borough offices – Walk-in• Web-based customer service
• Types of service offered across delivery channels
• Utilization of telephony tools across various delivery channels
• Utilization of systems tools to support delivery model in place
• Call Center and borough offices handle routine and complex inquiries
• Correspondence unit handles more complex inquiries and formal disputes
• Web-based service is minimal, however, web-based payment option is scheduled to be launched shortly
Project Overview
CustomerService
Revenue Collection
OrganizationalDesign and Next Steps
Systems andTechnology
87 87
Features Elements Description
Telephony Technology
Numerous tools and infrastructure support BCS’ customer service delivery
How has BCS aligned its technology and system applications to deliver on its mission and goals, and how does technology fit into the needs of meeting current and future DEP customers’ expectations?
• Identification of telephony technology required to support organization- Integration- Access to all customer information and Database
• ACD• IVR• Workload
Reporting and Performance Metrics tools
• Telephony systems support customer inquiries received via the telephone
• Telephony technologies include:• Routing tools with skill based / intelligent routing capabilities•VoIP and CTI technology
• Case management and customer relationship management (CRM) tools
• Technologies that increase efficiency and effectiveness, i.e., Wireless, video tools
• Integration between systems and use of Graphic User Interface (GUIs)
• Identification of systems required to support BCS business operations- Full integration- Robust databases- Access to all customer information
• Case Management Systems (CIS, RTS)
• Intranet (BAPPS)
Customer Management Systems
2
• Workforce management and QA tools to determine proper staffing and Agent Performance
• Knowledge management tools and training technologies facilitate training activities
• Identification of systems required to support BCS agent performance and service goals
• Knowledge Management
• Workforce management
• Training• Quality Assurance
Customer Care Supporting Systems
AA
BB
CC
Project Overview
CustomerService
Revenue Collection
OrganizationalDesign and Next Steps
Systems andTechnology
88 88
Understanding and communicating business needs between BCS departments and OIT will help drive customer care technology enhancements
What are the tools and processes that BCS uses to communicate needs and requirements to OIT?
3
OrganizationalStructure
Features Elements Description
• Clear ownership and accountabilities
• High-level of empowerment of service professionals
• Aligning roles and responsibilities with appropriately skilled resources
• Right Span of Control
• Evolution towards a service-oriented customer base organization
• Evolving model that optimizes ratio of service professionals to team leader
• Buy-in of strategy and mission statement
• Stakeholder involvement in strategic decisions
• Vision• Communication
Continuous dialogue with resources, e.g., structured mechanisms such as regularly scheduled meetings
StakeholderCommitment
Resources • On-going training • Recruiting & Training
• Intensive training (initial and on-going)• Continuous testing of knowledge• Career path and levels clearly defined
with proper compensation scenarios
Project Overview
CustomerService
Revenue Collection
OrganizationalDesign and Next Steps
Systems andTechnology
89 89
To begin, Booz Allen prioritized IT investment opportunities based on specific evaluation criteria
Evaluation Criteria
Estimated BenefitWhat is the projected benefit associated with the recommendation? (High, Medium, Low)
Implementation EffortWhat is the expected level of effort required for implementation? (High, Medium, Low)
Time to ImplementWhat is the expected time requirements to implementation? (High, Medium, Low)
CostWhat are the expected costs associated with each recommendation? (High, Medium, Low)
The team helped identify, review and prioritize technology improvement opportunities along four key evaluation criteria:
Prioritized Recommendations to Improve Customer Service
Performance
Quality Assurance
Work Force Mgmt IVR
AutoDialerBilling Application
Single Point of Access
Data Warehouse
Project Overview
CustomerService
Revenue Collection
OrganizationalDesign and Next Steps
Systems andTechnology
90 90
Booz Allen then designed system recommendations to help improve the customer experience and optimize internal efficiencies Summary:
Provide BCS personnel with a new Billing/Customer Management System
Enhance management’s ability to measure departmental and individual performance through the implementation of automated Workforce Management and Quality Assurance systems
Enhance management’s ability to measure individual and departmental performance by implementing a Data Warehouse
Upgrade the current IVR technology in order to:– Facilitate enhanced self-service capabilities– Enable the deployment of skills based call
routingIVR
Single Point of Access(Telecom)
StrategicVision
Customer Facing Impact
Internal Optimization
AutodialerCSR
Desktop
WorkforceManagement
Quality Assurance
Enhanced Self ServeCapabilities
Skill basedRouting
DataWarehouse
Future State Recommendations
Project Overview
CustomerService
Revenue Collection
OrganizationalDesign and Next Steps
Systems andTechnology
91 91
The recommended BCS IT tools framework builds on existing infrastructure
Infrastructure
Foundation Systems
Enabling Technologies
The technologies outlined above are important to the long-term strategy of BCS, but due to resource limitations and business uncertainty, the relative importance of each technology compared to the other
technologies needed to be determined. The above framework, along with BCS’ business strategy, was used to prioritize investment initiatives.
Telecommunications capacity, bandwidth, etc
Data Warehouse, Call Quality Assurance software, Workforce Management software, Single Point of Access
IVR, AutoDialer, Billing/Customer Management System
Project Overview
CustomerService
Revenue Collection
OrganizationalDesign and Next Steps
Systems andTechnology
92 92
Implement tools to improve customers’ call handling experiences and more efficient use of staff resources
DEP should implement more self-service channels such as web-based account management tools
DEP should create common set of procedures as part of a larger continuous learning training to promote consistency in standardized inquiry responses
Service delivery channels do not provide customers with robust options for world-class customer service
Intelligent workflow routing is not utilized and self-help capabilities are limited
– Call center does not utilize skills-based routing– Limited self-help capabilities exist via the IVR and
Web
Multiple, disconnected input channels create inconsistent service delivery
– Customers can “answer shop” through BCS’ different communications channels (e.g., call center, walk-in) and might receive different answers to the same inquiry
No standardized inquiry response process– Staff members access different systems to answer
similar inquiry types; however, there are no standardized processes or procedures in place to ensure consistency of information provided to the customers (e.g., property information can be obtained from ACRIS, GOAT and RPAD)
1.
Recommended Corrective Action Observed at BCS
Summary of Systems and Technology Observations and Recommendations
Project Overview
CustomerService
Revenue Collection
OrganizationalDesign and Next Steps
Systems andTechnology
93 93
BCS should implement more self-service capabilities through IVR and additional telephony tools such as CTI
BCS Management should track accurately track customer inquiries and workload and standardization of inquiry reporting– this impacts the ability to see the holistic view of BCS activities across the business units
Tools such as CTI integration with the IVR will decrease costs associated with handling a customer
Offering more self-service capabilities will substantially improve the customer experience and reduce BCS’ operational costs
Antiquated telecommunications and system applications do not help BCS deliver on its mission and goals
Multiple telephone numbers are used by customers to contact DEP
– Customers contact DEP by calling the BCS call center, BCS business units, personal telephone lines of DEP staff members, and field office locations to receive similar types of service and inquiry resolution
– Inconsistent contact information is being distributed throughout different channels
IVR does not support Computer Telephony Integration (CTI) or future migration to VoIP, if required
– BCS IVR tool does not have the capability to support CTI or VoIP, minimizing intelligent routing options and integration of the IVR with BCS customer management systems
The IVR offers a limited number of self-service capabilities
– Basic and routine inquiries (e.g., account information, payment status) are handled by CSRs due to minimal self-service capabilities offered via the existing IVR tool
2.
Recommended Corrective Action Observed at BCS
Summary of Systems and Technology Observations and Recommendations (cont.)
Project Overview
CustomerService
Revenue Collection
OrganizationalDesign and Next Steps
Systems andTechnology
94 94
BCS should implement more self-service capabilities through IVR and additional telephony tools such as CTI
Access to multiple systems and/or screens (to perform basic account maintenance functions) will result in fewer potential errors, re-work, and duplication of effort
A more robust set of desktop tools will reduce common errors and allow for more efficient use of processes when performing account updates/changes. This change can result in less re-work, fewer customer call backs, and ultimately, higher customer satisfaction
Antiquated telecommunications and system applications do not help BCS deliver on its mission and goals (cont.)
Current suite of desktop systems offers some integration across applications, but requires CSRs to keep multiple applications open simultaneously
– Current tools offer limited functionality to service DEP customers and staff, and require execution of additional steps to make basic changes/updates to customer accounts
– Several BCS systems contain information that is different in nature, but related to the same customer accounts (i.e., CIS / Hansen). Current limitations require staff to make account updates numerous times
There are some limitations of current tools to manage workload and performance metrics across BCS business units
– Business units utilize various tools and technologies to manage workload and measure performance
2.
Recommended Corrective Action Observed at BCS
Summary of Systems and Technology Observations and Recommendations (cont.)
Project Overview
CustomerService
Revenue Collection
OrganizationalDesign and Next Steps
Systems andTechnology
95 95
BCS should implement more productivity tools such as workforce management systems to optimize customer service staffing
Implementing a workforce management system would reduce potential mis-alignment of staff to call arrival patterns, and improve staff utilization, service levels and customer satisfaction rates
Other supporting tools do not adequately provide the mechanisms for BCS staff members to perform their jobs efficiently
Workforce scheduling is performed manually– Staffing requirements are determined manually,
using tracking and manager’s historical, intuitive experience
– Managers might not be fully utilizing the ACD reporting capabilities (addressed in OPAI)
System-generated reports might not provide adequate information to efficiently manage the quality assurance (QA) process
– Managers might not be fully utilizing BAPPS reporting capabilities (addressed in OPAI)
– Formal reports for BCS management that detail QA audit results have been discontinued pending report upgrade/assessment
3.
Recommended Corrective Action Observed at BCS
Summary of Systems and Technology Observations and Recommendations (cont.)
Project Overview
CustomerService
Revenue Collection
OrganizationalDesign and Next Steps
Systems andTechnology
96 96
BCS should implement an IT governance process
Lack of a formalized governance structure to manage the flow of requests from business units to the IT department puts stress on resources and results in silo-centric IT initiatives
Completion of other IT programming projects are often impacted, resulting in potential delays
Understanding the ROI / business case for each IT-related projects challenges the priority and vision for how to fund future IT projects
Lack of a comprehensive, structured and prioritized pipeline of IT requests can affect BCS’ ability to:
–Identify impacts of project progress on business operations; e.g., prioritization of projects–Drive future IT needs
While an IT governance process has been developed to manage communication between OIT and business units, it is not currently in use by BCSOIT works with its limited staff resources to balance the priorities of multiple business units’ IT-related projectsBusiness units compete for system development resources while requesting ad-hoc data and system requestsHigh-priority reporting requests often require a quick turn-around. Issues are escalated to expedite the development timelineThe SE application was created to track IT-related projects and provide BCS senior management with a comprehensive view of system enhancements and change requests; SE is not currently utilized by all BCS unitsA process for gathering requirements between OIT and business units has not been established
4.
Recommended Corrective Action Observed at BCS
Summary of Systems and Technology Observations and Recommendations (cont.)
Project Overview
CustomerService
Revenue Collection
OrganizationalDesign and Next Steps
Systems andTechnology
97 97
Section 4: Organizational Design and Next Steps
98 98
Organizational Design serves as the future foundation of work already underway; new roles and responsibilities will help institutionalize transformation at BCS
Booz Allen is working with BCS to propose a new organizational structure to assist in the development, implementation and perpetuation of transformation.
As part of this effort, Booz Allen benchmarked BCS against water utilities nationally and evaluated internal BCS systems to develop recommendations.
To ensure these recommendations are implemented efficiently and effectively, Booz Allen is developing integrated timelines and roadmaps that include organizational design and build on the work already started by BCS staff, such as AMR. This section features an overall timeline for BCS transformation, with major changes continuing during the next few years.
Project Overview
CustomerService
Revenue Collection
OrganizationalDesign and Next Steps
Systems andTechnology
99 99
Currently, BCS is organized into seven divisions that support anarray of functions in addition to water and sewer billing
Bureau Administration – Manages human resource activities, procurement and fleet/ facilities
Management Analysis – Primary function is to resolve difficult or high-profile account issues
Technical Services – Responsible for the management and oversight of larger water meter repair, inspection, installation and conservation programs, and the AMR program
Central Operations – Responsible for managing the five borough offices, permit compliance, and lien sales
Collections – Responsible for identifying delinquent accounts and corresponding with customers to collect funds
Customer Operations – Primarily responsible for managing the central office’s correspondence with customers through the call center and written correspondence
Billing Operations – Responsible for processing customer data used to generate bills and conducting quality assurance reviews of billing data
Bureau of Customer Services
Management Analysis
Bureau Administration
Collections
Technical Services
Central Operations
Customer Operations
Billing Operations
Current Organization
(1)Ten core processes include: Account Setup/Update, Metering, Billing, Remittance, Inspection / Meter Repair or Replacement, Billing Adjustment, Refund, Collections and Annual Lien Sales and Foreclosures, and Customer Handling (Call Center, Web, Correspondence and Walk-ins)
Project Overview
CustomerService
Revenue Collection
OrganizationalDesign and Next Steps
Systems andTechnology
100 100
Booz Allen’s review of organizational design involved a series of interviews, working groups and workload inventory tasks focused on three key questions
What are the key issues associated with BCS’ current organization structure, core operational processes and workforce?
How do BCS operations compare to industry best practices, future operating vision and unique customer needs?
How is workload allocated across BCS, and where are there potential opportunities for eliminating duplicate functions or streamlining current processes?
Project Overview
CustomerService
Revenue Collection
OrganizationalDesign and Next Steps
Systems andTechnology
101 101
An analysis of existing organizational structures identified several key challenge areas
Project Overview
CustomerService
Revenue Collection
OrganizationalDesign and Next Steps
Systems andTechnology
Workload Balancing: Workload and staff not distributed proportionally across boroughoffices
Flexibility: Inability to shift work between the central and borough offices
Best Practices Transfer: Obstacles for knowledge transfer between borough offices
Process Standardization: Variation in procedures and process implementation across borough offices
Management Structure: Organizational structure with unnecessary layers of management
102 102
Based on these challenges, Booz Allen developed a proposed organization structure that combines industry best practices andemployee feedback with a focus on customers The new design will help BCS better perform water and sewer billing; water meter installation, replacement and inspection; and promotion of water conservation. Overall, it will support BCS in achieving world-class customer service
Project Overview
CustomerService
Revenue Collection
OrganizationalDesign and Next Steps
Systems andTechnology
Bureau of Customer ServicesDeputy Commissioner
Bureau Administration
Director
Transition/ Program
Management Office Director
Exemptions Manager
Correspondence Manager
Mail Services Manager
Quality Assurance Manager
Training and Continuous
Improvement Manager
Methods and Procedures
Manager
Refunds and Remittance
Customer Outreach Services
Contact Center Manager
Customer Services Manager
Financial Services Director
Accounts Receivable Manager
Management Analysis Manager
Bureau of Customer ServicesAssistant Commissioner
EHSManager
Field Operations / Borough
Offices
Batch Processing
Manager
Account Maintenance
Manager
Clerical Processing
Manager
Technical Services Manager
Universal Metering
Meter Test Facility
Meter and Technical Services
Director
Account ServicesDirector
311
Elected Officials
General Inquiries
Collections
Lien Sales
Collections and Lien Sales
Manager
Customer Care Services Director
Central Inspections Borough
Customer Service
Borough Office
Inspections
103 103
Promote customer handling strategy though alignment of all customer-facing operations under one centralized unit
Collections will become a component of the Customer Care Services division
Enable BCS transformation through the designation of a principalchange manager, responsible and accountable for the technology/ process redesign and implementation
Creation of temporary Transformation/ Program Management office and director position
Reduce number of duplicate inspectionsInspections will be managed centrally under the Customer Care Services Division
Ensure that customer facing employees are appropriately trained,skilled, empowered and motivated
Establish Training and Continuous Improvement unit under Bureau Administration
Allow for better coordination and more flexibility as new technologies are implemented
Consolidation of Inspections and Technical Services into one division
Allow for more consistent processing and ability to distribute workload evenly
Clerical processing functions will be managed centrally under the Account Services division
Promote better integration and communication between finance functions by grouping linked functions together under the finance director
Creation of Financial Services division and director position
BenefitsKey Changes
Key changes in the proposed design include the creation of new divisions to help BCS in its modernization efforts
Project Overview
CustomerService
Revenue Collection
OrganizationalDesign and Next Steps
Systems andTechnology
104 104
The centralized Customer Care Services division will be responsible for all customer-facing functions
Business Unit ResponsibilitiesContact Center, Collections - Responsible for handling all customer calls and managing and tracking problem resolution resulting from phone calls; Responsible for identifying past due balances, corresponding with customers regarding delinquent accounts and establishing and monitoring payment agreementsCorrespondence - Responds to and addresses customer inquiries and concernsMail Services - Receives incoming mail, responds to simple inquiries and forwards more complex requests to correspondence, verifies and validates addresses, follows up on returned mailExemptions – Enroll customers in special billing programsInspections- Conduct inspections in response to customer requests or account issues, manage meter reading contractBorough Office Customer Service - Responsible for permit process and handling all walk-in customer payments and issuesField Operations / Borough Offices
BenefitsA tiered customer service model, which most closely resembles how “best practice” organizations structure contact center operations to handle each inquiry with the best available resource (i.e., lowest cost or best skilled, etc.)Collections will integrate lien sales and foreclosures
Project Overview
CustomerService
Revenue Collection
OrganizationalDesign and Next Steps
Systems andTechnology
Exemptions Manager
Correspondence Manager
Mail Services Manager
Refunds and Remittance
Customer Outreach Services
Contact Center
Manager
Customer Services Manager
Field Operations /
Borough Offices
311
Elected Officials
General Inquiries
Collections
Lien Sales
Collections and Lien
Sales Manager
Customer Care Services Director
Central Inspections Borough
Customer Service
Borough Office
Inspections
105 105
Business Unit ResponsibilitiesAccounts Receivable– Conduct planning and decision making for A/R
A/R management reports and distribute and communicate results to key BCS stakeholders
Remittance and Refunds– Process refund applications and remittancesManagement Analysis– Resolve difficult or high-profile account issues, with a
focus on delinquent accounts
BenefitsIncrease communicationFacilitate financial reportingFacilitate performance measurement across key finance functionsFacilitate rate and revenue generation processesStrategic approach to financial management
The Finance division will be responsible for the new accounts receivable unit, which includes reporting and analysis functions, remittance, and refunds
Financial ServicesDirector
Accounts Receivable Manager
Management Analysis Manager
Project Overview
CustomerService
Revenue Collection
OrganizationalDesign and Next Steps
Systems andTechnology
106 106
Business Unit ResponsibilitiesMethods & Procedures - Identify, document and disseminate standard operating procedures and BCS best practicesTraining & Continuous Improvement - Develop new hire and ongoing training, identify and address process improvement opportunities Quality Assurance - Conduct quality assurance reviews of manual billing adjustments (including activities across all units)
BenefitsStandard Operating Procedures (SOPs) would be developed for key functionsMore robust quality assurance function would facilitate proper executing of SOPsFeedback from Quality Assurance would be incorporated into Training
The Bureau Administration division will be responsible for quality assurance, methods and procedures, and training
Project Overview
CustomerService
Revenue Collection
OrganizationalDesign and Next Steps
Systems andTechnology
Bureau Administration
Director
Quality Assurance Manager
Training and Continuous
Improvement Manager
Methods and Procedures
Manager
EHSManager
107 107
Business Unit ResponsibilitiesTechnical Services – Install meters and administer contracts for meter replacement, manage R&D and implementation of new technologies
BenefitsProvides more flexibility of staffing as technology and responsibilities change
Meter and Technical Services
Technical Services
Universal Metering
Meter Test Facility
The Meter and Technical Services division will be responsible for water meter installation and replacement as well as R&D process management and new technology implementation
Project Overview
CustomerService
Revenue Collection
OrganizationalDesign and Next Steps
Systems andTechnology
108 108
The Account Services division will be responsible for accuracy of customer account data, account management and clerical processing
Business Unit ResponsibilitiesAccount Maintenance - Handle complex account issuesBatch Processing - Review and resolve exception reports generated for meter readings and posted billsClerical Processing - Process and closeout work orders
BenefitsMore integrated account maintenance function which will handle complex casesCentralized clerical processing will allow for better controls over processing currently performed in the borough offices
Account ServicesDirector
Clerical Processing Manager
Batch Processing Manager
Account Maintenance Manager
Project Overview
CustomerService
Revenue Collection
OrganizationalDesign and Next Steps
Systems andTechnology
109 109
Summary of Organizational Design Observations and Recommendations
Centralize clerical processing functions, including work order processing and closeout, under account services to allow for more consistent processing and facilitate an even workload distribution. Implement technology solutions to support centralization
BCS has limited ability to track and manage workload and staff across borough offices. Due to the decentralized structure, each borough is responsible for processing any customer inquiries received at the individual borough office. The manual tracking process results in discrepancies between work performed and what is reported. There is also an inability to shift work between the central and borough offices, because manual, paper-based processes do not give the required flexibility to move work, records and staff between boroughs, and alleviate backlog
2.
Centralize management of inspections under the field operations unit in the customer care division. Conduct inspection scheduling through the centralized clerical processing unit and implement criteria that specifies when inspections will be assigned to certain inspection groups
It is difficult to track and manage inspections, resulting in inefficient use of inspection resources. Multiple inspections are being requested for the same property by different units within BCS, and inspectors frequently work overtime to keep up with the number of inspections. Revenue-generating inspections are not being performed consistently (e.g., re-inspections after violations notices)
3.
Establish training and continuous improvement as well as methods and procedures units to ensure customer-facing employees are appropriately trained, skilled, empowered and motivated. Expand quality assurance reviews beyond billing adjustments. For example, a sample of inspections should be reviewed from the point of referral through closeout. Centralize complex billing adjustments via the account maintenance unit
Recommended Corrective Action
There is a lack of standardization for key customer service processes across the organization. For example, although billing adjustments are performed by employees in five BCS divisions, the billing adjustments policy is not standardized, resulting in decisions about billing adjustment made at the discretion of each unit
1.
Observed at BCS
Project Overview
CustomerService
Revenue Collection
OrganizationalDesign and Next Steps
Systems andTechnology
110 110
As a next step, BCS should determine where it belongs on the service continuum
Strategic (Service-oriented)
Busin
ess I
mpa
ct
Process IntegrationTactical (Cost- oriented)
Strategic
Necessary Valued AssetService
DifferentiatorEnterprise-Wide Strategic Value
Transaction Receipt Focused:
• Simple queues• Limited stats• Ad-hoc training and
QA• Ad-hoc processes
and procedures
Operationally Oriented:• Performance and quality
mgmt is performed• Standard Procedures• Some specialization
Strategic:• Self-service web• Skills based routing• Specialization where
appropriate
Leading Edge:• Integrated multimedia• Data mining focus• Customer-focused reporting• Customer segmentation
Essential Service is DeliveredEssential Service is
Delivered
IncreasedCustomer ServiceIncreased
Customer Service
Relationship ManagementRelationship
Management
Enterprise-WideCustomer MgmtEnterprise-Wide
Customer Mgmt
Current State: BCS focuses on each
customer transaction as a one-time event
Current State: BCS focuses on each
customer transaction as a one-time event
BCS should focus on business needs from an organizational viewpoint, and determine which point on the continuum is the most
effective/efficient for the organization
Where does it makes sense for
BCS to be?
Where does it makes sense for
BCS to be?
Project Overview
CustomerService
Revenue Collection
OrganizationalDesign and Next Steps
Systems andTechnology
111 111
The consolidated multi-year collections plan will improve customer service, collection of outstanding receivables, and overall efficiency and effectiveness
(1) The proposed Road Map for the High Volume Outbound Calling treatment option (Auto Dialer) represents the timeline for implementation by DEP. By leveraging DOITT’s 311 infrastructure, timeline for outsourcing this treatment option is shortened to two months for a pilot program