Oxygen, a fundamental property regulating pelagic ecosystem structure in the coastal southeastern tropical Pacific. Bertrand A., Chaigneau A., Peraltilla S., Ledesma J., Graco M., Monetti F. & Chavez F.P. O 2. Context. - PowerPoint PPT Presentation
Oxygen, a fundamental property regulating pelagic ecosystem structure in the coastal southeastern tropical Pacific Bertrand A., Chaigneau A., Peraltilla S., Ledesma J., Graco M., Monetti F. & Chavez F.P. O 2
Transcript
Oxygen, a fundamental property regulating pelagic ecosystem structure in the coastal southeastern tropical Pacific
Bertrand A., Chaigneau A., Peraltilla S., Ledesma J., Graco M., Monetti F. & Chavez F.P.
O2
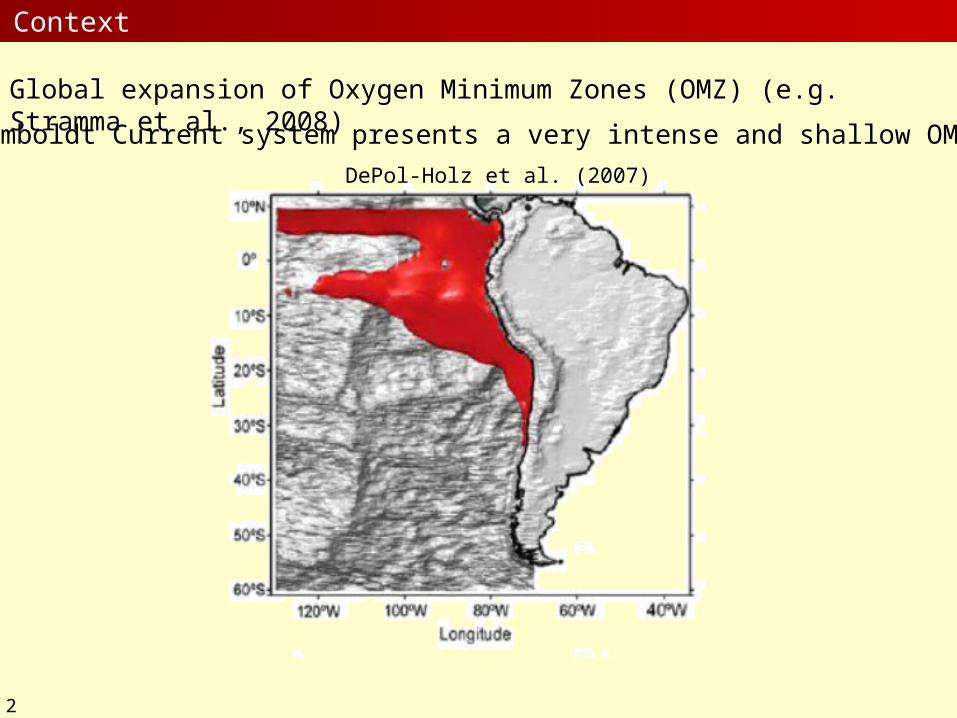
Global expansion of Oxygen Minimum Zones (OMZ) (e.g. Stramma et al., 2008)
DePol-Holz et al. (2007)
The Humboldt Current system presents a very intense and shallow OMZ
2
Context
3
(Bertrand et al., 2008, PinO)
Context: For fish and plankton, oxygen does matter
In some cases: almost no room for fish (<10 m), anchoveta seems to manage but what about
sardine or jack mackerel?
De
pth
(m
)
OMZ
DO (mL/L)
Ballón et al. (2011, PinO)
Fish need both food and oxygen, the latter might be more difficult to obtain than the former (Pauly, 2010)
4
Context: For fish and plankton, oxygen does matter
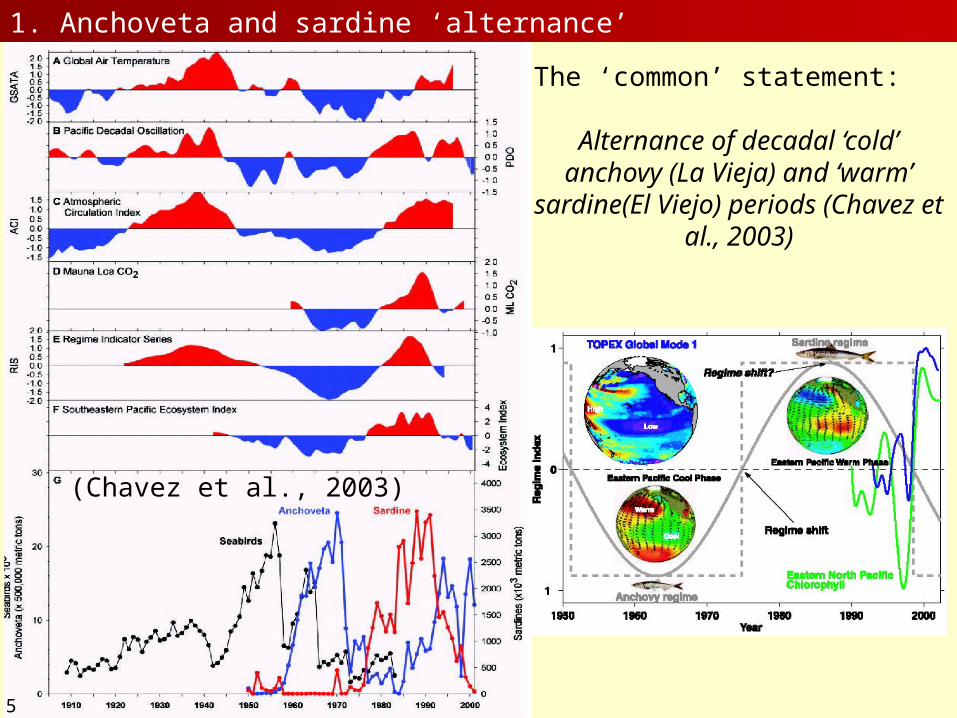
The ‘common’ statement:
Alternance of decadal ‘cold’ anchovy (La Vieja) and ‘warm’
sardine(El Viejo) periods (Chavez et al., 2003)
5
(Chavez et al., 2003)(Chavez et al., 2003)
1. Anchoveta and sardine ‘alternance’
5
6
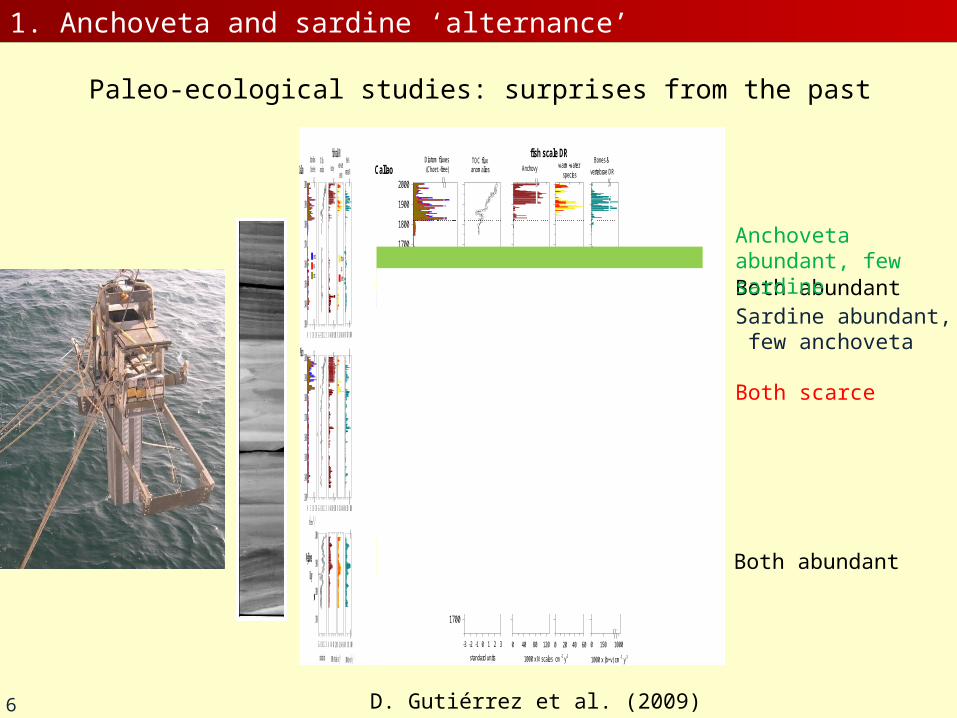
Paleo-ecological studies: surprises from the past
0 40 80 300
standard units
-3 -2 -1 0 1 2 3
Year
1700
1800
1900
2000
-3 -2 -1 0 1 2 3
-3 -2 -1 0 1 2 3
Year
TOC flux anomalies
0 40 80 300
1000 x N scales cm-1 y-1
0 40 80 120
Anchovy
0 20 40 60
offshore
spp.
sardine
0 20 40 60
Callao
Pisco
Mejillones
Bay
0 150 1000
Bones &
vertebrae DR
0 150 1000
0 20 40 60
1000 x (b+v) cm-1 y-1
0 150 1000
warm-water species
Diatom fluxes (Chaet.-free)
0 5 10 301300
1400
1500
1600
1700
1800
1900
2000
oceanic
meroneritic
0 5 10 301300
1400
1500
1600
1700
1800
1900
2000
fish scale DR
106 tests cm
-2 y-1
0 40 80 300
standard units
-3 -2 -1 0 1 2 3
Year
1700
1800
1900
2000
-3 -2 -1 0 1 2 3
-3 -2 -1 0 1 2 3
Year
TOC flux anomalies
0 40 80 300
1000 x N scales cm-1 y-1
0 40 80 120
Anchovy
0 20 40 60
offshore
spp.
sardine
0 20 40 60
Callao
Pisco
Mejillones
Bay
0 150 1000
Bones &
vertebrae DR
0 150 1000
0 20 40 60
1000 x (b+v) cm-1 y-1
0 150 1000
warm-water species
Diatom fluxes (Chaet.-free)
0 5 10 301300
1400
1500
1600
1700
1800
1900
2000
oceanic
meroneritic
0 5 10 301300
1400
1500
1600
1700
1800
1900
2000
fish scale DR
106 tests cm
-2 y-1
D. Gutiérrez et al. (2009)
Both abundant
Both scarce
Anchoveta abundant, few sardine
Sardine abundant, few anchoveta
Both abundant
1. Anchoveta and sardine ‘alternance’
1. Anchoveta and sardine variability
Ayón et al. (2011)
Anchovy is more abundant when macrozooplankton dominate while sardine is more abundant when small zooplankton is abundant
But sardine is able to forage on macrozooplankton (Espinoza et al., 2009)So what?
1. Anchoveta and sardine variability
8D
en
sity
Area
High biomass
Lowbiomass
(i) Constant density model: density stays constant and the area covered by the stock varies with abundance (Iles and Sinclair, 1982; Hilborn and Walters, 1992)
Habitat selection and dynamics: some models (see Barange et al., 2009):
(ii) Proportional model, where the area occupied stays constant and local density varies proportionally to abundance (Houghton, 1987; Myers and Stokes, 1989; Hilborn and Walters, 1992; Petitgas, 1997)
De
nsi
ty
Area
(iii) Basin model, where density and area vary with abundance (MacCall, 1990).
De
nsi
tyArea
1. Anchoveta and sardine variability
Basin model (MacCall, 1990): when a fish population increases it will occupy new habitat.
First the fish, then the habitat...
Horizontal distribution of anchoveta: limited by the cold coastal waters (CCW) + mix waters, independent of its abundance; when the habitat range increases during a certain time abundance increases (Bertrand et al., 2004,
2008; Swartzman et al., 2008).
1995 Feb-Apr
lon (deg. S)
lat (
de
g. W
)
-82 -78 -74 -70
-15
-10
-5 CCWMCSSSWSEWSTWCAWMRWMESC
lon (deg. S)
lat (
de
g. W
)
-82 -78 -74 -70
-15
-10
-5 anchovysardine
1996 Feb-Apr
lon (deg. S)
lat (
de
g. W
)
-82 -78 -74 -70
-15
-10
-5 CCWMCSSSWSEWSTWCAWMRWMESC
lon (deg. S)la
t (d
eg
. W)
-82 -78 -74 -70
-15
-10
-5 anchovysardine
1996 Nov-Dec
lon (deg. S)
lat (
de
g. W
)
-82 -78 -74 -70
-15
-10
-5 CCWMCSSSWSEWSTWCAWMRWMESC
lon (deg. S)
lat (
de
g. W
)
-82 -78 -74 -70
-15
-10
-5 anchovysardine
However…
MacCall (1990) basin theory since we observed that
first 'comes the habitat', then the fish...
Sardine: much more ubiquist in terms of water mass but distribution always more offshore than anchovy (why?).
9
Habitat-based hypothesis (Bertrand et al., 2004, 2008, 2010):
Variations in the range of habitat constrain the extension-contraction of fish distribution and determine their abundance if
favourable or unfavourable conditions last long enough to influence their population dynamics.
First the habitat, then the fish (bottom-up process)...
1. Anchoveta and sardine variability
10
Intermediate period Strong upwelling period
Voir également Massé et Gerlotto, 2003)
19
83
19
84
19
85
19
86
19
87
19
88
19
89
19
90
19
91
19
92
19
93
19
94
19
95
19
96
19
97
19
98
19
99
20
00
20
01
20
02
20
03
Index of biomass
(a) (b) (c)
19
83
19
84
19
85
19
86
19
87
19
88
19
89
19
90
19
91
19
92
19
93
19
94
19
95
19
96
19
97
19
98
19
99
20
00
20
01
20
02
20
03
19
83
19
84
19
85
19
86
19
87
19
88
19
89
19
90
19
91
19
92
19
93
19
94
19
95
19
96
19
97
19
98
19
99
20
00
20
01
20
02
20
03
Index of biomass
(a) (b) (c)
19
83
19
84
19
85
19
86
19
87
19
88
19
89
19
90
19
91
19
92
19
93
19
94
19
95
19
96
19
97
19
98
19
99
20
00
20
01
20
02
20
03
Index of biomass
(a) (b) (c)
19
83
19
84
19
85
19
86
19
87
19
88
19
89
19
90
19
91
19
92
19
93
19
94
19
95
19
96
19
97
19
98
19
99
20
00
20
01
20
02
20
03
19
83
19
84
19
85
19
86
19
87
19
88
19
89
19
90
19
91
19
92
19
93
19
94
19
95
19
96
19
97
19
98
19
99
20
00
20
01
20
02
20
03
Index of biomass
(a) (b) (c)
Mixed sardine-anchovy
dominanceAnchovy
dominanceand sardine
collapse
Full anchovyera
Habitat-based hypothesis
11
Weak upwelling period
Retention-transportSee Lett et al. (2007) and Brochier et al. (2010)
Sardine is ubiquitous relative to water masses: why sardine do not distribute closer to the coast?
An 'horizontal' habitat-based hypothesis does not explain the full story
Gutiérrez et al. (2007)
1. Anchoveta and sardine variability
An 'horizontal' habitat-based hypothesis fits well the anchovy but does not explain the full story for sardine
Sardine is ubiquitous relative to water masses: why sardine does not distribute closer to the coast?
Does vertical (and oxygen) matter?
12
1. Oxygen does matter: Oxygen and pelagic fish variability
Decadal scaleA D
5
15
10
e01
nissa
moib/s6
t
8
0
4
6
8
4.4
4.6
4.8
4.2
4.0
3.8
LL
m(O
D1-)
Anchovy
A D
3
4
01ni
6t
0
5hctaC
e
90
85
80
75
OD
tas)
% (
Sardine
B
C
E
1965 1970 1975 1980 1985 1990 1995 2000 2005
0
1
3
2ssa
moib/sehctaC
1965 1970 1975 1980 1985 1990 1995 2000 2005
ZL/
Lm
2)
m(
30
40
50
60C
1965 1970 1975 1980 1985 1990 1995 2000 2005
Year
1965 1970 1975 1980 1985 1990 199
13
1. Oxygen does matter: Oxygen and pelagic fish variability
Cross-shore scale
14
1. Oxygen does matter: Oxygen and pelagic fish variability
Fish acoustic biomass vs. Oxygen Period: 1983-2000
At all scales: sardine avoid areas/period with low oxygen/shallow habitat
1. Oxygen does matter: Oxygen and pelagic fish variability
Oxygen, prey and foraging capabilities
Anchoveta: gets most of its energy by direct biting on macrozoopk. Filter feeding on small zoopk: very expensive (O2) relative to biting. Macrozoopk. more abundant in high upwelling-low oxygen periods.
16
Sardine: filter-feeding on small pk. energetically much cheaper. Small pk. more abundant in low upwelling-high oxygen periods.
1. Oxygen does matter: Oxygen and pelagic fish variability
17
Bertrand, Chaigneau, Peraltilla, Ledesma,
Graco, Monetti, Chavez (2011 PLoS ONE)
Oxygen, a fundamental property regulating pelagic ecosystem structure in the coastal southeastern tropical Pacific
Bertrand A., Chaigneau A., Peraltilla S., Ledesma J., Graco M., Monetti F. & Chavez F.P.


![Synthetic Layered Silicates for Paper and Polymeric ... · Na 2 O. 14SiO 2. 9H 2 O = Na 2 O. 14SiO 2. H 2 O + 8H 2 O [13.53%] Na 2 O. 14SiO 2. H 2 O = Na 2 O. 14SiO 2 + H 2 O [1.69%]](https://static.documents.pub/doc/80x56/60343a8cc258d16bd0362f48/synthetic-layered-silicates-for-paper-and-polymeric-na-2-o-14sio-2-9h-2-o.jpg)


