D E F E N C E I N T E L L I G E N C E O R G A N I S A T I O N D D E F E N C E I N T E L L I G E N C E O R G A N I S A T I O N DEFENCE ECONOMIC TRENDS IN THE ASIA-PACIFIC DIO Reference Aid 11-2 2011
Transcript
DEFENCE INTELLIGENCE ORG
ANISATION
DDEFENCE INTELLIGENCE ORG
ANISATION
DEFENCE ECONOMIC TRENDSIN THE ASIA-PACIFICDIO Reference Aid 11−2
SOUTH‐EAST ASIA – REGIONAL OVERVIEWONAL OVERVIEW....................................................................... 5 BRUNEI............................................................................................................................................................. 7 BURMA.............................................................................................................................................................9 CAMBODIA ...................................................................................................................................................... 11 EAST TIMOR ....................................................................................................................................................13 INDONESIA......................................................................................................................................................15 LAOS ................................................................................................................................................................17 MALAYSIA ...................................................................................................................................................... 19 PHILIPPINES ....................................................................................................................................................21 SINGAPORE .................................................................................................................................................... 23 THAILAND....................................................................................................................................................... 25 VIETNAM ........................................................................................................................................................ 27 SOUTH PACIFIC–REGIONAL OVERVIEW........................................................................................................28 FIJI ...................................................................................................................................................................31 NEW ZEALAND............................................................................................................................................... 33 PAPUA NEW GUINEA..................................................................................................................................... 35 TONGA............................................................................................................................................................ 37 NORTH ASIA–REGIONAL OVERVIEW ............................................................................................................38 CHINA ............................................................................................................................................................. 41 JAPAN.............................................................................................................................................................43 NORTH KOREA...............................................................................................................................................45 RUSSIA............................................................................................................................................................47 SOUTH KOREA ...............................................................................................................................................48 TAIWAN...........................................................................................................................................................51 SOUTH ASIA–REGIONAL OVERVIEW............................................................................................................. 52 INDIA .............................................................................................................................................................. 55 PAKISTAN....................................................................................................................................................... 57 OTHER COUNTRIES–OVERVIEW....................................................................................................................58 AUSTRALIA.....................................................................................................................................................58 CANADA..........................................................................................................................................................60 FRANCE........................................................................................................................................................... 61 UNTED KINGDOM ..........................................................................................................................................62 UNITED STATES..............................................................................................................................................63 APPENDIX A: METHODOLOGY ......................................................................................................................64 APPENDIX B: NOTES ON SOURCES ...............................................................................................................65
2
PR
EFACE
Intentionally Blank
3
PREFACE
Purpose
The Defence Economic Trends analyses significant trends in defence funding in the Asia‐Pacific region. It draws together official defence budgets and national economic data to enable comparisons between countries and over time.
Methodology
Underpinning much of the analysis in this publication is a defence spending deflator that is used to convert nominal official defence budgets into constant 2011 terms. Although there are some limitations to undertaking expenditure comparisons, our estimates aim to give readers the best available guide to the overall trend for spending on regional armed forces in real terms. For an explanation of the model, and notes on comparing expenditure over time and between countries, please refer to Appendix A.
GDP and defence budgets are provided both in nominal terms and in constant US dollar terms, to enable comparisons to be made over time and between countries.
Abbreviations
bn Billion
EIU Economist Intelligence Unit
GDP Gross domestic product
GEC Global Economic Crisis
IMF International Monetary Fund
IISS International Institute for Strategic Studies
m Million
tr Trillion
Online version
This publication is available on‐line at the Department of Defence’s website: www.defence.gov.au/dio/publication.shtml
Feedback
We encourage readers to comment on this publication. Please email [email protected] with your comments, so we can improve next year’s edition.
If you have any questions in relation to Defence Economic Trends 2011 please contact us directly by phone or fax at:
Defence Intelligence Organisation
Telephone: +61 2 6127 5262
Facsimile: +61 2 6127 5086 PREFACE
4
SO
UTH‐EAST ASIA – REG
IONAL OVE
RVIEW
Regional economy
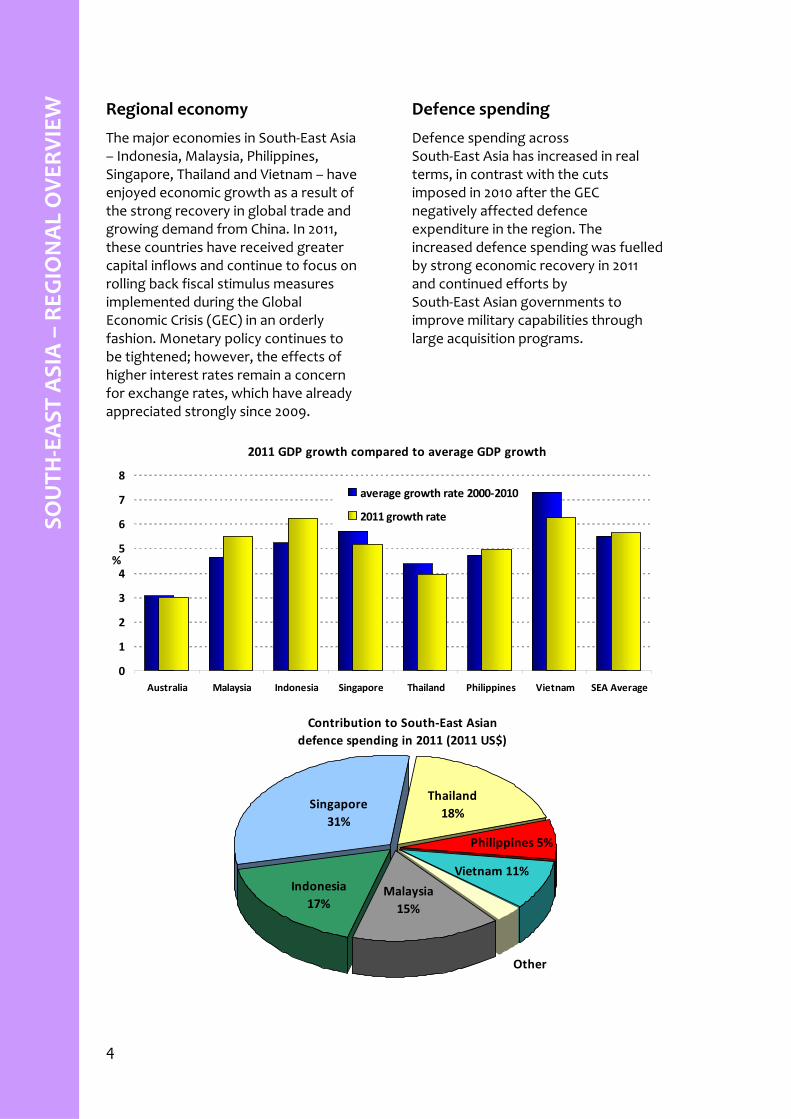
The major economies in South‐East Asia – Indonesia, Malaysia, Philippines, Singapore, Thailand and Vietnam – have enjoyed economic growth as a result of the strong recovery in global trade and growing demand from China. In 2011, these countries have received greater capital inflows and continue to focus on rolling back fiscal stimulus measures implemented during the Global Economic Crisis (GEC) in an orderly fashion. Monetary policy continues to be tightened; however, the effects of higher interest rates remain a concern for exchange rates, which have already appreciated strongly since 2009.
Defence spending
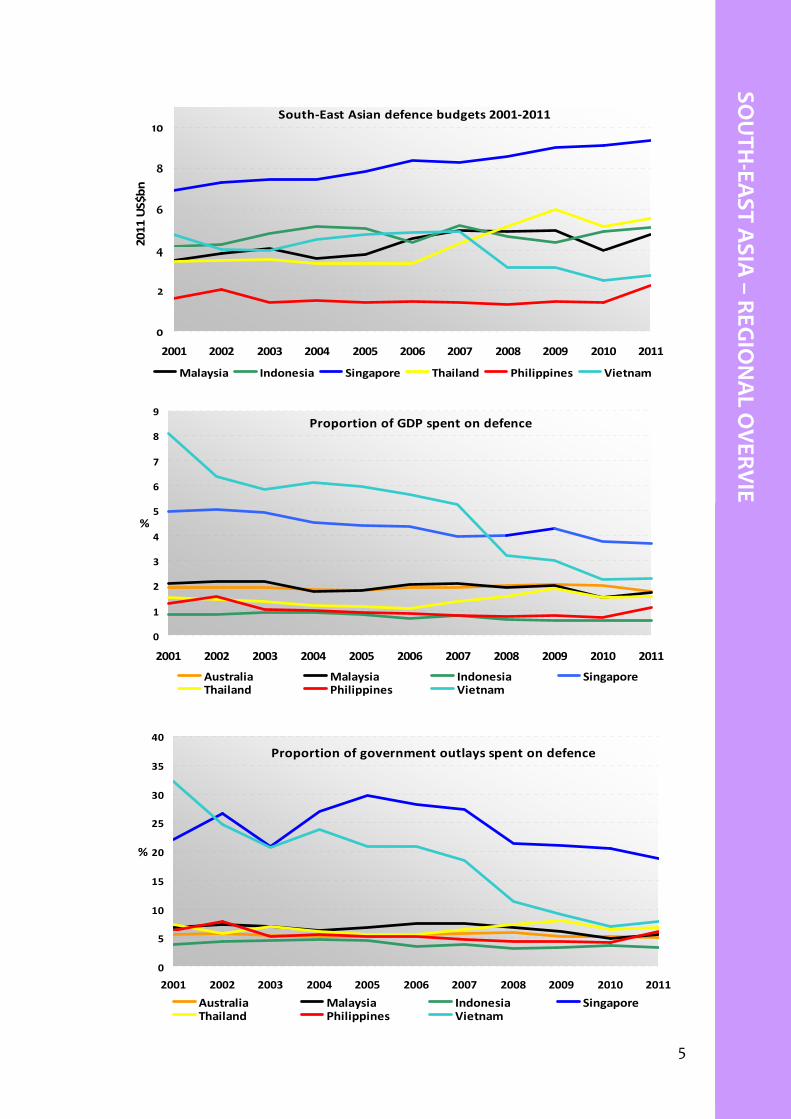
Defence spending across South‐East Asia has increased in real terms, in contrast with the cuts imposed in 2010 after the GEC negatively affected defence expenditure in the region. The increased defence spending was fuelled by strong economic recovery in 2011 and continued efforts by South‐East Asian governments to improve military capabilities through large acquisition programs.
2011 GDP growth compared to average GDP growth
0
1
2
3
4
5
6
7
8
Australia Malaysia Indonesia Singapore Thailand Philippines Vietnam SEA Average
%
average growth rate 2000‐2010
2011 growth rate
Contribution to South‐East Asian defence spending in 2011 (2011 US$)
Australia Malaysia Indonesia SingaporeThailand Philippines Vietnam
6
BRU
NEI
7
BRUNEI
BRUNEI
Economy
Brunei has averaged 1.5 per cent annual real economic growth over the last 10 years, according to the IMF. The economy grew by 3 per cent in 2011, continuing its economic recovery. Construction of a 500‐hectare technology park began in April and is key to long‐term government plans to create jobs and shift the economy away from the energy sector. The economy is projected to grow by 2.6 per cent in 2012 and to average 2.9 per cent growth annually to 2016.
Defence spending
Brunei’s 2011 defence budget is B$514m, US$400.2m in current terms, representing a 12.3 per cent real decrease on the 2010 defence budget. The Royal Brunei Navy took delivery of three new German‐built Lurssen Werft DARUSSALAM‐class vessels in 2011. The Air Force is considering replacing its fleet of Bell 212 and Bell 214ST helicopters with up to 10 medium multi‐role helicopters to support the country’s land forces.
Population 427 000 Land Size 6000 sq km Currency Brunei Dollar Fiscal Year 1 April–31 March Economy Market economy Industries Oil, natural gas and tourism
8
B
URM
A
INTENTIONALLY BLANK
9
BURM
A
BURMA
Economy
Over the last 10 years, Burma has recorded real annual economic growth of just over 10 per cent, according to the IMF. The Burmese economy’s growth increased from 5.3 per cent in 2010 to 5.5 per cent in 2011. Burma’s economic outlook is mixed. Large projects in power, petroleum and infrastructure, funded by investors from China, South Korea and Thailand, have been approved and are forecast to support annual economic growth of 5.6 per cent over the next five years. However, other sectors in the domestic economy are expected to remain sluggish, restricted by a lack of investment.
Defence spending
Reliable data on Burma’s defence spending is not available. Burma’s military acquisitions focus is on capabilities to defend against external threats and to ensure internal security. Burma has received the first of 20 RSK MiG‐29s fighter jets from Russia. The aircraft will be delivered in three configurations, comprising 10 MiG‐29B, and six MiG‐29SE single‐seat fighters and four MiG‐29UB twin‐seat operational trainers.
(Myanmar) Capital City Naypyidaw Population 62.4 million
Land Size 677 000 sq km Currency Kyat Fiscal Year 1 April–31 March Economy Less developed country Industries Timber, gems, oil, natural gas
and rice
10
C
AMBO
DIA
11
CAMBO
DIA
Economy
Cambodia has been one of South‐East Asia’s fastest growing economies, averaging nearly 8 per cent annual real growth over the last 10 years. The economy grew by about 6.5 per cent in 2011, according to the IMF. The garment sector remains exposed to the US economy – its main export market. However, garment shipments to Europe have increased. Agriculture and tourism are expected to grow and support forecast economic growth of 6.5 per cent in 2012. Annual growth is forecast to average 6.6 per cent over the next five years.
Defence spending
Cambodia’s 2011 defence budget is 1.22tr Riel, US$301m in current terms, and representing a 2.5 per cent real increase on the 2010 defence budget. Cambodia is expected to purchase Chinese‐built Zhi‐9 (Z‐9) utility helicopters. Last year, China donated more than 250 jeeps, trucks and ambulances to Cambodia’s army.
East Timor has averaged 6.5 per cent annual real economic growth since 2001. But economic growth rates have been highly variable, ranging from about 19 per cent real growth in times of rebuilding (2001) to an almost 6 per cent contraction during periods of unrest (2006). East Timor’s economy is forecast to grow at an average annual rate of 8.8 per cent from 2012 to 2016.
Defence spending
The 2011 defence budget is US$21.5m in current terms and represented an 11.7 per cent real decrease on the 2010 defence budget. Foreign forces provide training and equipment assistance to the East Timor Defence Force. East Timor’s Force 2020 development plan includes the purchase of an undefined number of corvettes and frigates and, in 2011, the Secretary of State for Defence inspected a Portuguese offshore patrol vessel.
Defence Budget
0
5
10
15
20
25
30
35
40
45
2003 2004 2005 2006 2007 2008 2009 2010 2011
US$m (2
011)
Country Name East Timor Capital City Dili Population 1.1 million Land Size 14 874 sq km
Currency US dollar Fiscal Year 1 January–31 December Economy Less developed country with a
market economy Industries Oil, coffee, fishing,
cottage industries, rice and subsistence farming
14
INDONES
IA
15
INDONESIA
INDONESIA Economy
Over the last 10 years, the Indonesian economy has maintained robust average annual real growth of 5.2 per cent. In 2011, economic growth was 6.2 per cent, according to the IMF. Private consumption is expected to remain the major driver behind economic growth as unemployment falls and real wages rise. Economic growth is forecast to be 6.5 per cent in 2012 and to average 6.8 per cent annually to 2016.
Defence spending
Indonesia’s 2011 defence budget is IDR45.2 tr, US$5.1bn in current terms, and represented a 3.7 per cent real increase on the 2010 defence budget. In 2011, the Navy took delivery of its fourth landing platform docks (LPDs), first KCR‐40 guided missile fast patrol boat and the Yakhont anti‐ship cruise missile. Indonesia is also acquiring 16 T‐50 Golden Eagle advanced jet trainers and 16 Super Tucano ground attack aircraft.
Country Name Indonesia Capital City Jakarta Population 237.4 million Land Size 1 905 000 sq km
Currency Rupiah Fiscal Year 1 January–31 December Economy Less developed country with a
market economy Industries Petroleum, natural gas,
mining, cement, chemical fertilisers, plywood, rubber, tourism, textiles and apparel
16
LAOS
17
LAOS
LAOS Economy
Laos has enjoyed a decade of high economic growth – recording an average annual growth rate of 7.1 per cent. In 2011, Laos enjoyed 7.5 per cent economic growth and 2012 is forecast to be 7.3 per cent according to the IMF. Plans are progressing for a new national irrigation network to boost agricultural production while mining revenue has increased due to high global commodity prices. Laos’ economy is forecast to grow by an average of 7.6 per cent annually over the next five years.
Defence spending
Laos’ 2011 defence budget is estimated to be around 150bn Kip, about US$17.4m in current terms, representing a 7.5 per cent real increase on the 2010 defence budget. The Lao People’s Army is equipped with Soviet‐era weapons, some of which are no longer serviceable. Laos lacks the means to independently acquire new equipment and its armed forces are limited to an internal security capability. The Lao People’s Army has a force of 29 000 troops and Lao youth are liable for 18 months of conscripted service.
hydroelectricity, tourism, apparel, rice and cement
18
MALA
YSIA
19
MALA
YSIA
MALAYSIA Economy
Over the last 10 years, Malaysia has experienced modest average annual economic growth of 4.6 per cent. The Malaysian economy continues to expand with economic growth at 5.5 per cent for 2011. Private consumption and investment are expected to remain the primary driving forces of economic growth over the next five years. Economic growth is forecast to be 5.2 per cent in 2012 and to average 5.1 per cent annually to 2016.
Defence spending
Malaysia’s 2011 defence budget was about MYR14.3bn, US$4.8bn in current terms, representing a 19.3 per cent real increase on the 2010 defence budget. The Royal Malaysian Air Force is acquiring 12 EC725 Cougar helicopters to replace its ageing Sikorsky S‐61 Nuri helicopters. Deliveries are planned for 2012–13. The Army is replacing its Sibmas 6x6 AFVs and Condor 4x4 armoured personnel carriers with 257 8x8 wheeled armoured fighting vehicles. The Navy is planning to purchase six littoral combat ships – to be built domestically.
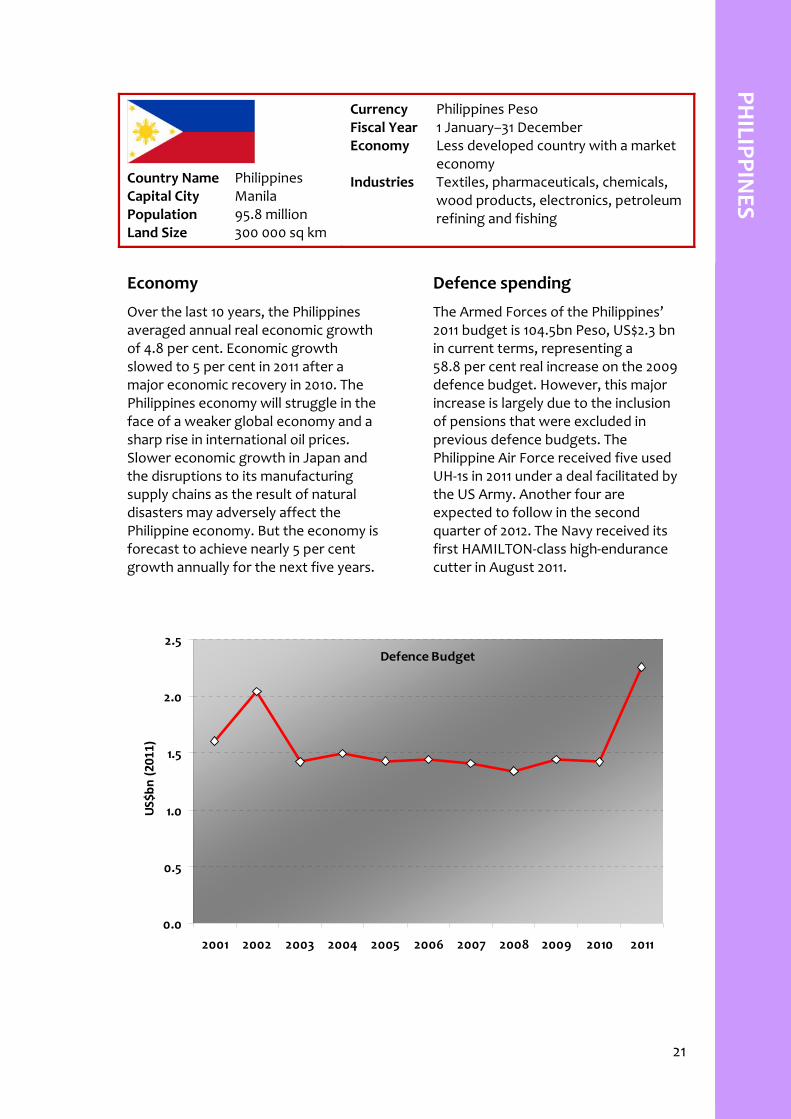
Over the last 10 years, the Philippines averaged annual real economic growth of 4.8 per cent. Economic growth slowed to 5 per cent in 2011 after a major economic recovery in 2010. The Philippines economy will struggle in the face of a weaker global economy and a sharp rise in international oil prices. Slower economic growth in Japan and the disruptions to its manufacturing supply chains as the result of natural disasters may adversely affect the Philippine economy. But the economy is forecast to achieve nearly 5 per cent growth annually for the next five years.
Defence spending
The Armed Forces of the Philippines’ 2011 budget is 104.5bn Peso, US$2.3 bn in current terms, representing a 58.8 per cent real increase on the 2009 defence budget. However, this major increase is largely due to the inclusion of pensions that were excluded in previous defence budgets. The Philippine Air Force received five used UH‐1s in 2011 under a deal facilitated by the US Army. Another four are expected to follow in the second quarter of 2012. The Navy received its first HAMILTON‐class high‐endurance cutter in August 2011.
wood products, electronics, petroleum refining and fishing
22
S
INGAPO
RE
23
SINGAPO
RE
SINGAPORE Economy
Over the last 10 years, Singapore has averaged real annual economic growth of 5.7 per cent. The export‐dependent economy experienced reduced economic growth of 5.2 per cent in 2011 after dramatically growing by 14.5 per cent in 2010. Singapore’s economy remains structurally unchanged and will remain exposed to fluctuations in global demand. Exports, investment and private consumption are expected to grow strongly over the next five years. The economy is expected to grow by 5.2 per cent in 2012 and by an average of 4.2 per cent annually out to 2016.
Defence spending
Singapore’s 2011 defence budget was S$12.1bn, US$9.4bn in current terms, representing a 3.3 per cent real increase on the 2010 defence budget. The Air Force is acquiring 12 Alenia Aermacchi M‐346 advanced jet trainers for delivery from 2012. Singapore has commissioned its first motorised infantry battalion equipped with Terrex infantry carrier vehicles (ICV). A total of 135 Terrex 8x8 ICVs are due to be delivered by the end of 2011.
petroleum refining, rubber, ship repair and biopharmaceuticals
24
T
HAILAND
25
THAILA
ND
THAILAND Economy
Over the last 10 years, Thailand’s economy has grown at an annual average rate of 4.4 per cent. In 2011, economic growth was nearly 4 per cent according to the IMF – slowing down from the 7.8 per cent growth in 2010. Thailand faces challenges to sustain economic growth in light of weaker global demand and natural disasters in Japan. Domestic political uncertainty continues to weigh on consumer and business confidence, but economic growth is unlikely to be directly affected. Economic growth is forecast to be 4.5 per cent for 2012 and to average 4.8 per cent annually to 2016.
Defence spending
Thailand’s 2011 defence budget increased to 168.5bn Baht or US$5.6bn in current terms, and represented a 8.2 per cent real increase on the 2010 defence budget. The Royal Thai Air Force received its first batch of six Swedish JAS39C/D Gripen Fighters in February 2011. A second batch of six Gripens and a second Saab 340 Erieye AEW&C aircraft are to be delivered in 2013. The Thai Navy has acquired two MH‐60S Seahawk naval helicopters to augment its fleet of six S‐70B Seahawk helicopters. The Thai Army has received its first three of an order of sixteen 480B Enstrom helicopters with the remaining 13 expected to be delivered by mid‐2012.
Over the last 10 years, Vietnam has had one of the fastest growing economies in Asia, averaging real annual economic growth of 7.3 per cent. In 2011, the Vietnamese economy expanded by 6.3 per cent, according to the IMF. Despite global economic growth slowing in 2011, demand for Vietnamese goods is expected to be sustained – ramping up production in the manufacturing sector. The economy is forecast to grow by 6.8 per cent in 2012 and to achieve an annual average growth rate of 7.3 per cent to 2016.
Defence spending
Vietnam’s 2011 defence budget is 55.1tr Dong, about US$2.7bn in current terms, representing an 8.5 per cent real increase on the 2010 defence budget. Vietnam has finalised orders with Russia to secure an additional 12 Su‐30MK2V fighter aircraft to supplement its existing order for eight aircraft. Deliveries are expected during 2011 and 2012. Vietnam has also received two GEPARD‐class frigates from Russia.
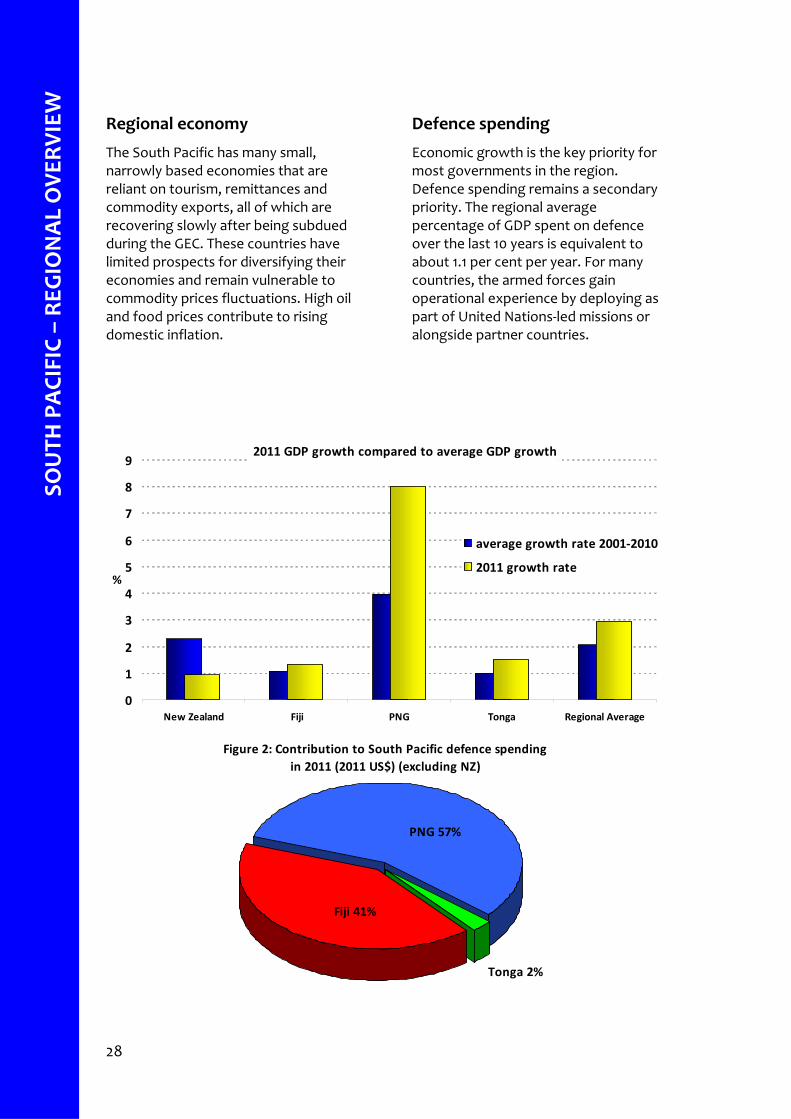
The South Pacific has many small, narrowly based economies that are reliant on tourism, remittances and commodity exports, all of which are recovering slowly after being subdued during the GEC. These countries have limited prospects for diversifying their economies and remain vulnerable to commodity prices fluctuations. High oil and food prices contribute to rising domestic inflation.
Defence spending
Economic growth is the key priority for most governments in the region. Defence spending remains a secondary priority. The regional average percentage of GDP spent on defence over the last 10 years is equivalent to about 1.1 per cent per year. For many countries, the armed forces gain operational experience by deploying as part of United Nations‐led missions or alongside partner countries.
2011 GDP growth compared to average GDP growth
0
1
2
3
4
5
6
7
8
9
New Zealand Fiji PNG Tonga Regional Average
%
average growth rate 2001‐2010
2011 growth rate
Figure 2: Contribution to South Pacific defence spending in 2011 (2011 US$) (excluding NZ)
Tonga 2%
Fiji 41%
PNG 57%
29
SOUTH PA
CIFIC – REGIO
NAL O
VERVIEW
South Pacific defence budgets 2001‐2011 (excluding NZ)
Over the last 10 years, Fiji’s economy has experienced low average annual economic growth of just over 1 per cent. Fiji’s economic growth was just 1.3 per cent in 2011, according to the IMF. Tourism earnings and agricultural output are likely to grow but Fiji’s sugar industry outlook remains poor as farmers leave the industry and production continues to fall. Economic growth is forecast to be 1.2 per cent in 2012 and average 1.6 per cent to 2016.
Defence spending
Fiji’s 2011 defence budget was FJ$100m, US$51.9m in current terms, representing a 10.8 per cent real decrease on the 2010 defence budget. Since the December 2006 military coup, some foreign military assistance to Fiji has been withheld. This has reduced the prospects for the Republic of Fiji Military Forces to acquire new equipment from traditional sources. Fiji has deployed a battalion of around 223 soldiers to Iraq in support of the United Nations Mission to Iraq since 2004. An additional 55 soldiers deployed to Iraq in July this year, bringing the total to 278.
Over the last 10 years, New Zealand has experienced average annual economic growth of 2.3 per cent. The economy’s growth slowed to just less than 1 per cent in 2011 following 1.5 per cent in 2010, according to the IMF. Strong demand for New Zealand’s exports will contribute to continued economic growth. Economic growth is forecast to be 4 per cent in 2011 and to average 3.2 per cent annually to 2015.
Defence spending
The 2011 New Zealand defence budget is NZ$2.9bn, US$2.2bn in current terms, representing a 9.4 per cent real decrease on the 2010 defence budget. New Zealand is set to acquire nine NH90 helicopters to replace its ageing Iroquois utility helicopters. The Royal New Zealand Air Force is set to purchase an additional three AugustaWestland A109 helicopters. The navy received its second and final OTAGO‐class offshore patrol vessel in May 2010, completing the Protector program.
transportation equipment, financial services, tourism and mining
34
PAPU
A NEW
GUIN
EA
35
PAPU
A NEW
GUIN
EA
PAPUA NEW GUINEA Economy
Over the last 10 years, Papua New Guinea (PNG) has recorded average annual economic growth of 3.9 per cent and in 2011 growth was 8 per cent. The main drivers of growth will be private consumption, supported by high prices for PNG’s agricultural exports and investment, largely channelled into the thriving mining and petroleum sectors. Economic growth is forecast to be 5 per cent in 2012, and to average 7.3 per cent annually to 2016.
Defence spending
PNG’s 2011 defence budget is K191.8m, US$70.3m in current terms, representing a 54.6 per cent real increase on the 2010 defence budget. The Papua New Guinea Defence Force is planning to double its regular manpower size and increase training capacity by 2015 to execute its mandated roles of border surveillance, patrols and sovereignty protection.
oil production, construction, and gold, silver and copper mining
36
T
ONGA
37
TONGA
TONGA Economy
Over the last 10 years, Tonga’s economy grew at a real annual average rate of under 1 per cent. Inflation remains high, driven by high global oil prices and the increase in prices for tobacco, alcohol and kava due to the imposition of an excise tax. Economic growth in 2011 was 1.5 per cent, according to the IMF. Tonga’s tourism sector continues to perform well with tourism receipts experiencing high growth. Economic growth is forecast to be 1.8 per cent in
Defence spending
Tonga’s 2011 defence budget was TOP6.2m, US$3.0m in current terms, representing a 12.6 per cent real decrease on the 2010 defence budget. The Tonga Defence Services operate three patrol boats –provided under Australia’s Pacific Patrol Boat Program. Tonga rotated a second contingent of 55 soldiers to Afghanistan in June 2011 after a six‐week pre‐deployment training in England.
2012, and to average 1.8 per cent annually to 2016.
Country Name Tonga Capital City Nuku’alofa Population 104 000
Land Size 748 sq km Currency Pa’anga Fiscal Year 1 July–30 June Economy Less developed country with a market
economy Industries Tourism, fish, squash, vanilla
38
NORT
H ASIA – REG
IONAL OVE
RVIEW
NORTH ASIA–REGIONAL OVERVIEW
Regional economy
Throughout 2011, economic activity in North Asia continued to grow, led by China’s fast‐paced growth. China’s growth slowed slightly in 2011 and its economy faces concerns of overheating and inflation. Russia continues to grow due to the massive fiscal stimulus by the government and high commodity prices. The March 2011 earthquake and tsunami in Japan has taken its toll on the economic output of the rest of the region, with Taiwan and South Korea most notably exposed to the disruptions to the manufacturing chain in Japan.
Defence spending
Strong economic growth over the last decade has supported growth in defence spending – enabling military modernisation and acquisition programs among most countries in the region. In 2011, defence budgets increased across the board except for in Taiwan – which is currently reforming its armed forces. Military modernisation remains a priority in the region with a number of procurement programs announced. North Korea is excluded from the regional comparison charts below due to a lack of reliable data.
2011 GDP growth compared to average GDP growth
0
2
4
6
8
10
12
China Japan South Korea Russia Taiwan NA average
%
average growth rate 2001‐2010
2011 growth rate
Contribution to North Asian defence spending in 2011 (2011 US$)
Since 2000, China has experienced annual average economic growth of 10.5 per cent. Following the imposition of fiscal tightening measures in 2010, economic growth has slowed slightly to 9.6 per cent in 2011, down from 10.3 per cent in 2010, according to the IMF. Stimulus spending is coming to an end and is expected to decelerate economic expansion further to around 9.5 per cent in 2012. The 2012–2016 average GDP growth rate is forecast to be 9.5 per cent.
Defence spending
The defence budget has averaged growth of over 10 per cent over the last 10 years, supported by strong economic growth, and currently stands at 601.1bn Yuan, US$92.9bn in current terms, and represents a 11.2 per cent real increase on the 2010 defence budget. But some commentators put China’s real defence spending at a much higher figure. The high level of defence spending is sustaining a comprehensive military modernisation program with capable platforms being produced domestically – like the Xian Y‐20 strategic transport and the Chengdu J‐20 fifth‐generation fighter aircraft.
Country Name China Capital City Beijing Population 1.3 billion Land Size 9 561 000 sq km
Currency Yuan Fiscal Year 1 January–31 December Economy Socialist market economy Industries Iron, steel, petroleum, cement,
chemical fertilisers, automobiles, electronics and telecommunications
42
JAPA
N
43
JAPA
N
JAPAN Economy
Following average annual economic growth of about 0.7 per cent over the past 10 years, Japan’s economy grew by 1.4 per cent in 2011. The economy of Japan’s north‐eastern coast will take years to recover from the earthquake and tsunami in March. Despite the short‐term negative effects of the disasters, the economy is still expected to grow by 1.5 per cent annually for 2012–2016.
Defence spending
Japan’s 2011 defence budget grew by 1.1 per cent. The defence budget currently stands at ¥4.8tr, US$58bn in current terms, and represents 1 per cent of GDP. Japan has acquired UH‐60J helicopters to replace current search and rescue helicopters in the Japanese Air Self‐Defence Force. Japan has also announced a request for proposals for its next‐generation F‐X fighter aircraft program to replace F‐4EJs. Current candidates include the Eurofighter Typhoon, Boeing F/A‐18E/F Super Hornet and the Lockheed Martin F‐35 Joint Strike Fighter.
tools, steel and non‐ferrous metals, ships, chemicals and textiles
44
NORT
H KORE
A
INTENTIONALLY BLANK
45
NORTH
KOREA
NORTH KOREA
Economy
North Korea’s economy has shown some improvement from the free fall of the 1990s, when the country experienced famine conditions. North Korea still relies on international food aid. GDP growth for 2011 is unknown –and North Korea continues to depend on Chinese aid.
Defence spending
Reliable data on North Korea’s defence spending is not available. The International Institute of Strategic Studies estimates North Korea’s defence budget to be around US$5bn. A lack of credible and consistent data makes it difficult to compile tables and graphs of North Korean defence spending. Pyongyang follows a ‘military first’ policy, which ensures national priority is given to military expenditure.
Country Name North Korea Capital City Pyongyang Population 24.0 million Land Size 121 000 sq km
Currency North Korean Won Fiscal Year 1 January–31 December Economy Less developed country with centrally
planned economy Industries Military products, machine building,
chemicals, mining, metallurgy and apparel
46
RUSS
IA
47
RUSSIA
RUSSIA Economy
Russia’s economy grew by 4.8 per cent in 2011, according to the IMF. Russia’s economy faces a major challenge in leveraging the ongoing commodity boom to sustain economic growth. The medium‐term outlook remains subdued – on average, GDP growth of 4.2 per cent annually over the next five years – until reforms can be undertaken to address weakness in the economy.
Defence spending
Russia’s 2011 defence budget grew by 2.3 per cent in real terms over 2010. The defence budget stands at 1520bn Rubles, US$52.8 bn in current terms. Russia signed a contract to purchase two MISTRAL‐class amphibious assault ships from France in June 2011 with another two ships expected to be built in Russia. The Russian air force is set to acquire 124 Su‐34 ‘Fullback’ strike fighters, with six aircraft to be delivered in 2011 and twelve in 2012. The development of the joint Russia–India Sukhoi T‐50 PAK‐FA fifth generation fighter program is continuing with aircraft expected to be delivered in 2014–2015.
Country Name Russia Capital City Moscow Population 139.9 million
Land Size 17 098 000 sq km Currency Ruble Fiscal Year 1 January–31 December Economy Industrialised country with an
emerging market economy Industries Oil and gas, coal, precious metals and
timber
48
SO
UTH KORE
A
SOUTH KOREA
49
SOUTH KO
REA Economy
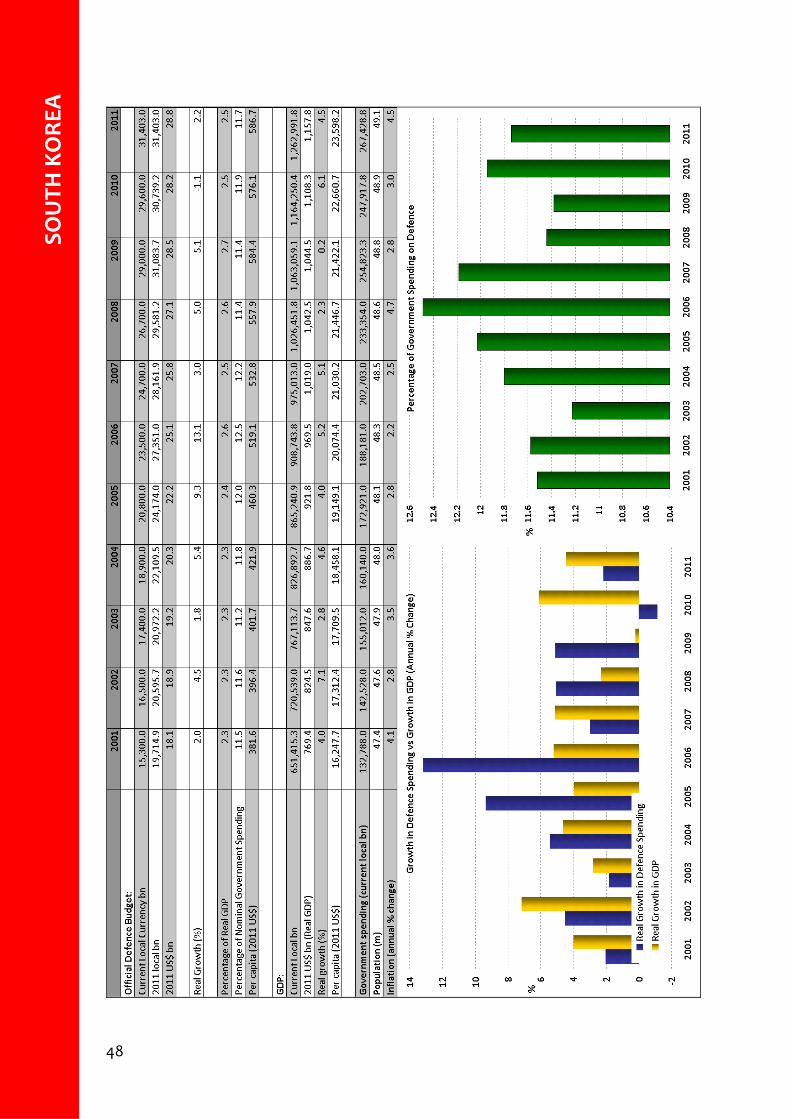
After recording an average annual economic growth rate of 4.1 per cent over the last 10 years, the South Korean economy expanded by 4.5 per cent in 2011. South Korea’s economy continues to grow, largely driven by consumption and external demand. The US and European markets remain crucial sources of demand for South Korean exports but the country’s exporters are becoming increasingly reliant on developing economies. GDP growth is expected to be 4.2 per cent in 2012, and to average 4.1 per cent annually over the next five years, according to the IMF.
Defence spending
South Korea’s 2011 defence budget grew by 2.2 per cent in real terms, following a real decrease of 1.1 per cent in 2010. The defence budget currently stands at 31.4tr Won, US$28.8bn in current terms. South Korea selected Korean Aerospace Industries to lead the technology development phase of the army’s requirement for 270 attack helicopters by 2020. The Republic of Korea Air Force has ordered 61 Boeing F‐15K aircraft in the first two phases of its F‐X next generation fighter program. In the third phase, 40–60 aircraft are expected to be procured to replace the F‐4s and F‐5s currently in service. Current possibilities include Boeing F‐15SE Silent Eagle, Lockheed Martin F‐35 Lightning II Joint Strike Fighter, Eurofighter Typhoon and Sukhoi T‐50 PAK‐FA.
Growth in Asia is expected to remain strong, supporting demand for Taiwanese exports. Despite the natural disasters in Japan that disrupted the supply chains of local manufacturing and undermined demand in one of Taiwan’s major export markets, the Taiwanese economy grew by 5.4 per cent in 2011. Taiwan’s economy is expected to grow faster than the main OECD economies – sustaining average annual growth of about 5 per cent over the next five years.
Defence spending
Taiwan’s 2011 defence budget contracted by 3.8 per cent, after a real contraction of 4.1 per cent in 2010. The defence budget currently stands at NT$294.6bn, US$10bn in current terms. Taiwan has received the first batch of six upgraded Ching‐kuo Indigenous Defence Fighters. The contract was issued to state‐run defence contractor Aerospace Industrial Development Corporation to upgrade half of the 128‐strong fleet by the end of 2012.
Name Taiwan Capital City Taipei Population 23.5 million Land Size 36 000 sq km Currency New Taiwan Dollar Fiscal Year 1 January–31 December
Economy Newly industrialised market economy
Industries Electronics, petroleum refining, chemicals, textiles, iron and steel, machinery, cement and food processing
52
SOUTH ASIA – REG
IONAL OVE
RVIEW
SOUTH ASIA–REGIONAL OVERVIEW
Regional economy
Economic prospects for the region are recovering positively from the GEC, although containing high inflation will remain a challenge. India is forecast to continue strong economic growth with its favourable demographic profile of a high percentage of economically active people, whereas Pakistan is facing a number of difficulties including meeting IMF structural reforms required for further lending. Despite high growth rates and an increase in income levels, poverty and inequality in income distribution remain persistent issues in the region.
Defence spending
Key drivers contributing to continued South Asian defence budget growth include strong economic growth, the China–India and India–Pakistan rivalries and significant internal security challenges. The regional average percentage of GDP spent on defence, although moderately declining over the last 10 years, is just under 3 per cent, and average regional defence spending has grown about 2 per cent annually in real terms over the same period.
2011 GDP growth compared to average GDP growth
0
2
4
6
8
10
India Pakistan SA Average
%average growth rate 2001‐2011
2011 growth rate
Contribution to South Asian defence spending in 2011 (2011 US$)
Over the last 10 years, India has experienced high average annual economic growth of 7.5 per cent. India’s strong growth fundamentals – high saving and investment rates, fast labour force growth and a rapidly expanding middle class – continue to ensure steady economic performance. India’s economy grew by 8.2 per cent in 2011 and is forecast to grow annually by an average of 8 per cent to 2016. Risks to future growth include infrastructure bottle necks, shortages of skilled labour and the difficulties involved in shifting resources from low‐productivity agriculture to higher‐productivity manufacturing.
Defence spending
India’s 2011 defence budget stands at 1.6tr Rupees, US$36.9bn in current terms and represents a 4 per cent real increase on the 2010 defence budget. In July 2011, India’s cabinet confirmed the purchase of ten C‐17 Globemaster strategic transport aircraft. The Indian Navy has taken delivery of the last five of the 16 MIG‐29KuB ‘Fulcrum’ fighters ordered from Russia. India continues work on its indigenous nuclear‐powered submarine project – and the army plans to acquire 145 ultra‐light Howitzers.
Country Name India Capital City New Delhi Population 1.2 billion Land Size 3 287 000 sq km
Currency Indian Rupee Fiscal Year 1 April–31 March Economy Less developed country with a
market economy Industries IT services, textiles, chemicals, steel,
transportation equipment, cement, mining, petroleum and machinery
56
PAKIST
AN
57
PAKISTA
N
PAKISTAN Economy
Over the last 10 years, Pakistan has recorded average annual growth rates of 4.7 per cent, according to the IMF. The Pakistan economy grew by a modest 2.7 per cent in 2011 despite high inflation. Pakistan is projected to enjoy faster economic expansion as a result of resumption in investment growth and sustained growth in private consumption. The economy is forecast to grow on average 5.3 per cent annually to 2016.
Defence spending
Pakistan’s 2011 defence budget is 495.2bn Rupees, US$5.8bn in current terms, and represents a 3 per cent real decrease on the 2010 defence budget. Pakistan is set to receive 50 JF‐17 Thunder fighter aircraft from China in addition to the 42 JF‐17’s to be locally produced by the end of 2011. Pakistan is developing a new 4x4 armoured personnel carrier called the Barraq. The navy received two 1600 ton multipurpose auxiliary vessels, commissioned in July 2011.
Australia Canada US UK France OTHER COUNTRIES–OVERVIEW AUSTRALIA
59
AUSTRA
LIA
60
CA
NADA
CANADA
61
FRANCE
FRANCE
62
U
NITED KIN
GDOM
UNTED KINGDOM
63
UNITED
STATES
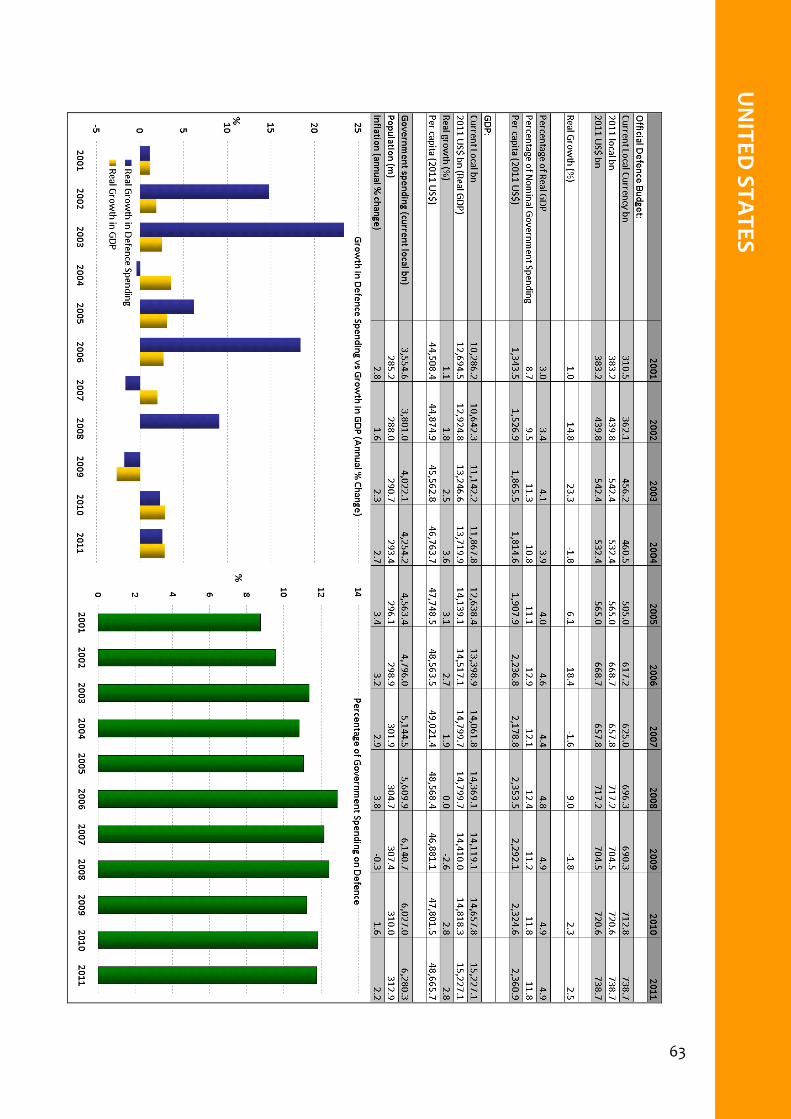
UNITED STATES
64
APP
ENDIX A – M
ETHODOLO
GY
Current methodology
Defence Economic Trends 2011 employs a different methodology from its 2010 predecessor. The new methodology uses a GDP price deflator that deflates historical currency amounts into constant 2011 terms. The figures are then converted into US dollars using the current year’s average market exchange rate.
The new methodology allows for a simpler and more effective comparison of defence spending trends by using the current year as the constant. The model is significantly simpler to understand for the reader and the results do not differ significantly from the previous model.
Although new economic forecasts were released during the development of this publication, not all data can be updated to the latest predictions. For Defence Economic Trends 2011, the information is sourced from the International Monetary Fund’s World Economic Outlook, released in April 2011.
Historical methodology
Before the 2011 Defence Economic Trends publication, a proxy defence deflator was used to calculate nominal defence budget figures into constant US dollars. The model used a proxy deflator based on three key defence expenditure factors – capital procurement, personnel and operating costs. 2005 was used as a base year for comparison. APPENDIX A: METHODOLOGY
65
APPEN
DIX B – N
OTES O
N SO
URCES
Data sources
The table below shows the sources from which the majority of data in this publication is drawn.
Data Source
Official defence budget (local currency)
Official budget sources from national governments IISS The Military Balance 2011
GDP IMF publications
Government expenditure IMF publications
General financial data (e.g. exchange rates, deflators)
IMF publications Economist Intelligence Unit
Population IMF publications
APPENDIX B: NOTES ON SOURCES
Other publishers of similar data
Other organisations that publish data similar to that provided in this publication include:
∙ IMF;
∙ International Institute for Strategic Studies; and
∙ Stockholm International Peace Research Institute (SIPRI).
The following notes briefly describe the way these different sources compile their data:
IMF
Information provided by the IMF is obtained primarily by means of a detailed questionnaire distributed by the IMF to government correspondents, who are usually located in each country’s respective Ministry of Finance or Central Bank.
66
APP
ENDIX B – NOTE
S ON SOURC
ES
IISS – The Military Balance
The IISS method is to cite official defence budgets and to adjust, where necessary, military expenditure to include all other military‐related spending. The only exception occurs in the case of NATO countries, where the IISS uses the figures released by governments and, for comparison, also cites the NATO‐defined expenditure. Some countries include internal and border security force expenditure in their defence budgets; where separate budgets exist, the IISS generally indicates this in footnotes. IISS figures may vary from previous years, often because of updates made by the governments themselves.
Wherever possible, the IISS uses exchange rates taken from IMF publications, although these may not be applicable to commercial transactions. In some cases, in an effort to make US Dollar figures more relevant for international comparisons, the IISS uses a different set of exchange rates to calculate defence spending, which reflects the differences in purchasing power parity terms between the civilian and military sectors.
SIPRI
Where possible, SIPRI includes the following items in its definition of military expenditure:
∙ all current and capital expenditure on the armed forces in the running of defence departments and other government agencies engaged in defence projects and space activities;
∙ the cost of paramilitary forces, border guards and police (when judged to be trained and equipped for military operations);
∙ military research and development, testing and evaluation costs; and
∙ costs of retirement pensions of defence personnel and civilian employees.
This work is copyright. Apart from any use as permitted under the Copyright Act 1968, no part may be reproduced by any process without prior written permission from the Commonwealth.
Requests and inquiries concerning reproduction and rights should be addressed to: