1 Department of Chemistry, College of Natural Science, Addis Ababa Science and Technology University, Ethiopia; 2 Department ofChemistry, College of Natural Science, Wollo University, Ethiopia; 3 Department of Chemistry, Adama Science and TechnologyUniversity, Ethiopia; 4 Department of Debre-Birhan, Wollo University, Ethiopia; 5 Department of Chemistry, Dire-Dawa University,Ethiopia
officinalis leaf and stem, and Thymus schimperi leaf, which are traditionally used as spices in Ethiopia were hydro-
distilled to isolate their volatile constituents in order to identify their character-impact odorants. These spices
comprise of 4%, 5.5%, 4%, 0.8%, 0.3%, 2%, 1%, 0.5%, 1.2% and 0.7% essential oil by mass. The GC-MS analysis
of these essential oils obtained from these ten species led to the identification of 64 compounds. Twenty-three
formulations were developed, of which 16 were from powdered spices to flavor bread (food) while the remaining
seven were obtained from essential oil for flavoring bread and local areki (beverage). The flavor characteristics of
these formulated samples were investigated by using GC-MSD and descriptive sensory analysis techniques. The key
aroma impact compounds in each flavor were detected and the ultimate customer sensory taste of the products was
determined for all samples. Results from the organoleptic evaluations of bread samples showed that the flavors
prepared by adding essential oils of Foeniculum vulgare, Cuminum cyminum, Aframomum corrorima, Nigella sativa, and
Trachyspermum ammi after fermentation had highest overall acceptability. Furthermore, local areki comprising of
formulas developed from oil samples obtained from Foeniculum vulgare and Coriandrum sativum had better overall
acceptability.
Keywords: Flavor; Sensory evaluation; Food and beverages
INTRODUCTION
Nature endowed us a variety of valuable resources for thesurvival of all living organisms on earth. Plants are vital tomankind, animals and other living things and also to theenvironment [1]. The association of plants with humansoriginated with the beginning of the life of humans on earth [2].In the long run, human learned to recognize and categorizeplants suited for meeting the basic necessities of life as a foodsupply. Hence humans should get sufficient and nutritionallyadequate quantity and quality of food [3]. As time passed,humans were able to gain control of their food sources as they
developed better means of food production. Furthermore, theywere also able to use herbs and spices to cover the foulness andoff-flavor of foods. This then began a new era of food additives.
Food additives are the substances which are added to food eitherdirectly and intentionally for a functional purpose or indirectlyduring some phase of production, processing, storage orpackaging without intending that it remain or serve a purpose inthe final product. It does not include either the basic foodstuffitself or contaminants. The two types of food additives areintentional and incidental. Food additives are used for thepurpose of maintaining or improving keeping quality, texture,consistency, appearance and other technological requirements
Jour
nal o
f Foo
d Processing & Technology
ISSN: 2157-7110
Journal of Food Processing andTechnology Research Article
Correspondence to: Dr. Mesfin Getachew, Department of Chemistry, College of Natural Science, Addis Ababa Science and Technology University,Ethiopia, E-mail: [email protected]
Received: May 22, 2019; Accepted: June 24, 2019; Published: July 1, 2019
Citation: Getachew M, Awoke S, Melaku Y, Gashu M, Gizachew Z (2019) Formulation of Substantial Natural Flavors from Plant Materials for Foodand Beverage Industries. J Food Process Technol 10:805. doi:10.35248/2157-7110.19.10.805
[4]. A flavor is a sensory result of a substance and is determinedfrom taste and smell. The source of flavor ingredients can beeither natural or artificial. According to the FDA, “the termnatural flavor means the essential oil, oleoresin, essence orextractive, protein hydrolysate, distillate or any product ofroasting, heating or enzymolysis, which contains the flavoringconstituents derived from a spice, fruit or fruit juice, vegetableor vegetable juice, edible yeast, herb, bark, bud, root, leaf orsimilar plant material, meat, seafood, poultry, eggs, dairyproducts or fermentation products thereof whose significantfunction in food is flavoring rather than nutritional. Hence itincludes the natural essence or extractives obtained from plants.Most of the natural flavors have an additional advantage ofpossessing medicinal applications. They are also biodegradable,environmentally friendly and have no adverse effects onconsumers. In contrast, artificial flavorings are derived fromorganic compounds such as esters, aldehydes, alcohols, andacids. Artificial flavors are made of many compounds thatcomplement each other to form the targeted flavor [4-6].
Ethiopia is fortunate in having a wide range of various plantsgrown in different agro-climatic zones. This enables the country
to cultivate various spices which are principally used forflavoring food and beverages. Additionally, their contributionsas medicinal and preservatives are also significant. Despitehaving many indigenous spices in Ethiopia, the country isunable to fulfill its domestic demand of flavoring agents. Thissituation forces our country to import flavoring agents fromother countries of the world. The imports of artificial flavoringagents can definitely impose a severe drain on the nationaleconomy which is one of the serious concerns of the country.Furthermore, imported flavors are synthetic with adverse healtheffects such as hyper-kinesis, disabilities, carcinogenicity,genotoxicity, and neurotoxicity. Therefore, more effort has to bemade by different bodies to increase the production of flavoringagents for food and beverages in quantity and quality so that thedrainage of foreign exchange reserves is reduced. Ethiopia is richin aromatic plants useful as spices. Literature survey made onsome spices which are traditionally used in Ethiopia along withtheir essential oil constituents and applications is presentedbelow [7]. The seeds of plants mentioned in Table 1 are used asa flavor for meat dishes, bread, soups, coffee, alcoholicbeverages, syrups, liqueurs, candy, chocolate, and baked foods.
Formulations of flavor from aroma chemicals are used globallyfor imparting attractive taste and aroma to processed foods andbeverages. The worldwide flavor generally earns returns in excessof the chemical industry average. The industry ’ s closeassociation with the health, food and beverage markets meansthat its revenues are relatively stable, largely insensitive tocommodity cycles and relatively recession-resistant [8]. One ofthe responsibilities of professionals is to alleviate the societaland governmental challenges by doing research to secure food
and beverage products from industries. This may contribute tothe decrement of foreign currency and substituting syntheticflavors by the natural ones. It is known that the contribution ofnatural aroma to the flavor quality of food product has gainedincreasing attention. Though our people are traditionally usingmany indigenous spices to flavor their foods, the research workis done to exploit the potential of these spices as a flavoringagent is limited. Furthermore, sufficient information is alsolacking in an attempt made to isolate and characterize flavoring
Getachew M, et al.
J Food Process Technol, Vol.10 Iss.9 No:1000805 2
Table 1: Major constituents of oil by hydro-distillation.
Sources of Oil (Am Amharic) % Oil
agents from Ethiopian spices. Therefore, the present study isworth to assess natural flavors from aromatic plants and developan extraction/isolation mechanism to scale up the productswhich have a substantial role in replacing the imported syntheticflavors for beverage and food industries [8-11].
Flavor analysis during product development is typicallyperformed by human organoleptic analysis by a panel of experts,the so-called Sensory analysis of flavors. The use of humanpanelists for odors is usually accurate, but costly and time-consuming. Furthermore, human sensory panel assessments,which can be adversely affected by external parameters such asillness or fatigue, are usually subjective. The human sensorypanel is also limited to odors that are not toxic or obnoxious [5].The meaningful correlation of sensory data (biological activity)with analytical data is one of the most challenging tasks in flavorresearch. Attachment of instrumental measurements withsensory analysis techniques used to try and determine the exactvolatile(s) responsible for some flavor sensations. It is possible todetermine direct relationships between a sample odor and achemical. Common ways to do this are through eithercomparative sensory analysis of the sample and the volatilecompounds, using sensory analysis to detect aroma attributesand a GC-MS to detect the volatiles and find statisticalassociations [12,13].
Most food and beverage flavors are extremely complex and arisefrom the combination of a number of chemical components[10-15]. Since Ethiopia is becoming industrialized in food andbeverage industries formulating flavor was taking as a primaryobjective of this study.
MATERIALS AND METHODS
Plant materials, chemicals, and apparatus
At the beginning of this study, the researchers made a survey infive different directions of Ethiopia including Nekemte, Jimma,Arbaminch, Debre Birhan-Dessie, and Bahir Dar. Field visitingand collecting primary data related to the indigenous knowledgethrough one-on-one interviews with the community were made
on plants traditionally used as spices. The research teammembers brought 40 plant materials which are traditionallyused by the Ethiopian community either as spices or medicines.After a thorough discussion, the team agreed to analyze only 20samples. These 20 plant materials were subsequently subjectedto preliminary tests which led us to the selection of tenchemically promising and nontoxic plant materials including
Organic solvents such as hexane, ethyl acetate, chloroform, andmethanol, and apparatus including Clevenger, TLC, NMR, andGC-MS were used for extraction, isolation and characterizationof flavor components.
Essential oil extraction and formulation
Each 100 g of each material was subjected to hydro-distillation inClevenger apparatus for 3 hour and the essential oils were dried
bottle and kept at 4℃ until analysis. 20 g of ground sampleswere extracted using ethanol to afford crude extracts andanalyzed using Thin Layer Chromatography (TLC). Differentpurposely selected proportions of the ground materials andessential oils of the first six plant materials were mixed to form aformula (Ffb1-23) in the presence of food-grade ethanol. Thefirst sixteen were made from ground plant materials (1 g each)whereas the next seven were composed of essential oils (100 μLeach) of the respective plant's materials collected (1-6). But, theamounts of the major components may differ for food and
Table 2: Formulation.
Powdered plant materials Essential oil
Beforefermentation
Composition On fermented dough Compositiondough
Composition
Ffb1 1-6 Ffb9 1-6 Ffb17 1-4,6
Ffb2 1-4,6 Ffb10 1-4,6 Ffb18 1,6
Ffb3 2.3 Ffb11 2.3 Ffb19 2,5
Ffb4 2,5 Ffb12 2,5 Ffb20 3,4
Ffb5 2,6 Ffb13 2,6 Ffb21 4,5
Ffb6 3,4 Ffb14 3,4 Ffb22 1,5
Getachew M, et al.
J Food Process Technol, Vol.10 Iss.9 No:1000805 3
..........
. . . . . . . . . .
over anhydrous Na2SO4 , yield calculated, stored in a dark glass
On fermented
(Table 2)beverage [10].Table 2
:
Ffb7 3,6 Ffb15 3,6 Ffb23 3,6
Ffb8 4,6 Ffb16 4,6
Gas chromatography-mass spectrometry
The separation was performed on GC-MSD system (Agilenttechnologies 7820A) coupled to a mass detector (5977E MSD)and a column (30 m × 0.25 mm × 0.25 μm film thickness).Analytes were injected at a temperature of 250℃. Heliumpurified at 99.99% was selected as a carrier gas at a flow rate of1 mL/min. The temperature program was performed at 60℃for 3 min, then increased at a rate of 5℃/min and maintainedat 250℃ . The mass selective detector was applied in an electronimpact ionization mode at 70 ev. The identification of theconstituents was based on a comparison of their retentionindices relative to those of literature. Further identification wasmade by matching their recorded mass spectra with those storedin the mass spectral library of the GC-MSD data system.
Baking of bread and serving local areki
Powdered wheat (24 Kg) was bought from a shop (AA) and 8pieces of bread (1 Kg each) were made by adding flavors (Ffb1-8,1 g) before fermentation and the other 8 pieces of bread (1 Kg)were made by adding a similar amount of flavor (Ffb 9-16)before baking. The remaining seven flavors (Ffb17-23, 1 mL)each were added to the fermented dough before baking.Additional 8 bread samples were made without flavoringmaterial as control. All sample bread were baked in one day withthe same condition and by the same locally known professionalwomen. Each slice of bread type was coded and served for eightgroups of assessors at three different times. The formulas madefrom oil extracts (Ffb 17-23, 100 μL) were diluted in 400 μL ofalcohol. Five liters of areki were bought from the local market(AA) and seven of the diluted flavors (100 μL) each were addedto half liters of areki. The remaining 1.5 liters were unflavoredas control. In the meanwhile, they were coded and served forseven groups of assessors differently.
Sensory and statistical analysis
It was not possible to get professional sensory panelists inEthiopia on analysis of flavors of food and beverage. Selectedand trained consumers arranged in 7/8 groups (a group of 3assessors) performed sensory analysis at rooms arranged for eachactivity in triplicate. Formulated flavor samples were added todough and areki for organoleptic assessment. Slices of bread andareki in vials were presented to the assessors for comparativearoma evaluation of flavored and the unflavored samples in arandomized order without sample information. Evaluators atthree independent sessions scored the overall flavor acceptabilityand describe the samples on a scale from 0 (not acceptable) to 4(most acceptable). Mean of the attributes given by the assessorswere taken. One-way ANOVA was used for comparisons amongflavors (Ffb1-23) in the perception of each odor attribute and forquantitative results for each odorant and taste, with significancelevel at 0.05.
RESULTS AND DISCUSSION
The GC-MS analysis of essential oils
Foods and beverages are flavored for stimulating the sense oftaste, mouthfeel, and odors. Essences, composed of flavorcompounds, are usually used in chewing gum, gelatin desserts,ice creams, baked foods, drugs and pharmaceuticals, and softdrinks. Flavor analysis and identification of flavors are difficulttasks. Targeted flavor compounds are often present in parts permillion levels, making them very difficult to extract or detect.Essential oils and extracts of aromatic plants have beenrecognized for many years as a great source of food additives.They have been employed for a long time in different industries,mainly in food (as flavorings and preservatives), perfumes(fragrances and aftershaves), pharmaceuticals (therapeuticaction) and for centuries in traditional medicine. The aromaimparted by spices should somewhat reflect the essential oilcomposition of the samples. There are several techniquesavailable to assess the essential oil constituents of spices. Manyreports showed that gas chromatography (GC) is a very usefulmethod for analyzing volatile components of foods. Whencombined with mass spectroscopy (MS), it is excellent for theidentification of separated compounds. Combining these twotechniques proves to be very useful for chemical analysis. It alsoallows a mixture to be analyzed qualitatively and quantitatively.Currently, the simplification of the instrument and the amountof time to analyze a sample is also improved. Present GC-MSshave a library reference already on the computer to compare andidentify compounds in one’s sample. Today GC-MS is used inpharmacological, medical, environmental, forensics, and lawenforcement fields.
The analyses of the essential oil obtained in this work weremade using Gas Chromatography-Mass Spectrometry (GC-MSD). In the course, ten essential oil samples were selected andanalyzed using GC-MSD. Peak identification of the essential oilswas made using the retention times observed from thechromatogram with those in the Mass Hunter/Library/NIST14.L. Further confirmation was made from theircorresponding mass fragmentation pattern observed from theirmass spectrum. In some cases, the chromatograms werecompared with the literature reported for the same species. Theessential constituents of the analyzed spices obtained throughhydro-distillation using
Clevenger apparatus comprises of Cuminum cyminum seed (4%),Foeniculum vulgare seed (5.5%,), Trachyspermum ammi seed (4%),Nigella sativa seed (0.8%), Coriandrum sativum seed (0.3%),Aframomum corrorima fruit (2%), Zingiber officinale rhizome (1%),Cinnamomum aromaticum bark (0.5%), Rosemary officinalis leafand stem (1.2%), and Thymus schimperi leaf (0.7%) oil by mass. Atotal of 64 compounds were obtained using GC-MS. The oil isprimarily made up of a class of compounds referred to as
Getachew M, et al.
J Food Process Technol, Vol.10 Iss.9 No:1000805 4
terpenes. Terpenes are classified by how many carbon atomsthey possess, in units of five. The major compounds identifiedare monoterpenes and sesquiterpenes. Monoterpenes are theprototypal molecule comprising of two C5 isoprene subunits.Sesquiterpenes are created by the addition of another isoprenesubunit to a terpene, creating a C15 molecule. The chemicalconstituents of essential oil obtained from ten different specieswere briefly described as follows:
Seeds of Cuminum cymium (E1): The seeds of Cuminumcymium were hydrodistilled using a Clevenger apparatus to afford
4% yellowish oil. The chemical composition found in theessential oil analyzed using GC-MS were found to containmainly monoterpens. Among these, 83% of which areoxygenated while 9% constitute hydrocarbons. The mostabundant component observed was cuminaldehyde. Table 3shows a list of compounds considered important to the classicprofile of Cuminum cymium.
Table 3: Essential oil constituents of the oil of the seeds of Cuminum cymium (E1).
No. tR Constituents of the
essential oil
Chemical structure Area percent Remark
1 9.565 ρ-cymene 5.23
2 10.200 ϒ-terpenene 3.62
3 18.728 Cuminaldehyde 59.88
4 20.571 Safranal 8.06
5 20.886 Cuminic alcohol 14.8
oil were subsequently analyzed with GC-MS which furnished sevencompounds all of which were turned out to be oxygenated
Getachew M, et al.
J Food Process Technol, Vol.10 Iss.9 No:1000805 5
F. vulgare.
Foeniculum vulgare seeds, E17:
Foeniculum vulgare gave 5.5% yellowish oil. The constituents of the
Foeniculum vulgare
On hydro-distillation, with Clevenger apparatus, the ground seeds of
seeds
The major compound observed from the GC-MS
monoter-
-penes. spectrum was estragole which constitutes about 37% of the oil. This was followed by fenchone. Table 4 shows a list of compounds detected from the ground seeds of
1 9.805 Eucalyptol 2.60
2 12.150 Fenchone 9.89
3 14.454 Camphor 0.77
4 20.879 Estragole 37.02
5 20.99 Thymol 1.78
6 23.827 Eugenol 6.77
7 26.354 Caryophyllene 1.27
Trachyspermum ammi seeds, E3: The yellowish oil (4%)obtained on hydro-distillation with Clevenger apparatus of theground seeds of Trachyspermum ammi were analyzed using GC-MS which afford one oxygenated and three non-oxygenatedmonoterpenes. Among these, 70% were found to be oxygenatedmonoterpenes while the remaining are hydrocarbons. Thymol,
which is an antioxidant compound reported in the literature,constitutes about 70% of the essential oil. The presence of thiscompound to such a high level adds one positive attribute ofthis spice as an additive. Table 5 depicts a list of compoundsfrom the ground seeds of Trachyspermum ammi.
Getachew M, et al.
J Food Process Technol, Vol.10 Iss.9 No:1000805 6
Table 4: Essential oil constituents of the oil of the seeds of Foeniculum vulgare (E17).
No tR Constituents of the essential oil Chemical Structure Area percent Remark
2 9.572 β-cymine 10.22
3 10.928 ϒ-terpenene 16.39
4 21.189 Thymol 70.33
Nigella sativa, E7: plants containing both fixed and essential oil. Hydro-distillation of theseeds afford 0.8% yellowish oil, which was subsequently subjected toGC-MS. Results showed that the oil comprises of five
The major compound was found to be thymoquinone
Table 6:
No. tR Constituents of the essential oil Chemical Structure Area percent Remark
1 7.858 β-pinene 2.93
2 9.812 Eucalyptol 3.86
3 15.915 Terpinen-4-ol 10.88
4 19.132 Thymoquinone 14.70
Zubair AB, et al.
J Food Process Technol, Vol.10 Iss.9 No:1000805 7
Table 5: List of compounds obtained from the seeds of Trachyspermum mami.
No. tR Constituents of the essential oil Chemical Structure Area percent Remark
1 7.860 β-pinene 3.03
monoter-penes.
compound
.
This was reported to have immense biological activities including
The presence of thisetc. antioxidant, anti-inflammatory, anticancer
and compound in a remarkable amount in the seeds of this plant adds onepositive aspect of the seeds of N. sativa. Table 6 indicates a list of compounds from the
seeds of Coriandrum sativum corresponding area percent were depicted in Table 7.
Table 7:
No. tR Constituents of the essential oil Chemical structure Area percent Remark
1 6.500 σ-pinene 1.99
2 9.568 D-limonene 8.97
3 10.905 ϒ-terpenene 6.01
4 12.745 d-linalool 67.17
5 14.471 Camphor 7.97
6 16.844 Estragole 2.23
Getachew M, et al.
J Food Process Technol, Vol.10 Iss.9 No:1000805 8
were the major compounds identified from the essential oil (0.3%) of the . The predominant compound
was foundoil. The
and their
to be d-linalool which constitute to about 67% of the essential
essential
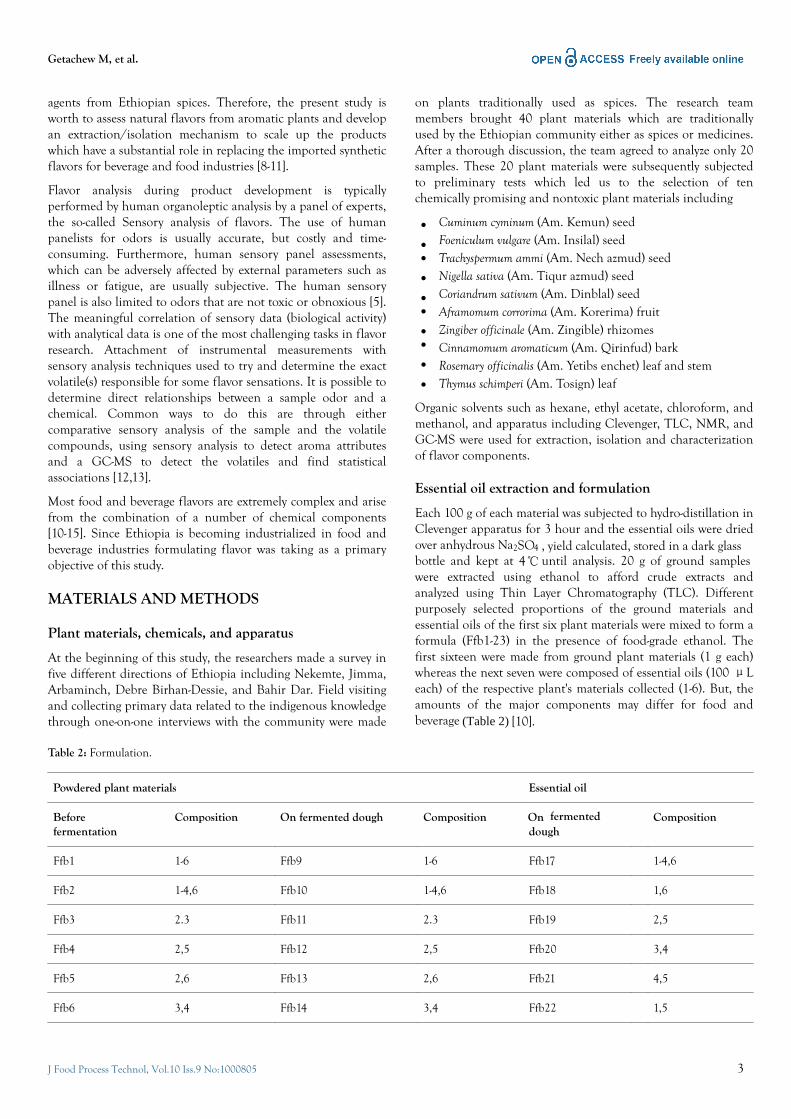
, d-linalool, camphor, whole result showing a list of compounds, structures,
List of compounds identified from the seeds of Coriandrum sativum.
7 20.977 Thymol 3.54
8 28.971 Geranyl acetate 2.11
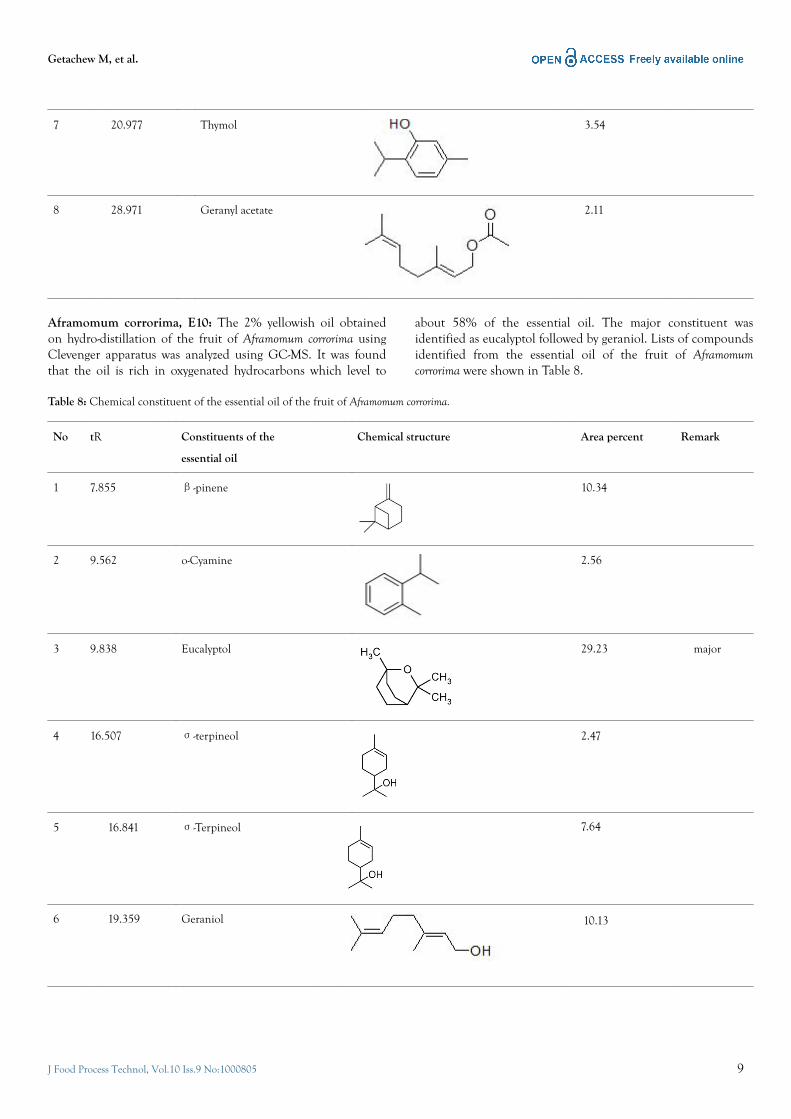
Aframomum corrorima, E10: The 2% yellowish oil obtainedon hydro-distillation of the fruit of Aframomum corrorima usingClevenger apparatus was analyzed using GC-MS. It was foundthat the oil is rich in oxygenated hydrocarbons which level to
about 58% of the essential oil. The major constituent wasidentified as eucalyptol followed by geraniol. Lists of compoundsidentified from the essential oil of the fruit of Aframomumcorrorima were shown in Table 8.
Table 8: Chemical constituent of the essential oil of the fruit of Aframomum corrorima.
No tR Constituents of the
essential oil
Chemical structure Area percent Remark
1 7.855 β-pinene 10.34
2 9.562 o-Cyamine 2.56
3 9.838 Eucalyptol 29.23 major
4 16.507 σ-terpineol 2.47
5 16.841 σ-Terpineol 7.64
6 19.359 Geraniol 10.13
Getachew M, et al.
J Food Process Technol, Vol.10 Iss.9 No:1000805 9
7 26.354 caryophyllene 4.06
8 32.189 Nerolidol 8.13
Zingiber officinale, E5: On hydro-distillation using Clevengerapparatus, the rhizomes of Zingiber officinale afford 1% yellowishoil. The GC-MS analysis of the essential oil of Zingiber officinaleroots showed the presence of twelve compounds all of which aremonoterpenes. The major compound was identified 16 as σ-bisabolene which constitutes 10% of the essential oil. Theconstituent of the essential oil of rhizomes of Zingiber officinalewas depicted in Table 9.
Table 9: Chemical constituent of the essential oil of the rhizomes ofZingiber officinale.
No tR Constituents
essential oil
Chemical structure Areapercent
Remark
1 6.954 Camphene 0.38
2 9.559 o-Cymene 0.65
3 9.806 Eucalyptol 0.53
4 10.99 ϒ-terpenene 0.78
5 12.582
Linalool 0.49
6 15.401
Boreneol 1.46
7 16.872
Estragole 2.46
8 23.762
Eugenol 0.43
9 28.892
GermacreneD
0.72
10 29.578
Copaene 6.90
11 30.107
β-bisabolene 5.89
12 30.746
σ-bisabolene 9.81
Cinnamomum aromaticum, E6: The yield of the essential oilfrom the bark of Cinnamomum aromaticum was 0.5%. This wassubsequently analyzed with GC-MS. The results of the GC-MSanalysis revealed the presence of oxygenated monoterpenes. Theessential oil also comprises of a small percentage ofsesquiterpenes. 2 Propenal, 3-phenyl-4-pyridine carboxyaldehyde, oxime pyridine-4-carboxamide was found to be themajor abundant compound from the oil of Cinnamomum
Getachew M, et al.
J Food Process Technol, Vol.10 Iss.9 No:1000805 10
of the
aromatic. The chemical compositions of the essential oil of thebark of Cinnamomum aromaticum were shown in Table 10.
Table 10: Chemical composition of the essential oil of the bark of Cinnamomum aromaticum.
No tR Constituents of the essential oil Chemical structure Area % Remark
Thymus schimperi, E14: The leaves of Thymus schimperi istraditionally used in Ethiopia as a flavoring agent. Onhydrodistillation, it gave 0.7% volatile oil. The chemical
constituents were determined using GC-MS which showed thepresence of oxygenated monoterpenes. It comprises of themonoterpene thymol (64%) in remarkable amounts which are
Getachew M, et al.
J Food Process Technol, Vol.10 Iss.9 No:1000805 11
in agreement with previous literature report [14]. Table 11 showsthe constituents of the essence of the leaves of T. schimperi.
Table 11: Chemical composition of the essential oil of T. schimperi.
No tR Constituents of theessential oil
Chemical structure Area percent Remark
8.321 β-pinene 0.81
2. 9.583 o-Cyamine 8.10
3. 12.613 Linalool 5.81
4. 15.911 Terpinen-4-ol 1.17
5. 21.718 Thymol 64.23 major
Analysis of the formulated samples
It is observed that all the ten essential oils obtained from the tenspices were analyzed and found to have various compoundswhich are essential as flavoring agents. The major componentsof the oils have their own impact in flavoring the food/beveragematerial. The GC-MSD data of the formulated samples revealedthe presence of marker compounds present in the individualcomponents in the formula. This likely shows that the majorcompounds present in the plant material are responsible for thenatural aroma of the plant and also contributes to conveyingflavor for foods and beverages [15,16].
Characterization of formulas using sensory test
Flavor analysis during product development is typicallyperformed by human organoleptic analysis by a group of thepanel. The use of human panelists for odors though time-consuming is usually accurate. Based on practical preferencesand time, six of the plant materials were selected for developing23 formulas. The first 16 were developed using powdered plant
materials so as to flavor bread (food) and the last 7 weredeveloped using essential oils for flavoring both bread and localareki (beverage). Of 16 formulas, 8 (1-8) of them were added tothe flour before fermentation and the remaining 8 (9-16) weremixed to the fermented dough before baking. Seven (17-23) ofthe formulas were oils added to the fermented dough beforebaking. Similarly, seven (17-23) formulas were used to flavorlocal areki. The assessment was done by studying thecharacteristics like appearance/color, flavor, texture/mouthfeel,palatability and overall acceptability of formulas in theapplication. The overall result of sensory analysis of flavors inbread and areki were compiled in Tables 12 and 13.
Table 12: Average (Mean ± RSD) sensory scores of bread samples.
Sample code Color Flavor Palatability
Consistency
Acceptability
Ffb1 1 ±0.6
1 ±0.2
0 0 0
Getachew M, et al.
J Food Process Technol, Vol.10 Iss.9 No:1000805 12
Ffb2 1 ±0.3
1.5 ±0.3
0 0 1 ± 0.2
Ffb3 1 ±0.2
3 ±0.9
2 ± 0.5 0 2 ± 0.1
Ffb4 1 ±0.4
3 ±0.8
2 ± 0.4 0 2 ± 0.6
Ffb5 1 ±0.8
2 ±0.9
2 ± 0.2 0 0
Ffb6 1 ±0.6
3.3 ±0.5
2 ± 0.1 1 ± 0.4 2 ± 0.7
Ffb7 1 ±0.2 3 ±0.3
2 ± 0.3 0 0
Ffb8 1 ±0.1
2.7 ±0.4
0 0 0
Ffb9 1 ±0.8
3 ±0.1
2 ± 0.2 3 ± 0.6 2.5 ± 0.5
Ffb10 1 ±0.3
1.7 ±0.1
0 0 1 ± 0.4
Ffb11 1 ±0.2
2 ±0.3
0 0 1 ± 0.5
Ffb12 1 ±0.4
3.5 ±0.1
3 ± 0.1 3.5 ± 0.6 3.5 ± 0.2
Ffb13 1 ±0.3
2.7 ±0.9
0 0 0
Ffb14 1 ±0.1
3.2 ±0.3
2 ± 0.6 3 ± 0.5 2 ± 0.4
Ffb15 1 ±0.4
3.5 ±0.2
3 ± 0.7 3.5 ± 0.5 3.5 ± 0.2
Ffb16 1 ±0.2
1.3 ±0.6
0 0 0
Ffb17 3 ±0.1
4 ±0.8
4 ± 0.3 3.5 ± 0.4 4 ± 0.5
Ffb18 3.5 ±0.7
3.5 ±0.8
3 ± 0.4 3.5 ± 0.3 3.5 ± 0.5
Ffb19 3.5 ±0.3
2.7 ±0.9
1 ± 0.4 1 ± 0.1 1 ± 0.1
Ffb20 3.5 ±0.2
3.3 ±0.5
2 ± 0.1 3 ± 0.1 2.5 ± 0.8
Ffb21 3.5 ±0.6
2.7 ±0.3
0 0 1 ± 0.7
Ffb22 3.5 ±0.7
3 ±0.4
2 ± 0.3 3 ± 0.4 3 ± 0.7
Ffb23 3.5 ±0.2
3 ±0.1
2 ± 0.1 3 ± 0.3 2 ± 0.6
Table 13: Average (Mean ± RSD) sensory scores of areki samples.
Sample code Color Flavor Palatability
Consistency
Acceptability
Ffb17 3.0 ±0.3
2.0 ±0.7
2.0 ± 0.9 2.0 ± 0.1 1.0 ± 0.2
Ffb18 3.0 ±0.5
2.0 ±0.6
2.0 ± 0.7 1.0 ± 0.2 2.0 ± 0.1
Ffb19 3.0 ±0.2
3.0 ±0.4
3.5 ± 0.2 3.0 ± 0.7 4.0 ± 0.4
Ffb20 3.0 ±0.6
2.0 ±1
1.0 ± 0.3 2.0 ± 0.2 2.0 ± 0.1
Ffb21 3.0 ±0.5
3.0 ±0.2
3.0 ± 0.1 2.0 ± 0.4 2.0 ± 0.7
Ffb22 3.0 ±0.1
3.0 ±0.3
3.0 ± 0.5 3.0 ± 0.3 3.0 ± 0.6
Ffb23 3.0 ±0.1
2.0 ±0.1
1.0 ± 0.8 2.0 ± 0.8 1.0 ± 0.6
Flavor/aroma is the main criterion that makes the product to beacceptable or unacceptable. In this study, there was a significantdifference in terms of flavor of the samples analyzed. SampleFfb17 had the highest mean score of 4 while the least value wasrecorded in samples Ffb 1,2,10,16 with the value of less than 2.This indicated that Ffb17 was acceptable as a flavoring agent forbread. And Ffb19 was better accepted to flavor local areki.
Food flavor arises from the interaction of taste and aroma,which imparts a pleasing and displeasing sensory experience to aconsumer. It is the flavor of food that ultimately determines itsacceptance or rejection, even though its appearance induces theinitial response.
Chemical analysis of flavor compounds provides little insightinto the actual flavor quality. Hence due attention was given tothe sensory evaluation of the prepared flavoring agents. Theorganoleptic evaluations of bread samples showed that theflavors prepared by mixing essential oils isolated from Foeniculumvulgare, Cuminum cyminum, Aframomum corrorima, Nigella sativaand Trachyspermum ammi (specially Ffb17) added afterfermentation had highest overall acceptability whereas a formuladeveloped from oil samples extracted from ensilal and dinbilal(Ffb19) had better overall acceptability while using it in localareki.
CONCLUSION
Based on the sensory analysis of bread which was baked in thepresence of Foeniculum vulgare, Cuminum cyminum, Aframomumcorrorima, Nigella sativa and Trachyspermum ammi was preferable.And areki supplemented with oils from Foeniculum vulgare and
Getachew M, et al.
J Food Process Technol, Vol.10 Iss.9 No:1000805 13
Coriandrum sativum was preferred by consumers. The traditionalsensory evaluation method has limited power to correlate withanalytical rating results. Therefore, additional analysis(physicochemical analysis and an organoleptic test involvingprofessional sensory assessors) of the formulas are necessaryafter that the preferred formulas can be marketed.
ACKNOWLEDGMENT
Ethiopian Science and Technology Minster should beacknowledged for financing this study
REFERENCES
Mahmood KT, Mugal T, Haq IU. Moringa oleifera: A naturalgift. J Pharm Sci Res. 2010;2(11):775-781
Mamedov N. Medicinal plants studies: History, challenges andprospective. Med Aromat Plants. 2012;1:8.
Yakubu N, Amuzat AO, Hamza RU. Effect of processingmethods on the nutritional contents of bitter leaf (Vernoniaamygdalina). Am J Food Nutr. 2012;2(1):26-30.
Deibler KD, Jeannine Delwiche. Handbook of flavorcharacterization: Sensory analysis, chemistry and physiology.Food Sci Technol. 2003:520.
Wijk RA, Zijlstra SM. Differential effects of exposure to ambientvanilla and citrus aromas on mood, arousal and food choice.Flavor. 2012;1:24.
Prescott J. Flavors: the pleasure principle. Flavor. 2015;4:15.
Nigist A, Sebsebe D. Aromatic and medicinal plants ofEthiopia. 2009.
Zhu L, Seburg RA, Tsai E, Puech S, Mifsud J. Flavor analysis ina pharmaceutical oral solution formulation using an electronic-nose. J Pharm Biomed Anal. 2004;34:453-461.
Longo MA, Sanroman MA. Production of food aromacompounds. Food Biotechnol. 2006;44:335-353.
Srivastava SB. Perfume, flavor and essential oil industries. 42nd
Publication on Small Scale Industries, 5th Edition, p: 94.
Thiel L, Hendricks F. Study into the establishment of an aromaand fragrance fine chemicals value chain in South Africa,Triumph Venture Capital (Pty) Limited. 2004;1-40.
Chambers IV, Koppel EK. Associations of volatile compoundswith sensory aroma and flavor: The complex nature of flavor.Molecules. 2013;18:4887-4905.
Ni H, Hong P, Feng H. Comparative analyses of aromas of fresh,naringinase-treated and resin-absorbed juices of pummelo byGC-MS and sensory evaluation. Flavor Fragr J. 2015;30:245-253.
Dagne E, Hailu S, Bisrat D, Worku T. Constituents of theessential oil of Thymus schimperi. Bull Chem Soc Ethip.1998;12(1):79.
Burdock GA. Fenaroli’s hand book of Flavor Ingredients. CRCpress, 6th ed. 2010:2159.