O O HO HO HO AcNH Mass Spectrometry Overview and Mass Spectrometry of Proteins and Glycoproteins David Graham, Ph.D. Assistant Professor, Department of Molecular and Comparative Pathobiology School of Medicine Director for The Center for Resources in Integrative Biology [email protected]
Transcript
O
O
HO
HO
HOAcNH
Mass Spectrometry Overview and Mass Spectrometry of Proteins and Glycoproteins
David Graham, Ph.D. Assistant Professor,
Department of Molecular and Comparative PathobiologySchool of Medicine Director for
• Better Understanding of Mass Spectrometry– Basic introduction– Components of MS– Basic Principles– Types of instruments– MS as applied to proteins, peptides and glycopeptides– ECD/ETD
• Analyzing MS data– Software tools– Workflows– Extracting Biological Meaning
• Magnetism• Newtons laws of motion• Basic tennants are dealing with charged molecules• Two laws:
– Lorenz force law:– If a particle of charge q moves with velocity v in the presence of
an electric field E and a magnetic field B, then it will experience a force (F)
•
– Newtons second law (non-relatavistic motion):
• F=ma
– The terms F can be related and the equation derived:
• (m/q)a= E + v x B
O
O
HO
HO
HOAcNH
21
2mv zV
2 /F mv R
F Bzv2 /mv R Bzv
2 2/ / 2m z B R V
Ion’s kinetic E function of accelerating voltage (V) and charge (z).
Centrifugal force
Applied magnetic field
balance as ion goes through flight tube
Fundamental equation of mass spectrometry
Combine equations to obtain:
Change ‘mass-to-charge’ (m/z) ratio bychanging V or changing B.
NOTE: if B, V, z constant, then:
r m
Basic equations governing mass spectrometry
Cobb lab
O
O
HO
HO
HOAcNH
What is the take home point?
• We can control our voltages• We know our distances• We know our field strengths• Thus:
– A simple set of equations can be used to calculate the m/z for all different types of mass spectrometers
O
O
HO
HO
HOAcNH
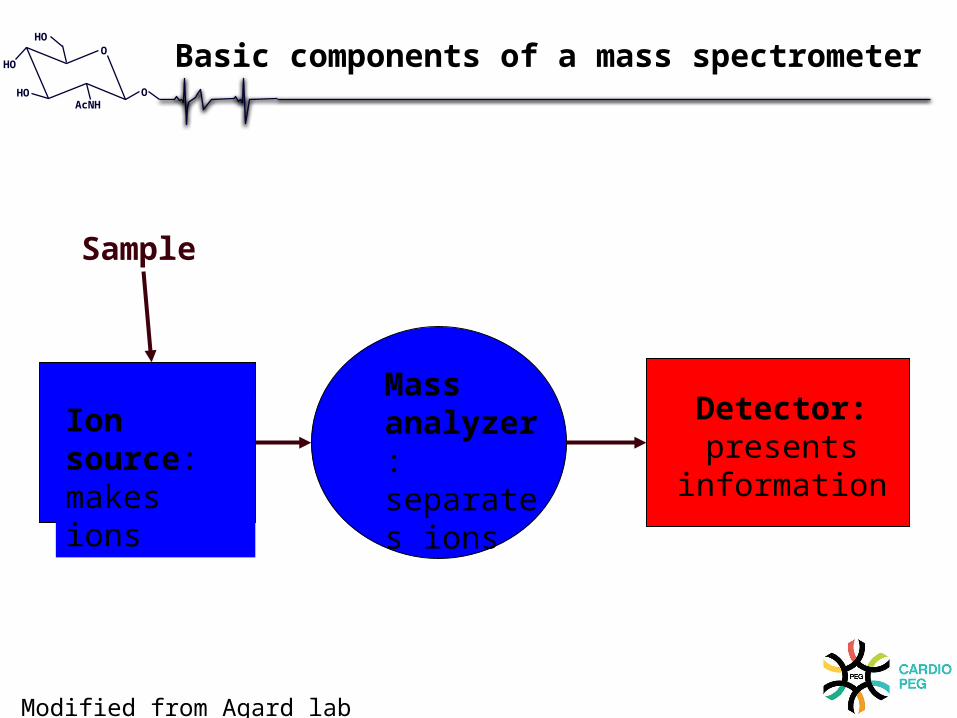
Ion source:makes ions
Mass analyzer: separates ions
Detector:presents
information
Sample
Basic components of a mass spectrometer
Modified from Agard lab
O
O
HO
HO
HOAcNH
InletIonsource
Mass Analyzer Detector
DataSystem
High Vacuum System
Mass Spectrometer Block Diagram
Modified from Agard lab
O
O
HO
HO
HOAcNH
InletIonsource
Mass Analyzer Detector
DataSystem
High Vacuum System
Mass Spectrometer Block Diagram
Turbo pumps
Modified from Agard lab
O
O
HO
HO
HOAcNH
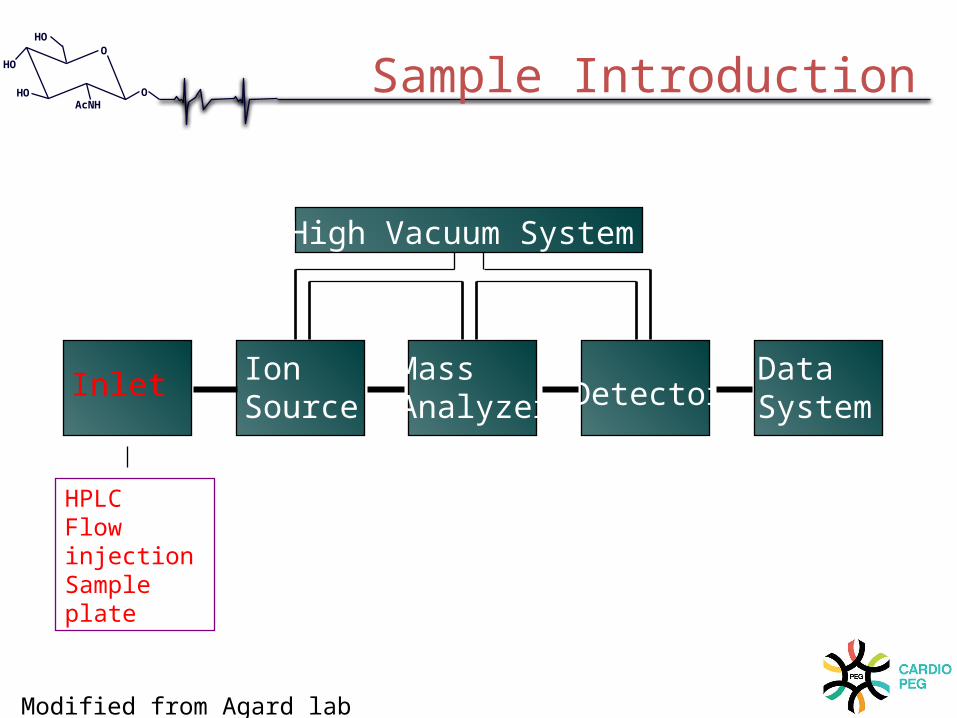
Inlet IonSource
Mass Analyzer Detector
DataSystem
High Vacuum System
HPLCFlow injectionSample plate
Sample Introduction
Modified from Agard lab
O
O
HO
HO
HOAcNH
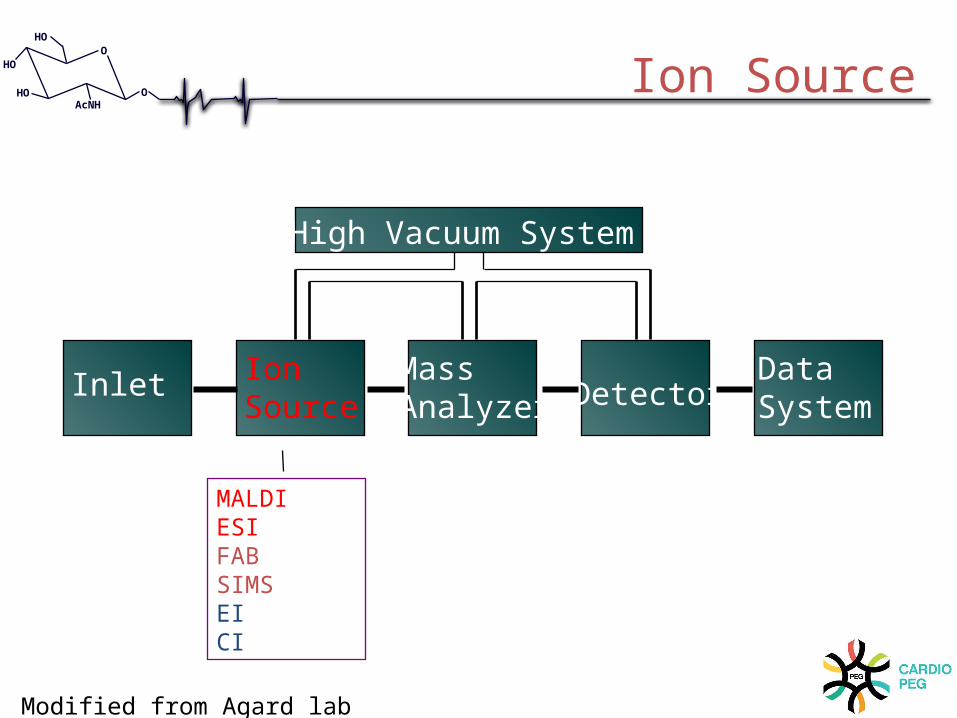
Inlet IonSource
Mass Analyzer Detector
DataSystem
High Vacuum System
MALDIESIFABSIMSEICI
Ion Source
Modified from Agard lab
O
O
HO
HO
HOAcNH
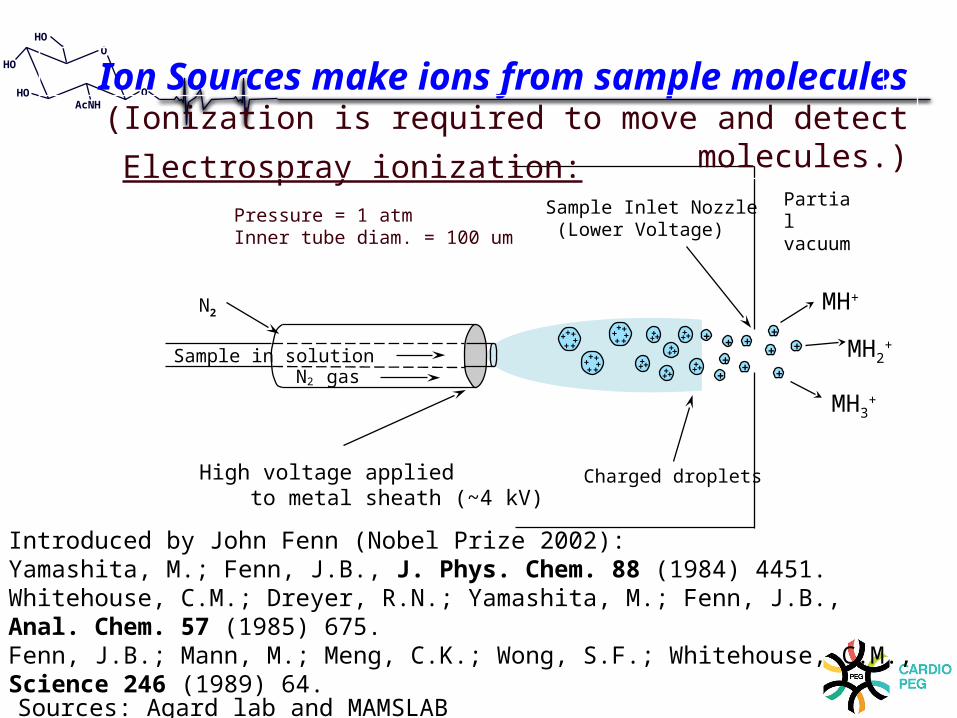
High voltage applied to metal sheath (~4 kV)
Sample Inlet Nozzle(Lower Voltage)
Charged droplets
++
++
++
++
+ +++
++
+ +++ +++
++++++
+++ +
++
+
+
+
+
+++
+++
+++
MH+
MH3+
MH2+
Pressure = 1 atmInner tube diam. = 100 um
Sample in solution
N2
N2 gas
Partialvacuum
Electrospray ionization:
Ion Sources make ions from sample molecules(Ionization is required to move and detect molecules.)
Sources: Agard lab and MAMSLAB
Introduced by John Fenn (Nobel Prize 2002):Yamashita, M.; Fenn, J.B., J. Phys. Chem. 88 (1984) 4451.Whitehouse, C.M.; Dreyer, R.N.; Yamashita, M.; Fenn, J.B., Anal. Chem. 57 (1985) 675.Fenn, J.B.; Mann, M.; Meng, C.K.; Wong, S.F.; Whitehouse, C.M., Science 246 (1989) 64.
O
O
HO
HO
HOAcNH
Favors ejection of multiply charged
Ions
Based on an ion evaporation model:Iribarne, J.V.; Thomson, B.A., J. Chem. Phys. 64 (1976) 2287.Thomson, B.A.; Iribarne, J.V., J. Chem. Phys. 71 (1979) 4451.
Time of flight (TOF)QuadrupoleIon TrapOrbitrapMagnetic SectorFTMS
Mass Analyzer
Modified from Agard lab
O
O
HO
HO
HOAcNH
¤ Mass analyzers separate ions based on their mass-to-charge ratio (m/z)
¤ Operate under high vacuum (keeps ions from bumping into gas molecules)
¤ Actually measure mass-to-charge ratio of ions (m/z)
¤ Key specifications are resolution, mass measurement accuracy, and sensitivity.
¤ Several kinds exist: for bioanalysis, quadrupole, time-of-flight and ion traps are most used.
Mass analyzers
Modified from Agard lab
O
O
HO
HO
HOAcNH
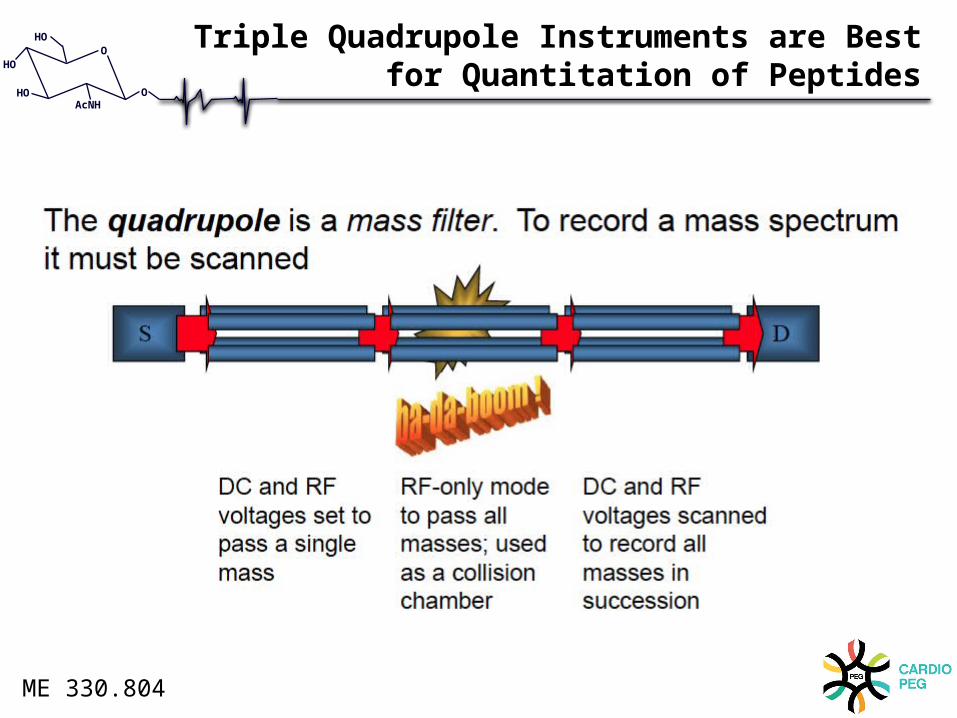
Quadrupole Mass AnalyzerUses a combination of RF and DC voltages to operate as a mass filter.
• Has four parallel metal rods.
• Lets one mass pass through at a time.
• Can scan through all masses or sit at one fixed mass.
Modified from Agard lab
O
O
HO
HO
HOAcNH
mass scanning mode
m1m3m4 m2
m3
m1
m4
m2
single mass transmission mode
m2 m2 m2 m2m3
m1
m4
m2
Quadrupoles have variable ion transmission modes
Modified from Agard lab
O
O
HO
HO
HOAcNH
Time-of-flight (TOF) Mass Analyzer
+
+
+
+
Source Drift region (flight tube)
dete
ctor
V
• Ions are formed in pulses.
• The drift region is field free.
• Measures the time for ions to reach the detector.
• Small ions reach the detector before large ones.
Modified from Agard lab
O
O
HO
HO
HOAcNH
Time of Flight Equation
ME 330.804
O
O
HO
HO
HOAcNH
Ion Trap Mass Analyzer (Developed in the 20’s)
Top View
Cut away side view
^ Kingdon KH (1923). "A Method for the Neutralization of Electron Space Charge by Positive Ionization at Very Low Gas Pressures”. Physical Review 21 (4): 408. Bibcode:1923PhRv...21..408K. doi:10.1103/PhysRev.21.408.
O
O
HO
HO
HOAcNH
O
O
HO
HO
HOAcNH
Quadropole ion trap mass spectrometers (ITMS)
O
O
HO
HO
HOAcNH
O
O
HO
HO
HOAcNH
O
O
HO
HO
HOAcNH
Ion Trap Design modified by Alexander Makarov
• Uses a combination of electrostatic attraction (charge) and centripetal forces
• Image current is detected as ions orbit central electrode (detected on outer electrode)
• Data is processed in a similar manner to FTICR data (Fourrier Transformed)
Makarov A. (2000). "Electrostatic axially harmonic orbital trapping: A high-performance technique of mass analysis". Analytical Chemistry : AC 72 (6): 1156–62. doi:10.1021/ac991131p.
2 /F mv R Centrifugal force
O
O
HO
HO
HOAcNH
InletIonsource
Mass Analyzer Detector
DataSystem
High Vacuum System
Microchannel PlateElectron MultiplierHybrid with photomultiplier
Detectors
Modified from Agard lab
O
O
HO
HO
HOAcNH
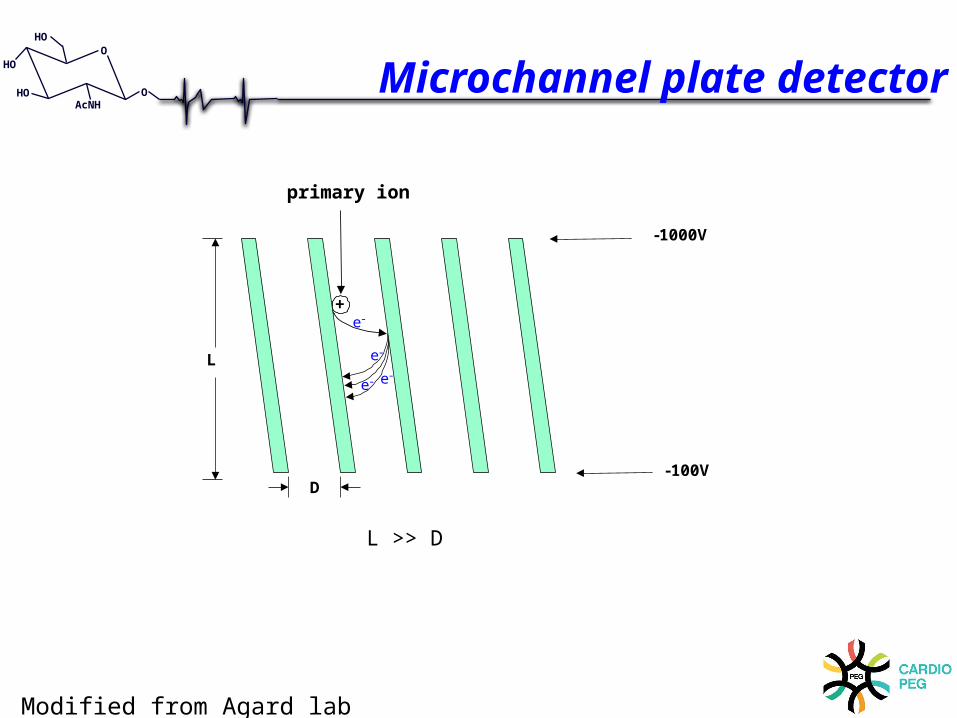
+e -
primary ion
e -
e - e -L
D
- 1000V
- 100V
L >> D
Microchannel plate detector
Modified from Agard lab
O
O
HO
HO
HOAcNH
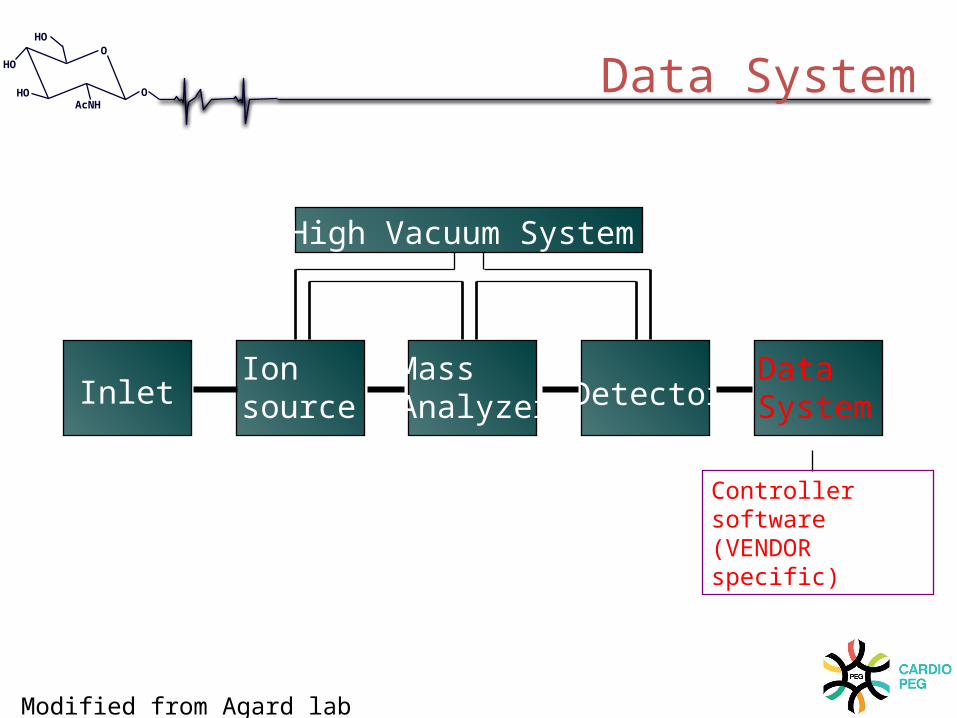
InletIonsource
Mass Analyzer Detector
DataSystem
High Vacuum System
Controller software (VENDOR specific)
Data System
Modified from Agard lab
O
O
HO
HO
HOAcNH
Inlet
Ionization
Mass Analyzer
Mass Sorting (filtering)
Ion Detector
Detection
Ion Source
• Solid• Liquid• Vapor
Detect ionsForm ions
(charged molecules)Sort Ions by Mass (m/z)
1330 1340 1350
100
75
50
25
0
Mass Spectrum
Summary: acquiring a mass spectrum
Modified from Agard lab
O
O
HO
HO
HOAcNH
The mass spectrum shows the resultsRe
lativ
e Ab
unda
nce
Mass (m/z)
0
10000
20000
30000
40000
50000 100000 150000 200000
MH+
(M+2H)2+
(M+3H)3+
MALDI TOF spectrum of IgG
Modified from Agard lab
O
O
HO
HO
HOAcNH
ESI Spectrum of Trypsinogen (MW 23983)
1599.8
1499.9
1714.1
1845.91411.9
1999.6
2181.6
M + 15 H+
M + 13 H+
M + 14 H+M + 16 H+
m/z Mass-to-charge ratio
Modified from Agard lab
O
O
HO
HO
HOAcNH
• Despite being called a Dalton after John Dalton in 1803 who suggested 1H, the discovery of naturally occurring isotopes in 1912 eventually lead to one AMU or Dalton (Da) as being based upon using carbon 12, 12C, as a reference
• One Dalton is defined as 1/12 the mass of a single carbon-12 atom
• Thus, one 12C atom has a mass of 12.0000 Da.
Atomic Mass Units
O
O
HO
HO
HOAcNH
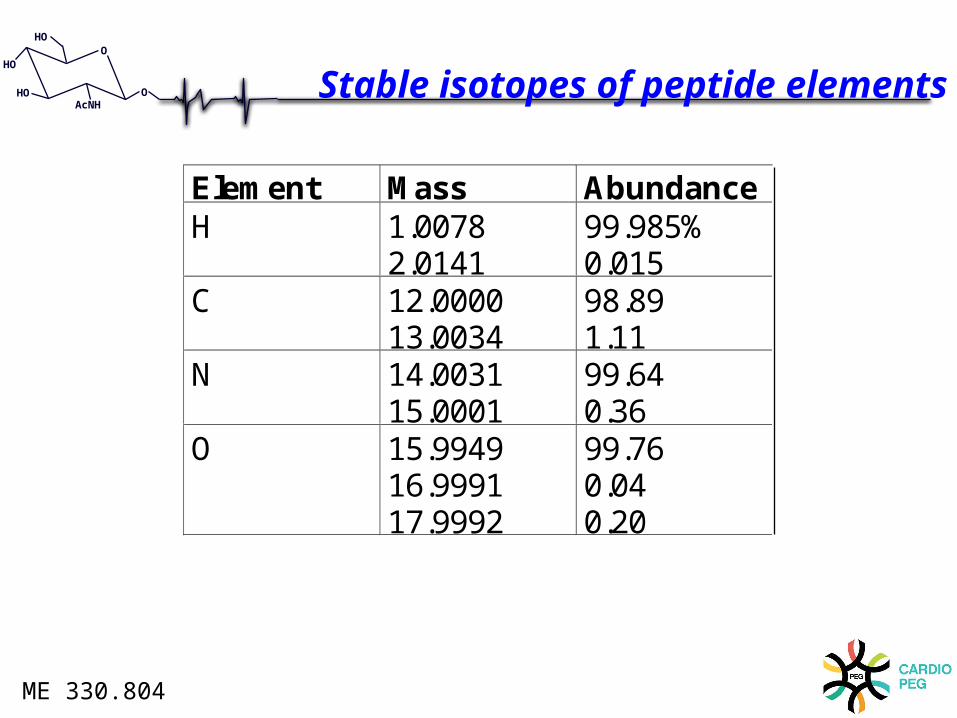
Element Mass AbundanceH 1.0078
2.014199.985%0.015
C 12.000013.0034
98.891.11
N 14.003115.0001
99.640.36
O 15.994916.999117.9992
99.760.040.20
Stable isotopes of peptide elements
ME 330.804
O
O
HO
HO
HOAcNH
Isotopes
• We use isotopes to resolve the charge state of peaks since most element has more than one stable isotope
1981.84
1982.84
1983.84
Mass spectrum of peptide with 94 C-atoms (19 amino acid residues)
No 13C atoms (all 12C)
One 13C atom
Two 13C atoms
“Monoisotopic mass”
Mass difference of 1 Da indicatesa singly chargedPeptidez=2 delta=0.5z=3 delta=0.333z=4 delta=0.25Etc.
Modified from Agard lab
O
O
HO
HO
HOAcNH
m/z
4360.45
4361.45
Isotope pattern for a larger peptide (207 C-atoms)
Modified from Agard lab
O
O
HO
HO
HOAcNH
Mass spectrum of insulin
12C : 5730.61
13C
2 x 13C
Insulin has 257 C-atoms. Above this mass, the monoisotopic peak is too small to be very useful, and the average mass is usually used.Modified from Agard lab
O
O
HO
HO
HOAcNH
Monoisotopic mass
Monoisotopic masscorresponds tolowest mass peak
When the isotopes are clearly resolved the monoisotopic mass is used as it is the most accurate measurement.
Modified from Agard lab
O
O
HO
HO
HOAcNH
Average mass
Average mass corresponds to the centroid of the unresolved peak cluster
When the isotopes are not resolved, the centroid of the envelope corresponds to the weighted average of all the the isotope peaks in the cluster, which is the same as the average or chemical mass.
Modified from Agard lab
O
O
HO
HO
HOAcNH
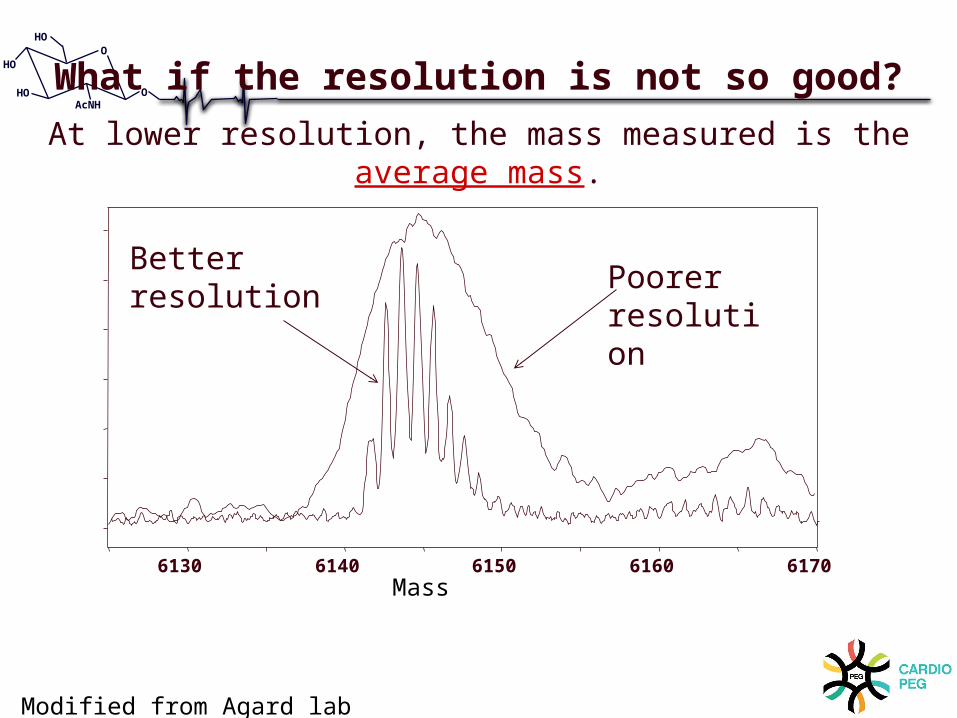
6130 6140 6150 6160 6170
Poorer resolution
Better resolution
What if the resolution is not so good?At lower resolution, the mass measured is the average mass.
Mass
Modified from Agard lab
O
O
HO
HO
HOAcNH
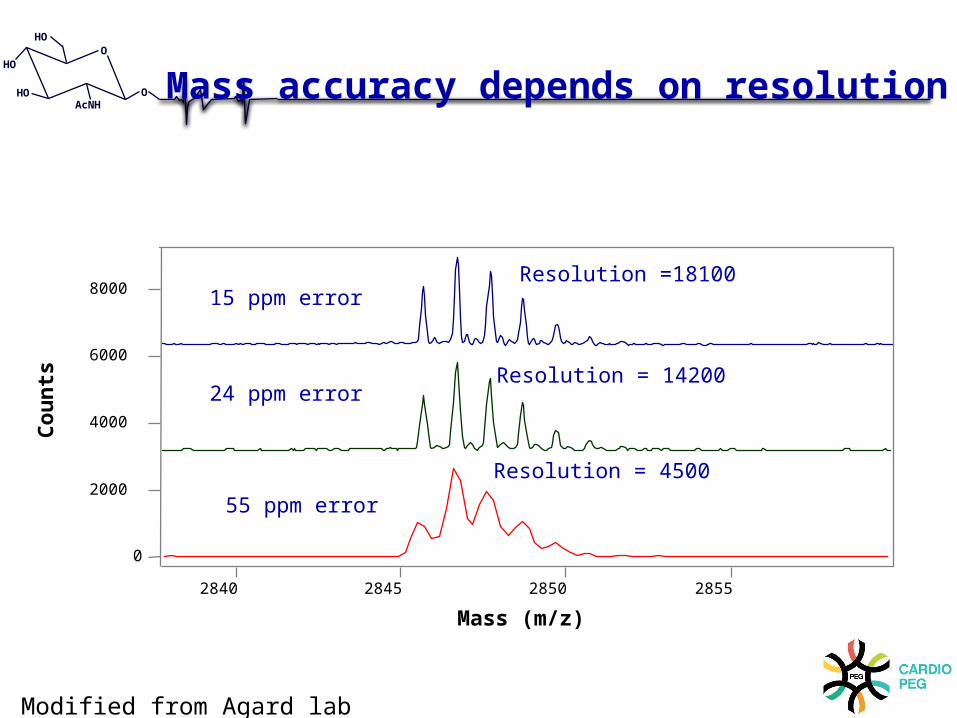
Mass accuracy depends on resolution
0
2000
4000
6000
8000
Coun
ts
2840 2845 2850 2855
Mass (m/z)
Resolution = 14200
Resolution = 4500
Resolution =18100 15 ppm error
24 ppm error
55 ppm error
Modified from Agard lab
O
O
HO
HO
HOAcNH
How is resolution calculated?
• Resolution is the ratio of the mass divided by full width at half maximum. Also known as resolving power
• R = m/Δm where• Δm = peak width (FWHM definition)• Δm = mass difference between two• peaks (valley definition)
• What mass resolution is required to separate m/z 88 and 89?
m/Δm = 88/1 = 88
Modified from Agard lab / ME 330.804
O
O
HO
HO
HOAcNH
Resolution and Accuracy of Mass Analyzers
ME 330.804
O
O
HO
HO
HOAcNH
With high resolution mass spectrometry it is possible
to do “Top Down” Proteomics
ME 330.804
O
O
HO
HO
HOAcNH
Usually in combination with ECD or ETD
ME 330.804
O
O
HO
HO
HOAcNH
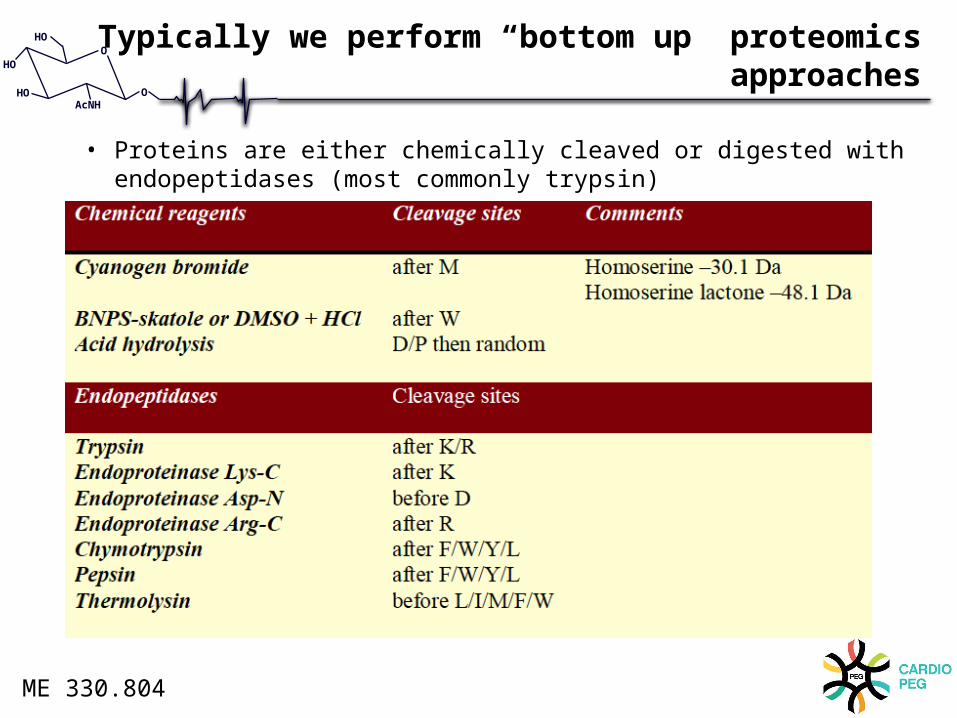
Typically we perform “bottom up” proteomics approaches
• Proteins are either chemically cleaved or digested with endopeptidases (most commonly trypsin)
ME 330.804
O
O
HO
HO
HOAcNH
Since resulting peptides follow a repeating pattern..
-HN--CH--CO--NH--CH--CO--NH-
Ri CH-R’
ci
zn-i
R”
di+1
vn-i wn-i
low energy
high energyai
xn-i
bi
yn-i
O
O
HO
HO
HOAcNH
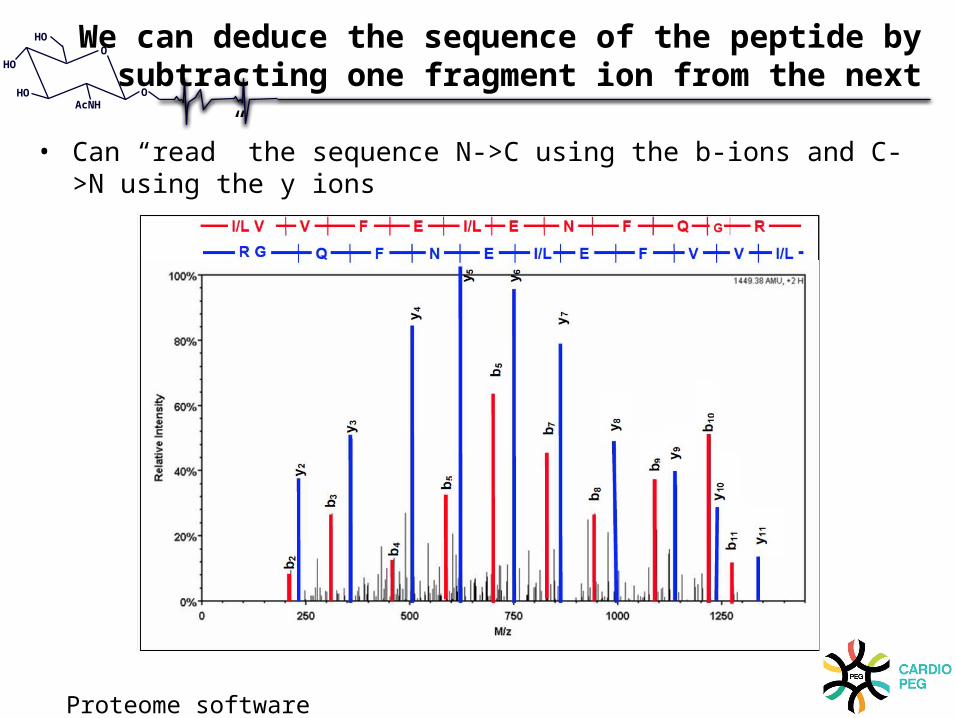
We can deduce the sequence of the peptide by subtracting one fragment ion from the next
• Can “read” the sequence N->C using the b-ions and C->N using the y ions
Proteome software
O
O
HO
HO
HOAcNH
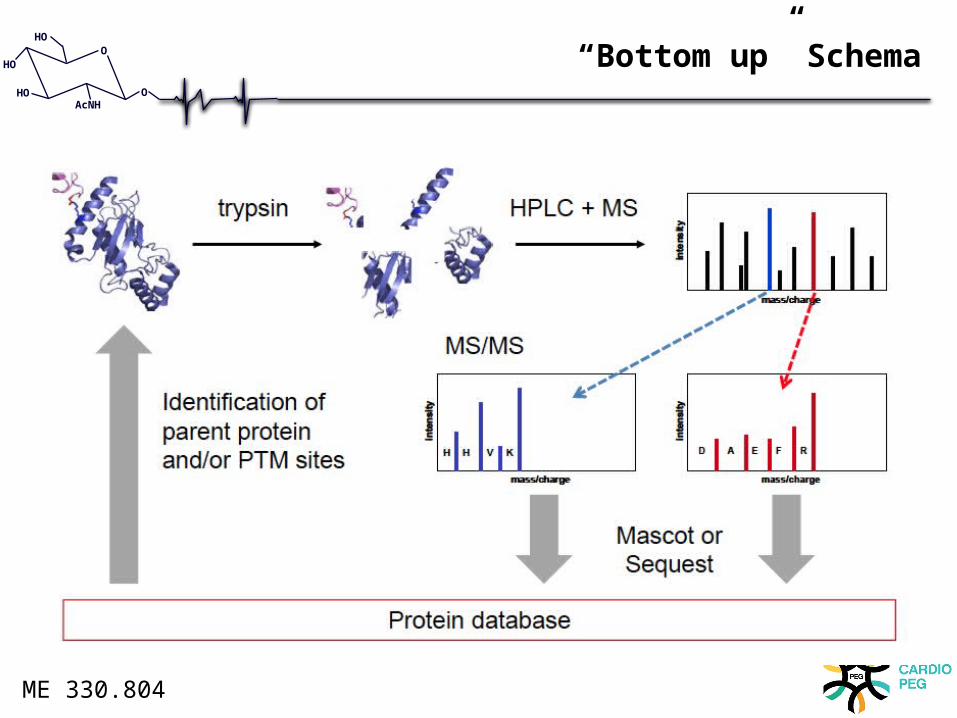
“Bottom up” Schema
ME 330.804
O
O
HO
HO
HOAcNH
“Bottom Up” Strategies
ME 330.804
O
O
HO
HO
HOAcNH
Need to use “Tandem Mass Spectrometry”or MS/MS
ME 330.804
O
O
HO
HO
HOAcNH
Examples of tandem (and hybrid) instruments:
Tandem in time:• Ion trap mass spectrometer (ITMS)• Fourier transform mass spectrometer (FTMS)• Linear ion trap/FTMS (LTQ-FT)
Tandem in space:• Triple quadrupoles• Quadrupole/time-of-flight (QTOF)• Time-of-flight/time-of-flight (TOF/TOF)• Ion trap/time-of-flight (trapTOF, Qit/TOF)
ME 330.804
O
O
HO
HO
HOAcNH
Ion Traps perform separate experiments in the time domain
ME 330.804
O
O
HO
HO
HOAcNH
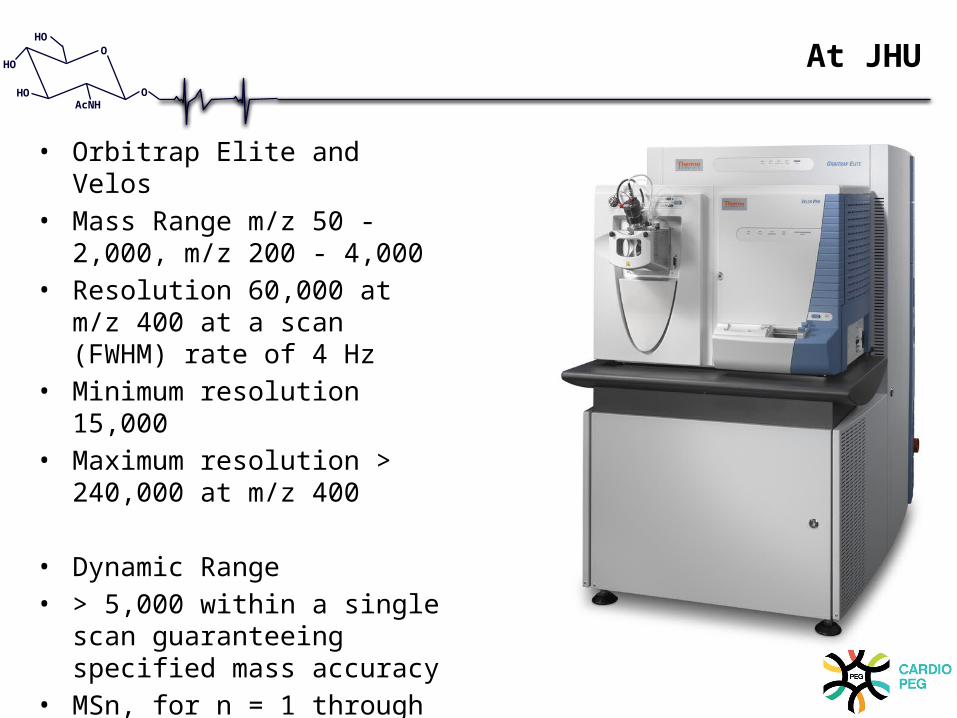
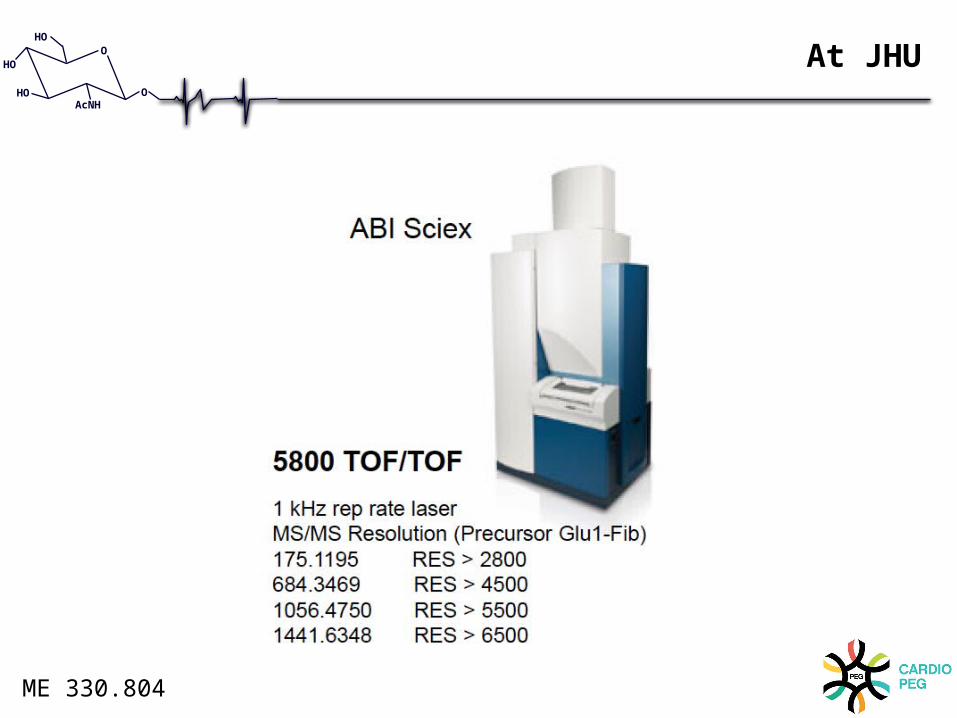
At JHU
• Orbitrap Elite and Velos• Mass Range m/z 50 - 2,000,
m/z 200 - 4,000• Resolution 60,000 at m/z
400 at a scan (FWHM) rate of 4 Hz
• Minimum resolution 15,000• Maximum resolution >
240,000 at m/z 400 • Dynamic Range• > 5,000 within a single
scan guaranteeing specified mass accuracy
• MSn, for n = 1 through 10 • ETD Option
O
O
HO
HO
HOAcNH
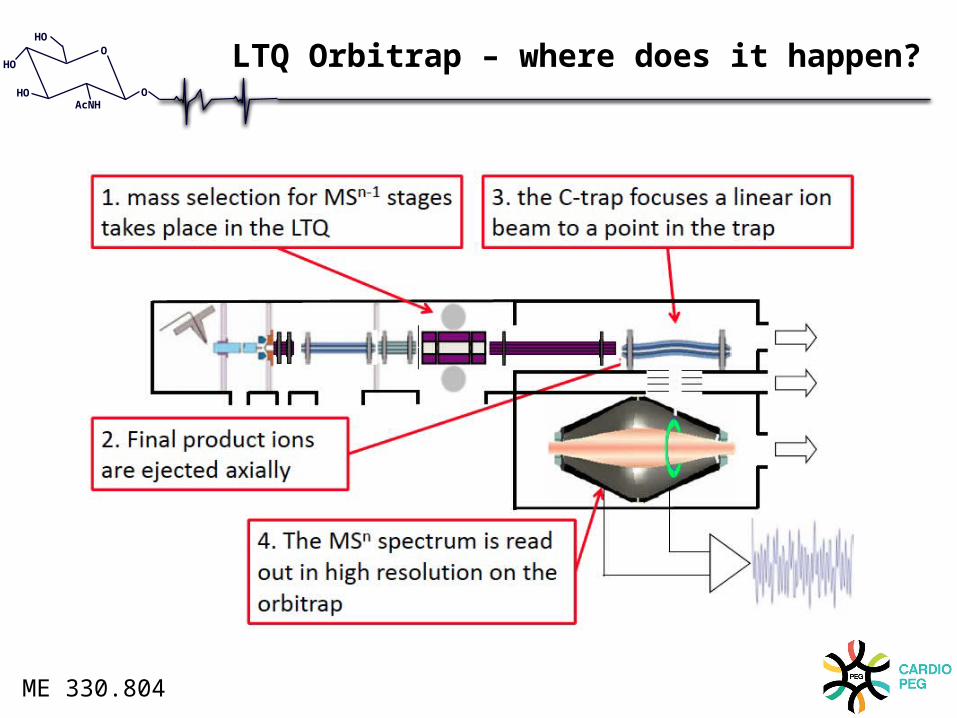
LTQ Orbitrap – where does it happen?
ME 330.804
O
O
HO
HO
HOAcNH
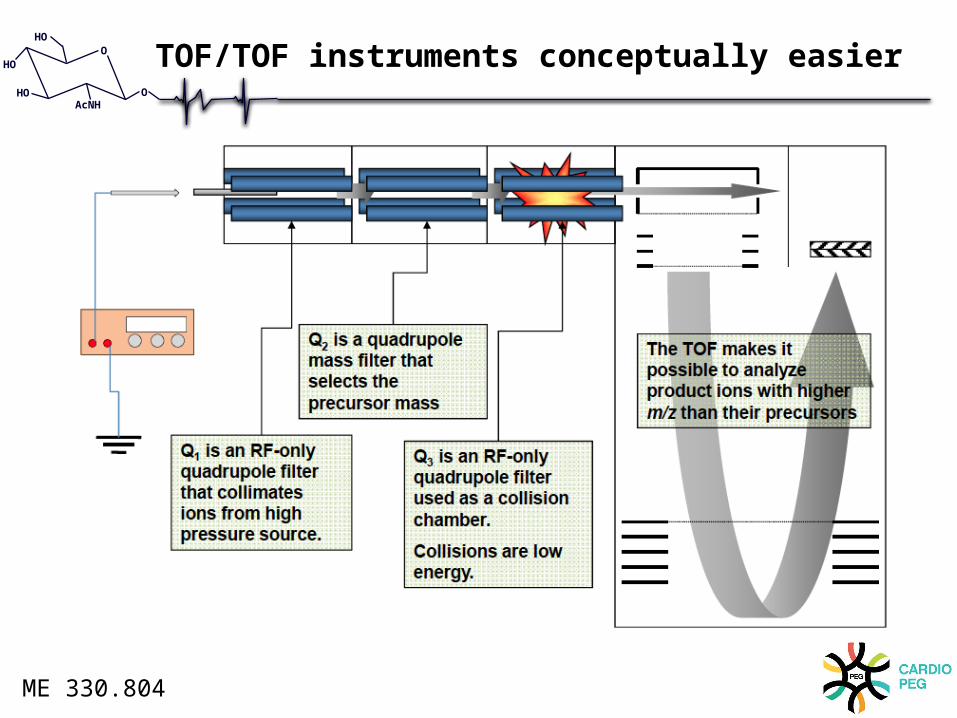
TOF/TOF instruments conceptually easier
ME 330.804
O
O
HO
HO
HOAcNH
High versus low energy collisions
ME 330.804
O
O
HO
HO
HOAcNH
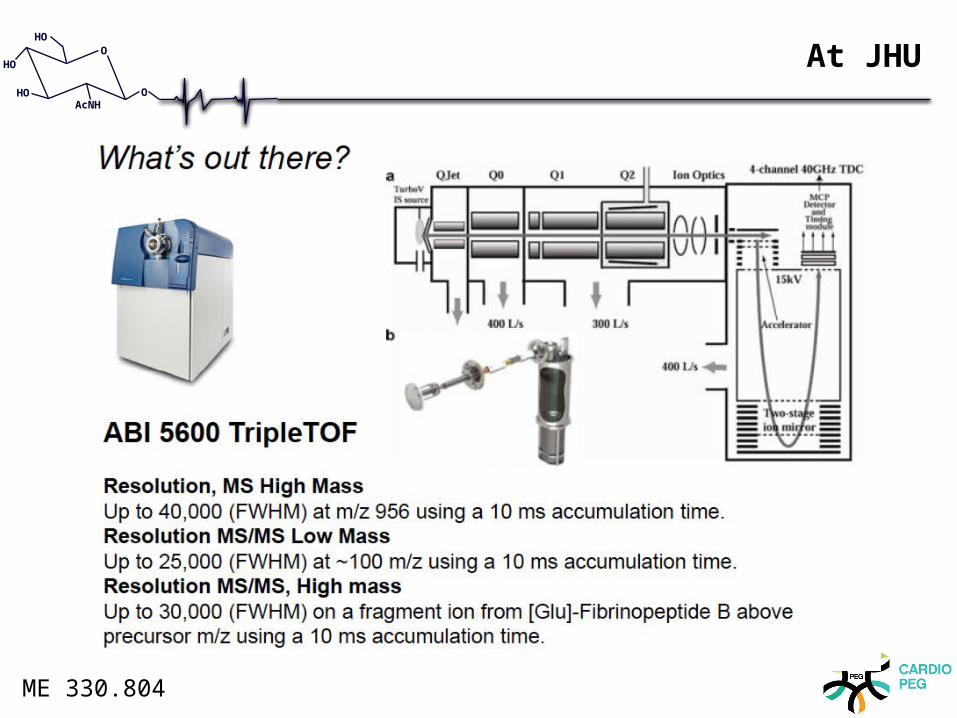
At JHU
ME 330.804
O
O
HO
HO
HOAcNH
Commercially available TOF/TOF instruments
ME 330.804
O
O
HO
HO
HOAcNH
At JHU
ME 330.804
O
O
HO
HO
HOAcNH
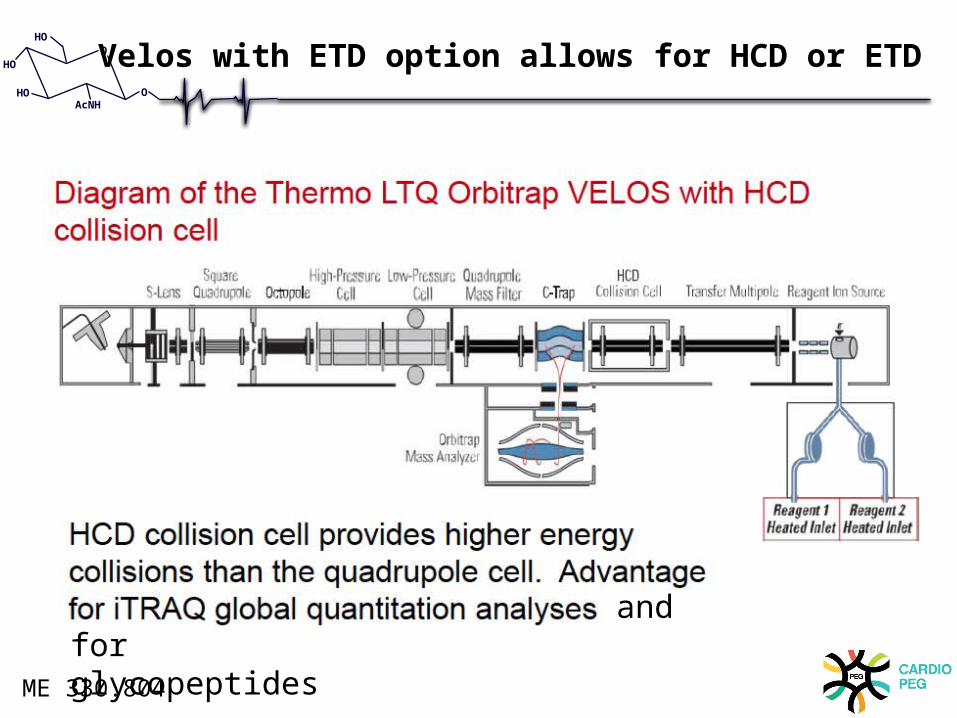
For intact glycopeptides
• Higher energy fragmentation can be used for unambigous identification of sites of N-linked glycan utilization– Overcomes the problems associated with PNGaseF and
deamidation– HCD feature on Orbitrap instrumentation (C-TRAP)
• High Energy CID by MALDI TOF/TOF– Uses Argon as a collision gas
O
O
HO
HO
HOAcNH
For OGlcNAc ECD and ETD are recommended
ME 330.804
O
O
HO
HO
HOAcNH
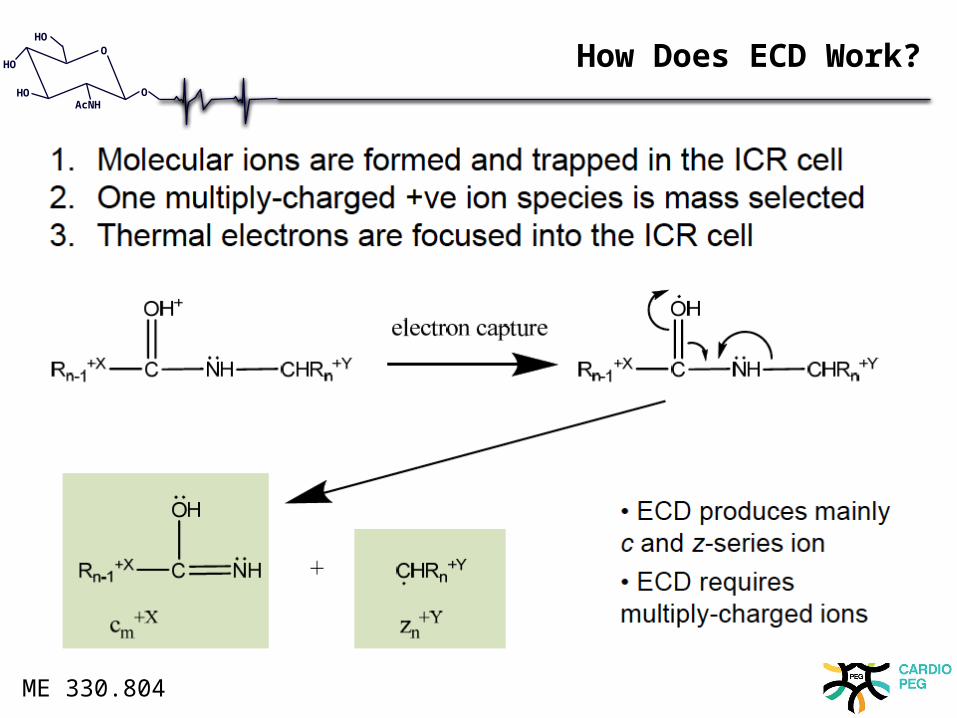
How Does ECD Work?
ME 330.804
O
O
HO
HO
HOAcNH
In contrast ETD does not use free electrons.
ME 330.804
O
O
HO
HO
HOAcNH
Velos with ETD option allows for HCD or ETD
and forglycopeptidesME 330.804
O
O
HO
HO
HOAcNH
Triple Quadrupole Instruments are Bestfor Quantitation of Peptides
ME 330.804
O
O
HO
HO
HOAcNH
Tripple Quadrupole Instruments are best forquantitation
ME 330.804
O
O
HO
HO
HOAcNH
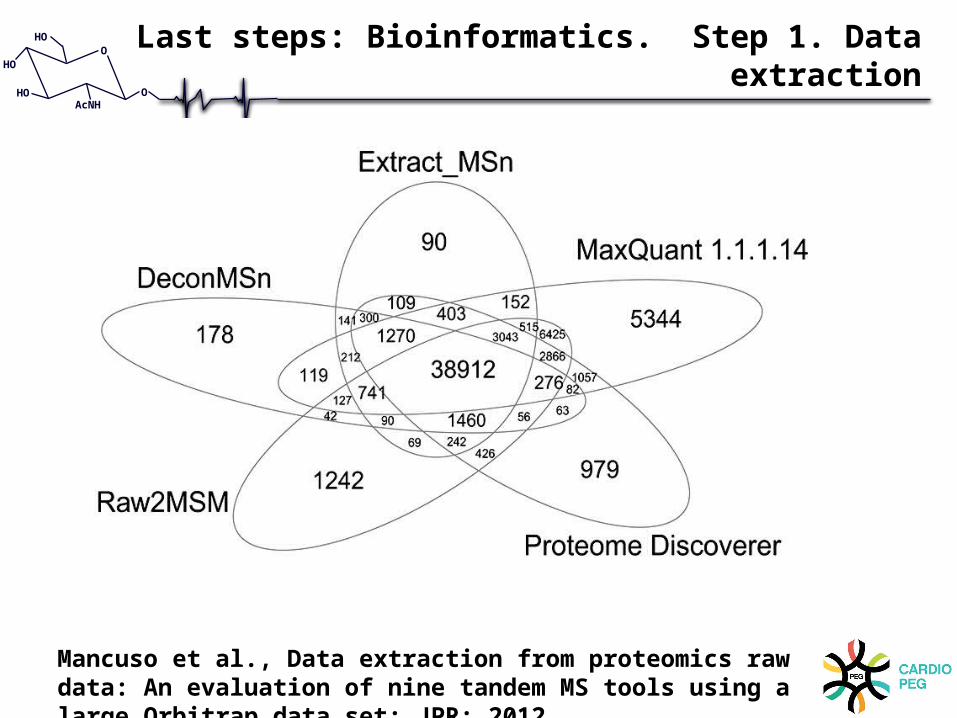
Last steps: Bioinformatics. Step 1. Data extraction
Mancuso et al., Data extraction from proteomics raw data: An evaluation of nine tandem MS tools using a large Orbitrap data set: JPR: 2012
O
O
HO
HO
HOAcNH
Courtesy R. Gundry
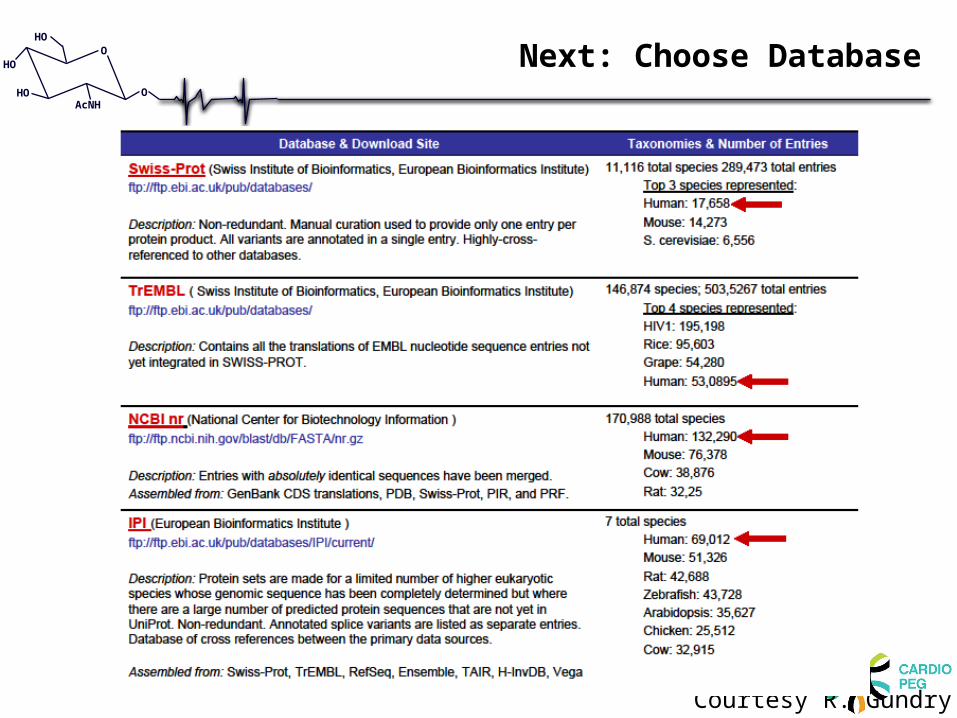
Next: Choose Database
O
O
HO
HO
HOAcNH
Courtesy R. Gundry
O
O
HO
HO
HOAcNH
Courtesy R. Gundry
O
O
HO
HO
HOAcNH
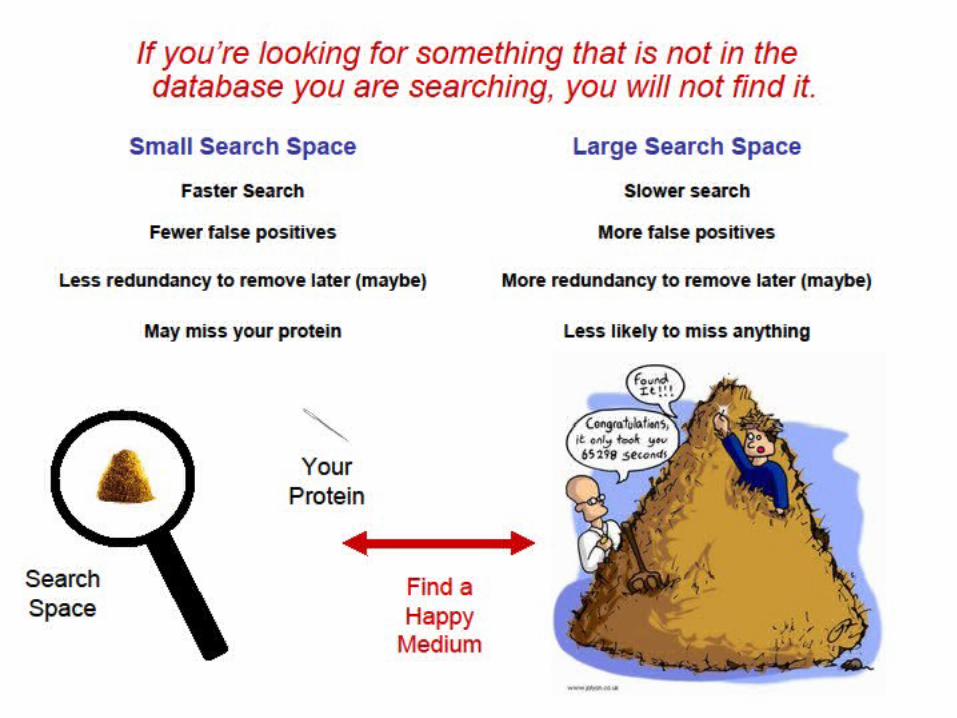
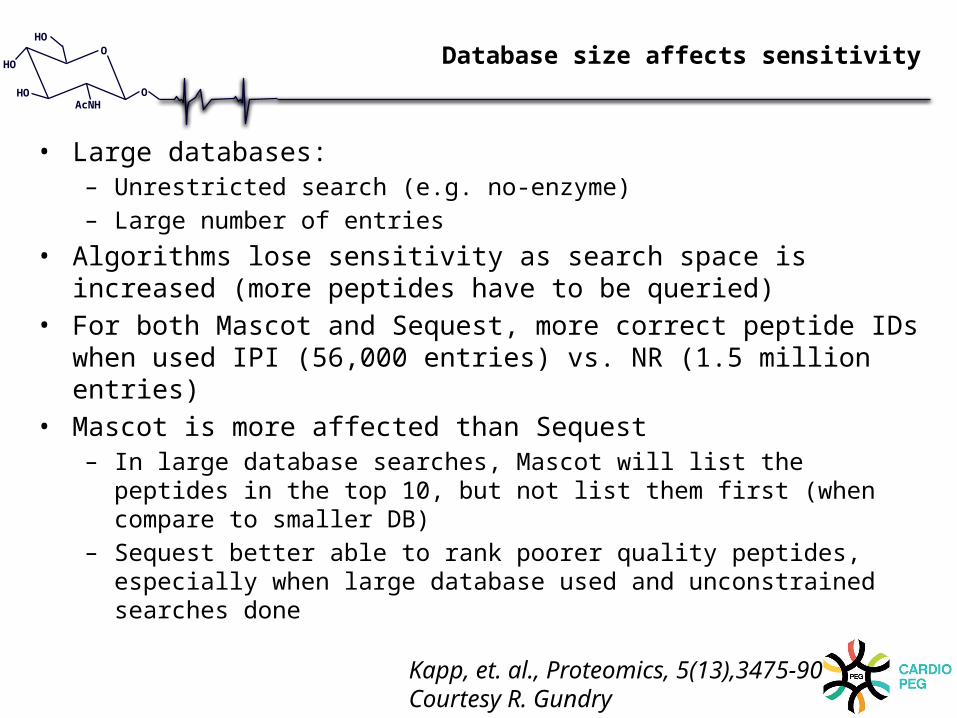
Database size affects sensitivity
• Large databases:– Unrestricted search (e.g. no-enzyme)– Large number of entries
• Algorithms lose sensitivity as search space is increased (more peptides have to be queried)
• For both Mascot and Sequest, more correct peptide IDs when used IPI (56,000 entries) vs. NR (1.5 million entries)
• Mascot is more affected than Sequest– In large database searches, Mascot will list the peptides in the top
10, but not list them first (when compare to smaller DB)– Sequest better able to rank poorer quality peptides, especially
when large database used and unconstrained searches done
Kapp, et. al., Proteomics, 5(13),3475-90Courtesy R. Gundry
O
O
HO
HO
HOAcNH
Beware redundancy..
O
O
HO
HO
HOAcNH
Database on Demand
O
O
HO
HO
HOAcNH
There are a myriad of search tools out there..
O
O
HO
HO
HOAcNH
Some perform better than others
O
O
HO
HO
HOAcNH
At JHU – recommend MASCOT (NHLBI maintained)
$8.00/hr of search
O
O
HO
HO
HOAcNH
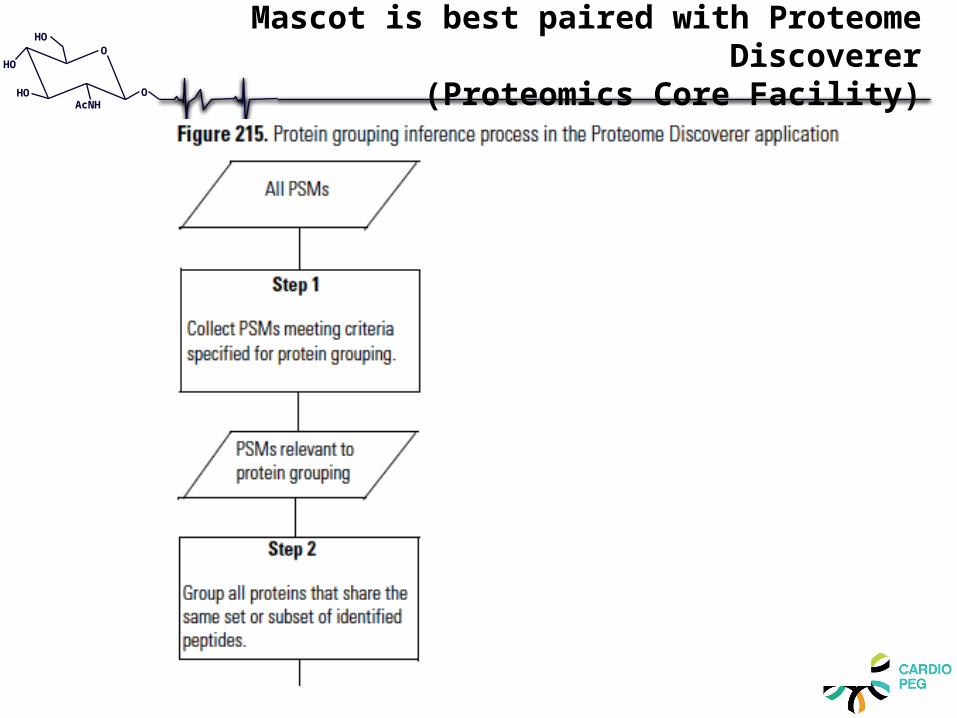
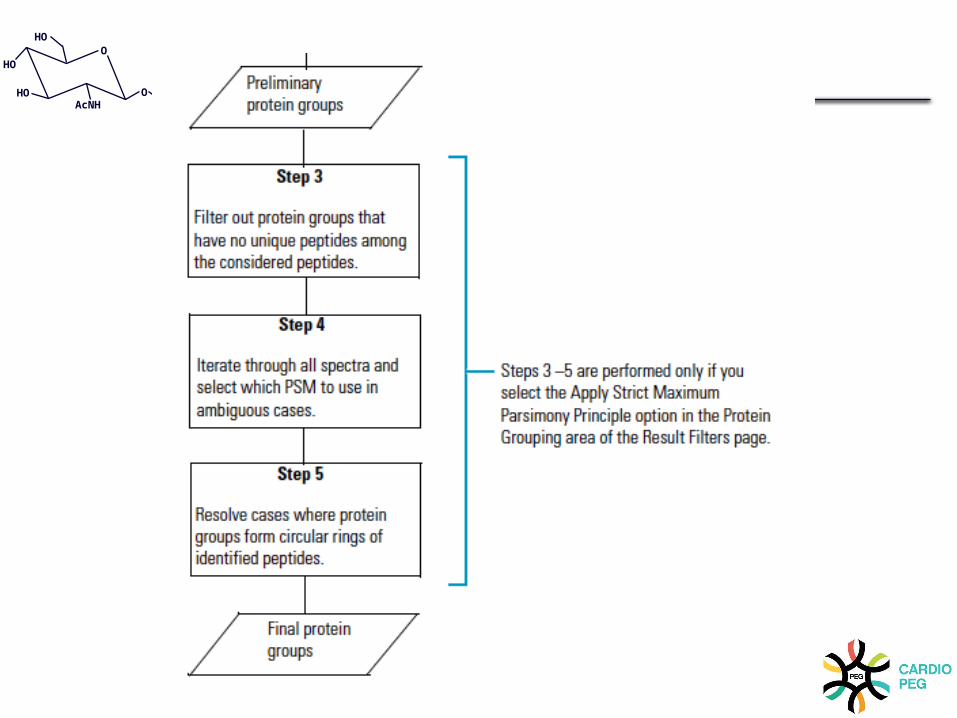
Mascot is best paired with Proteome Discoverer
(Proteomics Core Facility)
O
O
HO
HO
HOAcNH
O
O
HO
HO
HOAcNH
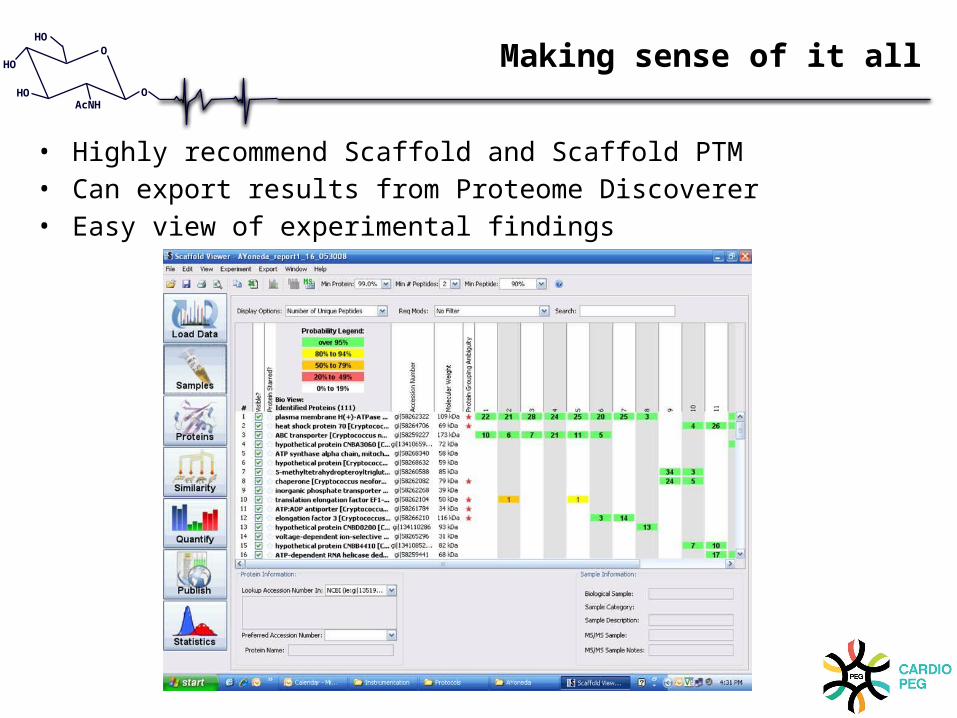
Making sense of it all
• Highly recommend Scaffold and Scaffold PTM• Can export results from Proteome Discoverer• Easy view of experimental findings