HAL Id: hal-02462524 https://hal-ifp.archives-ouvertes.fr/hal-02462524 Submitted on 31 Jan 2020 HAL is a multi-disciplinary open access archive for the deposit and dissemination of sci- entific research documents, whether they are pub- lished or not. The documents may come from teaching and research institutions in France or abroad, or from public or private research centers. L’archive ouverte pluridisciplinaire HAL, est destinée au dépôt et à la diffusion de documents scientifiques de niveau recherche, publiés ou non, émanant des établissements d’enseignement et de recherche français ou étrangers, des laboratoires publics ou privés. O2 contamination in SSC / HIC test environments. Impact on test results and discussion on acceptable limits for high H 2 S content Christophe Mendibide, Martien Duvall Deffo Ayagou, Claude Duret-Thual, Jean Kittel To cite this version: Christophe Mendibide, Martien Duvall Deffo Ayagou, Claude Duret-Thual, Jean Kittel. O2 contam- ination in SSC / HIC test environments. Impact on test results and discussion on acceptable limits for high H 2 S content. Corrosion 2019, Mar 2019, Nashville, United States. hal-02462524
Transcript
HAL Id: hal-02462524https://hal-ifp.archives-ouvertes.fr/hal-02462524
Submitted on 31 Jan 2020
HAL is a multi-disciplinary open accessarchive for the deposit and dissemination of sci-entific research documents, whether they are pub-lished or not. The documents may come fromteaching and research institutions in France orabroad, or from public or private research centers.
L’archive ouverte pluridisciplinaire HAL, estdestinée au dépôt et à la diffusion de documentsscientifiques de niveau recherche, publiés ou non,émanant des établissements d’enseignement et derecherche français ou étrangers, des laboratoirespublics ou privés.
O2 contamination in SSC / HIC test environments.Impact on test results and discussion on acceptable
limits for high H 2 S contentChristophe Mendibide, Martien Duvall Deffo Ayagou, Claude Duret-Thual,
Jean Kittel
To cite this version:Christophe Mendibide, Martien Duvall Deffo Ayagou, Claude Duret-Thual, Jean Kittel. O2 contam-ination in SSC / HIC test environments. Impact on test results and discussion on acceptable limitsfor high H 2 S content. Corrosion 2019, Mar 2019, Nashville, United States. �hal-02462524�
O2 contamination in SSC / HIC test environments. Impact on test results and discussion on acceptable limits for high H2S content
Christophe Mendibide, Institut de la Corrosion – Site de Saint-Etienne
ZA du parc secteur Gampille 42490 Fraisses
France
Martien Deffo-Ayagou Institut de la Corrosion – Site de Saint-Etienne
ZA du parc secteur Gampille 42490 Fraisses
France
Claude Duret-Thual Institut de la Corrosion – Site de Saint-Etienne
ZA du parc secteur Gampille 42490 Fraisses
Jean Kittel
IFP Energies nouvelles Rond point de l’échangeur de Solaize, BP3
69360 Solaize France
ABSTRACT
It is a well admitted fact that oxygen contamination shall be avoided during H2S cracking tests of low alloy steels. In the 2016 revisions of NACE TM0177 and NACE TM0284 documents, quantitative limits of O2 contamination were included with thresholds at 10 and 50 ppb of dissolved oxygen depending on the considered mechanical properties of the tested grade. However, the scientific basis of these values are not well established and there is still a lack of experimental data to illustrate the potential impacts of an oxygen pollution. In addition, while the revised test methods explicitly address initial contamination of the test solution before H2S introduction, they do not consider a continuous oxygen supply during testing. Yet, continuous contamination is extremely difficult to be completely eliminated.
In order to better understand the impact of O2 contamination on H2S cracking, a 3-years Joint Industrial Project was launched at the end of 2015. The objectives were to evaluate if O2 contamination can affect H2S cracking test results. A range of steel grades covering different types of O&G applications for High H2S content were used. SSC (uniaxial tensile tests as well as 4 point-bend) and HIC tests were conducted, with well controlled and continuous O2 contamination. Three levels of O2 partial pressures in the gas feed corresponding to 300 ppb, 50 ppb and less than 10 ppb dissolved O2 were used. In parallel to the standard qualification tests, hydrogen permeation and weight-loss corrosion experiments were performed with the same test matrix, covering all regions of the SSC severity diagram. This paper aims at sharing the main results of this project for high H2S content.
INTRODUCTION It is a well admitted fact that oxygen contamination shall be avoided during H2S cracking tests of low alloy steels. Until 2016, NACE technical methods related to H2S cracking resistance evaluation (e.g. NACE TM0284 and NACE TM0177) only gave general comments on O2 pollution. For instance, it was recommended that ‘test vessels shall be capable of being purged to remove O2’, and also that ‘O2 contamination is evidenced by a cloudy appearance’. In the 2016 revisions of NACE TM0177 and NACE TM0284 documents, quantitative limits of O2 contamination were included1, 2. It is now stated that the test solution shall contains less than 50 mass. ppb dissolved O2 before the introduction of H2S. A more stringent limit of 10 ppb max. is imposed when testing CRA’s or high strength low alloy steels (> 80 ksi). If such precise figures represent a step forward in a clear description of testing procedures, they might also represent an important extra-cost, especially for the 10 ppb requirement. However, these values 10 – 50 ppb are not supported by available experimental data and it is almost impossible to conclude if they are relevant or not to avoid strong bias with real exposure conditions. In addition, while the revised test methods explicitly address initial contamination of the test solution before H2S introduction, they do not consider a continuous oxygen supply during testing. Yet, continuous contamination is extremely difficult to be completely eliminated. For instance, oxygen ingress may arise by permeation through polymer tubes used for the tests, through the vessel walls if it is sufficiently permeable to oxygen or in case of a lack of tightness of gaskets. In standard glass vessels used for the evaluation of steel resistance to H2S cracking, appropriate test procedures should allow for the controlling of O2 levels below 50 ppb. However, higher values can be reached in the case of poor laboratory practices. Installing the test vessels in closed cabinets with inert gas flushing is a good but costly solution to reduce these risks. In order to better understand the impact of O2 contamination on H2S cracking, a 3-years Joint Industrial Project (JIP) was launched at the end of 2015. The objectives were to evaluate how O2 contamination affects H2S cracking test results. The experimental program included HIC and SSC exposures with a range of low alloy steels covering all SSC severity regions of ISO 15156-2 standard.3 The paper focuses only on some grades considered in the JIP that were tested under high H2S pressure.
EXPERIMENTAL PROCEDURE Control of oxygen contamination in test environments Since the main objective of the study was to evaluate the impact of O2 contamination, it was necessary to develop robust procedures allowing the control of O2 content in the test cells. In order to simulate a continuous O2 contamination, two separate gas lines with mass flow controllers (MFCs) were used. The first gas line comprised pure H2S or H2S/CO2 mixture. The second gas line was fed with O2/N2 (or Ar) or O2/CO2. The oxygen concentration in the gas line was selected depending on the targeted dissolved oxygen level based on O2 solubility data published by Battino et al4. who developed an empirical equation relating O2 solubility in brines as a function of salinity and temperature:
( ) ⁄ ( ) [ ⁄ ] (1)
Where C is O2 solubility in water exposed to air (21 % O2), expressed in mL(STP)/L, S is the salinity in parts per thousand, and the various coefficients have the values given in Figure 1. Calculations are reported applicable up to 200 kPa partial pressure of gas.
Table 1: Coefficients for Equation (1), from 4
A1 -1268.9782
A2 36063.19
A3 220.1832
A4 -0.351299
B1 6.229x10⁻³
B2 -3.5912
B3 3.44x10⁻⁶
According to this equation, partial pressures of O2 leading to 50 ppbw and 300 ppbw in 35 g/L NaCl water at 24 °C are respectively 1.7 mbar and 10 mbar. These values are however highly influenced by temperature and salinity. Indeed, in the temperature interval of NACE tests (24 +/- 3 °C), O2 solubility varies by 12 %. Salinity has an impact of the same order, with a decrease of O2 solubility by 8 % when salinity changes from 35 g/L to 50 g/L (with decreasing O2 solubility as salinity increases). The accuracy of the gas mixing system to control O2 levels at 50 ppbw and 300 ppbw was verified by separate tests where H2S was replaced by a non-reactive gas. Details were published in a previous communication5. Since the recent revisions of NACE TM0177 and NACE TM0284 mention some O2 limits expressed in ppbw, this unit will be used in the paper, though the parameter that was indeed controlled was O2 partial pressure. It must be recognized also that the effective O2 concentration is expected to be lower than the equilibrium concentration, due to reactions of oxygen with H2S and dissolved iron. In absence of O2 pollution, experimental procedures allowed controlling dissolved O2 below 10 ppbw. Type of tests and test vessels Three types of experiments were carried out: a) HIC experiments, b) SSC experiments, either by 4 point-bending or uniaxial tension and, c) hydrogen permeation. The main characteristics of the various test cells are given hereafter. All tests were performed at 23 ± 3°C and atmospheric pressure HIC experiments (alloys Gr.60 – X65) A schematic drawing of the HIC cell used is presented in Figure 1. The system consisted of a 30L glass vessel containing a variable volume of solution depending on the number of specimens considered in the tests. For all experiments, the volume of solution used was adjusted to achieve a volume to surface ratio (V/S) close to 30 mL/cm².
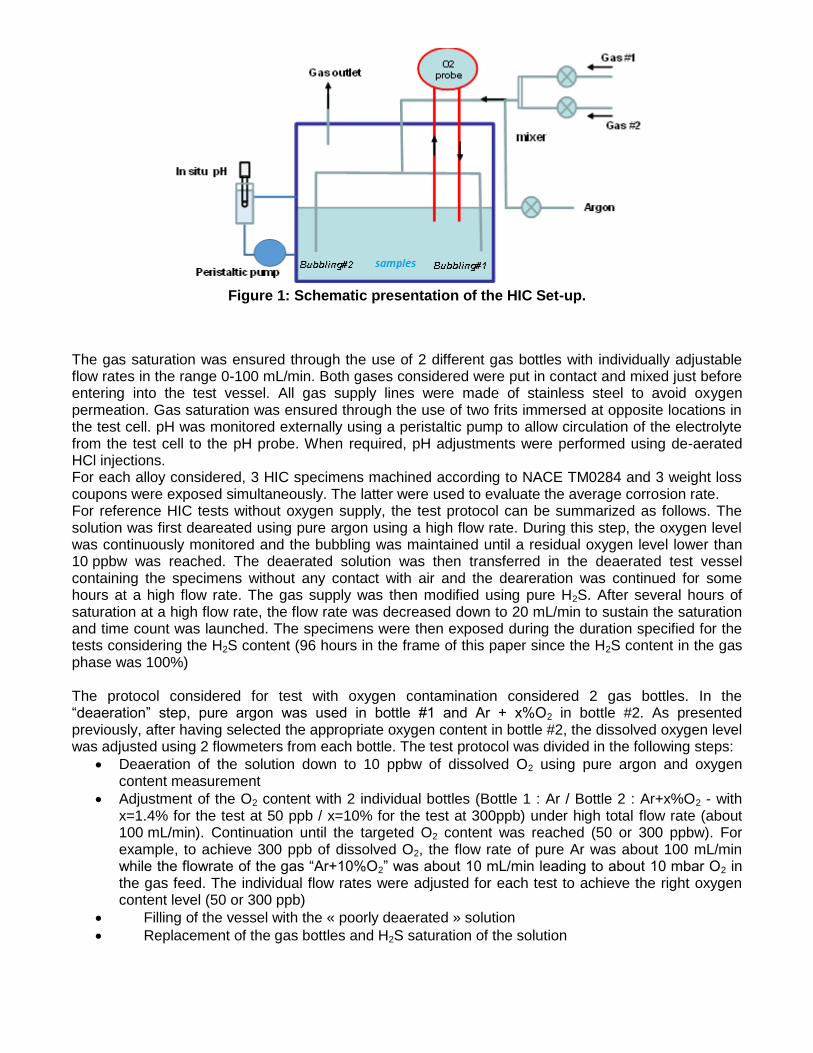
Figure 1: Schematic presentation of the HIC Set-up.
The gas saturation was ensured through the use of 2 different gas bottles with individually adjustable flow rates in the range 0-100 mL/min. Both gases considered were put in contact and mixed just before entering into the test vessel. All gas supply lines were made of stainless steel to avoid oxygen permeation. Gas saturation was ensured through the use of two frits immersed at opposite locations in the test cell. pH was monitored externally using a peristaltic pump to allow circulation of the electrolyte from the test cell to the pH probe. When required, pH adjustments were performed using de-aerated HCl injections. For each alloy considered, 3 HIC specimens machined according to NACE TM0284 and 3 weight loss coupons were exposed simultaneously. The latter were used to evaluate the average corrosion rate. For reference HIC tests without oxygen supply, the test protocol can be summarized as follows. The solution was first deareated using pure argon using a high flow rate. During this step, the oxygen level was continuously monitored and the bubbling was maintained until a residual oxygen level lower than 10 ppbw was reached. The deaerated solution was then transferred in the deaerated test vessel containing the specimens without any contact with air and the deareration was continued for some hours at a high flow rate. The gas supply was then modified using pure H2S. After several hours of saturation at a high flow rate, the flow rate was decreased down to 20 mL/min to sustain the saturation and time count was launched. The specimens were then exposed during the duration specified for the tests considering the H2S content (96 hours in the frame of this paper since the H2S content in the gas phase was 100%) The protocol considered for test with oxygen contamination considered 2 gas bottles. In the “deaeration” step, pure argon was used in bottle #1 and Ar + x%O2 in bottle #2. As presented previously, after having selected the appropriate oxygen content in bottle #2, the dissolved oxygen level was adjusted using 2 flowmeters from each bottle. The test protocol was divided in the following steps:
Deaeration of the solution down to 10 ppbw of dissolved O2 using pure argon and oxygen content measurement
Adjustment of the O2 content with 2 individual bottles (Bottle 1 : Ar / Bottle 2 : Ar+x%O2 - with x=1.4% for the test at 50 ppb / x=10% for the test at 300ppb) under high total flow rate (about 100 mL/min). Continuation until the targeted O2 content was reached (50 or 300 ppbw). For example, to achieve 300 ppb of dissolved O2, the flow rate of pure Ar was about 100 mL/min while the flowrate of the gas “Ar+10%O2” was about 10 mL/min leading to about 10 mbar O2 in the gas feed. The individual flow rates were adjusted for each test to achieve the right oxygen content level (50 or 300 ppb)
Filling of the vessel with the « poorly deaerated » solution
Replacement of the gas bottles and H2S saturation of the solution
o gas 1 : H2S / : gas 2 : Ar+x% O2 (with x=1.4% for the test at 50 ppb / x=10% for the test at 300ppb)
o Cumulated flow rate about 100 mL/min (no modification of the setting considered during the O2 adjustment in the “deaeration step”)
After saturation, decreasing of the total flow rate down to 20 mL/min. The individual flow rate from each bottle was decreased in a proportional manner.
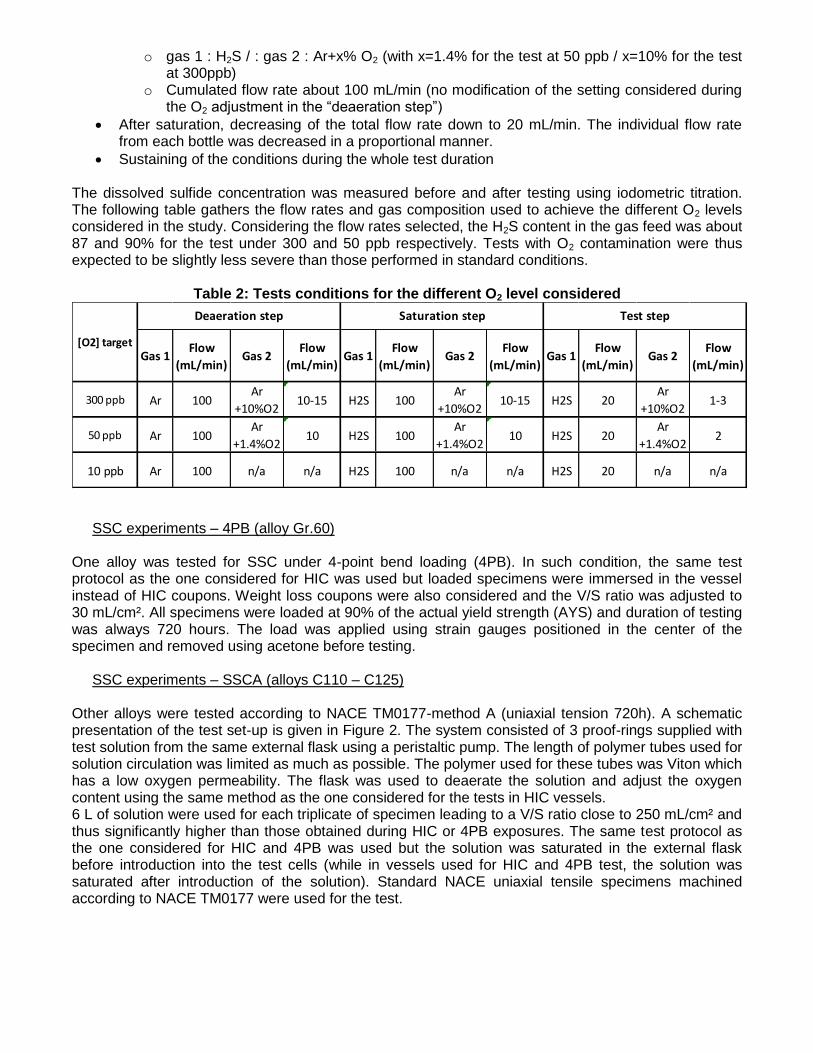
Sustaining of the conditions during the whole test duration The dissolved sulfide concentration was measured before and after testing using iodometric titration. The following table gathers the flow rates and gas composition used to achieve the different O2 levels considered in the study. Considering the flow rates selected, the H2S content in the gas feed was about 87 and 90% for the test under 300 and 50 ppb respectively. Tests with O2 contamination were thus expected to be slightly less severe than those performed in standard conditions.
Table 2: Tests conditions for the different O2 level considered
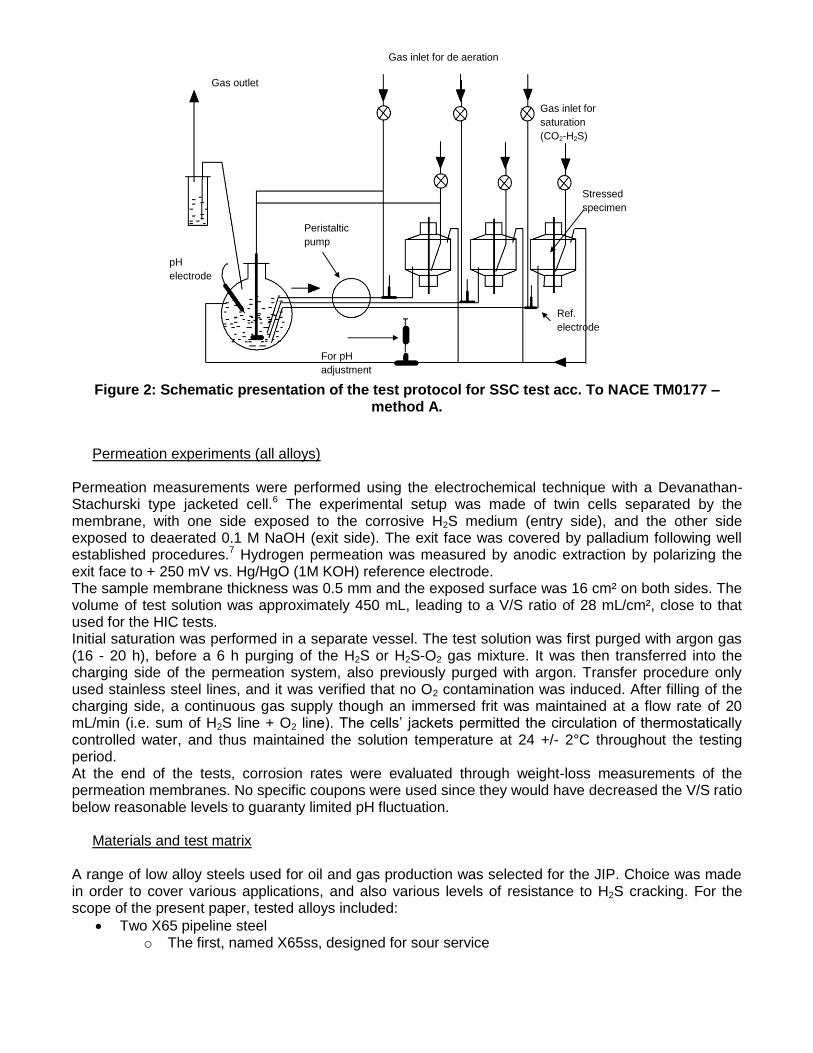
SSC experiments – 4PB (alloy Gr.60) One alloy was tested for SSC under 4-point bend loading (4PB). In such condition, the same test protocol as the one considered for HIC was used but loaded specimens were immersed in the vessel instead of HIC coupons. Weight loss coupons were also considered and the V/S ratio was adjusted to 30 mL/cm². All specimens were loaded at 90% of the actual yield strength (AYS) and duration of testing was always 720 hours. The load was applied using strain gauges positioned in the center of the specimen and removed using acetone before testing. SSC experiments – SSCA (alloys C110 – C125) Other alloys were tested according to NACE TM0177-method A (uniaxial tension 720h). A schematic presentation of the test set-up is given in Figure 2. The system consisted of 3 proof-rings supplied with test solution from the same external flask using a peristaltic pump. The length of polymer tubes used for solution circulation was limited as much as possible. The polymer used for these tubes was Viton which has a low oxygen permeability. The flask was used to deaerate the solution and adjust the oxygen content using the same method as the one considered for the tests in HIC vessels. 6 L of solution were used for each triplicate of specimen leading to a V/S ratio close to 250 mL/cm² and thus significantly higher than those obtained during HIC or 4PB exposures. The same test protocol as the one considered for HIC and 4PB was used but the solution was saturated in the external flask before introduction into the test cells (while in vessels used for HIC and 4PB test, the solution was saturated after introduction of the solution). Standard NACE uniaxial tensile specimens machined according to NACE TM0177 were used for the test.
Figure 2: Schematic presentation of the test protocol for SSC test acc. To NACE TM0177 –
method A.
Permeation experiments (all alloys) Permeation measurements were performed using the electrochemical technique with a Devanathan-Stachurski type jacketed cell.6 The experimental setup was made of twin cells separated by the membrane, with one side exposed to the corrosive H2S medium (entry side), and the other side exposed to deaerated 0.1 M NaOH (exit side). The exit face was covered by palladium following well established procedures.7 Hydrogen permeation was measured by anodic extraction by polarizing the exit face to + 250 mV vs. Hg/HgO (1M KOH) reference electrode. The sample membrane thickness was 0.5 mm and the exposed surface was 16 cm² on both sides. The volume of test solution was approximately 450 mL, leading to a V/S ratio of 28 mL/cm², close to that used for the HIC tests. Initial saturation was performed in a separate vessel. The test solution was first purged with argon gas (16 - 20 h), before a 6 h purging of the H2S or H2S-O2 gas mixture. It was then transferred into the charging side of the permeation system, also previously purged with argon. Transfer procedure only used stainless steel lines, and it was verified that no O2 contamination was induced. After filling of the charging side, a continuous gas supply though an immersed frit was maintained at a flow rate of 20 mL/min (i.e. sum of H2S line + O2 line). The cells’ jackets permitted the circulation of thermostatically controlled water, and thus maintained the solution temperature at 24 +/- 2°C throughout the testing period. At the end of the tests, corrosion rates were evaluated through weight-loss measurements of the permeation membranes. No specific coupons were used since they would have decreased the V/S ratio below reasonable levels to guaranty limited pH fluctuation. Materials and test matrix A range of low alloy steels used for oil and gas production was selected for the JIP. Choice was made in order to cover various applications, and also various levels of resistance to H2S cracking. For the scope of the present paper, tested alloys included:
Two X65 pipeline steel o The first, named X65ss, designed for sour service
pH
electrode
For pH
adjustment
Gas inlet for de aeration
Gas inlet for
saturation
(CO2-H2S)
Ref.
electrode
Peristaltic
pump
Gas outlet
Stressed
specimen
o The second, named X65 non-ss, not acceptable in sour environment
SA235 Gr.60 plate
C110 casing steel Some tests performed on a C125 grade under lower H2S partial pressure are also presented for comparison purpose. In these tests, the balance gas was CO2 and not Ar. Both alloys X65non-ss and Grade 60 were not manufactured for sour service and HIC sensitivity was thus expected. These alloys were selected to ensure occurrence of HIC cracking upon testing and possibly highlight the effect of oxygen pollution on the crack length ratio. X65non-ss was only used for HIC tests while X65ss was selected for SSC experiments All specimens were sampled in the longitudinal direction of the mill material (tube for X65 and Casing steel / plate for Grade 60). A specific sampling was however considered for the X65 alloy. For all HIC and 4PB tests, 2 specimens out of each triplicate were sampled longitudinally while the third specimen was sampled transversally to the longitudinal weld of the pipeline. For alloy X65, each triplicate contained thus 2 specimens without weld and 1 specimen with a weld in the middle of the specimen. The mechanical properties of each alloy are given in Table 3.
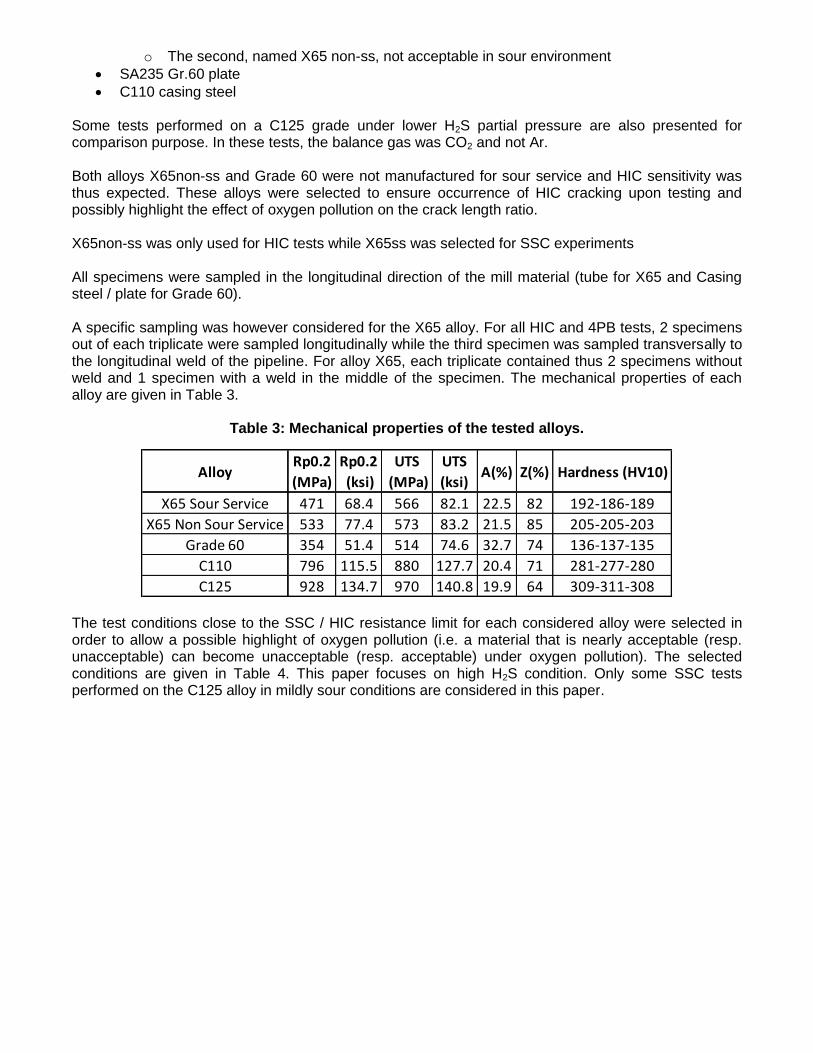
Table 3: Mechanical properties of the tested alloys.
The test conditions close to the SSC / HIC resistance limit for each considered alloy were selected in order to allow a possible highlight of oxygen pollution (i.e. a material that is nearly acceptable (resp. unacceptable) can become unacceptable (resp. acceptable) under oxygen pollution). The selected conditions are given in Table 4. This paper focuses on high H2S condition. Only some SSC tests performed on the C125 alloy in mildly sour conditions are considered in this paper.
AlloyRp0.2
(MPa)
Rp0.2
(ksi)
UTS
(MPa)
UTS
(ksi)A(%) Z(%) Hardness (HV10)
X65 Sour Service 471 68.4 566 82.1 22.5 82 192-186-189
X65 Non Sour Service 533 77.4 573 83.2 21.5 85 205-205-203
Grade 60 354 51.4 514 74.6 32.7 74 136-137-135
C110 796 115.5 880 127.7 20.4 71 281-277-280
C125 928 134.7 970 140.8 19.9 64 309-311-308
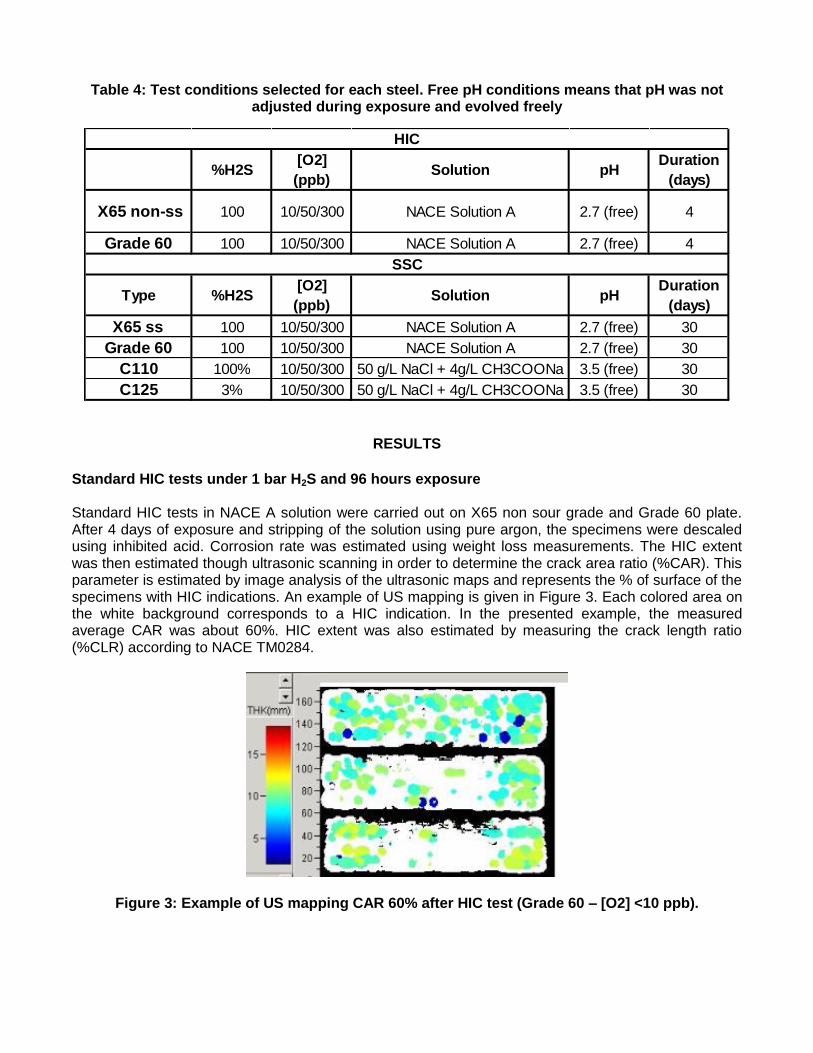
Table 4: Test conditions selected for each steel. Free pH conditions means that pH was not adjusted during exposure and evolved freely
RESULTS
Standard HIC tests under 1 bar H2S and 96 hours exposure Standard HIC tests in NACE A solution were carried out on X65 non sour grade and Grade 60 plate. After 4 days of exposure and stripping of the solution using pure argon, the specimens were descaled using inhibited acid. Corrosion rate was estimated using weight loss measurements. The HIC extent was then estimated though ultrasonic scanning in order to determine the crack area ratio (%CAR). This parameter is estimated by image analysis of the ultrasonic maps and represents the % of surface of the specimens with HIC indications. An example of US mapping is given in Figure 3. Each colored area on the white background corresponds to a HIC indication. In the presented example, the measured average CAR was about 60%. HIC extent was also estimated by measuring the crack length ratio (%CLR) according to NACE TM0284.
Figure 3: Example of US mapping CAR 60% after HIC test (Grade 60 – [O2] <10 ppb).
%H2S[O2]
(ppb)Solution pH
Duration
(days)
X65 non-ss 100 10/50/300 NACE Solution A 2.7 (free) 4
Grade 60 100 10/50/300 NACE Solution A 2.7 (free) 4
Type %H2S[O2]
(ppb)Solution pH
Duration
(days)
X65 ss 100 10/50/300 NACE Solution A 2.7 (free) 30
Grade 60 100 10/50/300 NACE Solution A 2.7 (free) 30
Figure 4 presents the CAR and CLR ratio measured for the X65 and Grade 60 specimens. The error bars correspond to the max and min measured values. The values presented are an average of the 3 coupons for Grade 60 but an average of only 2 coupons for alloy X65. Indeed, for this alloy, the specimen sampled in the transverse direction through the longitudinal weld never evidenced HIC, and was thus not considered for the present analysis. On Grade 60, 2 tests were performed in standard conditions. Only CLR was measured after the first test while CLR and CAR were evaluated after the second test. That is explaining why 2 histograms are presented for the CLR of grade 60 tested under 10 ppb O2.
Figure 4: Measured %CAR and %CLR after HIC test under 100%H2S and variable oxygen levels
HIC results obtained on X65 grade do not present a significant impact of O2 content from less than 10 ppbw and up to 300 ppbw. Whatever the O2 content, extensive HIC cracking occurs resulting in a FAIL response for this alloy (%CLR > 15 is unacceptable according to ISO 15156 – Table B.3). On the other hand, Grade 60 shows a decrease of HIC extent as O2 supply increases. This evolution is already observed for only 50 ppbw of oxygen, and the result changes from FAIL (CLR>15%) in well controlled conditions, to PASS (CLR<15%) when O2 contamination is present at 50 ppbw and above. However, even if a decreasing severity with oxygen content is also evidenced considering the statistically more relevant CAR values, the evolution is less pronounced. Obviously the presence of oxygen can modify the extent of cracking with impact depending on the material/test conditions Corrosion rates determined from weight-loss measurements of HIC specimens are presented on Figure 5. For X65 alloy, O2 contamination induces a significant increase of corrosion rates by approximately 50 % or 100% depending on the oxygen content considered (from 1.4 mm/year to 2.3 mm/year or 3 mm/year). This trend was not observed on Grade 60, which exhibits an increase of the corrosion rate with 50 ppbw O2, but not for 300 ppbw O2. These results have to be treated with caution, since the extremely short test duration results and high scattering of mass losses.
0
10
20
30
40
50
60
70
80
10 ppb 50 ppb 300 ppb
%C
AR
100% H2S
Gr.60 X65 non-ss
0
10
20
30
40
50
60
10 ppb 50 ppb 300 ppb%
CLR
100% H2S
Gr.60 XC65 non-ss
Test #1
Test #2
Figure 5: corrosion rates of HIC specimens after 96 hours exposure in NACE A solution under
1 bar H2S at various levels of O2 contamination.
In order to understand the reasons for the variable test severities depending on alloys/conditions, test solution analysis and hydrogen permeation measurements were carried out. Figure 6 displays the dissolved sulfide content measured by iodometric titration at test start (after saturation) and end (after 4 days of exposure). The saturation time (duration of initial gas purging at high flow rate before decreasing the flow) is also indicated on the figure. According to experience, considering the volume of solution (10 L to 20 L) some hours of saturation in standard conditions ([O2] <10 ppbw) are known to be enough to saturate the test solution. That was confirmed in all experiments since the dissolved sulfide content expected at saturation (about 2.3 g/L) was always reached after 3 hours of bubbling for experiments without oxygen pollution. Under continuous oxygen flow, saturation of the solution was more difficult whatever the oxygen level considered (50 or 300 ppbw). Most of the experiments did not exhibit a saturated solution after even 17 hours (1 night) of gas purging. Most of the experiments thus started with an unsaturated media. Surprisingly, H2S saturation was recovered at the end of all tests.
Figure 6: Dissolved sulfide content measured at test start and end for all HIC experiment performed under 100% H2S. The saturation level indicated is the one expected considering the
H2S content in the gas feed (i.e. 100%, 90% and 87 % for 10, 50 and 300 ppb respectively)
1000
1500
2000
2500
3000
3500
Vco
rr (
um
/yea
r)
100% H2S - HIC
<10 ppb 50 ppb 300 ppb
0
500
1000
1500
2000
2500
3000
Dis
solv
ed
su
lfid
es
(pp
m)
100% H2S - 10 ppb
start End Saturation limit
0
500
1000
1500
2000
2500
3000
Dis
solv
ed
su
lfid
es
(pp
m)
100% H2S - 50 ppb
start End Saturation limit
0
500
1000
1500
2000
2500
3000
Dis
solv
ed
su
lfid
es
(pp
m)
100% H2S - 300 ppb
start End Saturation limit
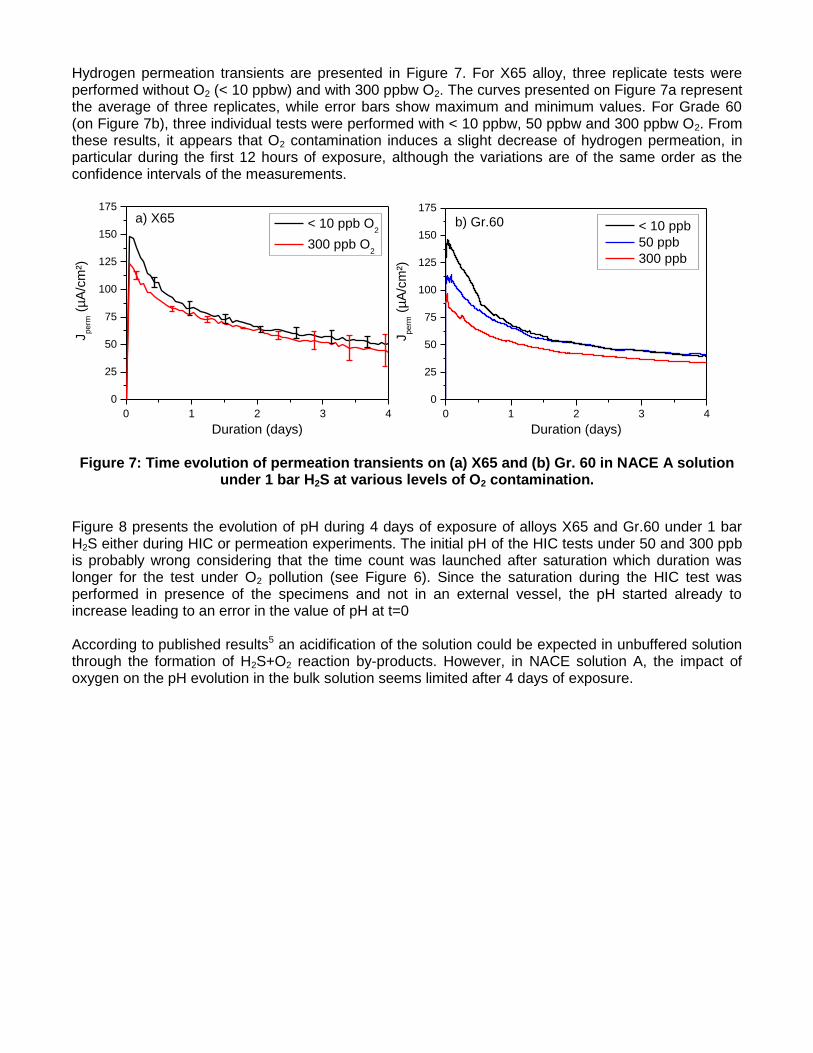
Hydrogen permeation transients are presented in Figure 7. For X65 alloy, three replicate tests were performed without O2 (< 10 ppbw) and with 300 ppbw O2. The curves presented on Figure 7a represent the average of three replicates, while error bars show maximum and minimum values. For Grade 60 (on Figure 7b), three individual tests were performed with < 10 ppbw, 50 ppbw and 300 ppbw O2. From these results, it appears that O2 contamination induces a slight decrease of hydrogen permeation, in particular during the first 12 hours of exposure, although the variations are of the same order as the confidence intervals of the measurements.
0 1 2 3 4
0
25
50
75
100
125
150
175
Jperm
(µ
A/c
m²)
Duration (days)
< 10 ppb O2
300 ppb O2
a) X65
0 1 2 3 4
0
25
50
75
100
125
150
175
< 10 ppb
50 ppb
300 ppb
Jperm
(µ
A/c
m²)
Duration (days)
b) Gr.60
Figure 7: Time evolution of permeation transients on (a) X65 and (b) Gr. 60 in NACE A solution
under 1 bar H2S at various levels of O2 contamination.
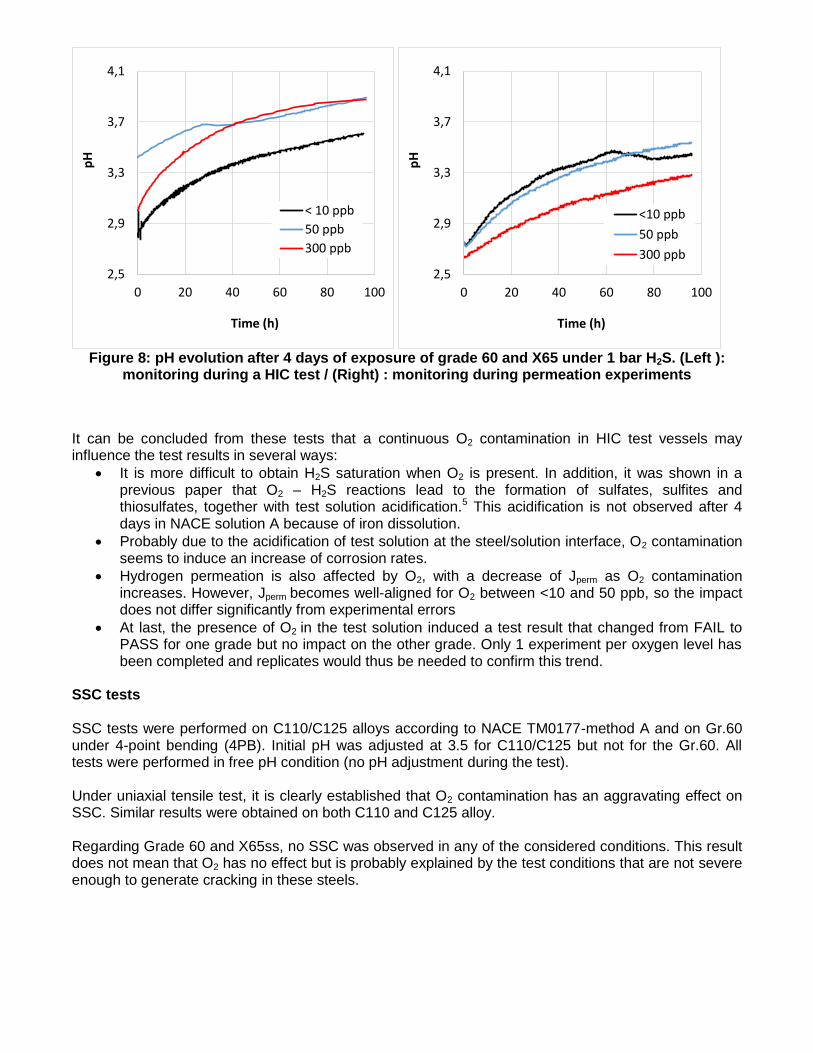
Figure 8 presents the evolution of pH during 4 days of exposure of alloys X65 and Gr.60 under 1 bar H2S either during HIC or permeation experiments. The initial pH of the HIC tests under 50 and 300 ppb is probably wrong considering that the time count was launched after saturation which duration was longer for the test under O2 pollution (see Figure 6). Since the saturation during the HIC test was performed in presence of the specimens and not in an external vessel, the pH started already to increase leading to an error in the value of pH at t=0 According to published results5 an acidification of the solution could be expected in unbuffered solution through the formation of H2S+O2 reaction by-products. However, in NACE solution A, the impact of oxygen on the pH evolution in the bulk solution seems limited after 4 days of exposure.
Figure 8: pH evolution after 4 days of exposure of grade 60 and X65 under 1 bar H2S. (Left ):
monitoring during a HIC test / (Right) : monitoring during permeation experiments
It can be concluded from these tests that a continuous O2 contamination in HIC test vessels may influence the test results in several ways:
It is more difficult to obtain H2S saturation when O2 is present. In addition, it was shown in a previous paper that O2 – H2S reactions lead to the formation of sulfates, sulfites and thiosulfates, together with test solution acidification.5 This acidification is not observed after 4 days in NACE solution A because of iron dissolution.
Probably due to the acidification of test solution at the steel/solution interface, O2 contamination seems to induce an increase of corrosion rates.
Hydrogen permeation is also affected by O2, with a decrease of Jperm as O2 contamination increases. However, Jperm becomes well-aligned for O2 between <10 and 50 ppb, so the impact does not differ significantly from experimental errors
At last, the presence of O2 in the test solution induced a test result that changed from FAIL to PASS for one grade but no impact on the other grade. Only 1 experiment per oxygen level has been completed and replicates would thus be needed to confirm this trend.
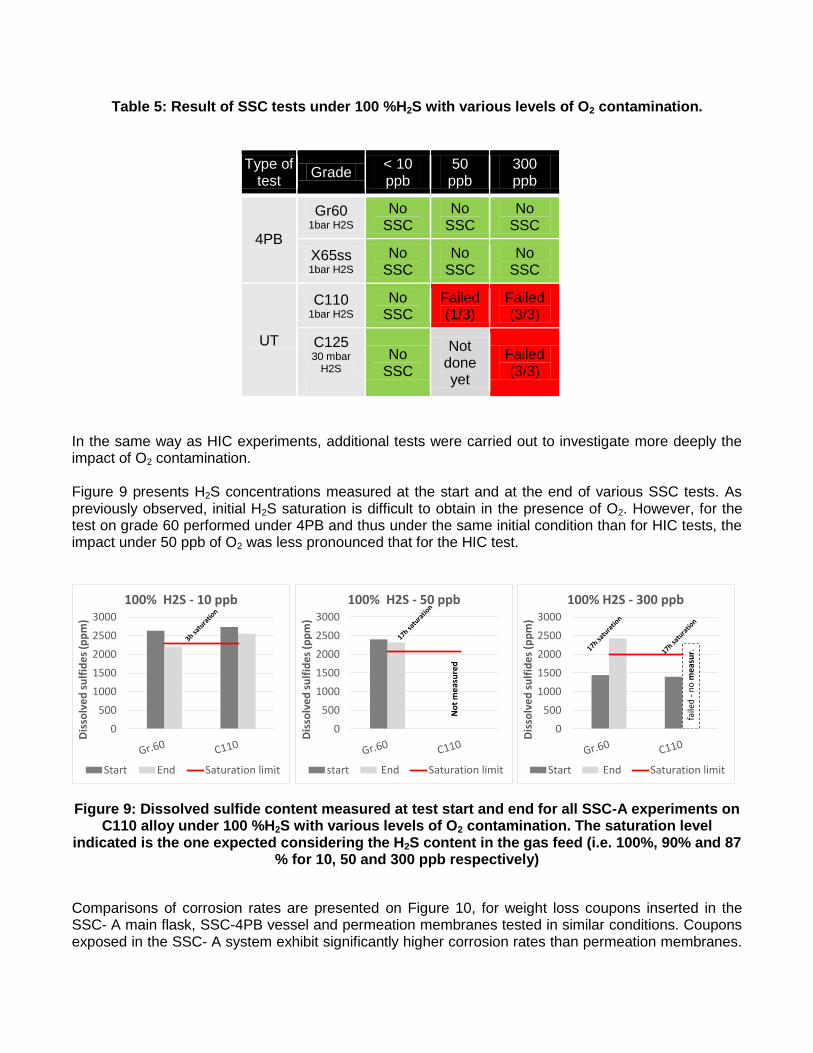
SSC tests SSC tests were performed on C110/C125 alloys according to NACE TM0177-method A and on Gr.60 under 4-point bending (4PB). Initial pH was adjusted at 3.5 for C110/C125 but not for the Gr.60. All tests were performed in free pH condition (no pH adjustment during the test). Under uniaxial tensile test, it is clearly established that O2 contamination has an aggravating effect on SSC. Similar results were obtained on both C110 and C125 alloy. Regarding Grade 60 and X65ss, no SSC was observed in any of the considered conditions. This result does not mean that O2 has no effect but is probably explained by the test conditions that are not severe enough to generate cracking in these steels.
2,5
2,9
3,3
3,7
4,1
0 20 40 60 80 100
pH
Time (h)
< 10 ppb
50 ppb
300 ppb
2,5
2,9
3,3
3,7
4,1
0 20 40 60 80 100
pH
Time (h)
<10 ppb
50 ppb
300 ppb
Table 5: Result of SSC tests under 100 %H2S with various levels of O2 contamination.
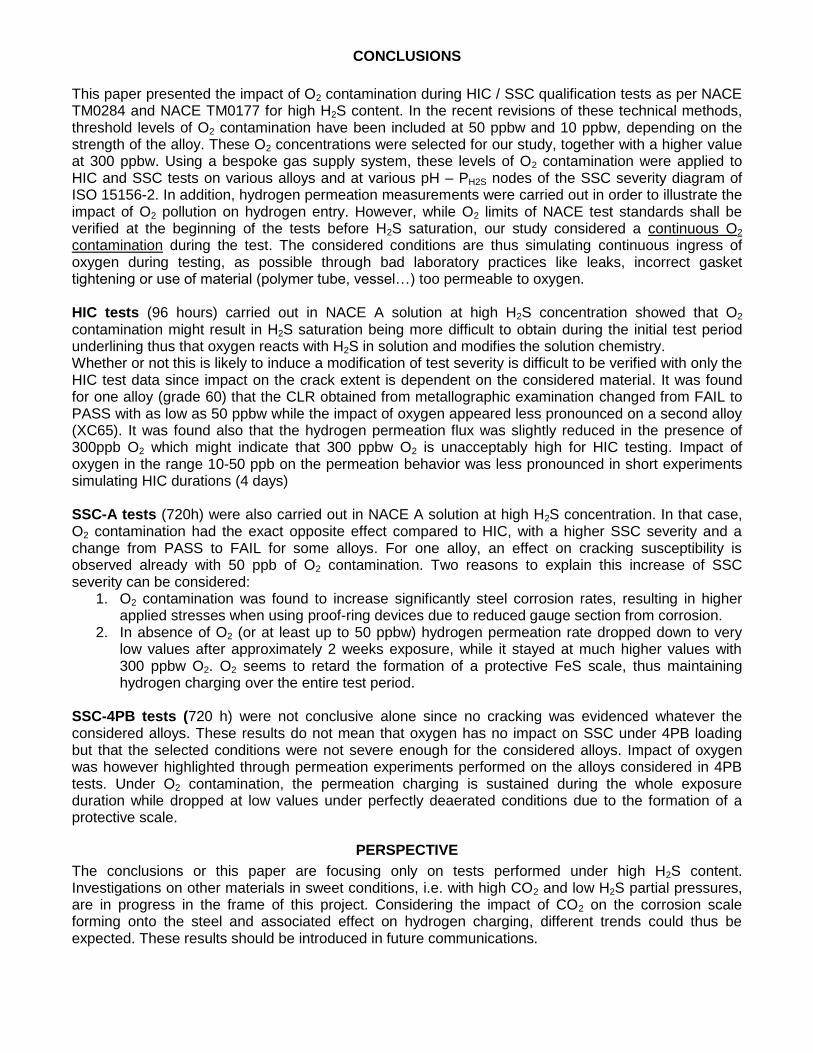
In the same way as HIC experiments, additional tests were carried out to investigate more deeply the impact of O2 contamination. Figure 9 presents H2S concentrations measured at the start and at the end of various SSC tests. As previously observed, initial H2S saturation is difficult to obtain in the presence of O2. However, for the test on grade 60 performed under 4PB and thus under the same initial condition than for HIC tests, the impact under 50 ppb of O2 was less pronounced that for the HIC test.
Figure 9: Dissolved sulfide content measured at test start and end for all SSC-A experiments on
C110 alloy under 100 %H2S with various levels of O2 contamination. The saturation level indicated is the one expected considering the H2S content in the gas feed (i.e. 100%, 90% and 87
% for 10, 50 and 300 ppb respectively)
Comparisons of corrosion rates are presented on Figure 10, for weight loss coupons inserted in the SSC- A main flask, SSC-4PB vessel and permeation membranes tested in similar conditions. Coupons exposed in the SSC- A system exhibit significantly higher corrosion rates than permeation membranes.
0
500
1000
1500
2000
2500
3000
Dis
solv
ed
su
lfid
es
(pp
m)
100% H2S - 10 ppb
Start End Saturation limit
0
500
1000
1500
2000
2500
3000
Dis
solv
ed
su
lfid
es
(pp
m)
100% H2S - 50 ppb
start End Saturation limit
No
t m
eas
ure
d
0
500
1000
1500
2000
2500
3000
Dis
solv
ed
su
lfid
es
(pp
m)
100% H2S - 300 ppb
Start End Saturation limit
faile
d -
no
me
asu
r.
Type of test
Grade < 10 ppb
50 ppb
300 ppb
4PB
Gr60 1bar H2S
No SSC
No SSC
No SSC
X65ss 1bar H2S
No SSC
No SSC
No SSC
UT
C110 1bar H2S
No SSC
Failed (1/3)
Failed (3/3)
C125 30 mbar
H2S
No SSC
Not done yet
Failed (3/3)
The difference may be related to the higher V/S ratio for SSC-A tests (i.e. 250 mL/cm² vs 28 mL/cm²), as well as to test solution circulation. However, it is also quite clear that O2 contamination significantly increases the corrosion rate, as already inferred from HIC exposures. This increase of corrosion rate results in an increase of the applied stress (due to reduction in the gauge diameter from corrosion) when using a proof ring device, which might be one of the reasons for the higher SSC susceptibility.
Figure 10: Weight-loss corrosion rates of C110 (100%H2S)/C125 (3%H2S), Gr.60 (100%H2S) and
X65ss (100%H2S) after 1 month exposure with various levels of O2 contamination.
In addition to SSC-A and weight-loss measurements, hydrogen permeation tests were also performed in similar conditions of O2 contamination. Time evolution of hydrogen permeation current density through C110 membranes are gathered on Figure 11.
0 5 10 15 20 25 30
0
20
40
60
80
< 10 ppb O2
50 ppb O2
300 ppb O2
Jp
erm
(µ
A/c
m²)
Duration (days)
Figure 11: Time evolution of hydrogen permeation rate through C110 membranes exposed to NACE A solution under 100% H2S with various levels of O2 contamination.
0
500
1000
1500
2000
2500
3000
X65ss Gr.60 C110 C125
Vco
rr (
um
/yea
r)
100% H2S - SSC
10 ppb 50 ppb 300 ppb
0
500
1000
1500
2000
2500
3000
X65ss Gr.60 C110
Vco
rr (
um
/yea
r)
100% H2S - permeation
10 ppb 50 ppb 300 ppb
A clear impact of O2 contamination at 300 ppbw is seen after approximately 2 weeks exposure. Indeed, when the test is performed without O2, the hydrogen permeation rate vanishes. After 20 days the permeation flux is almost negligible. This behavior is clearly associated with the build-up of a protective iron sulfide layer, as established in another study using EIS measurements at the entry face in parallel to permeation measurements8. On the contrary, O2 contamination (300 ppb) seems to prevent or retard the formation of this protective scale, resulting in higher corrosion rates and also higher H-permeation fluxes. Similar trends were observed on the X65ss alloy. A shown in Figure 12, Grade 60 exhibits a less pronounced decrease of permeation rate for the test without O2 contamination (< 10 ppb). It is also observed that this decrease happens after longer exposure than previously seen for C110 (17 days instead of 10 days). In presence of O2 at levels of 50 ppb and 300 ppb, the drop of permeation current density is not observed. Compared to the results on C110, the impact of O2 contamination on hydrogen permeation appears to be lower. This results was obtained in a reproducible manner and highlights that effect of oxygen contamination is strongly dependent on the steel considered.
0 5 10 15 20 25 30
0
50
100
150 < 10 ppb
50 ppb
300 ppb
Jp
erm
(µ
A/c
m²)
Duration (days) Figure 12: : Time evolution of hydrogen permeation rate through Grade 60 membranes exposed
to NACE A solution under 100% H2S with various levels of O2 contamination.
It can be concluded from these tests that a continuous O2 contamination in SSC-A test vessels may influence the test results in several ways:
As already observed for HIC tests, it is more difficult to obtain H2S saturation when O2 is present.
It is also confirmed that O2 contamination induces a significant increase of corrosion rates measured after 1 month exposure. This increase of corrosion rate results in variations in effective stress applied by the proof ring device, which could explain the higher SSC susceptibility at high O2 contents.
Hydrogen permeation is also affected by O2 contamination and, more especially, at long exposures. With low O2 contamination (50 ppbw or below), permeation rate nearly vanishes, due to the build-up of a highly protective scale. With higher levels of O2 contamination, hydrogen permeation was maintained at higher values, also resulting in more severe SSC conditions.
As inferred from the analysis of corrosion and permeation results, O2 contamination was seen to induce higher SSC susceptibility. The threshold for which test result was changed from PASS to FAIL was found to lie between 50 ppbw and 300 ppbw O2.
CONCLUSIONS
This paper presented the impact of O2 contamination during HIC / SSC qualification tests as per NACE TM0284 and NACE TM0177 for high H2S content. In the recent revisions of these technical methods, threshold levels of O2 contamination have been included at 50 ppbw and 10 ppbw, depending on the strength of the alloy. These O2 concentrations were selected for our study, together with a higher value at 300 ppbw. Using a bespoke gas supply system, these levels of O2 contamination were applied to HIC and SSC tests on various alloys and at various pH – PH2S nodes of the SSC severity diagram of ISO 15156-2. In addition, hydrogen permeation measurements were carried out in order to illustrate the impact of O2 pollution on hydrogen entry. However, while O2 limits of NACE test standards shall be verified at the beginning of the tests before H2S saturation, our study considered a continuous O2 contamination during the test. The considered conditions are thus simulating continuous ingress of oxygen during testing, as possible through bad laboratory practices like leaks, incorrect gasket tightening or use of material (polymer tube, vessel…) too permeable to oxygen. HIC tests (96 hours) carried out in NACE A solution at high H2S concentration showed that O2 contamination might result in H2S saturation being more difficult to obtain during the initial test period underlining thus that oxygen reacts with H2S in solution and modifies the solution chemistry. Whether or not this is likely to induce a modification of test severity is difficult to be verified with only the HIC test data since impact on the crack extent is dependent on the considered material. It was found for one alloy (grade 60) that the CLR obtained from metallographic examination changed from FAIL to PASS with as low as 50 ppbw while the impact of oxygen appeared less pronounced on a second alloy (XC65). It was found also that the hydrogen permeation flux was slightly reduced in the presence of 300ppb O2 which might indicate that 300 ppbw O2 is unacceptably high for HIC testing. Impact of oxygen in the range 10-50 ppb on the permeation behavior was less pronounced in short experiments simulating HIC durations (4 days) SSC-A tests (720h) were also carried out in NACE A solution at high H2S concentration. In that case, O2 contamination had the exact opposite effect compared to HIC, with a higher SSC severity and a change from PASS to FAIL for some alloys. For one alloy, an effect on cracking susceptibility is observed already with 50 ppb of O2 contamination. Two reasons to explain this increase of SSC severity can be considered:
1. O2 contamination was found to increase significantly steel corrosion rates, resulting in higher applied stresses when using proof-ring devices due to reduced gauge section from corrosion.
2. In absence of O2 (or at least up to 50 ppbw) hydrogen permeation rate dropped down to very low values after approximately 2 weeks exposure, while it stayed at much higher values with 300 ppbw O2. O2 seems to retard the formation of a protective FeS scale, thus maintaining hydrogen charging over the entire test period.
SSC-4PB tests (720 h) were not conclusive alone since no cracking was evidenced whatever the considered alloys. These results do not mean that oxygen has no impact on SSC under 4PB loading but that the selected conditions were not severe enough for the considered alloys. Impact of oxygen was however highlighted through permeation experiments performed on the alloys considered in 4PB tests. Under O2 contamination, the permeation charging is sustained during the whole exposure duration while dropped at low values under perfectly deaerated conditions due to the formation of a protective scale.
PERSPECTIVE
The conclusions or this paper are focusing only on tests performed under high H2S content. Investigations on other materials in sweet conditions, i.e. with high CO2 and low H2S partial pressures, are in progress in the frame of this project. Considering the impact of CO2 on the corrosion scale forming onto the steel and associated effect on hydrogen charging, different trends could thus be expected. These results should be introduced in future communications.
A PhD study is also in progress on the same topic but focusing only on pure iron. This work already led to several communications5,8,9,10
ACKNOWLEDGEMENTS
The authors would like to acknowledge the contribution of the consortium of companies whose financial support led to this publication: GE Oil & Gas, Industeel (Arcelor Mittal), Arcelor Mittal Bourg-en-Bresse, SZMF, TechnipFMC, Total and Vallourec.
Alexandre Bonneau is also warmly thanked for his technical contribution to permeation experiments.
REFERENCES
1. “NACE TM0177-2016: Laboratory testing of metals for resistance to sulfide stress cracking and
stress corrosion cracking in H2S environments,” NACE International (2016).
2. “NACE TM0284-2016: Evaluation of pipeline and pressure vessel steels for resistance to hydrogen-
induced cracking,” NACE International (2016).
3. ISO 15156-2:2015, “Petroleum and Natural gas industries - Materials for use in H2S-containing
environments in oil and gas production - Part 2: Cracking resistant carbon and low alloy steels, and
the use of cast iron,” (International Organization for Standardization, 2015).
4. R. Battino, T.R. Rettich, T. Tominaga, Journal of Physical and Chemical Reference Data 12, 2
(1983): p. 163–178.
5. M.D. Deffo Ayagou, C. Mendibide, C. Duret-Thual, J. Kittel, K. Belkhadiri, T.T. Mai Tran, E. Sutter,
B. Tribollet, N. Ferrando, Corrosion Vol.74 (11) (2018) pp.1192-1202
6. M.A.V. Devanathan, Z. Stachurski, Journal of the Electrochemical Society 111, 5 (1964): p. 619–
623.
7. P. Manolatos, M. Jerome, Electrochimica Acta 41, 3 (1996): p. 359–365.
8. M.D. Deffo-Ayagou, J. Kittel, C. Mendibide, C. Duret-Thual, N. Ferrando, E. Sutter, M. Tran, B.
Tribollet, “EIS and hydrogen permeation study of iron and steel exposed to aqueous solution with