Page 1
O2 - The best way to win new customers? Talk to the ones you already have: the story of O2, Chapter 2
Sophie Maunder, Louise Cook, Nadine Young, Bob Udale, Nick Hough and Andrew Cox
Institute of Practitioners in Advertising
Gold, IPA Effectiveness Awards, 2006
Page 2
O2 – The best way to win new customers? Talk to the ones you already have: the story of O2, Chapter 2
INTRODUCTION
This is the story of how O2 took a bold step that changed the rules of the UK mobile airtime market. As all brands were
becoming entangled in an increasingly destructive spiral of directing their marketing efforts to attracting each other's
customers, O2 and its agencies realised that the customers themselves were experiencing this as neglect, and so becoming
disaffected with all the brands.
The solution for O2 was to put the customer firmly at the centre of everything the brand did: customer service, rewards
programmes, and not least, communications. This was not without the risk of losing out, at least in the short term, in the
scramble for acquisitions. But O2 bet on the probability that the first brand to develop a better relationship with its customers
would immediately offer something very appealing to all frustrated mobile users.
And so it proved. Talking to existing customers, with the right messages and in the right tone of voice, turned out to be a more
effective acquisition strategy than the previous 'acquisition-driven' approach. After all, 'acquisition' and 'retention' are not really
different things – the common imperative is making the brand more attractive. And to succeed in one without the other is no
formula for business success.
BACKGROUND
O2 is one of nine mobile operator brands providing mobile airtime services in the UK.
O2 was born in 2002, a relaunch of the former BT Cellnet. Despite initial stock market scepticism, the brand flourished, as
detailed in an earlier IPA Paper1. We take up the story again from the beginning of 2005.
O2's customers divide into four categories; we are chiefly interested here in the first two.
l Prepay customers2. These buy airtime as 'top-ups' when needed. This appeals to people who like to feel in control, and
dislike or cannot commit to regular payments. They account for two-thirds of personal mobile users in the UK, but are
Title: O2 - The best way to win new customers? Talk to the ones you already have: the story of O2, Chapter 2
Author(s): Sophie Maunder, Louise Cook, Nadine Young, Bob Udale, Nick Hough and Andrew Cox
Source: Institute of Practitioners in Advertising
Issue: Gold, IPA Effectiveness Awards, 2006
Agency: Vallance Carruthers Coleman Priest/Zenith Optimedia/Archibald Ingall Stretton/Lambie-Nairn
Authors: Sophie Maunder, Louise Cook, Nadine Young, Bob Udale,Nick Hough and Andrew Cox
Downloaded from warc.com
2
Page 3
generally lighter users so only about one third of the market by value3. (Though there is an important group of high-value
pre-pay users.) Without minimum contracts, pre-pay customers can switch between operators at will.
l Contract customers. These have a minimum contract over a period where they pay a regular monthly amount for an
airtime package. Retailers often provide handsets free or at reduced cost as part of the contract: these in turn are usually
funded by operators' payments to the retailers. This can induce contract customers to switch when their contract expires.
l SME (Small and Medium-sized Enterprises). Small businesses have their own forms of contract, as do...
Corporate (larger businesses)
The business model for O2 can be summarised as follows: profit = user base, times average revenue per user, minus
costs
l User base fluctuates according to net gain or loss of connections, hence the importance of acquisition and retention. A
key measure is 'churn', which is disconnections expressed as a proportion of the user base.
l Average revenue per user (ARPU) is created by levels of usage, and price paid. The trend is for usage to go up while
costs of calls and texts fall. ARPU can be stimulated by new, higher price services. It also reflects success in attracting
and retaining higher value users.
l Most costs of operating a network are fixed. The main variable costs are marketing: advertising, retailer payments, and
incentives offered to acquire or retain customers.
These are the key metrics determining bottom line growth: churn, net acquisitions, user base, ARPU, and marketing costs.
MARKET SITUATION
By the end of 2004 the UK mobile telephony market was changing.
l With penetration levelling around 74% (Europe's highest)4, it was no longer possible to grow by attracting new category
users.
l The number of brands in the market had increased. As well as five network operators – O2, 3, Orange, T-Mobile, and
Vodafone – there were now four Mobile Virtual Network Operators (MVNOs)5: Virgin, easyMobile, Tescomobile, and
fresh6.
l Functional variations between most networks, such as geographical coverage, once important, were now less significant.
Competitive parameters had become price, service, and brand affinity.
l One major factor for buyers was the appeal of a new handset. Both handset manufacturers and retailers were effectively
rupturing the network-customer relationship by actively advertising handsets and repackaging airtime deals. This
increased buyer power and forced operators to increase payments to retailers7.
Operators were driven into a spiral of advertising and promotional deals to acquire new customers, even though increasingly
this was merely replacing those lost to competitors.
Downloaded from warc.com
3
Page 4
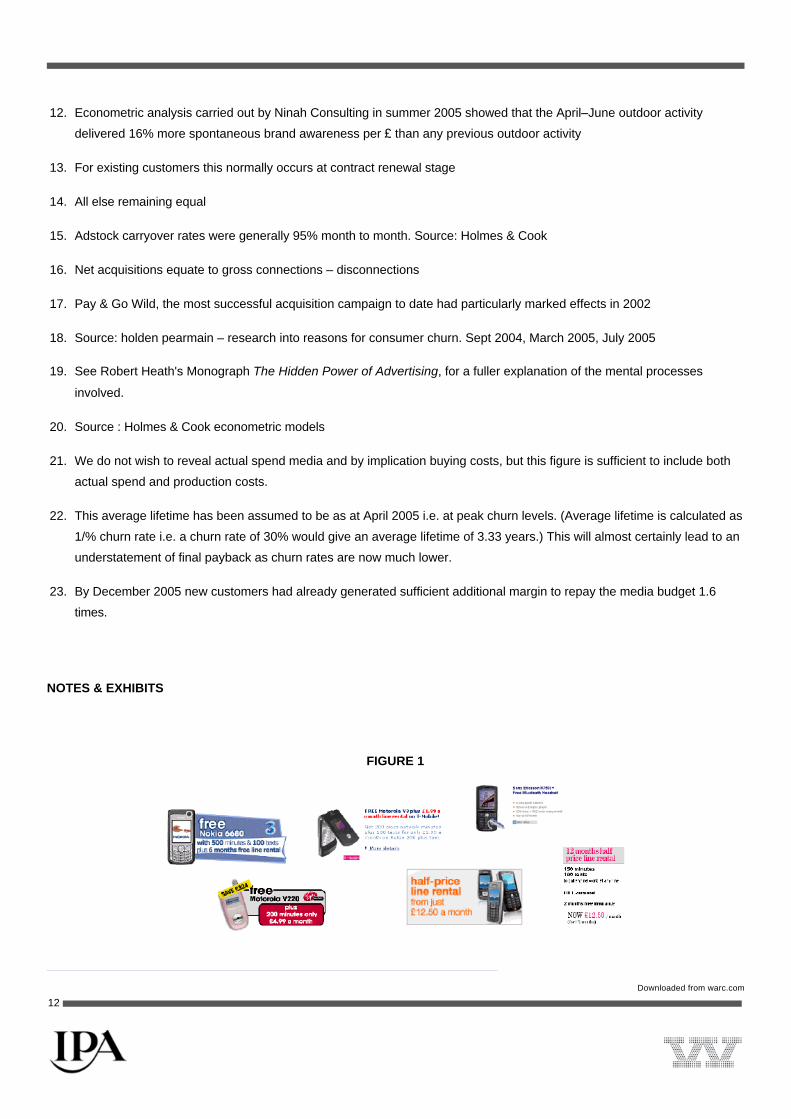
Mobile users found themselves rewarded, often significantly, for changing network, but not for loyalty. Unintentionally, the
market was creating a system for eroding brand loyalty (see Figure 1).
This was not good for the operators, and not even much liked by customers. While they could obtain discounts, this was at the
cost and inconvenience of frequently reviewing complex offers and changing operator. Brand affinity research in 2004 showed
that operators were seen as interchangeable, and none inspired very positive feelings in the customer. Customer satisfaction
was sliding for all networks (see Figure 2).
Meanwhile the operators were eroding their own margins, paying money to retailers that could have been invested in their own
service.
All this led to increased churn and higher acquisition costs. During 2004, O2's churn rose from 30 to 35%8, a signal that the
conventional market strategy was broken (see Figure 3).
The same factors affected all operators, not just O2. But the market looked over-supplied, and some analysts regarded O2 as
the most vulnerable. Just before the new campaign broke, one opinioned:
'If there is to be a casualty, I think it's very likely that it would be O2. Even hiring 2000 new customer service staff
and recognising the need for retention and superlative service in a supersaturated market is not going to be enough
to save it if the market decides it doesn't need a fifth player'.9
Nine months later, as we shall see, the 'fifth player' would be the biggest and strongest brand in the UK market!
THE NEW STRATEGY
But what was to be done? The pressure to attract new customers, even (or especially) if largely refilling a leaking bucket, was
a difficult treadmill to step off. By simply cutting acquisition programmes and substituting 'loyalty' deals, a brand would risk
losing share as other operators continued to offer 'jam today' rather than 'jam tomorrow'. To avoid this, it was necessary to
address the issues that allowed the market to become so deal driven in the first place.
Consumer research showed that the promotional wars were exacerbating one fundamental problem: people saw mobile
operators as all the same, without positive emotional attachment to any. People believed operators were poor on service, and
neglected their existing customers, only offering deals to new ones. They felt ignored, and were often happy to 'punish'
operators by switching.
'I use the phone, they send me a bill'
'You shouldn't have to threaten them before they offer you something'
'Let me know they know I'm out there!'
The one positive insight, however, was that mobile users genuinely wanted a brand that they really could trust and stay with. If
one existed.
'I want to be treated as a person not a number'
'If I knew I was getting value for money I would just leave well alone.'
Downloaded from warc.com
4
Page 5
(Source: brandaffinity)
O2 had made a good start in creating a relationship with its customers10, but the focus on acquisitions threatened to erode
this. Failing to reward existing customers was important not just practically, but at a deeply symbolic level: it said 'we don't
really care about you.' It was this underlying message that needed to be changed.
And if O2 could be seen as the brand that really put its own customers first, should this not also be effective in attracting the
alienated users of other operators?
The marketing programme for 2005 therefore started from a deep commitment by O2 to its own customers, to be backed up by
deeds as well as words. So there were three aspects to the strategy:
l Operational improvements in service. These included hiring an extra 2000 customer service staff, new training
programmes, improved systems, and realigning costs to areas customers would value. This decisively implemented
programme made a noticeable difference in customers' experience during 2005, and internal surveys showed big
improvements in staff attitudes and competences.11
l A shift in rewards so that 'loyalty', not defection, was rewarded: breaking market convention by offering the same deals
to existing customers as to new customers. Pre-pay customers were offered '10% of top ups back every three months'.
Contract customers were offered '50% extra airtime on your bundle for life' when renewing a contract exclusively through
O2. (Later in the year another promotion, 'Treats', offered various extras such as free text bundles.) These were 'great
value, no catch offers' to the customer, but as long as they encouraged incremental usage represented no cost to O2.
l Communicating the new customer strategy and the rewards programmes. O2 could not afford to wait for the
marketplace to make sense of its new behaviour – O2 needed to communicate its new commitment to the customer
quickly and openly, in a way that would earn results.
THE COMMUNICATIONS CAMPAIGN
Since launch, O2 had created a consistent and distinctive visual identity, a stylised universe based around blue and a stream
of bubbles (O2 is the chemical symbol for oxygen). This evokes freedom, clarity, and fresh air; O2 advertising feels calm and
serene, the antithesis to clutter and chaos, a contrast to the often frenetic world around mobile phones (it never shows hassled
people talking on mobiles).
Emotional attachment to a brand is strongly enhanced by such non-rational, non verbal communication (Heath, 2002). Orange
had used a powerful visual identity in its launch years, but later lost this clarity and consistency. O2 would not make this
mistake. But it was necessary to refresh the identity, and make it different enough to carry a set of messages about the new
rewards and positioning, now for the first time speaking directly to existing customers.
The creative solution from VCCP was 'O2: A World That Revolves Around You': visualising the customer both as the centre of
their own, personal communications network, and as the centre of O2's concern and attention.
The idea of 'world' led to an image of planets in the evening sky, echoing the existing palette of bubbles and blueness, as
created by Lambie-Nairn. Peaceful, otherworldly music emphasised that O2 had created a new kind of mobile phone world,
one removed from the brash, deal-driven perceptions of the public.
Downloaded from warc.com
5
Page 6
Past O2 advertising, while visually consistent, had always been planned as discrete one to two month campaigns. Now, Zenith
proposed a unified campaign which would run for six months on the same theme, while carrying specific promotional
messages aimed at different target audiences: 10% of Top Ups for Pay & Go customers, 50% extra for life for Contract, and
with a service message (One Call Ownership) for SMEs (see Figure 4).
The message was presented with strong creative consistency, and broadcast media were designed to work together with
individually targeted 'touchpoints' through archibald ingall stretton, such as text messaging. MMS messages contained visuals
from the TV campaign, offering the rewards as a 'present' to the customer rather than a 'sale'. To accept, they simply had to
text a number back, thus establishing a reciprocal relationship. So O2 spoke to its customers using its own devices as the
media, and straight into their hands (see Figure 5).
At the same time, broadcast media were a highly cost-effective way of addressing 16 million existing O2 customers. O2's new
positioning had to become public, an open statement of commitment to all its customers, not just a few – and, not just
incidentally, for customers of other networks to hear about too. 40″ TV commercials on the 'loyalty' theme were 'topped and
tailed' with reward messages, while heavy transport advertising, indexed highly against O2 customers, created ubiquity12 (see
Figure 6).
Through 2005, O2's share of voice continued as in previous years to be less than its share of market. The success of the
campaign did not depend on outspending the competition (see Figure 7).
RESULTS
By December 2005, O2, far from losing out on acquisitions, had the largest UK user base of any network – without any loss in
average revenue. A range of brand measures also show it had become the strongest brand.
Short-Term Metrics – Business Results
l Immediate uptake: Responses through SMS were unprecedented: more than 4 million prepay customers, over 50%.
SMS response began even before the outgoing SMS campaign started, but SMS and TV together multiplied the levels of
response, which increased as TV coverage and frequency were built over the period of the campaign. More than two
hundred thousand contract customers have already taken-up 50% extra13.
l Churn: O2's churn fell, while increasing for all major competitors. By the end of 2005 O2's churn was the second lowest
(see Figure 8).
Churn was modelled separately for prepay and contract groups. The models show that by December 2005, prepay churn had
reduced by 15 percentage points (more than a third) with contract churn falling 4 percentage points14 (see Figure 9). In both
groups, churn responded to prepay and contract messages equally (see Figure 10). High adstock carryover15 suggests these
effects should be long lasting.
Figure 11 shows the results of using the models to simulate overall O2 churn without the new strategy.
l Net acquisitions: Despite switching the focus of communication away from acquisitions, O2's net acquisitions increased
faster than competitors' (see Figure 12).
Downloaded from warc.com
6
Page 7
By December 2005, O2 had the largest UK user base by a considerable margin (see Figure 13).
Gross connections: Whilst improved retention was a factor in determining net acquisitions16, acquisitions themselves
performed very strongly. Acquisitions (gross connections) were modelled separately for prepay and contract groups (see
Figures 14 and 15). Although addressing existing customers, the campaign had as strong an effect on new prepay
connections as most previous, acquisition-led advertising17. In the case of contract customers, the new campaign generated
twice as many new connections per TVR as any previous O2 advertising, an outstanding result.
l ARPU. While all other operators' ARPU fell, O2's held up well, despite giving more value to the customer (see Figure 16).
This suggests that the customer base retains a similar or enhanced proportion of high value users, and shows (as we
also know from other data) that free airtime promotions led to incremental usage of the network, not reduced revenue.
Summary: In less than a year, O2 has become the leading brand in the UK in terms of business results.
Longer Term Indicators – Brand Affinity
• Consideration
By autumn 2005, O2 was the operator most cited as the “only brand” or “one of a few brands” consumers would consider (see
Figure 17).
• Awareness and image
Millward Brown tracking shows O2 as clearly the strongest brand in the market, taking a spread of ratings into account.
8 summarises a mass of data. The four leading brands are rated by their own customers and by non-customers on five
attributes. Prior to O2's campaign, Orange dominated the “score board”, but post-campaign O2 shows fastest growth on all
scales and highest absolute figure on most. Orange, the biggest spender and historically strong, has lost its leading position
(see Figure 18).
Millward Brown also analyse brand perceptions using their BrandZ affinity pyramids. O2 is on a positive trend and now has the
strongest 'bonding' in the market. Conversion from 'presence' to 'bonding' is especially strong compared with Vodafone and
Orange, brands with longer histories and larger spenders; consider also the gap between O2 and T Mobile, launched at the
same time (see Figure 19).
An exceptional performance in the context of any market:
“Increasing consumers' true loyalty to a brand (as the bonding metric shows) is no easy task, and in doing so, O2
should be commended for its work”
Peter Walshe, Global Brands Director. Millward Brown
• Customer satisfaction
Other surveys of O2's own customers show increased levels of satisfaction and expectation of remaining with O2, especially
the more volatile prepay sector (see Figures 20 and 21).
Downloaded from warc.com
7
Page 8
Qualitative research by Patrick Corr in January 2006 concluded that:
O2 appears to be reaping the benefits of recent brand activity. In particular, existing customers appear more satisfied and
more conscious of the company's efforts to look after them via proactive communication and good deals.
Potential customers also appear more aware of O2's competitiveness and in their words, 'generosity'.
'You get loads with O2'
People have a sense that the momentum is with O2 compared with competitors.
'Loads of people I know are going over to O2'
'O2 is clearly the one in the ascendancy'
• Recommendation
Reichheld (2003) says recommendation is the best predictor of brand affinity, and research suggests recommendation has
become more important in this category recently.18 It is therefore very positive that O2 is the only brand to show a year-on-
year increase in recommendation among both prepay and contract customers, and in prepay now has the highest brand score
at 80% (see Figure 22).
Summary: Brand affinity tends to move slowly, but in less than a year O2 has moved clearly into the lead on a whole range of
brand measures – against competitors with longer histories and bigger budgets.
HOW DID IT WORK? WHAT WAS THE ROLE OF COMMUNICATIONS?
During the period of this campaign O2 became the UK's leading brand on both business and brand measures. But what were
the decisive factors behind this?
The 2005 strategy had three components:
l operational improvements to service
l changed reward structures
l communications
We believe all three elements were essential. We also believe it is pointless to try to factor out in any way the relative
importance of any individual component: all were necessary, and were mutually supportive.
Brand affinity is created as people develop associations and feelings about a brand, based on all the signals they receive
about it. In this sense, all the brand's actions are forms of communication.
People make sense of a brand taking into account (largely unconsciously) such signals as:
l the brand's behaviours – e.g. service, efficiency, rewards, etc
l the brand's verbal or cognitive messages – e.g. claims, messages about rewards
Downloaded from warc.com
8
Page 9
l the brand's non-verbal or emotional messages – e.g. tone of voice (in ads or on the phone), images, music...
If these signals are all consistent, they develop a particular relationship at both a cognitive and emotional level.
Research at the start of 2005 showed most people's relationships with their operators was distant. This was caused by a host
of signals that said 'we don't care about you' – e.g. emphasis on deals, failure to reward existing customers, perceived lack of
touchpoints other than the bill. Failure to communicate is in itself a powerful form of communication, like ignoring a friend in the
street. Operators were in effect blanking out their own customers.
O2's strategy in 2005 changed this by making the customer the centre. They needed to do this through actions, through
symbolic patterns of interaction and reward, but they also needed to talk to the customer, and to do so in the right tone of
voice. Without this overall framing of the new relationship the actions and rewards could easily have been ignored or
misunderstood.
O2's rewards in themselves were not the most motivating in the market. Their power came from being framed within an overall
campaign that gave them symbolic value, as evidence that O2 cared for its customers (see Figure 23).
The cognitive messages – 'O2: A World That Revolves Around You', '50% extra for life' – were mutually supportive, but were
further supported by the way they were communicated. People appreciated the clear and informative nature of O2's
advertising in a confusing market, and believed it gave a better impression of the network (see Figure 24).
The peaceful and consistent visual images and music also sent distinctive emotional signals19. Millward Brown research on
perceptions of the TV ads shows very high scores above norm on the 'passive positive' quadrant - 'Pleasant', 'Soothing', and
'Gentle'. In the frenetic mobile market these were exactly what O2 wanted (see Figure 25).
For the first time, customers felt a mobile operator was talking directly to them, not somebody else. But as well as being heard
by customers, this conversation was also overheard by non-customers! Evidence of how O2 customers were treated proved a
more attractive inducement to join than any direct sales pitch.
We also know from econometrics that prepay customers responded to messages that were aimed at contract customers and
vice versa: all messages were consistent signals about O2's caring approach.
O2's communications made the rewards simple, accessible, and credible. In contrast, a week after the launch of '10% Top Ups
Back', Orange responded with a superficially stronger offer – 50% of top ups back! However, it was hedged round with
conditions, and was interpreted as yet another deal, not quite to be trusted. In isolation, this seems not to have changed
perceptions of Orange.
Finally, more satisfied customers created more positive word of mouth for O2 – an increasingly important factor in choosing a
network.
In all these ways, building a better relationship with O2's existing customers not only improved retention, but also proved,
beyond expectations, to be the most effective and efficient way of attracting new customers from other brands (see Figure 26).
EFFECTS ON THE BUSINESS
Downloaded from warc.com
9
Page 10
By strengthening brand affinity and successfully exiting the battle for acquisitions, O2 could pay less to retailers relative to
competitors, investing instead in service and rewards that benefit its own brand (see Figure 27).
All this has immediately shown up in the bottom line. EBIDTA outperformed the market through 2005 (see Figure 28).
PAYBACK ON THE MEDIA BUDGET
One million disconnections were prevented by this campaign between April and December 200520. The additional margin
resulting just to December 2005 covered 95% of the £36m media expenditure (NMR)21. If those retained customers stay for
just one further year they will contribute sufficient additional margin to repay the media budget 3.8 times.
But this is the tip of the iceberg. The models suggest fairly slow adstock decay, meaning future disconnections should also be
prevented. Over the next 3–4 years, reduced disconnections should repay the media budget 17 times.
But the acquisition effects are the most important. Those new customers joining O2 from April to December 2005 as a result of
the campaign will, over their expected lifetime22, generate sufficient additional margin to repay the media budget 18 times23.
But, as with disconnections, adstock decay rates are slow, so that over the next 3–4 years the total additional margin is
expected to repay the media budget 63 times.
Bringing together retention and acquisition effects produces a payback of 80:1.
Even greater than the 62:1 reported in the 2004 Grand Prix paper!
EFFECTS ON THE VALUE OF THE BUSINESS
The future benefits of this campaign are shown in the gradual improvement in the brand's affinity relative to competitors.
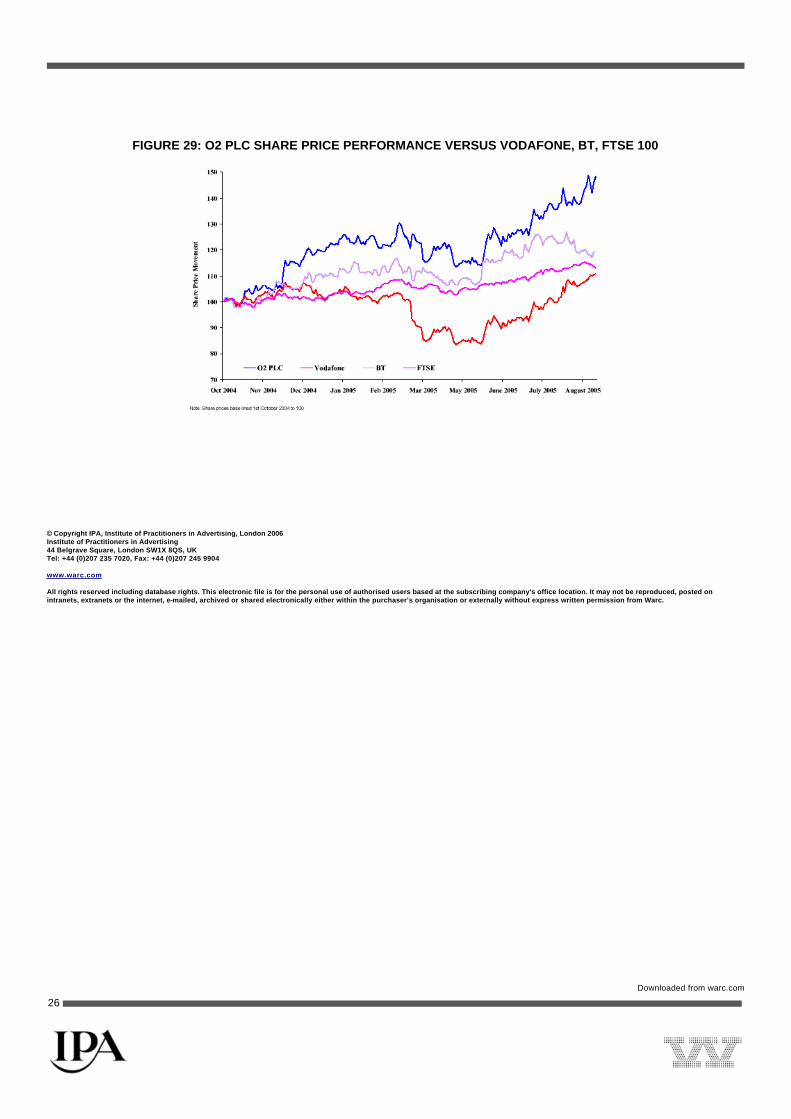
As a business, O2 now looks highly rated. Share price grew throughout 2005 and in November, after several other
approaches, O2's board accepted Telefonica's offer to buy the company for £18 billion (see Figure 29).
“The brand O2 reflects the whole aspirations of the sector, they have the name which is recognised as a symbol of
quality, of innovation, of service and a future” César Alierta – CEO, Telefonica
“O2 came out of the blocks from BT four years ago, with nobody giving it a chance of survival. I think this is the
end of chapter one and the beginning of chapter two. I think under Telefonica now and with their scale, we can
make the next journey even more exciting and I think we may well look back in four years time and say in 2005
we'd only just begun.” (Peter Erskine, CEO, O2 Group)
If there is to be a 'casualty' in this market, it seems unlikely to be O2!
REFERENCES
Reichheld, Frederick F (2003), 'The One Number You Need to Grow', Harvard Business Review, Dec, Vol. 81, Issue 12
Heath, Robert (2002), The Hidden Power of Advertising, WARC
Research Sources
brandaffinity
Downloaded from warc.com
10
Page 11
Millward Brown
TNS Prognostics
Ofcom
Reflect – O2 internal staff survey
NMR
Holmes and Cook
Internal O2 connections data and competitive estimates
Special Thanks
To Millward Brown International for their help and patience.
ENDNOTES
1. It only works when it all works, IPA Effectiveness Awards Grand Prix Winner 2004 – Advertising Works 13
2. O2's pre-pay scheme is called Pay & Go™
3. Source: O2, Ofcom
4. Source: O2 internal and external market research estimates
5. MVNO's pay to use the 5 network operators' networks e.g. Virgin uses the T-Mobile network, Tesco uses the O2 network.
(N.B. all figures in this paper are for O2 only and do not include Tesco's use of the O2 network.)
6. From Carphone Warehouse
7. For example, a package at Carphone Warehouse might offer a Nokia handset and a Vodafone contract, with other
operators excluded.
8. This is 12 month blended rolling churn – the standard industry reporting measure. It is a 12 month rolling average over all
consumer types
9. Sara Harris of Strategy Analytics, quoted in Marketing Week, March 31, 2005.
10. See previous IPA entry from 2004
11. Staff feel more confident about explaining O2's aims (4 point movement from 67 in Oct 2004 to 71 in Oct 2005) and see
O2 as more successfully adapting to market changes and delivering customer's needs and expectations (10 point move
from 60% in Oct 2004 to 70% in Oct 2005). Source: Internal staff survey. Base: 7800. 1 point move required for statistical
significance.
Downloaded from warc.com
11
Page 12
12. Econometric analysis carried out by Ninah Consulting in summer 2005 showed that the April–June outdoor activity
delivered 16% more spontaneous brand awareness per £ than any previous outdoor activity
13. For existing customers this normally occurs at contract renewal stage
14. All else remaining equal
15. Adstock carryover rates were generally 95% month to month. Source: Holmes & Cook
16. Net acquisitions equate to gross connections – disconnections
17. Pay & Go Wild, the most successful acquisition campaign to date had particularly marked effects in 2002
18. Source: holden pearmain – research into reasons for consumer churn. Sept 2004, March 2005, July 2005
19. See Robert Heath's Monograph The Hidden Power of Advertising, for a fuller explanation of the mental processes
involved.
20. Source : Holmes & Cook econometric models
21. We do not wish to reveal actual spend media and by implication buying costs, but this figure is sufficient to include both
actual spend and production costs.
22. This average lifetime has been assumed to be as at April 2005 i.e. at peak churn levels. (Average lifetime is calculated as
1/% churn rate i.e. a churn rate of 30% would give an average lifetime of 3.33 years.) This will almost certainly lead to an
understatement of final payback as churn rates are now much lower.
23. By December 2005 new customers had already generated sufficient additional margin to repay the media budget 1.6
times.
NOTES & EXHIBITS
FIGURE 1
Downloaded from warc.com
12
Page 13
FIGURE 2: OVERALL CUSTOMER SATISFACTION SCORES BY MOBILE NETWORK OPERATOR
FIGURE 3: O2 CHURN
FIGURE 4
Downloaded from warc.com
13
Page 14
FIGURE 5: AN EXAMPLE OF THE INTEGRATED TOUCHPOINTS USED FOR O2'S 10% BACK CAMPAIGN
FIGURE 6
Downloaded from warc.com
14
Page 15
FIGURE 7: SHARE OF VOICE BY COMPETITOR
Downloaded from warc.com
15
Page 16
FIGURE 8: O2 AND COMPETITIOR CHURN
FIGURE 9: O2 PREPAY CHURN – ACTUAL CHURN VS PROJECTED CHURN WITHOUT WORLD REVOLVES AROUND
YOU
Downloaded from warc.com
16
Page 17
FIGURE 101: O2 CONSUMER POSTPAY CHURN – ACTUAL CHURN VS. PROJECTED CHURN WITHOUT WORLD
REVOLVES AROUND YOU
FIGURE 11: WHERE O2 WOULD CHURN HAVE BEEN WITHOUT THE CAMPAIGN MODEL SIMULATION
Downloaded from warc.com
17
Page 18
FIGURE 122: TOTAL NET ADDITIONS (000'S CUSTOMERS)
FIGURE 13: TOTAL UK ACTIVE CUSTOMER BASE
Downloaded from warc.com
18
Page 19
FIGURE 14: EFFECT OF WORLD REVOLVES AROUND YOU ON O2 PREPAY ACQUISITIONS GROSS CONNECTIONS
(INDEXED)
FIGURE 15: THE EFFECT OF WORLD REVOLVES AROUND YOU ON O2 CONTRACT ACQUISITIONS GROSS
CONNECTIONS (INDEXED)
Downloaded from warc.com
19
Page 20
FIGURE 16: AVERAGE REVENUE PER USER (£ PER CUSTOMER)
FIGURE 17: CONSIDERATION OF LEADING MOBILE PHONE BRANDS – TOP 2 BOX
Downloaded from warc.com
20
Page 21
FIGURE 18
FIGURE 19
Downloaded from warc.com
21
Page 22
FIGURE 20: OVERALL CUSTOMER SATISFACTION SCORES BY MOBILE NETWORK OPERATOR
FIGURE 21: O2 – PREPAY CUSTOMERS – HOW LIKELY IS IT THAT YOU WILL BE A CUSTOMER IN 1 YEAR?
Downloaded from warc.com
22
Page 23
FIGURE 22: LIKELIHOOD TO RECOMMEND – POINTS GAINED OR LOST Q3 2005 (OCT–DEC) VS Q3 2004 (OCT–DEC)
FIGURE 23: OVERALL VIEW OF PROMOTIONS VS. OTHERS YOU HAVE HEARD/SEEN
Downloaded from warc.com
23
Page 24
FIGURE 24: O2 CUSTOMERS' IMPRESSIONS OF O2'S ABOVE THE LINE ADVERTISING
FIGURE 25: MILLWARD BROWN PASSIVE POSITIVE ENGAGEMENT SCORES – O2 EXECUTIONS VS. STUDY NORM
Downloaded from warc.com
24
Page 25
FIGURE 26
FIGURE 27: RANK OUT OF TOP 4 NETWORK OPERATORS IN TERMS OF THIRD PARTY RETAIL COMMISSION
PAYMENTS. RANK 1 SPENDS MOST
FIGURE 28: AVERAGE OF QUARTERLY EBITDA GROWTH RATES VS. PREVIOUS YEAR4 Q1 FY05/06 (APR–JUN) TO
Q3 FY05/06 (OCT–DEC)
Downloaded from warc.com
25
Page 26
FIGURE 29: O2 PLC SHARE PRICE PERFORMANCE VERSUS VODAFONE, BT, FTSE 100
© Copyright IPA, Institute of Practitioners in Advertising, London 2006 Institute of Practitioners in Advertising 44 Belgrave Square, London SW1X 8QS, UK Tel: +44 (0)207 235 7020, Fax: +44 (0)207 245 9904 www.warc.com All rights reserved including database rights. This electronic file is for the personal use of authorised users based at the subscribing company's office location. It may not be reproduced, posted on intranets, extranets or the internet, e-mailed, archived or shared electronically either within the purchaser’s organisation or externally without express written permission from Warc.
Downloaded from warc.com
26