+ All Categories
Home > Documents > O2k Quality Control 2: Instrumental oxygen background ...

O2k Quality Control 2: Instrumental oxygen background ...

Date post: 08-Dec-2021
Category:
Upload: others
View: 3 times
Download: 0 times
Share this document with a friend
16
Oroboros Instruments High-resolution respirometry Oroboros O2k-Procedures: SOP Mitochondrial Physiology Network 14.06(08):1-16 (2020) Version 08: 2020-04-16 © 20092020 Oroboros Updates: http://wiki.oroboros.at/index.php/MiPNet14.06_Instrumental O2 background O2k Quality Control 2: Instrumental oxygen background correction and accuracy of oxygen flux Fasching M, Gnaiger E Oroboros Instruments High-Resolution Respirometry Schoepfstrasse 18, 6020 Innsbruck, Austria Email:[email protected] www.oroboros.at Section Page 1. Introduction ............................................................................... 2 2. Preparations ............................................................................... 3 2.1. Solutions............................................................................. 3 2.2. Media ................................................................................. 3 2.3. Calibration of oxygen sensors ................................................ 3 2.4. Experimental oxygen concentration ........................................ 3 3. Instrumental O2 background ......................................................... 5 3.1. TIP2k in feedback control mode ............................................. 5 3.2. Manual injections ................................................................. 8 3.3. Data analysis Excel template ................................................. 8 4. Analysis of instrumental background tests ...................................... 9 5. References ................................................................................. 9 Supplement A: O2 background parameters and accuracy of O2 flux....... 1 A1. Oxygen consumption by the polarographic oxygen sensor ........... 1 A2: Accuracy of instrumental background tests.............................. 3 Supplement B: TIP2k in direct control mode ...................................... 4 Supplement C: Further details ......................................................... 6
Transcript

Oroboros Instruments High-resolution respirometry

Oroboros O2k-Procedures: SOP

Mitochondrial Physiology Network 14.06(08):1-16 (2020) Version 08: 2020-04-16 © 2009−2020 Oroboros Updates: http://wiki.oroboros.at/index.php/MiPNet14.06_Instrumental O2 background

O2k Quality Control 2:

Instrumental oxygen background correction

and accuracy of oxygen

flux

Fasching M, Gnaiger E

Oroboros Instruments High-Resolution Respirometry Schoepfstrasse 18, 6020 Innsbruck, Austria Email:[email protected] www.oroboros.at

Section Page

1. Introduction ............................................................................... 2

2. Preparations ............................................................................... 3

2.1. Solutions............................................................................. 3

2.2. Media ................................................................................. 3

2.3. Calibration of oxygen sensors ................................................ 3

2.4. Experimental oxygen concentration ........................................ 3

3. Instrumental O2 background ......................................................... 5

3.1. TIP2k in feedback control mode ............................................. 5

3.2. Manual injections ................................................................. 8

3.3. Data analysis Excel template ................................................. 8

4. Analysis of instrumental background tests ...................................... 9

5. References ................................................................................. 9

Supplement A: O2 background parameters and accuracy of O2 flux ....... 1

A1. Oxygen consumption by the polarographic oxygen sensor ........... 1

A2: Accuracy of instrumental background tests .............................. 3

Supplement B: TIP2k in direct control mode ...................................... 4

Supplement C: Further details ......................................................... 6

MiPNet14.06 Instrumental O2 background 2

Oroboros Instruments Mitochondria and cell research

Summary: Correction for instrumental background oxygen flux is a

standard in high-resolution respirometry, automatically performed by DatLab. Background measurements provide a quality control of instrument

function. In the Oroboros O2k, background corrections are usually within a few % of experimental flux over the entire experimental oxygen range. At

minimum activities, however, even the small background effects become significant and require compliance to standard operating procedures (O2k-

SOP) described in this chapter as part of the MitoFit Quality Control System. This is part two of O2k Quality Control (DatLab 7).

1. Introduction

For calibration of the polarographic oxygen sensor (POS) and measurement of instrumental background oxygen consumption, incubation medium

without biological sample is added into the O2k-Chamber at experimental conditions. In a closed chamber under these conditions, ideally oxygen

concentration remains constant. In practice,

however, instrumental

background effects are caused by backdiffusion into

the chamber at low oxygen pressure, oxygen diffusion

out of the chamber at elevated oxygen levels, and oxygen consumption by the polarographic

oxygen sensor (OroboPOS). Determination of instrumental background constitutes an important standard operating procedure (SOP) in high-

resolution respirometry (HRR). Instrumental background oxygen flux is (i) minimized in the Oroboros O2k by instrumental design and selection of

appropriate materials. In addition, (ii) instrumental background is routinely tested, and (iii) background correction of oxygen flux is applied

automatically by DatLab. As an important component of quality control, instrumental

background is monitored at regular intervals during a project and

documented as a standard operating procedure to exclude instrumental artefacts. This SOP is implemented even in cases of high experimental

oxygen fluxes when background correction is merely within 1%-5% of flux. Taken together, the concept of instrumental background oxygen flux and

appropriate corrections are indispensible components of Quality Control in HRR. To obtain accurate parameters for instrumental O2 background

correction, instrumental tests are performed in which several oxygen levels are set in the closed O2k-Chamber related to the experimental oxygen

regime, and background oxygen flux is measured as a function of oxygen concentration.

MiPNet14.06 Instrumental O2 background 3

Oroboros Instruments High-resolution respirometry

2. Preparations

2.1. Solutions

Dithionite solution (30 mM or 10 mM, in phosphate buffer)*

Component Final conc. FW Addition to 10 mL final

Na2S2O4 30 mM 174.1 0.051 g

Na2S2O4 10 mM 174.1 0.017 g

Phosphate buffer (50 mM, pH 8)

Final conc. Component FW Addition to 1 liter final

Base 44 mM Na2HPO4 ∙ 2 H2O 178.0 7.83 g

Acid 5.9 mM NaH2PO4 ∙ H2O 138.0 0.81 g

Dithionite solution is prepared freshly and stored on ice

immediately before use. Add 51 mg dry dithionite into a volumetric glass flask. Add phosphate buffer up to 10 mL

final. Keep the flask closed. Minimize air exposure.

*Note: Up to Version MiPNet14.06(03) a dithionite concentration of 10 mM

was used. Instrumental O2 background experiments showed

identical results with 10 and 30 mM dithionite stocks. However,

when using new commercial bottles of dithionite 30 mM may be a

too high concentration, in which case we recommend using 10 mM

dithionite.

2.2. Media

The dithionite background experiment has to be performed in MiR05, MiR05-Kit or MiR06 (add catalase to

obtain MiR06) In many other media (including cell

culture media and unbuffered water) side reactions lead to additional oxygen fluxes which interfere with the

instrumental background oxygen flux. As an alternative, a strongly buffered alkaline phosphate buffer may be

used (>100 mM; >pH 8). Instrumental O2 background parameters obtained in MiR06 can be used for

experiments with other media (e.g. cell culture media).

2.3. Calibration of oxygen sensors

O2k-SOP:

» MiPNet06.03 POS-Calibration-SOP » http://wiki.oroboros.at/index.php/Run_DL-Protocol/Set_O2_limit

2.4. Experimental oxygen concentration

Graded levels of oxygen can be achieved in instrumental

background tests with the aid of a gas phase included in

the O2k-Chamber, replacing air with nitrogen or argon (to decrease oxygen levels), or with oxygen (to increase

oxygen levels). Mass transfer between gas and liquid phases proceeds until the targeted oxygen level is

reached. This process is stopped when the gas phase is

MiPNet14.06 Instrumental O2 background 4

Oroboros Instruments Mitochondria and cell research

eliminated by closing the chamber (Gnaiger et al 1995;

Gnaiger 2008). The main disadvantage of intermittently opening

the O2k-Chamber for application of a gas phase during background experiments is the risk of inclusion of gas

bubbles when closing the chamber. Elimination of gas bubbles is more difficult in O2k-MultiSensor ISE

applications, when electrodes are introduced through inlets in the stopper. Importantly, in these applications

instrumental background correction is even more

important, since inserted electrodes add oxygen storage capacities and potential leaks.

These problems are avoided in automatic O2 background tests with the TIP2k.

Instrumental background tests should cover the entire experimental oxygen range. Most experiments are

performed at oxygen levels at or below air saturation, but artificially elevated, high oxygen levels are used with

permeabilized fibers.

H2O2: With MiR05, MiR05-Kit MiR06 (add catalase to obtain MiR06) oxygen concentration is easily adjusted by

injecting small amounts of a H2O2 stock solution into the closed chamber. Oxygen levels are increased in steps of

<200 µM (e.g. from air saturation up to 350 µM) to avoid formation of gas bubbles in the medium.

O2 (gas phase): For increasing oxygen concentrations above 400 µM, the preferred approach is

application of a gas phase with a high oxygen content. If a calibration at air

saturation was just performed, there is already an ‘open chamber’, i.e. a

chamber with a gas phase. Insert the stopper, completely closing the

chamber. Siphon off any medium extruded through the stopper capillary.

Then partially open the stopper (arrow 1), insert the stopper-spacer tool (2)

and push down the stopper (3). The gas injection syringe with supplied needle

(4; correct length) and spacer (5) is

filled with oxygen gas. Inject a few mL of oxygen into the gas phase (6),

thereby creating an elevated oxygen pressure above the stirred aqueous medium. Oxygen in

the gas and aqueous phases will start rapidly to equilibrate.

6

1 3

2

5

4

MiPNet14.06 Instrumental O2 background 5

Oroboros Instruments High-resolution respirometry

Observe the oxygen signal in DatLab carefully.

When the targeted oxygen concentration is nearly reached, close the chamber, thereby displacing the gas

phase and stopping the equilibration process. After stabilisation of oxygen flux, the first state of background

flux is recorded, by marking an appropriate section of the oxygen flux (MitoPedia: Marks - DatLab). Further

steps of oxygen levels towards air saturation may be achieved by shortly opening the stopper (again using the

stopper-spacer tool, 2), observing the decline of oxygen

concentration and closing the chamber at the targeted oxygen level. Preferentially, use the TIP2k method

described below.

3. Instrumental O2 background

3.1. TIP2k in feedback control mode

Fill the TIP2k syringes with

the freshly prepared

dithionite solution, rinsing the syringes at least once with the dithionite solution and

taking care to minimize exposure of the dithionite solution to air. Use a large-volume glass syringe and long

needle to fill both TIP2k syringes sequentially. After air calibration close the chamber either directly

(normoxia) or after elevating oxygen levels (hyperoxia). When using the 200 mm³ syringes (with the shorter

needle) the TIP2 is aligned with a mark on top of the O2k to allow a correct position of the TIP2k needles in the

stopper. After closing the chamber, insert the TIP2k needles through the stopper.

TIP2k-Manual:

» MiPNet12.10 TIP2k-manual

TIP2k Setup "BG_Feedback": Instrumental background oxygen flux at air saturation (176 µM; 37 °C, 600 m altitude), 90 µM, 45 µM, 20 µM. Each level was maintained for 20 minutes.

MiPNet14.06 Instrumental O2 background 6

Oroboros Instruments Mitochondria and cell research

The following parameters are used in the TIP2k setup file:

In the DatLab main menu select TIP2k, TIP2k control and BG_Feedback

from the dropdown menu and press Load setup. Start the titration

programme. During operation the TIP2k window may be closed.

The TIP2k programme starts, allowing for a delay of

1200 s (20 min), during which time oxygen flux can stabilize after closing the chamber, providing the first

background level (J°1). Then the first injection starts at 0.25 µL/s. The TIP2k operates now in feedback mode

while oxygen levels decline. The TIP2k stops when an O2 concentration <100 µM is reached, and possibly

overshoots by 10 µM to yield a level of about 90 µM

Line Mode Start injection if oxygen level (left chamber) is

Stop injection if oxygen level (left or right chamber is

Flow Delay Interval Volume

µM µM µL/s s s µL

1 FB >120 <100 0.250 1200 300

2 FB > 60 < 50 0.125 900 300

3 FB > 30 < 23 0.050 900 300

4 D 50 100

MiPNet14.06 Instrumental O2 background 7

Oroboros Instruments High-resolution respirometry

(J°2). The 1200 s interval (20 min) is programmed as a

feedback control time of 300 s plus a delay of 900 s before each subsequent injection at 0.125 µL/s to 50 µM

(J°3) and 0.050 µL/s to 23 µM (J°4). Lowered injection speeds reduce the overshoot to 5 µM and 3 µM.

After recording the last background level (J°4 at 20 µM) a final titration of excess dithionite (100 µL) is

induced in the direct control mode for zero oxygen calibration (R0) of the OroboPOS.

Instrumental O2-background flux for the Oroboros O2k in two experimental oxygen regimes, from air saturation (c. 200 µM) to low-oxygen as applied with

suspensions of isolated mitochondria and cells (open circles, from Gnaiger 2008), and from 450 to 550 µM to air saturation as applied with permeabilized muscle fibers (8 different chambers of four O2k). Volume-specific background oxygen flux

(left) and residuals from the two linear regressions calculated for all chambers. In one of 8 chambers, the initial instrumental background was 22 pmol∙s-1∙mL-1 at

480 µM, which was a non-reproducible outlier and hence not considered in the analysis. Subsequent background fluxes in this chamber (green diamonds) were indistinguishable from those in all other chambers. All O2-background

measurements were pooled for calculation of the general oxygen dependence. Deviation between the near-linear relationships in the two oxygen regimes is due

to a hysteresis effect: After an initial increase of oxygen concentration from air saturation to c. 500 µM, internal oxygen stores become saturated, causing a higher

background flux compared to the extrapolated normoxic (stippled) line. As oxygen is reduced stepwise to air saturation, these oxygen stores become progressively depleted, causing a component of backdiffusion even at air saturation, hence these

background fluxes are below the level of oxygen consumption by the POS at air saturation (open circles).

MiPNet14.06 Instrumental O2 background 8

Oroboros Instruments Mitochondria and cell research

3.2. Manual injections

Use a Hamilton microsyringe for manually injecting the dithionite solution.

The effective concentration of dithionite decreases in the stock solution over time due to autoxidation when

small amounts of oxygen leak into the solution. The potency of the solution can be tested by injecting a small

volume (2.5 µL) into the closed oxygraph chamber and observing the change in oxygen concentration. The

stoichiometric correction factor, SF, expresses the

deviation of the effective dithionite concentration from the dithionite concentration added initially,

422 OSNainject

chamberO2

O2

O2

calc)(

eff)(

cv

Vc

n

nSF

=

= (1)

SF Stoichiometric correction factor for dithionite concentration ΔnO2(eff) Effective change of the amount of oxygen [µmol] ΔnO2(calc) Calculated change of the amount of oxygen [µmol]

ΔcO2 Effective drop in oxygen concentration [µmol dm-3; µmol L-1] Vchamber Chamber volume [cm3; mL]

vinject Injected volume of dithionite solution [mm3; µL] cNa2S2O4 Dithionite concentration in the initial stock solution (approx.

19.8 mmol dm-3 considering a complete consumption of

oxygen originally dissolved in the aqueous solvent), irrespective of further oxygen uptake by the effectively anoxic

solution.

vinject is the volume injected to achieve a specific drop in oxygen concentration:

422 OSNa

chamberO2inject

cSF

Vcv

= (2)

A typical value of SF is 0.7 in a freshly prepared stock solution. Since no accurate oxygen concentrations have

to be achieved for determination of an instrumental background, a value of 0.7 can be used for most

purposes. When using the TIP2k in Feedback Control Mode, calculation of SF is not necessary.

3.3. Data analysis Excel template

• An Excel template is provided for analyzing instrumental

background experiments in DatLab 7.4. The “Template O2

background.xlsx” is available when running the DatLab 7.4 software (https://wiki.oroboros.at/index.php/Instrumental:_Browse_DL-

Protocols_and_templates).

Use the pull-down menu Protocols and click onInstrumental: Browse DL-

Protocols and templates to open a folder with the library of instrumental

DL-protocols and the “Template O2 background.xlsx” file.

MiPNet14.06 Instrumental O2 background 9

Oroboros Instruments High-resolution respirometry

• If you did not apply a finally evaluated O2 background correction to your experimental DatLab file, you can edit the O2 background

parameters directly in the ‘O2 analysis template DL7.4’ provided with DatLab7.4 software

(https://wiki.oroboros.at/index.php/SUIT:_Browse_DL-Protocols_and_templates):

» MiPNet24.06_Oxygen_flux_analysis_DatLab_7.4

4. Analysis of instrumental background tests » MiPNet08.09, MiPNet10.04

5. References

Gnaiger E (2008) Polarographic oxygen sensors, the oxygraph and high-resolution

respirometry to assess mitochondrial function. In: Mitochondrial dysfunction in drug-induced toxicity (Dykens JA, Will Y, eds) John Wiley:327-52. - »Bioblast link«

Gnaiger E (2001) Bioenergetics at low oxygen: dependence of respiration and phosphorylation on oxygen and adenosine diphosphate supply. Respir Physiol

128:277-97. - »Bioblast link« Gnaiger E, Steinlechner-Maran R, Méndez G, Eberl T, Margreiter R (1995) Control of

mitochondrial and cellular respiration by oxygen. J Bioenerg Biomembr

27:583-96. - »Bioblast link« Doerrier C, Garcia-Souza LF, Krumschnabel G, Wohlfarter Y, Mészáros AT, Gnaiger

E (2018) High-Resolution FluoRespirometry and OXPHOS protocols for human cells, permeabilized fibers from small biopsies of muscle, and isolated mitochondria. Methods Mol Biol 1782:31-70. - »Bioblast link«

MiPNet14.06 Instrumental O2 background 10

Oroboros Instruments Mitochondria and cell research

Acknowledgements

MiPNet14.06 Supplement: Instrumental O2 background S1

Oroboros Instruments High-resolution respirometry

Supplement A: O2 background parameters and

accuracy of O2 flux

A1. Oxygen consumption by the polarographic oxygen sensor

The Clark-type polarographic oxygen sensor (POS) yields an electrical signal while consuming the oxygen which diffuses across the oxygen-permeable

membrane to the cathode. The cathode and anode reactions are, respectively,

O2 + 2 H2O + 4 e- → 4 OH- (3a)

4 Ag → 4 Ag+ + 4 e- (3b)

4 Ag+ + 4 Cl- → 4 AgCl (3b’)

The electric flow (current, Iel [A]) is converted into a voltage (electric potential, Vel [V]) and amplified. In the O2k the gain, FO2,G, can be selected

in DatLab within the O2k setup menu, with values of 1, 2, 4, or 8106 V/A,

where 1 V/µA is the basal gain at a gain setting of 1. The raw signal after

amplification, RO2 [V], is related to the original POS current,

Iel = RO2 FO2,G-1 (4)

Figure A1. Instrumental background oxygen flux, J°O2,

as a function of oxygen concentration, cO2 [µM], in the

O O2k (37 °C; NaCl solution with an oxygen solubility factor of 0.92 relative to pure

water). Measurements in 52 chambers (2 mL volume) of 26

different instruments. In all tests, four oxygen ranges were selected consecutively in

declining order. Each oxygen concentration was maintained

for 20 min, at the end of which time intervals of 200 seconds

(corresponidng to 200 data points at the sampling interval of 1 s) were chosen for

estimating average flux at each corresponding oxygen concentration. Averages and SD were calculated for the intercept, a°, and the slope, b°, by linear regression

for each individual chamber. The full and stippled lines show the linear regression and 99 % confidence intervals calculated through all data points.

RO2 is about 9 V (at air saturation, 37 °C, and a gain of 4106 V/A), and is

thus typically 2.2 µA under these conditions. In the cathode reaction (Eq.

3a), electric flow, Iel [A=Cs-1], is stoichiometrically related to molar oxygen

flow, IO2 [mol O2s-1], through the stoichiometric charge number of the

reaction, e-/O2 = 4, and the Faraday constant, F, i.e. the product of the

elementary charge and the Avogadro constant (F = 96,485.53 Cmol-1; Mills

et al 1993). The oxygen/electric flow ratio is (Gnaiger, 1983),

YO2/e- = (e-/O2 F)-1 = (4 96,485)-1 molC-1 (5)

0 50 100 150 200

-2

-1

0

1

2

3 a° = -2.06 0.39b° = 0.0256 0.0028r ² = 0.93

Oxygen concentration [µM]

Flu

x, J° O

2 [pm

ol.s

-1.m

l-1]

N = 52

MiPNet14.06 Supplement: Instrumental O2 background S2

Oroboros Instruments Mitochondria and cell research

= 2.59106810-6 mol O2C-1

= 2.591 pmol O2s-1µA-1

Oxygen consumption by the POS can be directly measured in the closed

Oxygraph chamber at air saturation (Fig. A1), as volume-specific oxygen flux, JO2° [pmols−1cm−3], and the corresponding theoretical oxygen flux in

Eq.(3a) can be calculated, JO2,POS (Fig. A2),

JO2,POS = (RO2 - RO2,0) YO2/e- FO2,G-1 V-1 (6a)

where RO2,0 is the raw signal at zero oxygen (zero current), and V is the chamber volume of the Oroboros O2k (2 cm3).

Figure A2. Instrumental background oxygen flux, J°O2,

as a function of the theoretical oxygen consumption by the polarogrpahic oxygen sensor

(POS), calculated from the electrical signal (current) as a

function of oxygen concentration (from data in Fig. A1). The line of identity

(dashed) illustrates the full correspondence between

experimental and theoretical oxygen consumption at air saturation (top right) and the

increasing deviation at declining oxygen concentration owing to a linear increase of oxygen backdiffusion.

It is more convenient to relate the theoretical oxygen consumption of the POS to the measured oxygen concentration, cO2 [µM], using the oxygen

calibration factor, FO2,c [µM/V],

JO2,POS = (cO2 FO2,c-1) YO2/e- FO2,G

-1 V-1 (6b)

Combining constants from Eq. 5, at a gain setting of 4 V/µA and a volume of 2 cm3, Eq. 6 is,

JO2,POS = (RO2 - RO2,0) 0.3239 pmols-1cm-3V-1 (6c)

= cO2 FO2,c-1 0.3239 pmols-1cm-3V-1

The full and stippled lines show the linear regression and 99% confidence intervals. On average, signal stability was indicated by apparent oxygen

fluxes close to zero during air calibration, when oxygen concentration is maintained stable by exchange with the gas phase. Average J’O2 amounted

to 0.04 0.14 pmols-1cm-3 (range from –0.28 to 0.25 pmols­1cm-3). To

express signal noise independent of these low levels of signal drift, linear

regressions were calculated through these 200 second sections, and this

drift was subtracted from the concentration before calculating the SD.

0 1 2 3

-2

-1

0

1

2

3

Flu

x, J° O

2 [pm

ol.s

-1.m

l-1]

Expected POS flux, J°O2,POS [pmol.s-1.ml-1]

Line of identity

MiPNet14.06 Supplement: Instrumental O2 background S3

Oroboros Instruments High-resolution respirometry

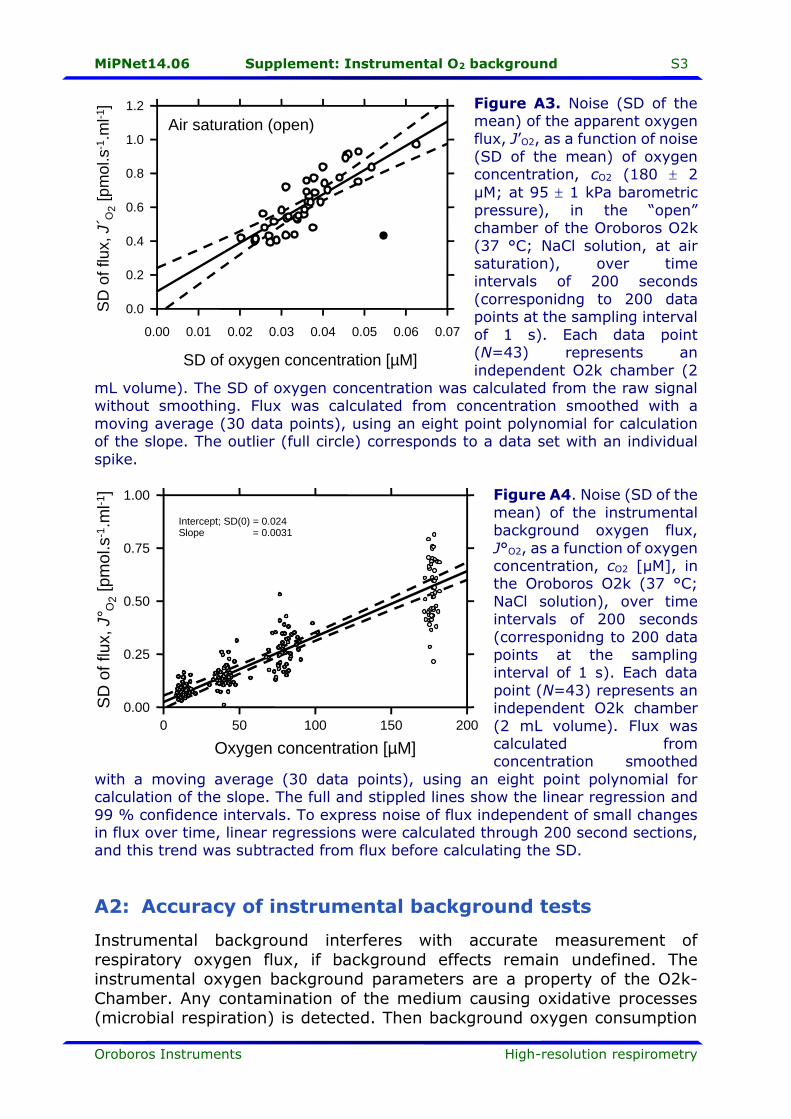
Figure A3. Noise (SD of the mean) of the apparent oxygen flux, J’O2, as a function of noise

(SD of the mean) of oxygen concentration, cO2 (180 2

µM; at 95 1 kPa barometric

pressure), in the “open” chamber of the Oroboros O2k

(37 °C; NaCl solution, at air saturation), over time intervals of 200 seconds

(corresponidng to 200 data points at the sampling interval

of 1 s). Each data point (N=43) represents an

independent O2k chamber (2 mL volume). The SD of oxygen concentration was calculated from the raw signal without smoothing. Flux was calculated from concentration smoothed with a

moving average (30 data points), using an eight point polynomial for calculation of the slope. The outlier (full circle) corresponds to a data set with an individual

spike. Figure A4. Noise (SD of the

mean) of the instrumental background oxygen flux,

J°O2, as a function of oxygen concentration, cO2 [µM], in the Oroboros O2k (37 °C;

NaCl solution), over time intervals of 200 seconds

(corresponidng to 200 data points at the sampling interval of 1 s). Each data

point (N=43) represents an independent O2k chamber

(2 mL volume). Flux was calculated from concentration smoothed

with a moving average (30 data points), using an eight point polynomial for calculation of the slope. The full and stippled lines show the linear regression and

99 % confidence intervals. To express noise of flux independent of small changes in flux over time, linear regressions were calculated through 200 second sections, and this trend was subtracted from flux before calculating the SD.

A2: Accuracy of instrumental background tests

Instrumental background interferes with accurate measurement of

respiratory oxygen flux, if background effects remain undefined. The instrumental oxygen background parameters are a property of the O2k-

Chamber. Any contamination of the medium causing oxidative processes (microbial respiration) is detected. Then background oxygen consumption

0 50 100 150 200

0.00

0.25

0.50

0.75

1.00

Intercept; SD(0) = 0.024Slope = 0.0031

Oxygen concentration [µM]

SD

of flux, J° O

2 [pm

ol.s

-1.m

l-1]

0.00 0.01 0.02 0.03 0.04 0.05 0.06 0.07

0.0

0.2

0.4

0.6

0.8

1.0

1.2

SD of oxygen concentration [µM]

Air saturation (open)

SD

of flux, J´ O

2 [pm

ol.s

-1.m

l-1]

MiPNet14.06 Supplement: Instrumental O2 background S4

Oroboros Instruments Mitochondria and cell research

is a property of a contaminated medium. Otherwise instrumental

background does not depend on the specific medium. Therefore, background parameters obtained in one medium can be used for another

medium in the same chamber. In a series of 52 experimental background determinations, 52 different

O2k-chambers (2 mL volume, 37 °C) were tested (O2k, Series A). The following average conditions applied:

Oxygen concentration at air saturation, cO2* = 179.9 µM Average oxygen concentration at J°1, cO2,1 = 177.2 µM

Oxygen calibration signal at air saturation, RO2,1 = 8.744 V (Gain 4) Oxygen calibration signal at zero oxygen, RO2,0 = 0.033 V (Gain 4)

Oxygen calibration factor, FO2,c = 20.69 µM/V JO2,POS = 0.3239 x 177.2/20.69 = 2.77 pmols-1cm-3

At air saturation in the 2 cm3 chamber, the theoretically expected oxygen

consumption by the sensor is 2.77 pmols-1cm-3, in direct agreement with

the experimental result. At an average flux of 2.64 pmols-1cm-3 (0.35 SD;

N=52; Fig. A1), the ratio between measured and theoretically expected oxygen consumption by the POS was 0.95 (0.12 SD; N=52). This provides

possibly the first experimental evidence for the exact 4-electron stoichiometry in the reduction of oxygen at the cathode of the POS.

Supplement B: TIP2k in direct control mode

TIP2k-Manual: » MiPNet12.10 TIP2k-Manual

Fill the TIP2k syringes with freshly prepared dithionite

solution. After air calibration record the first point of the background experiment as described above.

Programming the TIP2k: Calculate the necessary injection volumes

as described in Section 2.5, initially assuming SF = 0.7 (stoichiometric correction factor for dithionite

concentration). SF can be calculated after the first injection and – if necessary – the TIP2k be

reprogrammed for subsequent injections. Alternatively, SF may be determined initially:

• Set the Volume, vinject, to 5 µL; • Test start before inserting the needles, to replace the

dithionite solution in the needles; • Wait for stabilisation of oxygen flux;

• Inject 5 µL and calculate SF using Eq.(1).

Example: Oxygen level in the chamber is 160 µM. The user wants

to obtain four background levels (in addition to the one

MiPNet14.06 Supplement: Instrumental O2 background S5

Oroboros Instruments High-resolution respirometry

recorded near air saturation). With four evenly spaced

steps it is possible to reach a minimum of 20 µM reducing the oxygen concentration by 35 µM steps. The necessary

injection volume, vinject, to achieve the desired reduction of oxygen concentration can then be calculated from

Eq.(2). In the present example:

SF = 0.7; ΔcO2 = 35 µM; Vchamber = 2 mL; cNa2S2O4 = 9.8 mM vinject = 10 µL

Four injections of 10 µL each should therefore bring the

oxygen concentration near the desired last level of 20 µM. Optionally, with a fifth injection, zero oxygen

concentration could be reached. It is recommended to use a larger excess volume for zero calibration.

Always consider the expected experimental oxygen concentration range: For an experiment at high oxygen

levels, calculate injection to decrease from the initial

oxygen level (e.g. 350 µM) to the final oxygen concentration (e.g. air saturation). The minimum time

required between injections to obtain stable fluxes is about 10 minutes. The time course of the instrumental

background should match the decline of oxygen concentration in the real experiment. Longer intervals

will typically be chosen (15 min in our example). The TIP2k can be set up in the following way:

Select Direct control and Vol+Flow

Delay [s] 0 Volume [µL] 10

Flow [µL/s] 30 Interval [s] 900

Cycles 4

Start the experiment with Start.

MiPNet14.06 Supplement: Instrumental O2 background S6

Oroboros Instruments Mitochondria and cell research

Supplement C: Further details

O2k-Manual

» MiPNet22.11 O2k-FluoRespirometer manual. » MiPNet12.10 Titration-Injection microPump. TIP2k user manual.

O2k-Procedures

» MiPNet06.03 O2k Quality Control 1: Polarographic oxygen sensors and

accuracy of calibration. » MiPNet08.09 HRFR with leukemia cells: respiratory control and coupling.

» http://wiki.oroboros.at/index.php/MiPNet10.04 » MiR05-Kit: http://wiki.oroboros.at/index.php/MiR05-Kit


Recommended