1 Operations Analysis Group Software for General Users M. Borland, OAG/AOD, August 24, 2004 OAG Tools for General Users A Contribution to the “Getting Started with EPICS” Lecture Series Michael Borland Operations Analysis Group APS Operations Division Argonne National Laboratory August 24, 2004 Operations Analysis Group Software for General Users M. Borland, OAG/AOD, August 24, 2004 Brief Introduction to OAG ● Group of accelerator physicists and programmers formed in 1995 to “apply the lessons of commissioning to accelerator operation.” ● We write high-level applications for physicists, engineers, and operators, e.g., – Automated startup and shutdown – Orbit correction and steering – Accelerator experiments ● We manage the accelerator data logging systems and configuration control systems. ● Much of the software we write is generic and can be used in any EPICS context. Operations Analysis Group Software for General Users M. Borland, OAG/AOD, August 24, 2004 Outline ● Brief introduction to Operations Analysis Group ● Intended audience ● What you'll learn ● How to access the software ● General features of OAG applications ● Accessing the accelerator data logs ● Performing data analysis ● Controlling things through EPICS ● Summary Operations Analysis Group Software for General Users M. Borland, OAG/AOD, August 24, 2004 Intended Audience ● We cater to a range of users – Programmers in a variety of languages – Those who want commandline tools – Those who want an easy-to-use graphical user interface (GUI) ● Today, we'll concentrate the last type. ● Underlying software is the same. ● Two later talks will concentrate on the details.
Transcript
1
Operations Analysis Group Software for General Users M. Borland, OAG/AOD, August 24, 2004
OAG Tools for General Users
A Contribution to the “Getting Started with EPICS” Lecture Series
Michael BorlandOperations Analysis GroupAPS Operations Division
Argonne National LaboratoryAugust 24, 2004
Operations Analysis Group Software for General Users M. Borland, OAG/AOD, August 24, 2004
Brief Introduction to OAG● Group of accelerator physicists and programmers formed in
1995 to “apply the lessons of commissioning to accelerator operation.”
● We write high-level applications for physicists, engineers, and operators, e.g.,
– Automated startup and shutdown
– Orbit correction and steering
– Accelerator experiments
● We manage the accelerator data logging systems and configuration control systems.
● Much of the software we write is generic and can be used in any EPICS context.
Operations Analysis Group Software for General Users M. Borland, OAG/AOD, August 24, 2004
Outline● Brief introduction to Operations Analysis Group
● Intended audience
● What you'll learn
● How to access the software
● General features of OAG applications
● Accessing the accelerator data logs
● Performing data analysis
● Controlling things through EPICS
● Summary
Operations Analysis Group Software for General Users M. Borland, OAG/AOD, August 24, 2004
Intended Audience
● We cater to a range of users
– Programmers in a variety of languages
– Those who want commandline tools
– Those who want an easy-to-use graphical user interface (GUI)
● Today, we'll concentrate the last type.
● Underlying software is the same.
● Two later talks will concentrate on the details.
2
Operations Analysis Group Software for General Users M. Borland, OAG/AOD, August 24, 2004
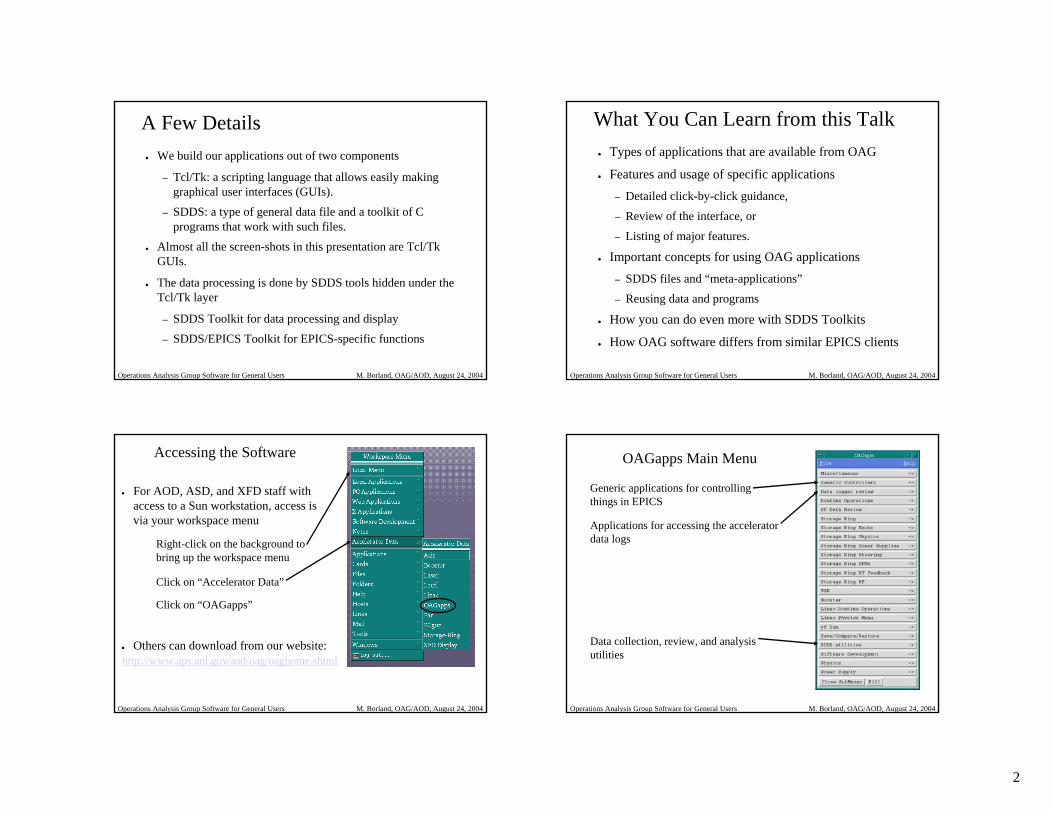
A Few Details● We build our applications out of two components
– Tcl/Tk: a scripting language that allows easily making graphical user interfaces (GUIs).
– SDDS: a type of general data file and a toolkit of C programs that work with such files.
● Almost all the screen-shots in this presentation are Tcl/Tk GUIs.
● The data processing is done by SDDS tools hidden under the Tcl/Tk layer
– SDDS Toolkit for data processing and display
– SDDS/EPICS Toolkit for EPICS-specific functions
Operations Analysis Group Software for General Users M. Borland, OAG/AOD, August 24, 2004
What You Can Learn from this Talk● Types of applications that are available from OAG
● Features and usage of specific applications– Detailed click-by-click guidance,
– Review of the interface, or
– Listing of major features.
● Important concepts for using OAG applications– SDDS files and “meta-applications”
– Reusing data and programs
● How you can do even more with SDDS Toolkits
● How OAG software differs from similar EPICS clients
Operations Analysis Group Software for General Users M. Borland, OAG/AOD, August 24, 2004
● For AOD, ASD, and XFD staff with access to a Sun workstation, access is via your workspace menu
Accessing the Software
Right-click on the background tobring up the workspace menu
Click on “Accelerator Data”
Click on “OAGapps”
http://www.aps.anl.gov/asd/oag/oaghome.shtml● Others can download from our website:
Operations Analysis Group Software for General Users M. Borland, OAG/AOD, August 24, 2004
OAGapps Main Menu
Generic applications for controllingthings in EPICS
Applications for accessing the acceleratordata logs
Data collection, review, and analysisutilities
3
Operations Analysis Group Software for General Users M. Borland, OAG/AOD, August 24, 2004
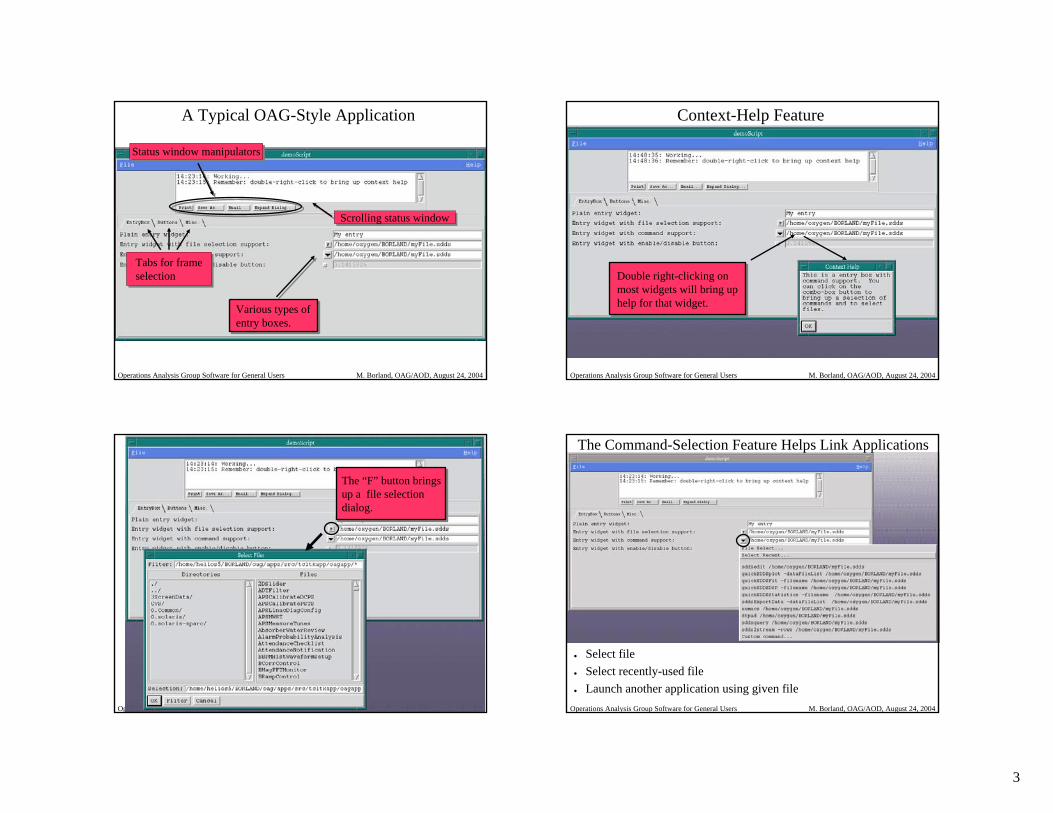
A Typical OAG-Style Application
Tabs for frameselectionTabs for frameselection
Scrolling status windowScrolling status window
Status window manipulatorsStatus window manipulators
Various types ofentry boxes.Various types ofentry boxes.
Operations Analysis Group Software for General Users M. Borland, OAG/AOD, August 24, 2004
Context-Help Feature
Double right-clicking on most widgets will bring uphelp for that widget.
Double right-clicking on most widgets will bring uphelp for that widget.
Operations Analysis Group Software for General Users M. Borland, OAG/AOD, August 24, 2004
The “F” button bringsup a file selectiondialog.
The “F” button bringsup a file selectiondialog.
Operations Analysis Group Software for General Users M. Borland, OAG/AOD, August 24, 2004
The Command-Selection Feature Helps Link Applications
● Select file● Select recently-used file● Launch another application using given file
4
Operations Analysis Group Software for General Users M. Borland, OAG/AOD, August 24, 2004
Why All the Files?
● OAG applications require input and output filenames as part of data processing
● Some feel this is inconvenient or even bad software design
● However, using files– Lets user name and identify data and results
– Creates open-ended “meta-applications” out of many small, simple applications
– Lets anyone add to the application suite
– Avoids getting trapped by software that doesn't do what you want
Operations Analysis Group Software for General Users M. Borland, OAG/AOD, August 24, 2004
Data LoggerReview SubMenu
Data LoggerReview SubMenu
Access archives of accelerator-related data
●Review alarm history
●Review signal values
●Review history of setpoint changes
●Review glitches
●Find process variables in the data loggers
Operations Analysis Group Software for General Users M. Borland, OAG/AOD, August 24, 2004
Alarm Logger Review
● The alarm logger review utility allows– Reviewing alarms by subsystem and time period
– Finding alarm times, severity, and status
– Viewing related information (e.g., status bits)
– Histogramming alarm density
– Look for overlapping alarms
● We monitor alarms on 14k process variables
● Private alarm logs also supported
Operations Analysis Group Software for General Users M. Borland, OAG/AOD, August 24, 2004
Alarm Logging or ALH?
● ALH (ALarm Handler) is a GUI for alerting operators to alarms
● ALH logs data, but– Must have GUI open
– Not space efficient
– No analysis tools● sddsalarmlog provides
– Background logging
– Space-efficient format
– Sophisticated analysis and review tools
You need both!You need both!
5
Operations Analysis Group Software for General Users M. Borland, OAG/AOD, August 24, 2004
Alarm LogReview
Application
Alarm LogReview
Application
Operations Analysis Group Software for General Users M. Borland, OAG/AOD, August 24, 2004
“Monitor Data Review” Application
System tabs
Data groupselection
Time-spanselection
Select pre-defined plots
Provides access to37k logged quantities.
Provides access to37k logged quantities.
ExportdataExportdata
Createcustom plotsCreatecustom plots
Operations Analysis Group Software for General Users M. Borland, OAG/AOD, August 24, 2004
Preset Plots Dialog
Button to actually make plot
Plot modifiers
Preset plot choices(select one or more)
For example, select“Zone Air Temperatures(sep plots)”
Operations Analysis Group Software for General Users M. Borland, OAG/AOD, August 24, 2004
A Typical “SDDS Plot”
X-windowsinterface by K. Evans.
X-windowsinterface by K. Evans.
6
Operations Analysis Group Software for General Users M. Borland, OAG/AOD, August 24, 2004
Web Access to AcceleratorData Logs
Web Access to AcceleratorData Logs
Operations Analysis Group Software for General Users M. Borland, OAG/AOD, August 24, 2004
Listing of datagroups same asin the Tcl/Tkapplication
Listing of datagroups same asin the Tcl/Tkapplication
Operations Analysis Group Software for General Users M. Borland, OAG/AOD, August 24, 2004
In this example, we selectsome process variables explicitly.
In this example, we selectsome process variables explicitly.
Operations Analysis Group Software for General Users M. Borland, OAG/AOD, August 24, 2004
Sample outputfrom web-based
data review
Sample outputfrom web-based
data review
7
Operations Analysis Group Software for General Users M. Borland, OAG/AOD, August 24, 2004
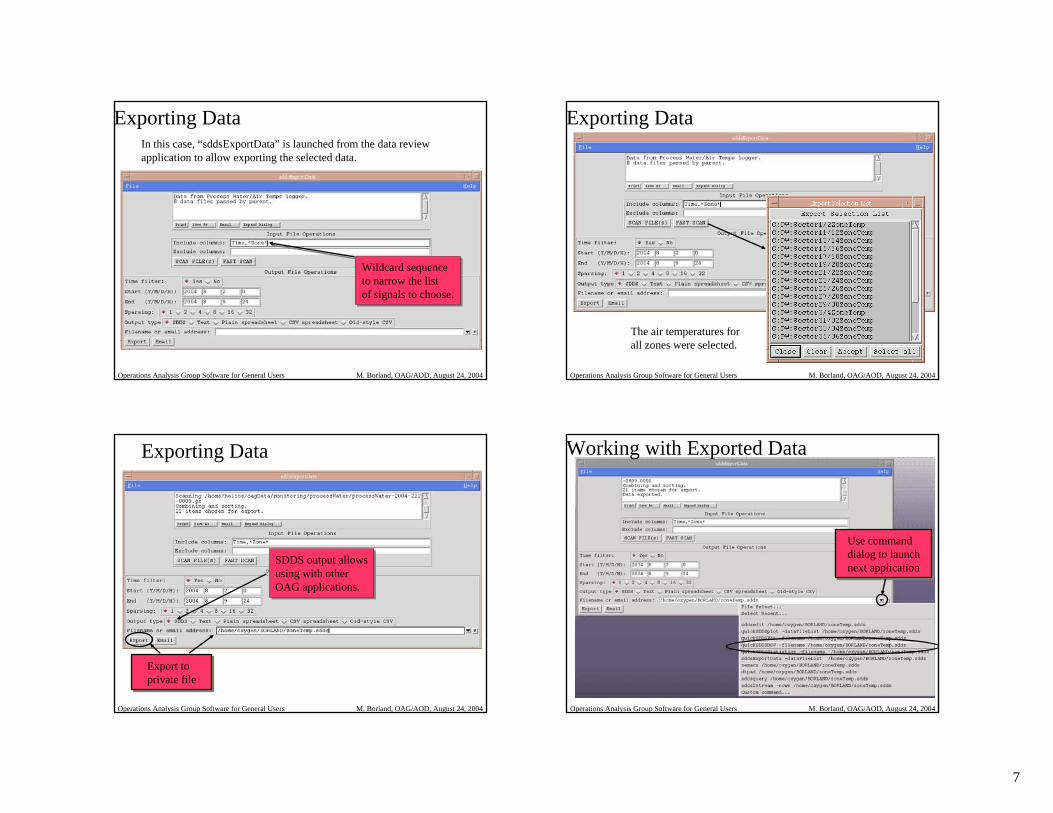
Exporting DataIn this case, “sddsExportData” is launched from the data reviewapplication to allow exporting the selected data.
Wildcard sequenceto narrow the listof signals to choose.
Wildcard sequenceto narrow the listof signals to choose.
Operations Analysis Group Software for General Users M. Borland, OAG/AOD, August 24, 2004
Exporting Data
The air temperatures for all zones were selected.
Operations Analysis Group Software for General Users M. Borland, OAG/AOD, August 24, 2004
Exporting Data
Export toprivate fileExport toprivate file
SDDS output allowsusing with otherOAG applications.
SDDS output allowsusing with otherOAG applications.
Operations Analysis Group Software for General Users M. Borland, OAG/AOD, August 24, 2004
Working with Exported Data
Use commanddialog to launchnext application
Use commanddialog to launchnext application
8
Operations Analysis Group Software for General Users M. Borland, OAG/AOD, August 24, 2004
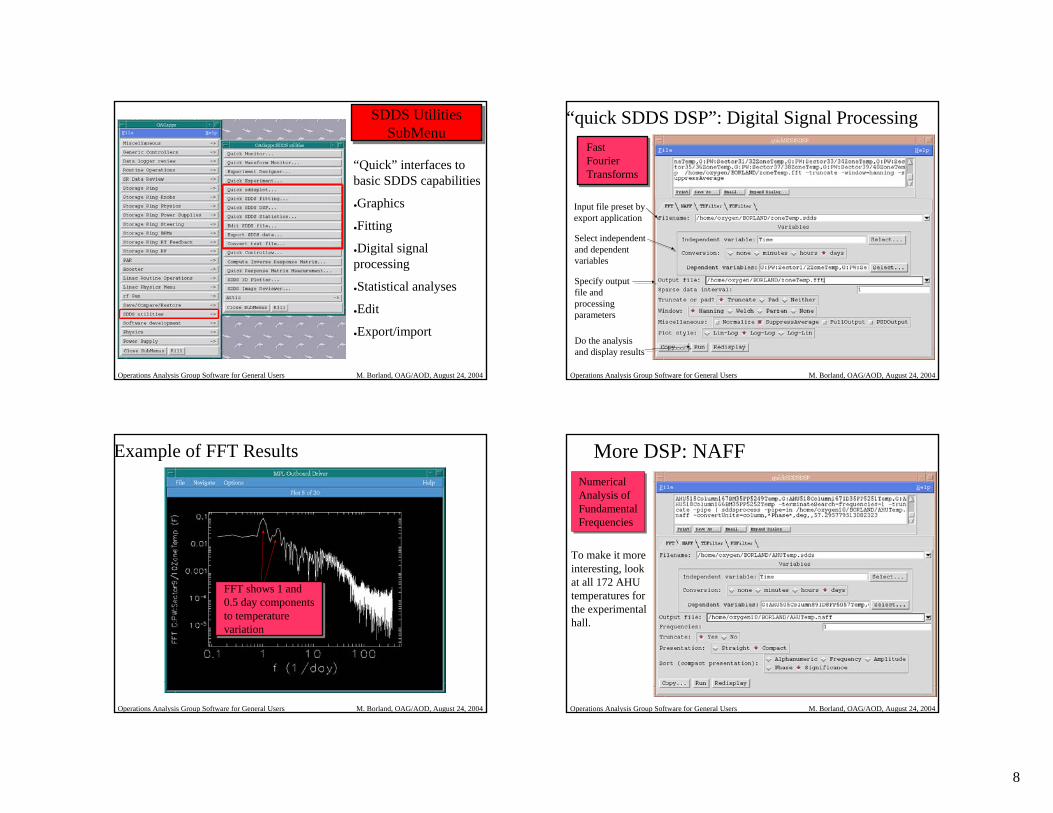
SDDS UtilitiesSubMenu
SDDS UtilitiesSubMenu
“Quick” interfaces to basic SDDS capabilities
●Graphics
●Fitting
●Digital signal processing
●Statistical analyses
●Edit
●Export/import
Operations Analysis Group Software for General Users M. Borland, OAG/AOD, August 24, 2004
“quick SDDS DSP”: Digital Signal ProcessingFastFourierTransforms
FastFourierTransforms
Input file preset by export application
Select independent and dependentvariables
Specify outputfile and processingparameters
Do the analysisand display results
Operations Analysis Group Software for General Users M. Borland, OAG/AOD, August 24, 2004
Example of FFT Results
FFT shows 1 and0.5 day componentsto temperaturevariation
FFT shows 1 and0.5 day componentsto temperaturevariation
Operations Analysis Group Software for General Users M. Borland, OAG/AOD, August 24, 2004
More DSP: NAFFNumericalAnalysis ofFundamentalFrequencies
NumericalAnalysis ofFundamentalFrequencies
To make it moreinteresting, look at all 172 AHU temperatures for the experimentalhall.
9
Operations Analysis Group Software for General Users M. Borland, OAG/AOD, August 24, 2004
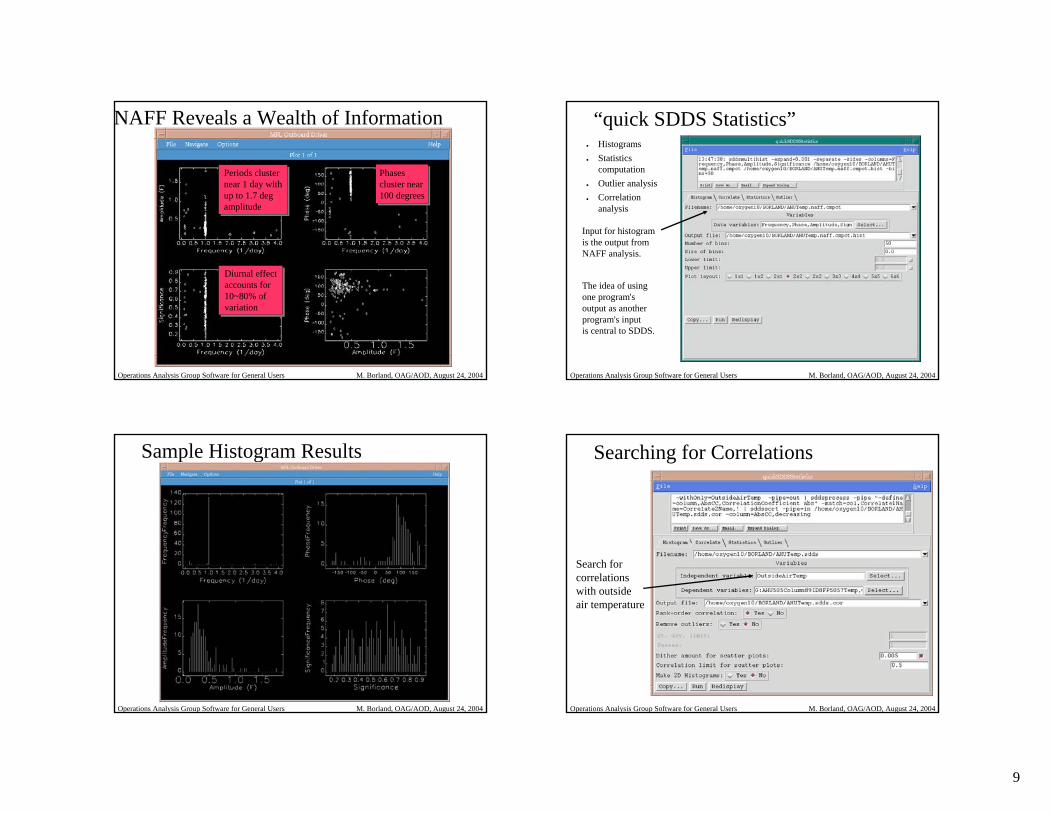
NAFF Reveals a Wealth of Information
Periods clusternear 1 day withup to 1.7 degamplitude
Periods clusternear 1 day withup to 1.7 degamplitude
Phasescluster near100 degrees
Phasescluster near100 degrees
Diurnal effectaccounts for10~80% ofvariation
Diurnal effectaccounts for10~80% ofvariation
Operations Analysis Group Software for General Users M. Borland, OAG/AOD, August 24, 2004
“quick SDDS Statistics”● Histograms● Statistics
computation● Outlier analysis● Correlation
analysis
Input for histogramis the output from NAFF analysis.
The idea of usingone program'soutput as anotherprogram's inputis central to SDDS.
Operations Analysis Group Software for General Users M. Borland, OAG/AOD, August 24, 2004
Sample Histogram Results
Operations Analysis Group Software for General Users M. Borland, OAG/AOD, August 24, 2004
Searching for Correlations
Search forcorrelationswith outsideair temperature
10
Operations Analysis Group Software for General Users M. Borland, OAG/AOD, August 24, 2004
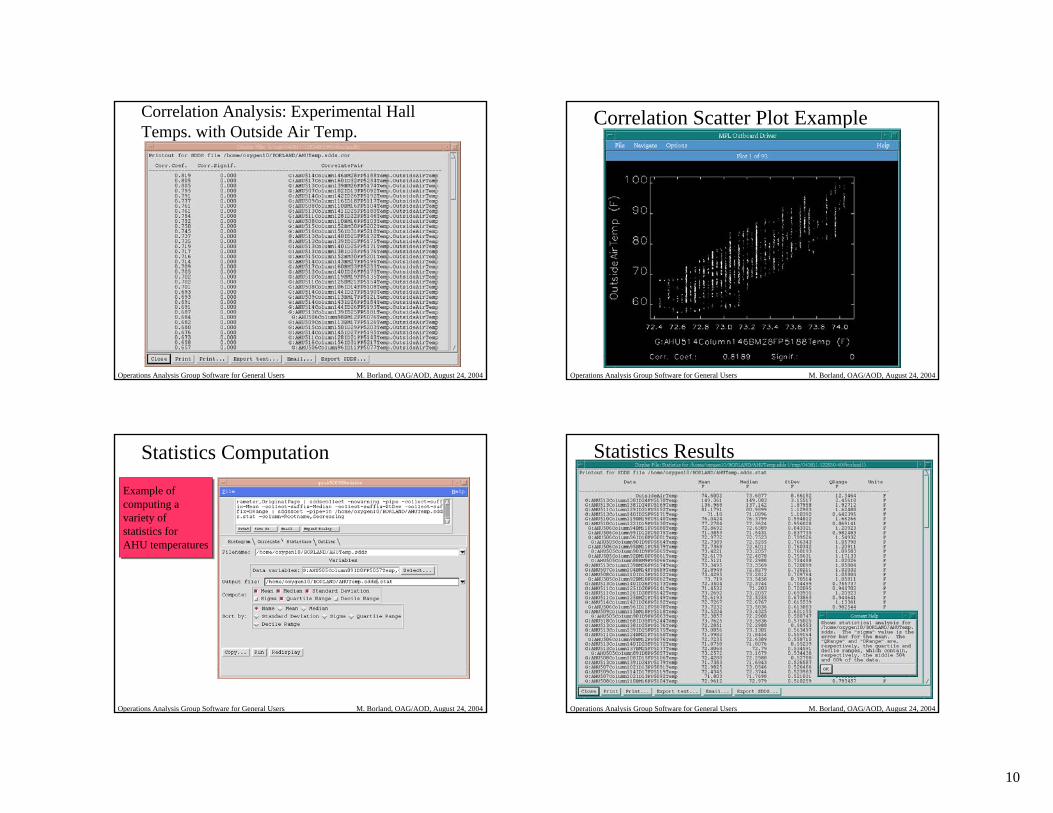
Correlation Analysis: Experimental Hall Temps. with Outside Air Temp.
Operations Analysis Group Software for General Users M. Borland, OAG/AOD, August 24, 2004
Correlation Scatter Plot Example
Operations Analysis Group Software for General Users M. Borland, OAG/AOD, August 24, 2004
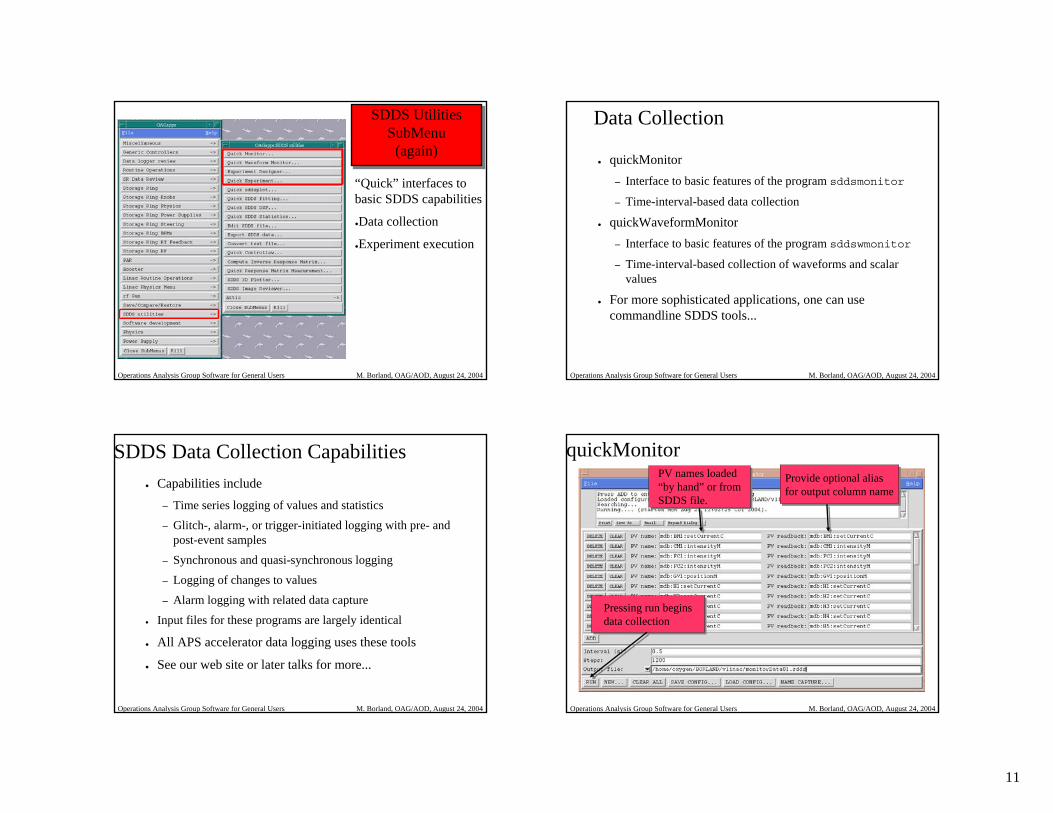
Statistics Computation
Example of computing a variety of statistics forAHU temperatures
Example of computing a variety of statistics forAHU temperatures
Operations Analysis Group Software for General Users M. Borland, OAG/AOD, August 24, 2004
Statistics Results
11
Operations Analysis Group Software for General Users M. Borland, OAG/AOD, August 24, 2004
SDDS UtilitiesSubMenu
(again)
SDDS UtilitiesSubMenu
(again)
“Quick” interfaces to basic SDDS capabilities
●Data collection
●Experiment execution
Operations Analysis Group Software for General Users M. Borland, OAG/AOD, August 24, 2004
Data Collection
● quickMonitor– Interface to basic features of the program sddsmonitor
– Time-interval-based data collection
● quickWaveformMonitor– Interface to basic features of the program sddswmonitor
– Time-interval-based collection of waveforms and scalar values
● For more sophisticated applications, one can use commandline SDDS tools...
Operations Analysis Group Software for General Users M. Borland, OAG/AOD, August 24, 2004
SDDS Data Collection Capabilities● Capabilities include
– Time series logging of values and statistics
– Glitch-, alarm-, or trigger-initiated logging with pre- and post-event samples
– Synchronous and quasi-synchronous logging
– Logging of changes to values
– Alarm logging with related data capture
● Input files for these programs are largely identical
● All APS accelerator data logging uses these tools
● See our web site or later talks for more...
Operations Analysis Group Software for General Users M. Borland, OAG/AOD, August 24, 2004
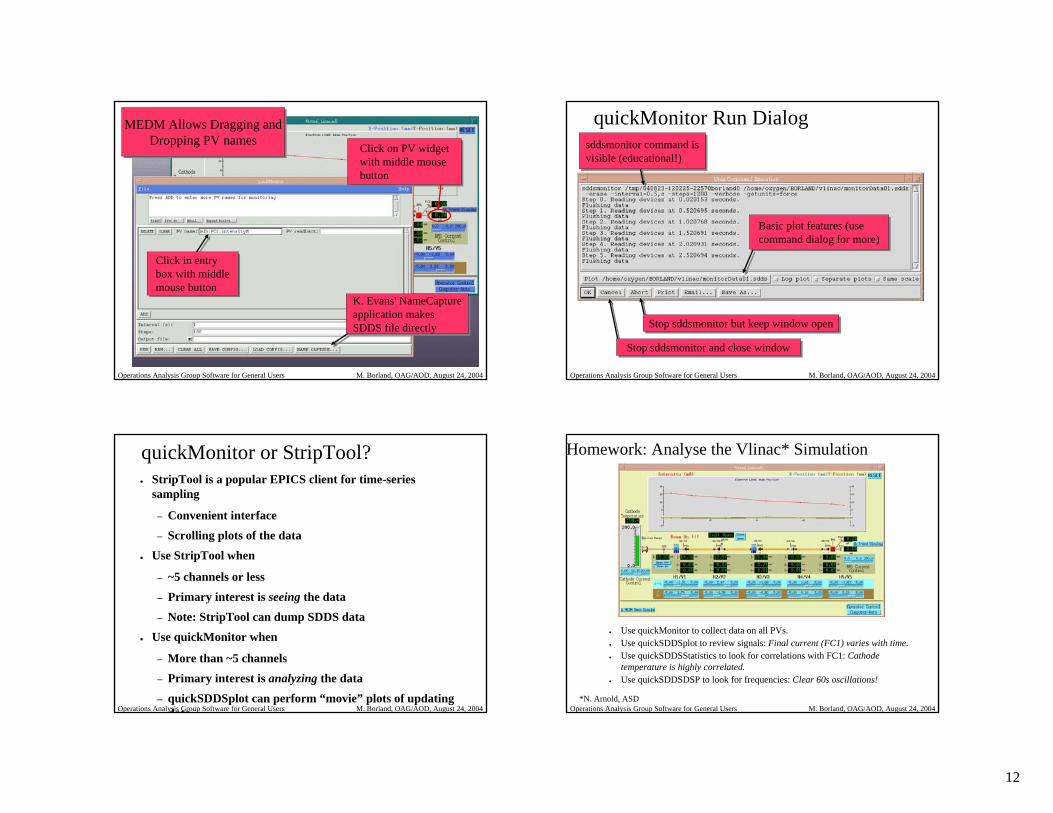
quickMonitor
Pressing run beginsdata collectionPressing run beginsdata collection
PV names loaded“by hand” or fromSDDS file.
PV names loaded“by hand” or fromSDDS file.
Provide optional aliasfor output column nameProvide optional aliasfor output column name
12
Operations Analysis Group Software for General Users M. Borland, OAG/AOD, August 24, 2004
MEDM Allows Dragging andDropping PV names
MEDM Allows Dragging andDropping PV names
Click on PV widget with middle mouse button
Click on PV widget with middle mouse button
Click in entrybox with middlemouse button
Click in entrybox with middlemouse button
K. Evans' NameCaptureapplication makesSDDS file directly
K. Evans' NameCaptureapplication makesSDDS file directly
Operations Analysis Group Software for General Users M. Borland, OAG/AOD, August 24, 2004
quickMonitor Run Dialogsddsmonitor command is visible (educational!)sddsmonitor command is visible (educational!)
Basic plot features (usecommand dialog for more)Basic plot features (usecommand dialog for more)
Stop sddsmonitor and close windowStop sddsmonitor and close window
Stop sddsmonitor but keep window openStop sddsmonitor but keep window open
Operations Analysis Group Software for General Users M. Borland, OAG/AOD, August 24, 2004
quickMonitor or StripTool?● StripTool is a popular EPICS client for time-series
sampling
– Convenient interface
– Scrolling plots of the data
● Use StripTool when
– ~5 channels or less
– Primary interest is seeing the data
– Note: StripTool can dump SDDS data
● Use quickMonitor when
– More than ~5 channels
– Primary interest is analyzing the data
– quickSDDSplot can perform “movie” plots of updating data Operations Analysis Group Software for General Users M. Borland, OAG/AOD, August 24, 2004
Homework: Analyse the Vlinac* Simulation
● Use quickMonitor to collect data on all PVs.● Use quickSDDSplot to review signals: Final current (FC1) varies with time.● Use quickSDDSStatistics to look for correlations with FC1: Cathode
temperature is highly correlated.● Use quickSDDSDSP to look for frequencies: Clear 60s oscillations!
*N. Arnold, ASD
13
Operations Analysis Group Software for General Users M. Borland, OAG/AOD, August 24, 2004
Experiment Execution:quickExperiment
● Limited interface to sddsexperiment
● Perform 1-D experiments with several (ganged) variables
● Measure any number of readbacks, with averaging and statistics
● sddsexperiment offers more
– N-dimensional experiments
– Verification of response of variables
– Test limits to ensure data quality
– Script execution
Operations Analysis Group Software for General Users M. Borland, OAG/AOD, August 24, 2004
Example with Vlinac
PV names loaded byhand or from SDDS file(compatible with quickMonitor)
PV names loaded byhand or from SDDS file(compatible with quickMonitor)
Operations Analysis Group Software for General Users M. Borland, OAG/AOD, August 24, 2004
Variables Tab
Operations Analysis Group Software for General Users M. Borland, OAG/AOD, August 24, 2004
Parameters Tab
Pressing run launchessddsexperiment in a run dialog (just likequickMonitor).
Pressing run launchessddsexperiment in a run dialog (just likequickMonitor).
14
Operations Analysis Group Software for General Users M. Borland, OAG/AOD, August 24, 2004
Use quickSDDSFit to Look at ResultsProvides polynomial,exponential,and gaussianfitting and display.
Operations Analysis Group Software for General Users M. Borland, OAG/AOD, August 24, 2004
Intensity Data Is Bi-Linear
Operations Analysis Group Software for General Users M. Borland, OAG/AOD, August 24, 2004
Linear Fit to One Side
Operations Analysis Group Software for General Users M. Borland, OAG/AOD, August 24, 2004
Experiment Execution:ExperimentDesigner
● Allows designing complex experiments that involve
– Initialization
– Execution sequence
● User interaction● Coordination of external programs and scripts
– Finalization
– Postprocessing
● Configurations can be saved and executed as a script with no interface
– Allows N-dimensional experiments
15
Operations Analysis Group Software for General Users M. Borland, OAG/AOD, August 24, 2004
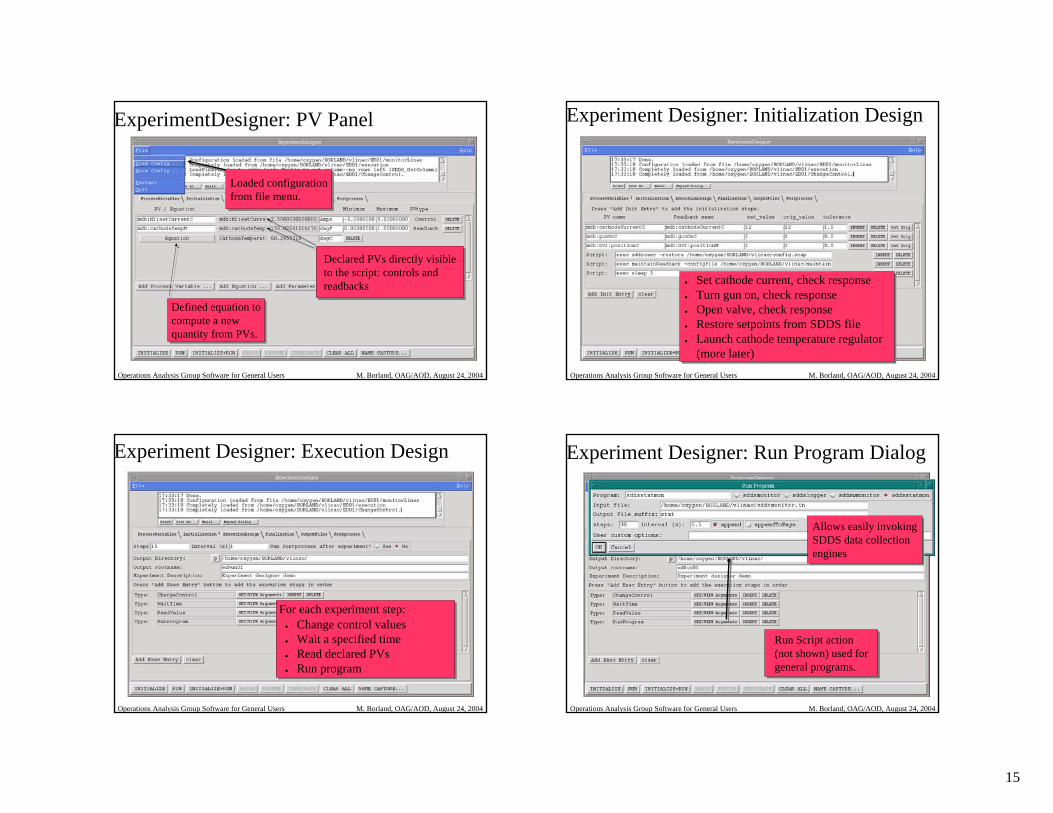
ExperimentDesigner: PV Panel
Declared PVs directly visibleto the script: controls andreadbacks
Declared PVs directly visibleto the script: controls andreadbacks
Defined equation tocompute a newquantity from PVs.
Defined equation tocompute a newquantity from PVs.
Operations Analysis Group Software for General Users M. Borland, OAG/AOD, August 24, 2004
Experiment Designer: Initialization Design
● Set cathode current, check response● Turn gun on, check response● Open valve, check response● Restore setpoints from SDDS file● Launch cathode temperature regulator
(more later)
Operations Analysis Group Software for General Users M. Borland, OAG/AOD, August 24, 2004
Experiment Designer: Execution Design
For each experiment step:● Change control values● Wait a specified time● Read declared PVs● Run program
Operations Analysis Group Software for General Users M. Borland, OAG/AOD, August 24, 2004
Experiment Designer: Run Program Dialog
Allows easily invokingSDDS data collectionengines
Allows easily invokingSDDS data collectionengines
Run Script action(not shown) used forgeneral programs.
Run Script action(not shown) used forgeneral programs.
16
Operations Analysis Group Software for General Users M. Borland, OAG/AOD, August 24, 2004
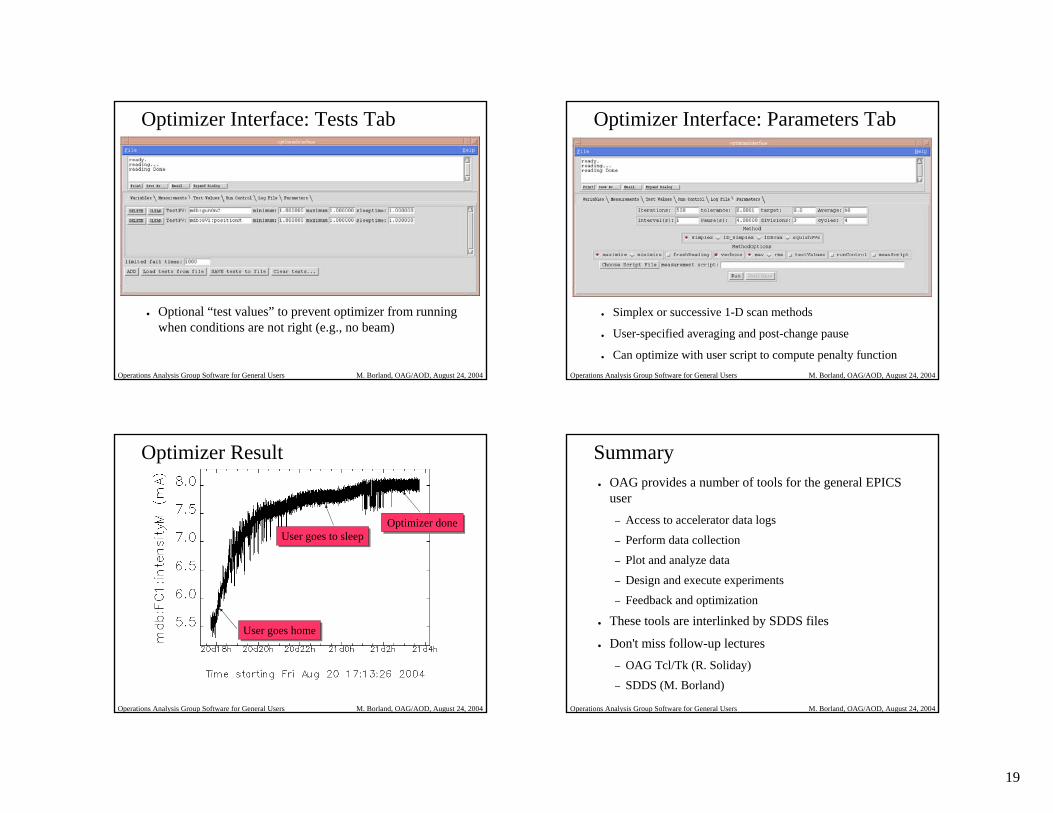
Experiment Designer: Output Files Tab
In this example, weselect quickSDDSplotto review the statisticalresults.
In this example, weselect quickSDDSplotto review the statisticalresults.
Operations Analysis Group Software for General Users M. Borland, OAG/AOD, August 24, 2004